
A Sebum-Mimetic Lipid Monolayer and Its Interaction with (Bio)Surfactants


Faculty of Chemistry, Warsaw University of Technology, 00-664 Warsaw, Poland
*
Author to whom correspondence should be addressed.
Colloids Interfaces 2022, 6(2), 37; https://0-doi-org.brum.beds.ac.uk/10.3390/colloids6020037
Submission received: 24 May 2022
/
Revised: 15 June 2022
/
Accepted: 15 June 2022
/
Published: 20 June 2022
(This article belongs to the Special Issue Biocolloids and Biointerfaces)
Abstract
:Surfactants present in cleansing formulations interact not only with the unwanted lipids accumulating on the human skin (dirt) but also with its protective lipidic layer (sebum). Development of simple models of human sebum would help to compare different surfactants and biosurfactants under the same conditions. In this contribution we propose a first monolayer model of synthetic sebum composed of lard, stearic acid, lanolin, squalane and cholesterol. The monolayer compression isotherm features a gas-liquid (G-LE1), two liquid-liquid transitions (LE1-LE2 and LE2-LC), and a collapse at πcoll = 45 mN/m. The monolayer spread on pure water and pre-compressed to π0 = 30 mN/m was exposed to four synthetic surfactants (sodium lauryl sulfate (SLS), sodium laureth sulfate (SLES), ammonium lauryl sulfate (ALS) and cocamidopropyl betaine (CAPB)) and four plant extracts (oat (Avena sativa L.), horse chestnut (Aesculus hippocastanum L.), cowherb (Vaccaria hispanica [P. Mill.] Rauschert), soybean (Glycine max L.) and soapwort (Saponaria officinalis L.)) introduced to the subphase at a dry mass content of 1% (w/w). Three modes of the monolayer-(bio)surfactant interactions were observed: (1) complete solubilization (SLS, SLES, ALS, CAPB); (2) penetration accompanied by an increase of surface pressure and elasticity but without solubilization (horse chestnut, cowherb, soapwort); (3) no interaction (oat, soybean).
1. Introduction
Sebum constitutes a non-aqueous part of the outermost liquid barrier of our body, separating it from the environment [1,2]. It is secreted from sebaceous glands located in our skin (except from the hands’ palms and feet’s soles) in the proximity of sweat glands. It is composed of glycerides (~50%), waxes (~20%), squalene (~10%), free fatty acids (~5%) as well as cholesterol (~1%) and its esters (~4%), and other minor components [3,4]. Together with sweat and other aqueous components of the Natural Moisturizing Factor (NMF), sebum forms a multicomponent emulsion protecting and moisturizing the epidermis. With time, this emulsion accommodates increasing amounts of the airborne dust, exfoliated dead skin cells (corneocytes) and extracellular lipid matrix, as well as microbial exudates, collectively called “dirt”. The unwanted dirt can be removed during body washing with help of one of the many available cleansing formulations. The latter typically comprise the sodium, lithium or ammonium salts of alkyl sulphates (ethoxylated or not; in the case of sodium salts commonly called “SLES” and “SLS”, respectively), often complemented with amphoteric (e.g., cocamidopropyl betaine, sodium cocoamphoacetate) or nonionic (alkyl polyglycosides, alkyl alcohols, etc.) surfactants. In particular, the SLS- and SLES-type anionic surfactants are known to be very efficient detergents, capable of removing all types of lipids. Unfortunately, at sufficiently high concentrations they remove not only the lipids associated with the unwanted dirt, but also those constituting the protective sebum. In fact, selective dirt removal (without affecting the sebum) is practically impossible and the use of efficient detergents also removes part of the skin’s natural protective barriers, exposing its deeper layers to potential toxins and allergens from the environment [5,6,7]. To minimize the damage while maintaining a maximum dirt removal efficacy, formulators often replace part of the ionic surfactants with less aggressive ones (e.g., by admixing the amphoteric cocamidopropyl betaine with the anionic SLS/SLES). An alternative solution consists of searching for natural-derived or natural surfactants with the hope of finding more sustainable and biocompatible replacements of the fully-synthetic counterparts [8,9,10,11,12]. Among the natural surfactants (biosurfactants), those of plant origin seem to be especially promising because of relatively easy purification and little consumer concern (much lower than, e.g., for biosurfactants from microbial origin). One of the most abundant groups of plant biosurfactants are glycosides belonging to triterpenoid or steroid saponins. Their molecules consist of non-polar aglycon (triterpenoid or steroid) and polar glycon (sugar) parts, providing the amphiphilicity required for the surface activity. Saponins can be found in about 500 plant species, both edible and non-edible (soybean, quinoa, oat, pea, tea, beetroot, soapwort, alfalfa, horse chestnut, licorice or ginseng, to name just a few) [13,14,15].
A natural origin of biosurfactants does not automatically imply, however, their lower solubilization potential towards the natural lipids (sebum) of human skin. For this reason it is important to develop reliable systems allowing for comparison of the effect of different surfactants on the sebum layer under controlled and reproducible conditions. Experiments on living organisms that would be ideal for such purposes must be replaced with in-vitro methods using model systems, for ethical and legislative reasons. Due to large variability of human sebum composition, synthetic mixtures are often employed in laboratory studies [16]. For example, Wertz proposed a mixture of 12.4% squalene, 25% jojoba oil, 44.6% triolein, 17% oleic acid and 1% DL-α-tocopherol [17]. This composition has been used by many other authors [18,19] and is commercially available. A model developed by Procter and Gamble is a blend of the coconut, olive, cottonseed and paraffin oils (15% of each), oleic acid (15%), myristic, palmitic and stearic acids (5% of each), cholesterol (5%) and squalene (5%) [20]. Musiał et al. proposed a mixture based on pork lard (34%) as a source of triglycerides, stearic acid (24%) as a representative free fatty acids, and lanolin (26%) as a model wax, in addition to squalene (12%) and cholesterol (4%) [21]. Bujak et al. employed a simplified sebum model, consisting of stearic acid (91%) and cholesterol or its mixture with ceramides (9%) [22,23]. To the best of our knowledge, all previous reports on sebum-surfactant interactions used bulk methods, mostly based on quantifying the amount of solubilized lipids. The bulk approach, however, neglects the interfacial aspects of sebum-surfactant interactions; hence, there is a need to develop models allowing for such studies.
In our previous reports we have compared synthetic and natural surfactants extracted from plants in terms of their effect on cell cultures of keratinocytes [24,25]. We have also attempted to correlate the keratinocytes’ cytotoxicity with two assays used to quantify the protein (zein test) and lipid (oil emulsification test) solubilization potential [25]. In this contribution we describe a successful development of a first model sebum-mimicking lipid monolayer and its characterization in the presence of nine model (bio)surfactants: four synthetic low-molecular weight surfactants and five plant extracts. The use of the monolayer model allowed for gathering additional information on the mechanism of interfacial interactions between the model sebum and (bio)surfactants.
2. Results
2.1. Synthetic Sebum Monolayer Characterization
A synthetic sebum was prepared by heating and mixing the lard, stearic acid, lanolin, squalane and cholesterol in the proportions depicted in Table 1, corresponding to the real sebum composition of fatty acids triglycerides, free fatty acids, waxes, squalene and cholesterol, respectively. The homogeneous lipid mixture obtained by filtering followed by cooling down to room temperature was dissolved in a chloroform/methanol mixture and deposited on the surface of water (subphase). The monolayer was first characterized by registering its compression isotherm (Figure 1). Microphotographs from a fluorescence microscope (Figure 2) were collected at surface pressure values marked with arrows in Figure 1. The inset of Figure 1 shows the compression modulus, Cs−1, obtained from the isotherm using Equation (1). The compression modulus carries important information on mechanical properties of the monolayer, similarly to the surface compression elasticity, E’, discussed in Section 2.2 below (note the same definition of E’ and Cs−1). The only difference between the two parameters is the rate and direction of the monolayer dilation (oscillatory movement with f = 0.1 Hz and relative amplitude of 2% for E’, and linear movement with the rate of 7 mm/min for Cs−1). Cs−1, being registered under conditions closer to equilibrium, is especially helpful to identify the monolayer compression state: gaseous, G (Cs−1 < 12.5 mN/m), liquid expanded, LE (12.5 mN/m < Cs−1 < 50 mN/m), liquid condensed, LC (50 mN/m < Cs−1 < 250 mN/m and solid, S (Cs−1 > 250 mN/m) [26,27,28].
In the first stage of compression, a phase transition from gaseous (G) to liquid expanded (LE1) state takes place at π = 9 mN/m, where the compression modulus, Cs−1 reaches 42 mN/m. The appearance of the LE phase can be seen in Figure 2A, recorded at π = 9 mN/m. A similar phase transition takes place around π = 13 mN/m with Cs−1 slightly smaller than the value observed for the LE1 phase (21 mN/m), suggesting that the new phase is also liquid expanded (LE1-LE2 transition, see Figure 2B). Further compression clearly rigidifies the monolayer which is manifested by significant reduction of surface flows observed under the microscope (not shown) and giving rise to a strip pattern featured in Figure 2C,D. The phase transition around π = 22 mN/m can be assigned as LE2-LC with Cs−1 steeply increasing up to 90 mN/m (at π = 37 mN/m). The strip pattern with lighter LE2 phase and darker (LC) phase dominates the microscopic monolayer morphology (Figure 2E,F) up to πcoll = 45 mN/m, where the monolayer collapses.
To gather more information on the synthetic sebum monolayer, the effect of temperature on its compression isotherm was studied in the temperature range 10–40 °C (Figure 3). Up to the temperature of 25 °C, the two LE phases can still be distinguished, but at higher temperatures the LE1-LE2 transition disappears. Increasing the temperature also widens the LE range, shifting the LE-LC transition towards lower surface area values. Increasing the temperature facilitates the monolayer collapse: between 10 and 40 °C the collapse pressure, πcoll, drops from 47.6 mN/m to 40.6 mN/m (Figure 3).
The monolayer stability in different phase states was probed by recording the monolayer compression-decompression cycles (surface pressure isotherm hysteresis). Below the first transition (G-LE1), no hysteresis could be observed at all. Only above π = 10 mN/m can any observable difference between the compression and expansion π(A) curves be noticed. The gap increases only slightly with increasing the maximum surface pressure up to ~40 mN/m, indicating that even in the LC state the synthetic sebum monolayer remains relatively stable as long as π < πcoll. As expected, compression above πcoll (50 mN/m) clearly destroys the monolayer integrity resulting in large hysteresis (Figure 4).
2.2. Effect of Surfactants on the Synthetic Sebum Monolayers
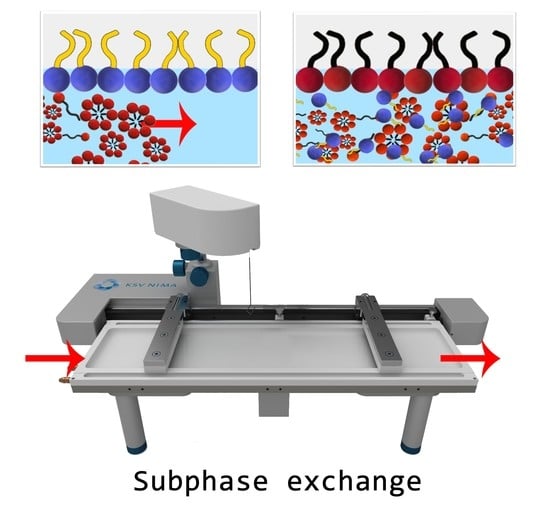
Having characterized the new synthetic sebum monolayer, we proceeded with analyzing its behavior in presence of model synthetic surfactants and surface active plant extracts. For this purpose, the synthetic sebum monolayer was first deposited on a surface of Milli-Q water and compressed to π0 = 30 mN/m. Subsequently, the aqueous subphase was continuously exchanged for the respective (bio)surfactant solution to reach the final concentration of 1% in the subphase, which corresponds to a typical concentration range of surfactants on skin during body washing. The monolayer relaxation was followed during 100 min by monitoring π(t). The surface compression elasticity, E’, of the (bio)surfactant-equilibrated monolayer was probed subsequently. A common reference experiment for all (bio)surfactants consisted of the monolayer relaxation on the aqueous subphase pumped through the Langmuir trough under the same hydrodynamic conditions for 100 min, which resulted in π100 = 26.3 ± 1.7 mN/m and E’ = 113 ± 4 mN/m. The slight decay of surface pressure is consistent with the hysteresis gap seen in Figure 4, confirming that a small part of the monolayer is indeed lost due to compression. Interestingly, the surface compression elasticity obtained from the oscillatory experiments (E’) is much higher than the quasi-equilibrium value obtained from the monolayer compression isotherm (Cs−1 = 30 mN/m at π = 30 mN/m, see Figure 1). The difference stems probably from different timescales of both measurements—in the oscillatory experiment the monolayer undergoes compression-decompression cycles with a barrier movement rate varying between 0 and 23 mm/min. Consequently, it behaves more like a rigid body, in contrast to the quasi-equilibrium experiments, where the monolayer components still have enough time to follow the barrier movement (7 mm/min), resulting in much lower surface elasticity.
2.2.1. Synthetic Surfactants
All four synthetic surfactants circulating in the subphase at 1% raised surface pressure by Δπ100 between 13 and 15 mN/m above the initial value (Figure 5a). This increase is consistent with their intrinsic surface activity—note that the π100 values in the presence (“sebum + biosurfactant”) and absence (“bare surfactant”) of the sebum monolayer practically coincide in all cases. This suggests that the initial synthetic sebum monolayer may be simply replaced by the adsorbed surfactant layers. Such a hypothesis is supported also by the similarity of the elastic modulus between the surfactant-penetrated sebum monolayers and the adsorbed layers of these surfactants in the absence of the monolayer (“bare surfactant”). All corresponding E’ values from Figure 5b are similar and much lower than for the original synthetic sebum monolayer on pure water (E’ = 113 mN/m), confirming that the original highly elastic network of sebum lipids was indeed destroyed by the synthetic surfactants at 1% d.m. For the three anionic surfactants (SLS, ALS, SLES), the penetrated-layer elasticity remained slightly above that of the Gibbs layers (yet always <17 mN/m); in the case of CAPB, E’ dropped even below that for bare CAPB adsorbed layer (E’ = 19 mN/m for the bare surfactant layer and 4 mN/m for the CAPB-penetrated sebum monolayer).
2.2.2. Plant Extracts
For the investigated plant extracts with the same dry mass content (1%), the surface pressure after 100 min, π100, varies between 27 mN/m and 37 mN/m (Figure 6a). The increase of surface pressure with respect to the bare monolayer on water (0 < Δπ100 < 8 mN/m) is thus lower than for the synthetic surfactant solutions, with the highest increase for the cowherb and soapwort, and almost no change for the oat and soybean extracts (Figure 6a). The π100 values in the presence of the monolayer are, however, significantly higher than for the corresponding Gibbs layers (in the absence of the monolayer, “bare biosurfactant”), pointing to an important difference between the plant extracts and the synthetic surfactants. The observed increase of surface pressure cannot be thus caused by the complete replacement of the monolayer lipids with the surface active components of the extracts, which are only capable of increasing π100 to 12–22 mN/m.
The lack of changes in π100 after contact with the oat and soybean extracts (with respect to pure water) may suggest no interaction at all between components of these extracts and the sebum lipids. This hypothesis is supported by the lack of changes in surface elastic modulus, E’, of the sebum monolayer after contact with these extracts. On the other hand, for the remaining ones, E’ of the extract-penetrated monolayer is always higher than that of the same extract’s bare layer and of the bare sebum monolayer on water. An especially impressive increase of the extract-penetrated monolayer elasticity was observed for the horse chestnut (increase by 273 mN/m with respect to the unpenetrated monolayer and by 374 mN/m with respect to the bare extract in the absence of lipids). Only in the case of cowherb, the surface elasticity remained the same as for the bare biosurfactant, but this may be related to the already high E’ value of the latter (E’ = 206 mN/m). However, if the value for the extract-penetrated monolayer (E’ = 215 mN/m) is compared with that of the bare monolayer on water (E’ = 113 mN/m), the effect of cowherb is evident.
3. Discussion
The model sebum prepared from easily available lipids (lard, stearic acid, lanolin, squalane and cholesterol) was shown to form a monolayer with G-LE1, LE1-LE2 and LE2-LC transitions and little hysteresis up to the collapse surface pressure, πcoll = 45 mN/m. The model monolayer is suitable for testing the effect of surfactants and other relevant components introduced into the subphase. In this contribution we described the effect of four synthetic surfactants and five plant extracts displaying reasonable surface activity. Depending on the type of (bio)surfactant introduced to the subphase, three types of responses of the synthetic sebum monolayers could be observed. The monolayers penetrated by the synthetic low-molecular weight surfactants (SLS, ALS, SLES, CAPB) undergo solubilization, as evidenced by the proximity of both π100 and E’ values for the bare surfactants (Gibbs) adsorbed layers and the surfactant-penetrated sebum monolayers. This is consistent with the known detergent activity of these ingredients, successfully employed in harsh washing/cleansing formulations [5,29,30]. Similar observations were reported for other lipid mixtures [31,32] or protein monolayers [33,34]. Despite the clear proof of the monolayer solubilization, the present data do not allow for any discussion of its detailed mechanism. Nevertheless, some similarities with the “orogenic” displacement of proteins by low-molecular weight surfactants can be noticed [35]. Whatever the mechanism of lipid solubilization, the aqueous-air interface behaves as if it consisted predominantly of the adsorbed surfactant layers. Therefore, one may speculate that the real sebum layers exposed to even low concentrations of these surfactants (1% d.m.) could also undergo extensive solubilization, together with the unwanted lipids of the dirt. In this context, the especially high reduction of E’ observed for CAPB may seem to contradict the common opinions stating that cosmetic formulations where part of the anionic surfactants (SLS, ALS, SLES) is replaced with CAPB should be milder to skin [3,36]. It should be stressed that the employed surfactant concentration (1%) for all synthetic surfactants exceeded the CMC values, which increase in the order CAPB < SLES < ALS ≈ SLS. Although lower CMC values are often associated with reduced skin irritation potential, in the present model system the most pronounced monolayer disruption was observed for the surfactant with the lowest CMC (CAPB). This confirms that skin irritation is a complex process, not solely determined by a monomolecular lipid layer solubilization.
The opposite is observed when the subphase contains weakly surface-active plant extracts not capable of penetrating the lipid monolayer. The oat and soybean extracts, although slightly surface active on their own (π100 = 12 and 13 mN/m, E’ = 26 and 41 mN/m, respectively), do not seem to be able to penetrate the synthetic sebum layer, as evidenced by the lack of changes in π100 and E’ (with respect to the bare monolayer on water). These extracts seem to be unable to remove, or even to penetrate, the model sebum monolayer. As such, they could be considered as potentially neutral to the real sebum layers, although their dirt removal capacity is also weak.
Finally, the three more surface active plant extracts: cowherb, soapwort and horse chestnut can be considered an intermediate case—they are capable of penetrating the model sebum monolayer but without solubilizing it. Even though their intrinsic surface activity is only slightly higher than that of the oat and soybean extracts (π100 = 22, 17 and 12 mN/m, E’ = 206, 128 and 14 mN/m, for the cowherb, soapwort and horse chestnut respectively), they clearly increase surface pressure of the sebum monolayers pre-compressed initially to π0 = 30 mN/m. In contrast to the synthetic surfactants, the final surface pressure values exceed those of the bare extracts, pointing to an increased crowding in the penetrated monolayers. Surprisingly, the extra components entering the monolayer do not break the existing interfacial network, but even enhance it (increase of E’), especially for the horse chestnut (E’ = 386 mN/m). The latter case is even more interesting given the fact that on its own (in the absence of monolayer) the adsorbed layer is very weakly interconnected, resulting in low surface compression elasticity (E’ = 14 mN/m). We believe this unusual effect might be at the origin of the known biological activity of the horse chestnut extracts, which is often linked with the presence of triterpenoid saponins known as escin [37,38]. The high affinity of escin to lipid membranes has been extensively investigated, especially by the group of Hellweg [39,40,41], who discovered a very rich phase behavior of escin-lipid mixtures. A similar link between the increase of surface pressure/compression elasticity of lipid monolayers and biological activity may probably exist in the case of cowherb and soapwort, both also widely used in herbal medicine. From this perspective, the three plant extracts may be considered as potential candidates e.g., for transdermal delivery, allowing for transport of biologically active/nutritive components through the sebum layers, without their removal.
4. Materials and Methods
The details of the origin of the lipid components used to prepare a synthetic sebum and of the employed plant material: the seeds of oat (Avena sativa L.), horse chestnut (Aesculus hippocastanum L.), cowherb (Vaccaria hispanica [P. Mill.] Rauschert) and soybean (Glycine max L.), and the roots of soapwort (Saponaria officinalis L.) are provided in Tables S1 and S2 (Supplementary Materials). The aqueous extracts were prepared by 15-min decoction (cowherb and soapwort) or by maceration (horse chestnut, oat and soybean) at room temperature for 12 h, in Milli-Q water (Merck Millipore, Burlington, MA, USA). The extracts were then filtered and spray-dried, as described in ref. [42,43]. The dried extracts were stored at room temperature. Immediately before starting the measurements they were dissolved in Milli-Q water to achieve the concentration of 2.5% (w/w) of the dry mass of the extract, which after dilution with the water from the trough during the subphase exchange, produced the final concentration of 1%. Synthetic surfactants: sodium lauryl sulfate (SLS), sodium laureth sulfate (SLES), ammonium lauryl sulfate (ALS) and cocamidopropyl betaine (CAPB) were kindly provided by PCC Exol (Brzeg Dolny, Poland). Their aqueous solutions were prepared analogously to those of the plant extracts, in such a way as to produce the required final dry mass content of 1%.
The model sebum lipid mixture (see Table 1 for its composition) for monolayer deposition was dissolved in chloroform (purity ≥ 99.8%) and methanol (purity ≥ 99.9%), 9:1 vol/vol, purchased from Sigma-Aldrich (St. Louis, MO, USA) and used without any further purification. The total lipids concentration of 24.4 mg/mL and 1.5 mg/mL were employed for the surface pressure relaxation, π(t), and isotherms (π(A)), respectively. The average molecular weight of the synthetic sebum was estimated as 429 g/mol using the values from Table S1 (Supplementary Materials). In experiments with microscopic observations of the monolayer morphology, the lipid mixture was spiked with a fluorescently labeled phospholipid TopFluor PC (0.5% mol/mol). Milli-Q water Merck Millipore, Burlington, MA, USA) was used to prepare all solutions. All glassware was cleaned with Hellmanex II solution (Hellma GmbH & Co. KG, Müllheim, Germany) and acetone prior to rinsing with Milli-Q water.
The surface pressure isotherms (π(A)) and relaxation curves after a quick compression, π(t), for the monolayer on pure water and on the (bio)surfactants solutions were recorded using a home-built Langmuir trough equipped with a Wilhelmy plate made of filter paper (ashless Whatman 1 CHR, 10 mm width) connected to an electrobalance (KSV, Espoo, Finland). The subphase temperature (typically 21 °C) was controlled by means of a thermostat. When different temperatures (10–40 °C) were employed, the trough was equilibrated at the given temperature for at least 2 h and the subphase temperature was controlled before and after the experiment. An OLYMPUS BX51WI (Tokyo, Japan) epifluorescence microscope with U-MWB2 mirror unit (excitation filter: 460–490 nm; dichromatic mirror: 500 nm) was used for monolayer visualization. The experimental details are given in [44]. Briefly, the trough with a total area of 194.25 cm2 (7 cm × 25 cm effective compressible area (W × L)) and the volume of 150 cm3, equipped with two connection ports for the subphase exchange with minimum distortion of the monolayer, was used. The appropriate lipid mixture in 9:1 chloroform/methanol mixture was deposited onto a Milli-Q water subphase with a Hamilton micro syringe, and left for evaporation for 15 min. Next, either surface pressure compression or subphase exchange experiments were performed.
In the surface pressure isotherm experiments, the monolayer was compressed by movable barriers and the surface pressure values were recorded during compression up to the monolayer collapse. In some experiments, where the monolayer was doped with the fluorescently labeled dye, the fluorescence microphotographs were registered during compression. In surface pressure isotherm hysteresis experiments, the compression was stopped at the chosen values of surface pressure and the barrier movement was reversed back towards their initial positions, while still recording surface pressure values. Every isotherm and hysteresis loop was recorded on a fresh monolayer and repeated at least in triplicate.
In the subphase exchange experiments the monolayer was first compressed to π0 = 30 mN/m at the rate of 7 mm/min and the subphase exchange procedure was initiated. For this purpose, a peristaltic pump with a flow rate of 9 mL/min was used. The surface pressure was monitored for 100 min. The experiments with the respective Gibbs layers (without the lipid monolayer) were performed analogously, omitting the monolayer deposition and compression steps. At the end of each monolayer relaxation measurement, the surface compression (dilational) response of the monolayer was probed by performing oscillatory movements of the barriers. The frequency of 0.1 Hz and the relative amplitude of 2% were used. The surface compression (dilational) modulus, E, of the monolayer is defined as:
where A is the mean molecular area at a given surface pressure, π.
The same equation was used to calculate the compression modulus (Cs−1) from the compression isotherm (π(A)) under quasi-static conditions.
Supplementary Materials
The following supporting information can be downloaded at: https://0-www-mdpi-com.brum.beds.ac.uk/article/10.3390/colloids6020037/s1, Table S1. Details of the origin and composition of lipids used for preparation of the synthetic sebum; Table S2. Details of the origin of the herbal material used in the study.
Author Contributions
Conceptualization, I.J. and K.W.; methodology, I.J.; writing—original draft preparation, K.W.; writing—review and editing, I.J. and K.W. All authors have read and agreed to the published version of the manuscript.
Funding
This research was funded by the Warsaw University of Technology.
Institutional Review Board Statement
Not applicable.
Informed Consent Statement
Not applicable.
Data Availability Statement
Data available from the authors upon request.
Conflicts of Interest
The authors declare no conflict of interest. The funders had no role in the design of the study; in the collection, analyses, or interpretation of data; in the writing of the manuscript, or in the decision to publish the results.
Sample Availability
Samples of the compounds are available from the authors.
References
- Antunes, E.; Cavaco-Paulo, A. Stratum corneum lipid matrix with unusual packing: A molecular dynamics study. Colloids Surf. B Biointerfaces 2020, 190, 110928. [Google Scholar] [CrossRef] [PubMed] [Green Version]
- Peterson, G.; Rapaka, S.; Koski, N.; Kearney, M.; Ortblad, K.; Tadlock, L. A robust sebum, oil, and particulate pollution model for assessing cleansing efficacy of human skin. Int. J. Cosmet. Sci. 2017, 39, 351–354. [Google Scholar] [CrossRef] [PubMed] [Green Version]
- Seweryn, A. Interactions between surfactants and the skin—Theory and practice. Adv. Colloid Interface Sci. 2018, 256, 242–255. [Google Scholar] [CrossRef] [PubMed]
- Mackenna, R.M.B.; Wheatley, V.R.; Wormall, A. The Composition of the Surface Skin Fat (‘Sebum’) from the Human Forearm. J. Investig. Dermatol. 1949, 15, 33–47. [Google Scholar] [CrossRef] [Green Version]
- Ananthapadmanabhan, K.P.; Moore, D.J.; Subramanyan, K.; Misra, M.; Meyer, F. Cleansing without compromise: The impact of cleansers on the skin barrier and the technology of mild cleansing. Dermatol. Ther. 2004, 17, 16–25. [Google Scholar] [CrossRef]
- Draelos, Z.D. The science behind skin care: Cleansers. J. Cosmet. Dermatol. 2018, 17, 8–14. [Google Scholar] [CrossRef]
- Yokoi, A.; Endo, K.; Ozawa, T.; Miyaki, M.; Matsuo, K.; Nozawa, K.; Manabe, M.; Takagi, Y. A cleanser based on sodium laureth carboxylate and alkyl carboxylates washes facial sebum well but does not induce dry skin. J. Cosmet. Dermatol. 2014, 13, 245–252. [Google Scholar] [CrossRef]
- Gour, V.S.; Sanadhya, N.; Sharma, P.; Parmar, A.; Datta, M. Biosurfactant characterization and its potential to remove sebum from hair. Ind. Crops Prod. 2015, 69, 462–465. [Google Scholar] [CrossRef]
- Rincón-Fontán, M.; Rodríguez-López, L.; Vecino, X.; Cruz, J.M.; Moldes, A.B. Novel Multifunctional Biosurfactant Obtained from Corn as a Stabilizing Agent for Antidandruff Formulations Based on Zn Pyrithione Powder. ACS Omega 2020, 5, 5704–5712. [Google Scholar] [CrossRef]
- Bezerra, K.G.O.; Rufino, R.D.; Luna, J.M.; Sarubbo, L.A. Saponins and microbial biosurfactants: Potential raw materials for the formulation of cosmetics. Biotechnol. Prog. 2018, 34, 1482–1493. [Google Scholar] [CrossRef]
- Vecino, X.; Cruz, J.M.; Moldes, A.B.; Rodrigues, L.R. Biosurfactants in cosmetic formulations: Trends and challenges. Crit. Rev. Biotechnol. 2017, 37, 911–923. [Google Scholar] [CrossRef] [PubMed]
- Varvaresou, A.; Iakovou, K. Biosurfactants in cosmetics and biopharmaceuticals. Lett. Appl. Microbiol. 2015, 61, 214–223. [Google Scholar] [CrossRef] [PubMed]
- Vincken, J.-P.; Heng, L.; de Groot, A.; Gruppen, H. Saponins, classification and occurrence in the plant kingdom. Phytochemistry 2007, 68, 275–297. [Google Scholar] [CrossRef]
- Decroos, K.; Vincken, J.-P.; van Koningsveld, G.A.; Gruppen, H.; Verstraete, W. Preparative chromatographic purification and surfactant properties of individual soyasaponins from soy hypocotyls. Food Chem. 2007, 101, 324–333. [Google Scholar] [CrossRef]
- Güçlü-Üstündağ, Ö.; Mazza, G. Saponins: Properties, Applications and Processing. Crit. Rev. Food Sci. Nutr. 2007, 47, 231–258. [Google Scholar] [CrossRef] [PubMed]
- Stefaniak, A.B.; Harvey, C.J. Dissolution of materials in artificial skin surface film liquids. Toxicol. Vitr. 2006, 20, 1265–1283. [Google Scholar] [CrossRef]
- Wertz, P.W.; Wertz, P.W. Human synthetic sebum formulation and stability under conditions of use and storage. Int. J. Cosmet. Sci. 2009, 31, 21–25. [Google Scholar] [CrossRef]
- Villegas, C.A.M.; Zagury, G.J. Comparison of synthetic sweat and influence of sebum in the permeation of bioaccessible metal(loid)s from contaminated soils through a synthetic skin membrane. Environ. Sci. Technol. 2021, 55, 8215–8222. [Google Scholar] [CrossRef]
- Park, J.S.; Lie, Y.; Kim, H.J.; Kim, H.C.; Kim, I.I. Development of aperture total internal reflection (A-TIR) for micro droplets and fingerprint patterns characterization. Opt. Commun. 2019, 453, 124414. [Google Scholar] [CrossRef]
- Garrett, P.R.; Ran, L. The effect of calcium on the foam behaviour of aqueous sodium alkyl benzene sulphonate solutions. 2. In the Presence of triglyceride-based antifoam mixtures. Colloids Surf. A Physicochem. Eng. Asp. 2017, 513, 402–414. [Google Scholar] [CrossRef]
- Kostrzębska, A.; Musiał, W. The Influence of Increasing Concentrations of AMPD on the Efficacy of Its Penetration into a Model Skin Sebum Layer. Pharmaceutics 2020, 12, 1228. [Google Scholar] [CrossRef] [PubMed]
- Bujak, T.; Nizioł-Łukaszewska, Z.; Ziemlewska, A. Amphiphilic cationic polymers as effective substances improving the safety of use of body wash gels. Int. J. Biol. Macromol. 2020, 147, 973–979. [Google Scholar] [CrossRef] [PubMed]
- Bujak, T.; Zagórska-Dziok, M.; Nizioł-Łukaszewska, Z.; Majtan, J.; Bucekova, M.; Jesenak, M. Complexes of ectoine with the anionic surfactants as active ingredients of cleansing cosmetics with reduced irritating potential. Molecules 2020, 25, 1433. [Google Scholar] [CrossRef] [Green Version]
- Jurek, I.; Szuplewska, A.; Chudy, M.; Wojciechowski, K. Effect of the oat, horse chestnut, cowherb, soy, quinoa and soapwort extracts on skin-mimicking monolayers and cell lines. J. Surfactants Deterg. 2022, 25, 185–192. [Google Scholar] [CrossRef]
- Jurek, I.; Szuplewska, A.; Chudy, M.; Wojciechowski, K. Soapwort (Saponaria officinalis l.) extract vs. synthetic surfactants—Effect on skin-mimetic models. Molecules 2021, 26, 5628. [Google Scholar] [CrossRef] [PubMed]
- Broniatowski, M.; Macho, I.S.; Miñones, J.; Dynarowicz-Łatka, P. Langmuir monolayers characteristic of (Perfluorodecyl)-alkanes. J. Phys. Chem. B 2004, 108, 13403–13411. [Google Scholar] [CrossRef]
- Luviano, A.S.; Campos-Terán, J.; Langevin, D.; Castillo, R.; Espinosa, G. Mechanical Properties of DPPC-POPE Mixed Langmuir Monolayers. Langmuir 2019, 35, 16734–16744. [Google Scholar] [CrossRef]
- Oliveira, O.N.; Caseli, L.; Ariga, K. The Past and the Future of Langmuir and Langmuir-Blodgett Films. Chem. Rev. 2022, 122, 6459–6513. [Google Scholar] [CrossRef]
- Luengo, G.S.; Fameau, A.L.; Léonforte, F.; Greaves, A.J. Surface science of cosmetic substrates, cleansing actives and formulations. Adv. Colloid Interface Sci. 2021, 290, 102383. [Google Scholar] [CrossRef]
- Robinson, V.C.; Bergfeld, W.F.; Belsito, D.V.; Hill, R.A.; Klaassen, C.D.; Marks, J.G.; Shank, R.C.; Slaga, T.J.; Snyder, P.W.; Andersen, F.A. Final report of the amended safety assessment of sodium laureth sulfate and related salts of sulfated ethoxylated alcohols. Int. J. Toxicol. 2010, 29, 151S–161S. [Google Scholar] [CrossRef]
- Wojciechowski, K.; Orczyk, M.; Gutberlet, T.; Trapp, M.; Marcinkowski, K.; Kobiela, T.; Geue, T. Unusual penetration of phospholipid mono- and bilayers by Quillaja bark saponin biosurfactant. Biochim. Biophys. Acta Biomembr. 2014, 1838, 1931–1940. [Google Scholar] [CrossRef] [PubMed] [Green Version]
- Jurek, I.; Góral, I.; Mierzyńska, Z.; Moniuszko-Szajwaj, B.; Wojciechowski, K. Effect of synthetic surfactants and soapwort (Saponaria officinalis L.) extract on skin-mimetic model lipid monolayers. Biochim. Biophys. Acta Biomembr. 2019, 1861, 556–564. [Google Scholar] [CrossRef]
- Pearson, J.T.; Alexander, A.E. The application of monolayer techniques to a study of protein-surfactant interaction. I. Interactions in spread films at the air/water interface. J. Colloid Interface Sci. 1968, 27, 53–63. [Google Scholar] [CrossRef]
- Pezron, I.; Galet, L.; Clausse, D. Surface interaction between a protein monolayer and surfactants and its correlation with skin irritation by surfactants. J. Colloid Interface Sci. 1996, 180, 285–289. [Google Scholar] [CrossRef]
- Woodward, N.C.; Gunning, A.P.; Maldonado-Valderrama, J.; Wilde, P.J.; Morris, V.J. Probing the in situ competitive displacement of protein by nonionic surfactant using atomic force microscopy. Langmuir 2010, 26, 12560–12566. [Google Scholar] [CrossRef] [PubMed]
- Cornwell, P.A. A review of shampoo surfactant technology: Consumer benefits, raw materials and recent developments. Int. J. Cosmet. Sci. 2018, 40, 16–30. [Google Scholar] [CrossRef]
- Idris, S.; Mishra, A.; Khushtar, M. Phytochemical, ethanomedicinal and pharmacological applications of escin from Aesculus hippocastanum L. Towards future medicine. J. Basic Clin. Physiol. Pharmacol. 2020, 31. [Google Scholar] [CrossRef]
- Gallelli, L. Escin: A review of its anti-edematous, antiinflammatory, and venotonic properties. Drug Des. Dev. Ther. 2019, 13, 3425–3437. [Google Scholar] [CrossRef] [Green Version]
- Geisler, R.; Dargel, C.; Hellweg, T. The biosurfactant β-aescin: A review on the physico-chemical properties and its interaction with lipid model membranes and langmuir monolayers. Molecules 2020, 25, 117. [Google Scholar] [CrossRef] [Green Version]
- Geisler, R.; Pedersen, M.C.; Hannappel, Y.; Schweins, R.; Prévost, S.; Dattani, R.; Arleth, L.; Hellweg, T. Aescin-Induced Conversion of Gel-Phase Lipid Membranes into Bicelle-like Lipid Nanoparticles. Langmuir 2019, 35, 16244–16255. [Google Scholar] [CrossRef]
- Dargel, C.; Geisler, R.; Hannappel, Y.; Kemker, I.; Sewald, N.; Hellweg, T. Self-Assembly of the Bio-Surfactant Aescin in Solution: A Small-Angle X-ray Scattering and Fluorescence Study. Colloids Interfaces 2019, 3, 47. [Google Scholar] [CrossRef] [Green Version]
- Jurek, I.; Góral, I.; Gęsiński, K.; Wojciechowski, K. Effect of saponins from quinoa on a skin-mimetic lipid monolayer containing cholesterol. Steroids 2019, 147, 52–57. [Google Scholar] [CrossRef] [PubMed]
- Wojciechowski, K.; Jurek, I.; Góral, I.; Campana, M.; Geue, T.; Gutberlet, T. Surface-active extracts from plants rich in saponins—Effect on lipid mono- and bilayers. Surf. Interfaces 2021, 27, 101486. [Google Scholar] [CrossRef]
- Orczyk, M.; Wojciechowski, K.; Brezesinski, G. Disordering Effects of Digitonin on Phospholipid Monolayers. Langmuir 2017, 33, 3871–3881. [Google Scholar] [CrossRef] [PubMed]
Figure 1.
Surface pressure isotherm (π(A)) for the synthetic sebum mixture recorded at 21 °C. Arrows and letters indicate the π values where the microphotographs shown in Figure 2 were recorded. The inset shows the compression modulus, Cs−1, as a function of surface pressure, π.
Figure 1.
Surface pressure isotherm (π(A)) for the synthetic sebum mixture recorded at 21 °C. Arrows and letters indicate the π values where the microphotographs shown in Figure 2 were recorded. The inset shows the compression modulus, Cs−1, as a function of surface pressure, π.

Figure 2.
Microphotographs from fluorescence microscope of the synthetic sebum monolayer compressed to surface pressure (π) of: 9 mN/m (A), 13 mN/m (B), 19 mN/m (C), 22 mN/m (D), 30 mN/m (E) and 40 mN/m (F). Scale bar 100 μm.
Figure 2.
Microphotographs from fluorescence microscope of the synthetic sebum monolayer compressed to surface pressure (π) of: 9 mN/m (A), 13 mN/m (B), 19 mN/m (C), 22 mN/m (D), 30 mN/m (E) and 40 mN/m (F). Scale bar 100 μm.


Figure 3.
Surface pressure isotherms (π(A)) for the synthetic sebum mixture recorded in the temperature range 10–40 °C.
Figure 3.
Surface pressure isotherms (π(A)) for the synthetic sebum mixture recorded in the temperature range 10–40 °C.

Figure 4.
Surface pressure (π(A)) hysteresis (compression-expansion samples) at 21 °C. The values in each panel indicate the surface pressure value where the barrier movement was reversed (maximum compression). The upper curves correspond to compression and lower ones to expansion cycles.
Figure 4.
Surface pressure (π(A)) hysteresis (compression-expansion samples) at 21 °C. The values in each panel indicate the surface pressure value where the barrier movement was reversed (maximum compression). The upper curves correspond to compression and lower ones to expansion cycles.

Figure 5.
Surface pressure after 100 min, π100, (a) and surface compression elasticity, E’, (b) for the bare surfactants and Milli-Q water (black bars with vertical strips) and the synthetic sebum monolayers in contact with the surfactants/Milli-Q water in the subphase (red bars with horizontal strips). All monolayers were compressed to π0 = 30 mN/m prior to introduction of the surfactants and the final concentration in the subphase was equal to 1%.

Figure 6.
Surface pressure after 100 min, π100, (a) and surface compression elasticity, E’, (b) for the bare biosurfactants and Milli-Q water (black bars with vertical strips) and the synthetic sebum monolayers in contact with the biosurfactants/ Milli-Q water in the subphase (red bars with horizontal strips). All monolayers were compressed to π0 = 30 mN/m prior to introduction of the biosurfactants and the final concentration in the subphase was equal to 1%.


Table 1.
Composition of real and synthetic sebum.
| Human Sebum | Content (% m/m) | Synthetic Sebum |
|---|---|---|
| Fatty acid triglycerides | 35 | Lard |
| Free fatty acids | 25 | Stearic acid |
| Waxes | 23 | Lanolin |
| Squalene | 13 | Squalane |
| Cholesterol | 4 | Cholesterol |
Publisher’s Note: MDPI stays neutral with regard to jurisdictional claims in published maps and institutional affiliations. |
© 2022 by the authors. Licensee MDPI, Basel, Switzerland. This article is an open access article distributed under the terms and conditions of the Creative Commons Attribution (CC BY) license (https://creativecommons.org/licenses/by/4.0/).
Share and Cite
MDPI and ACS Style
Jurek, I.; Wojciechowski, K. A Sebum-Mimetic Lipid Monolayer and Its Interaction with (Bio)Surfactants. Colloids Interfaces 2022, 6, 37. https://0-doi-org.brum.beds.ac.uk/10.3390/colloids6020037
AMA Style
Jurek I, Wojciechowski K. A Sebum-Mimetic Lipid Monolayer and Its Interaction with (Bio)Surfactants. Colloids and Interfaces. 2022; 6(2):37. https://0-doi-org.brum.beds.ac.uk/10.3390/colloids6020037
Chicago/Turabian StyleJurek, Ilona, and Kamil Wojciechowski. 2022. "A Sebum-Mimetic Lipid Monolayer and Its Interaction with (Bio)Surfactants" Colloids and Interfaces 6, no. 2: 37. https://0-doi-org.brum.beds.ac.uk/10.3390/colloids6020037