
Oil/Brine Screening for Improved Fluid/Fluid Interactions during Low-Salinity Water Flooding


School of Mining and Geosciences, Nazarbayev University, Astana 010000, Kazakhstan
*
Author to whom correspondence should be addressed.
Colloids Interfaces 2024, 8(2), 23; https://0-doi-org.brum.beds.ac.uk/10.3390/colloids8020023
Submission received: 30 January 2024
/
Revised: 12 March 2024
/
Accepted: 20 March 2024
/
Published: 1 April 2024
(This article belongs to the Special Issue Crude Oil Recovery)
Abstract
:Low-salinity water flooding/smart water flooding (LSWF/SWF) are used for enhanced oil recovery (EOR) because of the improved extraction efficiency. These methods are more environmentally friendly and in many scenarios more economical for oil recovery. They are proven to increase recovery factors (RFs) by between 6 and 20%, making LSWF/SWF technologies that should be further evaluated to replace conventional water flooding or other EOR methods. Fluid/fluid interaction improvements include interfacial tension (IFT) reduction, viscoelastic behavior (elastic properties modification), and microemulsion generation, which could complement the main mechanisms, such as wettability alteration. In this research, we evaluate the importance of fluid/fluid mechanisms during LSWF/SWF operations. Our study showed that a substantial decrease in IFT occurs when the oil asphaltene content is in the range of 0% to 3 wt.%. An IFT reduction was observed at low salinity (0–10,000 ppm) and a specific oil composition condition. Optimal IFT occurs at higher divalent ion concentrations when oil has low asphaltene content. For the oil with high asphaltene content, the sulfates concentration controls the IFT alteration. At high asphaltene concentrations, the formation of micro-dispersion is not effective to recover oil, and only a 5% recovery factor improvement was observed. The presence of asphaltene at the oil/low-salinity brine interface increases the energy required to disrupt it, inducing significant changes in the elastic moduli. In cases of low asphaltene content, the storage modulus demonstrates optimal performance at higher divalent concentrations. Conversely, at high asphaltene concentrations, the dominant factors to control the interface are paraffin content and temperature.
1. Introduction
Low-salinity water flooding (LSWF) and smart water flooding (SWF) are methods used as enhanced oil recovery (EOR) techniques; both consist of injecting water with changes in the composition presented by Austad in 2013 [1]. The main objective is altering the equilibrium of the rock/fluids in the porous media and increasing the oil recovery as mentioned by Austad in 2010 [2]. One of the main advantages of LSWF is its low environmental impact and inexpensive management at surface facilities. LSWF/SWF show an interesting alternative to modify and optimize expensive processes, making them more efficient and, in many scenarios, cheaper for the management of the asset. A good example is presented by Sorop and collaborators [3], where the implementation of LSWF replaced de-sulfated water flooding, using the same treatment plant and reducing costs, and this idea can be also applied for brownfields management and also offshore operations as presented. LSWF/SWF have proved to increase the recovery factor (RF) between 6 and 20% as presented by Masalmeh and collaborators in 2019 [4] and Kazemi in 2022 [5]. This shows the potential of this method to replace conventional water flooding or other EOR methods.
Most of the literature agrees that the main drive for this EOR method is wettability alteration as indicated by [6,7]. The mechanism is a rock/fluid interaction due to the change in the electrostatic repulsion between the rock surface and negatively charged oil groups. The ions in the interface of the brine interact easily with the oil that is attached to the surface of the rock, mobilize the oil phase, and improve the recovery. Hence, this mechanism is effective for an oil-wet/mixed wet rock where the oil is attached to the surface [8,9]. Other rock/fluid interactions like fines migration and reverse osmosis can also have a role in the performance of LSWF/SWF. However, there is another possible interaction that may be effective in some cases. The brine/oil interaction is also reported as the driving mechanism of incremental oil recovery in some experiments [10,11]. Understanding these two types of interactions opens an interesting door of research, knowing the criteria for the better performance of LSWF/SWF. In this study, the main question is the fluid/fluid interactions and the conditions where this mechanism is effective. Oil type and brine composition affect the recovery caused by the fluid/fluid interactions. Hence, it is critical to identify oil/brine properties that make this mechanism stronger.
Fluid/fluid interactions include mechanisms, such as IFT reduction, viscoelastic behavior (rheological properties modification), and microemulsion generation. For IFT reduction, authors, such as Mokhtari in 2019 [12], propose salting out as the driving mechanism for the diffusion of brine polar components. This allows for a reduction in the ion content at the interface and providing space for the polar components to locate and act like surfactants in situ. Farhadi and collaborators in 2021 [13] went further and proposed the drift and diffusion theory as the drive for the IFT alteration mechanism. Molecules in the oil that like to gather at the interface surface are pulled toward it. At the same time, there is diffusion happening, where molecules at the surface are pulled back into the bulk of the fluid due to differences in concentration. Chai and collaborators concluded that the presence of Mg2+, Ca2+, and Na+ enhances interactions between acidic polar molecules in crude oil and water. On the other hand, SO42− ions interact with cations and polar molecules, weakening the effect of cations [14]. Kakati and Sangwai in 2017 [15] also concluded that LSW containing monovalent salts is more suitable to change the IFT of crude oil with more aliphatic components, while LSW containing divalent salts is more suitable for oil having more aromatic components. On the other hand, Tetteh and Barati in 2019 [16] disclosed that monovalent salts like Na+ and K+ show no clear effect on IFT reduction compared to divalent salts. They observed the highest effect in the presence of CaCl2 and MgCl2 at a concentration of about 5000 ppm. Researchers, such as Moeini and collaborators in 2014 [17] and Lashkarbolooki [18], observed that the effect of divalent ions depends on the oil components, specifically asphaltenes and resins. Kakati and collaborators in 2020 [19] proved that for low-acid-number oils, diluted seawater affects IFT more than high-salinity water, which leads to higher oil recovery. They also reported a decrease in IFT for paraffinic oils. Lashkarbolooki and Ayatollahi in 2018 [20] concluded that a lower H/C ratio in the oil conduces to a weaker correlation of asphaltene content versus ion concentration. Generally, based on these observations, it is clear that the presence of specific ions in brines and specific components in oil results in more of a reduction in IFT during LSWF. Hence, clear criteria should be defined to design the appropriate LSW for a successful fluid/fluid interaction and improved oil recovery.
Viscoelasticity is the property that prevents snap-off and the separation of a fluid droplet during fluid flow through a reduced channel. The stability of the interface under shear stress makes the displacement more effective. Hence, alteration in viscoelasticity during the LSW/oil interactions affects the fluid flow and oil recovery. Bidhendi and collaborators in 2018 showed that a more elastic interphase leads to the development of larger droplets, controlling snap-off and achieving more oil recovery [21]. Fattahi in 2021 [22] concluded that micro-dispersions behave as agents to increase viscoelasticity. Oil properties affect the elasticity of the oil/brine interface. For example, Garcia-Olvera and collaborators in 2016 [23] observed that the elasticity of the interface was reduced five times when the oil asphaltene content was reduced to one-eighth of the original value. Chávez-Miyauch and collaborators in 2020 [24] concluded that the higher total basic number (TBN) increases the elastic moduli. Alvarado and collaborators [25] showed that acids and organic salts dominate the initial moments of the interface. Water properties also affect the elasticity. Mahmoudvand and collaborators 2019 [26] concluded that the presence of divalent cations of inorganic salts, especially Mg2+, has a positive impact on the interface as the presence of monovalent cations shows a negligible impact. [23,27] observed that the presence of sulfates suppresses the snap-off due to the reduction in the effect of the acid and naphthenic salts. Hence, a stronger and more elastic medium is developed.
The third proposed mechanism is the development of micro-dispersions. The presence of the micro-dispersions of water in oil and vice versa can generate an improved recovery due to the higher viscosity of microemulsions and expansion of the oil volume [27]. Emadi and Sohrabi in 2013 [28] observed that micro-dispersions are formed due to the release of active components from the oil/water interface. They also showed that the formation and coalescence of micro-dispersions occur due to the difference in the salinity between the LSW and the formation brine. Hence, connate water swells, and the trapped oil is displaced. Maghsoudian and collaborators in 2020 [29] showed that the water in oil emulsion is formed from Mg2+ and Ca2+, resin, and asphaltene. They observed that microemulsions can displace the oil phase and improve the sweep efficiency even after two PVs of injection. Mahzari and Sohrabi in 2014 [30] showed that the asphaltene-to-resin ratio positively affects the spontaneous formation of micro-dispersions at the brine/oil interface. Hence, in this case, the properties of the oil/brine are also important to activate the mechanism.
To select and design LSW, three groups of ions are important: monovalent (Na+ and K+), divalent (Mg2+ and Ca2+), and sulfate (SO42−) ions.
2. Materials and Methods
To rigorously evaluate and narrow down the key elements for improved fluid/fluid interaction, a meticulous screening process was implemented as a component of this study’s methodology. This screening methodology is designed to go through a comprehensive pool of variables, factors, or entities to identify those that meet specific criteria for inclusion in the subsequent phases of this research. The purpose of this screening is to streamline the focus of this investigation, ensuring that only the most relevant and promising components proceed for further analysis. The following section outlines the systematic steps and criteria employed in the screening process.
2.1. Materials
The materials used for this research, including the crude oil, brines, and chemicals, are discussed in this section.
2.1.1. Oil Characteristics
For this research, two crude oil samples were used. The sample A oil is viscous with an asphaltene content of 1.04 wt.%, from a basin in South Turgay in Central Kazakhstan. The sample B crude oil is highly viscous with high paraffinic and asphaltene content of 2.5 wt.%. It also has a low total acid number (TAN), 0.08 mg KOH/g. The crude oil is from a pre-Caspian basin in Western Kazakhstan. The density and viscosity of the samples were measured by automatic kinematic viscosimeter SVM 3000 produced by Anton Paar located in the city of Graz in Austria and are presented in Table 1.
2.1.2. Chemicals and LSW Design
In this scenario, salts play a pivotal role in preparing different LSW samples. A literature review revealed that the key components in the brine are monovalent ions (Na+), divalent ions (Mg2+), and sulfates (SO42−). Recognizing this, our goal was to create brines to study the effect of each ion type. To achieve this, three specific types of salts were selected for screening, all of them provided by SIGMA ALDRIDGE with headquarters in Burlington, USA, and their details are provided in Table 2.
2.2. Experiments
This section covers the main procedures, tests, equipment, and working mechanisms that were used for the study. Three types of tests were used for the screening process. The LSWF/SW brines/oil systems were screened by the IFT measurements, developed microemulsion measurement, and evaluation of the storage modulus (G′) and the complex viscosity (η).
2.2.1. Brine Solutions Preparation
Meticulously prepared brine solutions were crucial in facilitating various experiments, including rheological assessments, IFT measurements, and microemulsion evaluations. The preparation process involved the precise mixing of different salts in deionized water, ensuring that the water’s total organic content (TOC) was about 5000 ppm, and its resistivity was 18.3 MΩ cm. Homogeneity was achieved using a magnetic stirrer at a consistent speed of 400 rpm until complete dissolution occurred. Subsequently, the prepared solutions were securely stored in air-tight containers to prevent contact with air and preserve their integrity.
2.2.2. Microemulsions Measurement
The measurement of the microemulsion phase development involved a two-stage process. Initially, 5 mL of each brine was brought into contact with 5 mL of the oil sample. Subsequently, the mixture was shaken mechanically for about 10 min until only a single phase was observable. After 3 and 7 days, the samples were traced by measuring the location of the interface and checking for the presence of a third phase. If no third phase was detected, the phase that occupied the larger volume was henceforth considered the microemulsion phase. The microemulsion ratio is defined as the ratio of the volume of droplets present in the swelled phase over the original volume of the phase, as presented in Equation (1) [13].
2.2.3. IFT Measurements
The IFT between the brine and oil samples was quantified using a rising/captive bubble coupled with a video-image digitization technique, employing IFT 700 equipment provided by VINCI technologies, located in Nanterre, France. To optimize the measurements, the needle size and drop volume were chosen based on the density difference and IFT of the fluids, aiming for a Bond number (a balance between interfacial tension and gravitational forces) close to unity. A needle with a diameter of 0.64 mm was utilized, and the initial oil droplet volume ranged from 36 to 40 μL, depending on the specific brine. Equation (2) presents the formula for calculating the bond number.
where is the gravity constant, is the density difference between the two fluids, is the interfacial tension, and is the curve radius.
2.2.4. Rheology Measurements
The viscoelastic behavior was studied through oscillatory rheological tests, specifically the amplitude sweeps test (AST) and the frequency sweep test (FST). In the AST, the measuring system’s deflection is incrementally increased while maintaining a constant angular frequency. Conversely, the FST keeps the shear strain rate constant while varying the angular frequency in steps. Amplitude sweeps were employed to assess the time-dependent properties, such as the elasticity within a linear viscoelastic region (LVER). The amplitude sweep tests were carried out on oil aged with different brine solutions for seven days to determine G′, representing the elastic component of the mixture, and G″, indicating the viscous component. The angular frequency (ω) was set at 10 rad/s, and the shear strain rate (Υ) ranged from 1 to 100%. The primary objective of this test was to identify the ranges where the interface exhibited higher elasticity, potentially indicating improved oil recovery. After identifying the LVER, this strain was used to run the frequency test, with an amplitude frequency variating between 0.25 and 250 rad/s. Samples from the interphase were taken to determine the elastic properties using the modular compact rheometer MCR-302 provided by Anthon Paar located in the city of Graz in Austria, with a geometry of plate–plate, using a diameter of 0.649 mm in the higher plate.
3. Results and Discussion
The effectiveness of low-salinity water flooding (LSWF) depends on several factors, including the initial wettability of the reservoir, formation pH, temperature, salinity, clay content, presence of polar compounds in the oil, and soluble minerals in the formation. Some literature reports like Mohamed and Alvarado [10] report an increase in oil recovery in cases where the system is water-wet. Upon thorough research and analysis, LSWF as enhanced oil recovery technique shows promising prospects for augmenting incremental oil recovery. Additionally, it offers broader advantages, such as reducing reservoir souring and realizing cost savings in fluid handling as stated by Collins in 2011 [31]. This research specifically evaluates the role of the polar compounds and ion composition of the brine in activating fluid/fluid interactions. The criteria for activating IFT reduction, increased viscoelasticity, and microemulsion development in fluid/fluid interactions are assessed through a critical comparison of scenarios found in the literature with observed results. This provides valuable insights into determining the optimal brine condition for LSWF/SWF.
3.1. IFT Reduction
Table 4 shows the oil and brine properties effect over the IFT reduction observed in the literature; these studies focus on scenarios where other types of interactions are not evaluated as presented in the Table 4. Among these properties, asphaltene content emerges as a critical parameter, influencing the IFT. Study presented in Figure 2A shows a noteworthy trend in IFT change, with the most favorable zone identified between 0% and 3% asphaltene content. Within this range, the IFT exhibits higher decrease, exceeding 45%. Conversely, minimal changes in the IFT are observed at asphaltene contents surpassing 15%, attributed to the generation of a more stable interface due to the presence of these components.
Figure 2B shows the relation with the injection brine, with the TDS and brine composition exerting a significant impact on the IFT, separated into three distinct zones characterized by varying TDS concentrations: 0–10,000 ppm, 10,000–30,000 ppm, and 30,000–50,000 ppm. At low salinity (0–10,000 ppm), the process is primarily influenced by the oil composition, specifically the asphaltene content, as the interface lacks surface-active components. The absence of ions enhances efficiency, divalent ions demonstrate higher impact. Within the 10,000–30,000 ppm range, the data indicate a relatively stable state due to the interface saturation of ions. The stability hinges on the ease with which ions position themselves, resulting in a decrease in IFT. In the third zone, characterized by higher salinities, changes in the IFT are less pronounced as the interface becomes increasingly saturated with ions, diminishing the effectiveness of LSWF/SWF.
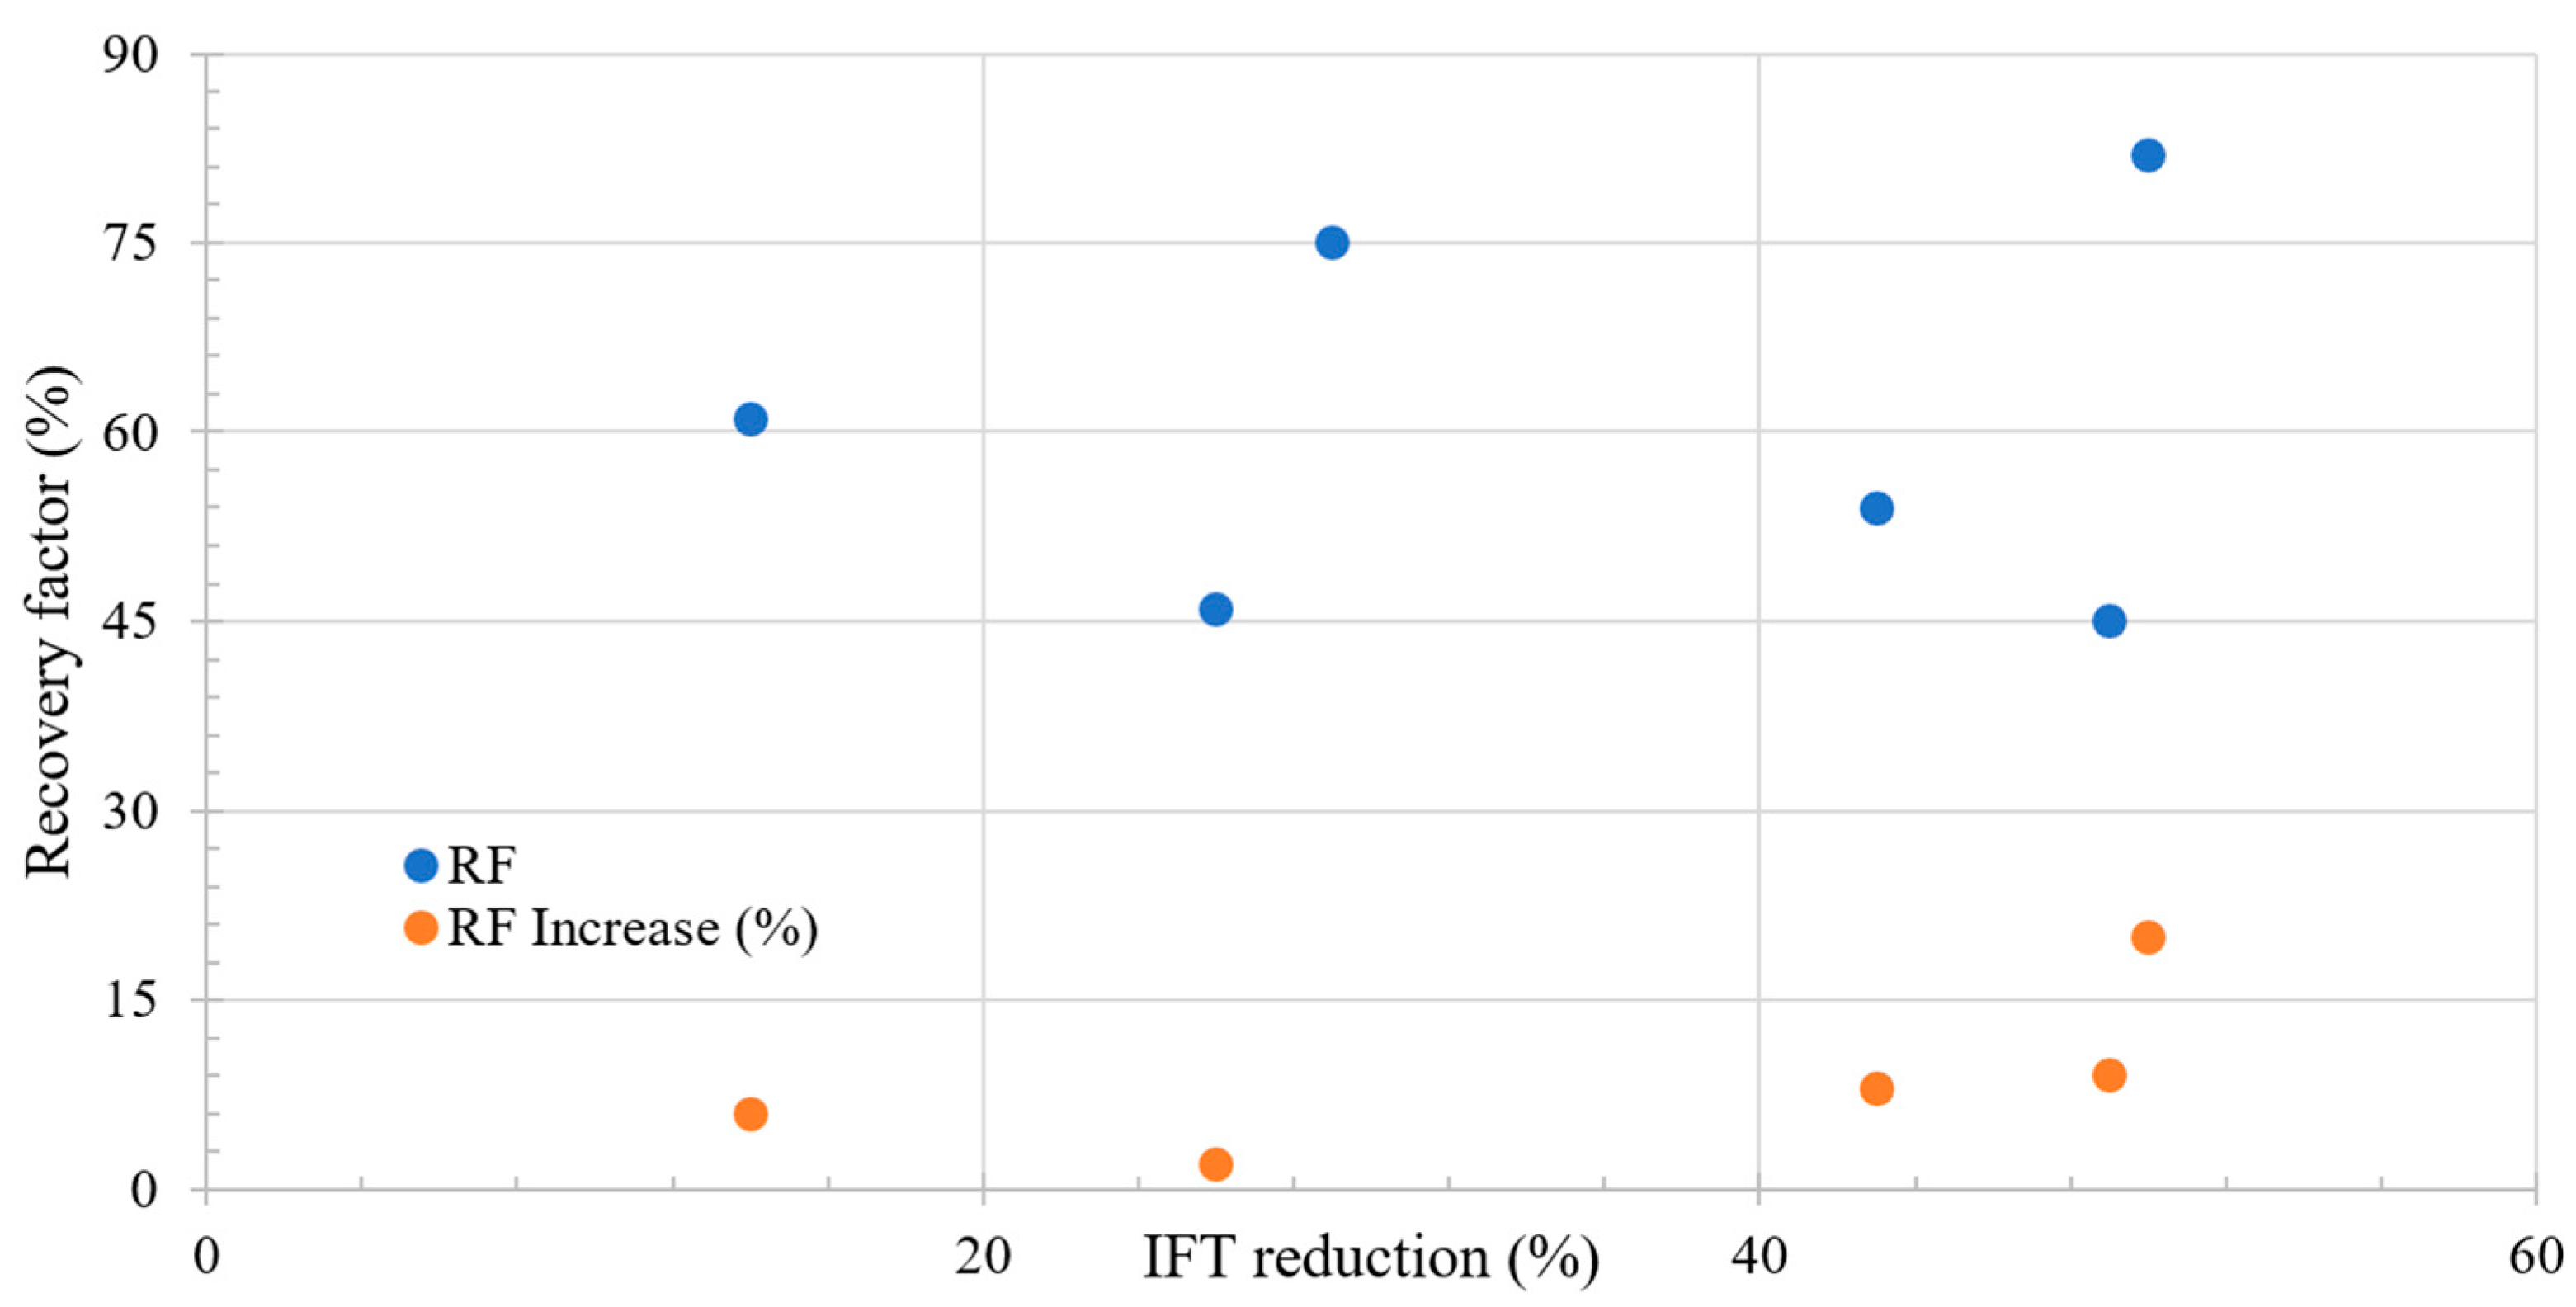
Figure 3 shows the relation between the incremental RF and IFT change during LSWF. A key observation is that a more pronounced reduction in IFT corresponds to an increase in the recovery factor. However, it is crucial to highlight that no increase exceeding 50% is observed, suggesting that achieving an ultralow IFT is not feasible based on the proposed mechanism. Additionally, initial increments in recovery are observed only after a 10% reduction in IFT.
When analyzing the experimental IFT reduction behavior, it is coherent with the findings in the literature. The effect of the asphaltenes in the IFT reduction is presented in Figure 4. Both samples show a clear reduction in IFT. For sample A, the reduction is bigger compared to sample B; this aligns with the research of Farhadi and collaborators, as well as Golmohammadi [13,37], who identified the optimal asphaltene concentration for improved IFT to be within the range of 1.65 to 2.5%. Within this concentration range, the interphase displays a diminished charge of surface-active components, facilitating the reorganization of asphaltenes and promoting a more elastic medium. Additionally, for sample B, this trend is consistent with the findings of Kakati and collaborators [19], where paraffin is identified as a key factor influencing IFT reductions in such scenarios. For sample A, the IFT demonstrates optimal outcomes at higher concentrations of divalent ions, suggesting a potentially acidic nature of the oil, which is consistent with the findings of Chai and collaborators [14]; notably, Brines 6, Brine 8, and Brine 10 emerge as the most favorable options in this context. For sample B, the trend of sulfates and divalent ions is opposite to that observed in monovalent ions. However, it becomes apparent that the controlling ion group for this mechanism is sulfates. A discernible trend emerges where the most favorable scenarios lie in the intermediate region between sulfates and monovalents. This pattern aligns with the observations made by Lashkarbolooki and Ayatollahi [20], who noted an average reduction of 20% with a favorable 1:2 sulfates-to-monovalent ratio. The results obtained by our measurements are presented in Table 5.
3.2. Microemulsion Generation
Table 6 illustrates the correlation between the asphaltene content and the trend of micro-dispersions for the studies found in the literature. Figure 5A shows a discernible pattern, wherein an increase in the asphaltene content results in a reduction in the micro-dispersion ratio. Particularly, at high asphaltene concentrations, the mechanism facilitating the micro-dispersion formation becomes less effective. Moreover, in Figure 5B, the data reveal that, with higher salinity, the micro-dispersion ratio diminishes. However, it is noteworthy that at a salinity level of 500 ppm, the data exhibit significant dispersion and lack a clear correlation. The impact of micro-dispersions on the recovery factor is of notable significance.
Figure 6 shows the relation between the microemulsion generation and the recovery factor. When the micro-dispersion ratio surpasses 10, an anticipated elevation in the recovery factor is observed. Remarkably, for all the ratios exceeding this 10-fold threshold, a consistent average improvement of 5% in the recovery factor is evident.
Figure 7 shows the experimental results of this research, comparing the behavior of each sample with the microemulsion generation. Notably, the content of asphaltenes shows an interesting trend with the increase in water in oil emulsions. This suggests that, at the same salinity, the effect of oil composition varies, and the volume fraction increases depending on the asphaltenes content. Increasing the colloidal instability index (CII) in these samples directly impacts the volume of emulsions and follows a different trend. Chai [14], propose that the effect of asphaltenes in acidic oil can result in W/O microemulsions. In this case, the reason for W/O microemulsions in sample A may not be solely attributed to a lower CII but could be related to the characteristics of the asphaltenes. For sample A, the intensification of the microemulsion formation is evident as the system shifts toward divalent and sulfate-rich conditions while showing minimal changes in the interface within the monovalent range. This observation aligns with the findings of Emadi and Sohrabi [28] and Mahzari and Sohrabi [30], who highlighted a favorable 1:4 divalent-to-monovalent ratio and a 1:3 sulfates-to-monovalent ratio. These ratios indicate that Brine 8, Brine 9, and Brine 10 are the optimal choices for microemulsion generation. The behavior of the microemulsions is particularly captivating in sample B, with all the inner regions of the diagram displaying a high phase volume fraction, except for the innermost part. Based on our best knowledge, this valley-like pattern is a novel observation not documented in the literature before, presenting an intriguing avenue for further research. In this context, the brines offering the best options are identified as Brine 7, Brine 8, and Brine 9.
For sample B, authors like Holmberg in 2003 [39] proposes that microemulsions show a strong increase in reactivity found for large polarizable anions. These ions tend to interact with and accumulate at the interface; in this scenario, SO42− is the main cation. Indicating that nonionic surfactants (in this scenario asphaltenes) display the effect because large, polarizable anions interact with the hydrophobic surface by dispersion forces, this could tell us that we are identifying nonionic asphaltenes for sample B. The results obtained by our measurements are presented in Table 7.

Table 6.
Micro-dispersion studies referenced.
| SARA | ION CONCENTRATION | ||||||||||||
|---|---|---|---|---|---|---|---|---|---|---|---|---|---|
| Reference | Sat. (wt. %) | Aro. (wt. %) | Res. (wt. %) | Asph. (wt. %) | TAN (mg KOH) | TDS (mg/L) | Na+ (mg/L) | K+ (mg/L) | Ca2+ (mg/L) | Mg2+ (mg/L) | SO42− (mg/L) | Micro Dispersion Ratio (%) | Improved EOR (%) |
| (Fattahi et al., 2021) [20] * | 76.06 | 21.13 | 2.49 | 0.32 | 0.11 | 493.53 | 284.05 | 8 | 18 | 137 | 44 | 2.32 | 0 |
| (Fattahi et al., 2021) [20] * | 33.64 | 46.76 | 16.93 | 2.67 | 0.3 | 493.53 | 284.05 | 8 | 18 | 137 | 44 | 13.24 | 5.38 |
| (Mahzari et al., 2018) [40] | 49.14 | 33.19 | 16.85 | 0.82 | 0.55 | 1238 | 381.24 | 14.9 | 13.51 | 45.055 | 93.57 | 13 | |
| (Mahzari et al., 2018) [40] | 53.37 | 39.76 | 6.87 | 0.001 | 0.35 | 1238 | 381.24 | 14.9 | 13.51 | 45.055 | 93.57 | 2.1 | |
| (Mahzari, et al., 2019) [41] * | 63.66 | 24.9 | 11.29 | 0.15 | 0.15 | 500 | 400 | 100 | 2.1 | ||||
| (Mahzari, et al., 2019) [41] * | 24.56 | 42.01 | 31.75 | 1.71 | 1.35 | 500 | 400 | 100 | 9.5 | ||||
| (Mahzari, et al., 2019) [41] * | 62.23 | 29.97 | 7.6 | 0.2 | 1.71 | 500 | 400 | 100 | 48.6 | 4.50 | |||
| (Mahzari, et al., 2019) [41] * | 39.24 | 30.38 | 11.67 | 18.71 | 0.2 | 500 | 400 | 100 | 11.01 | 4.50 | |||
| (Mahzari, et al., 2019) [41] * | 79.07 | 19.48 | 1.4 | 0.05 | 0.01 | 500 | 400 | 100 | 2.1 | 5.90 | |||
| (Mahzari, et al., 2019) [41] * | 44.6 | 43.32 | 10.08 | 2 | 0.05 | 500 | 400 | 100 | 7.8 | 6 | |||
| (Mahzari, et al., 2019) [41] * | 40.95 | 24.9 | 34.1 | 0.05 | 0.25 | 500 | 400 | 100 | 29.5 | 5.70 | |||
* Indicates that the research provides the total salt concentration (ppm.) rather than the ion concentration (ppm.).
3.3. Viscoelastic Modulus Increase
Table 8 presents an overview of the studies evaluating the storage modulus and its associated conditions. Figure 8, subplot A, shows that a discernible increasing trend is observed in the alteration of the elastic moduli, indicating heightened elasticity with higher asphaltene content. The relation between asphaltene presence and elastic moduli stems from the stability of the interface. Specifically, the introduction of asphaltene in this region implies an escalation in the energy required to disrupt the formed interface. However, the behavior of the change in elastic moduli is somewhat ambiguous due to the dispersed values. Subplot B focuses on examining the influence of TDS on G′; a noteworthy impact is observed within the 0–10,000 ppm range. Significant changes occur in the elastic moduli as ample space at the interface allows surface-active components to position themselves, inducing shifts in elasticity. In essence, the presence of these components in the available space affects how materials respond to stress. The range of 30,000–50,000 ppm exhibits an increasing trend, indicating a potentially more rigid interface. The potential increase in moduli in this context may be attributed to the displacement of monovalent ions at the interface by divalent ions, enhancing surface behavior and contributing to alterations in elastic moduli.
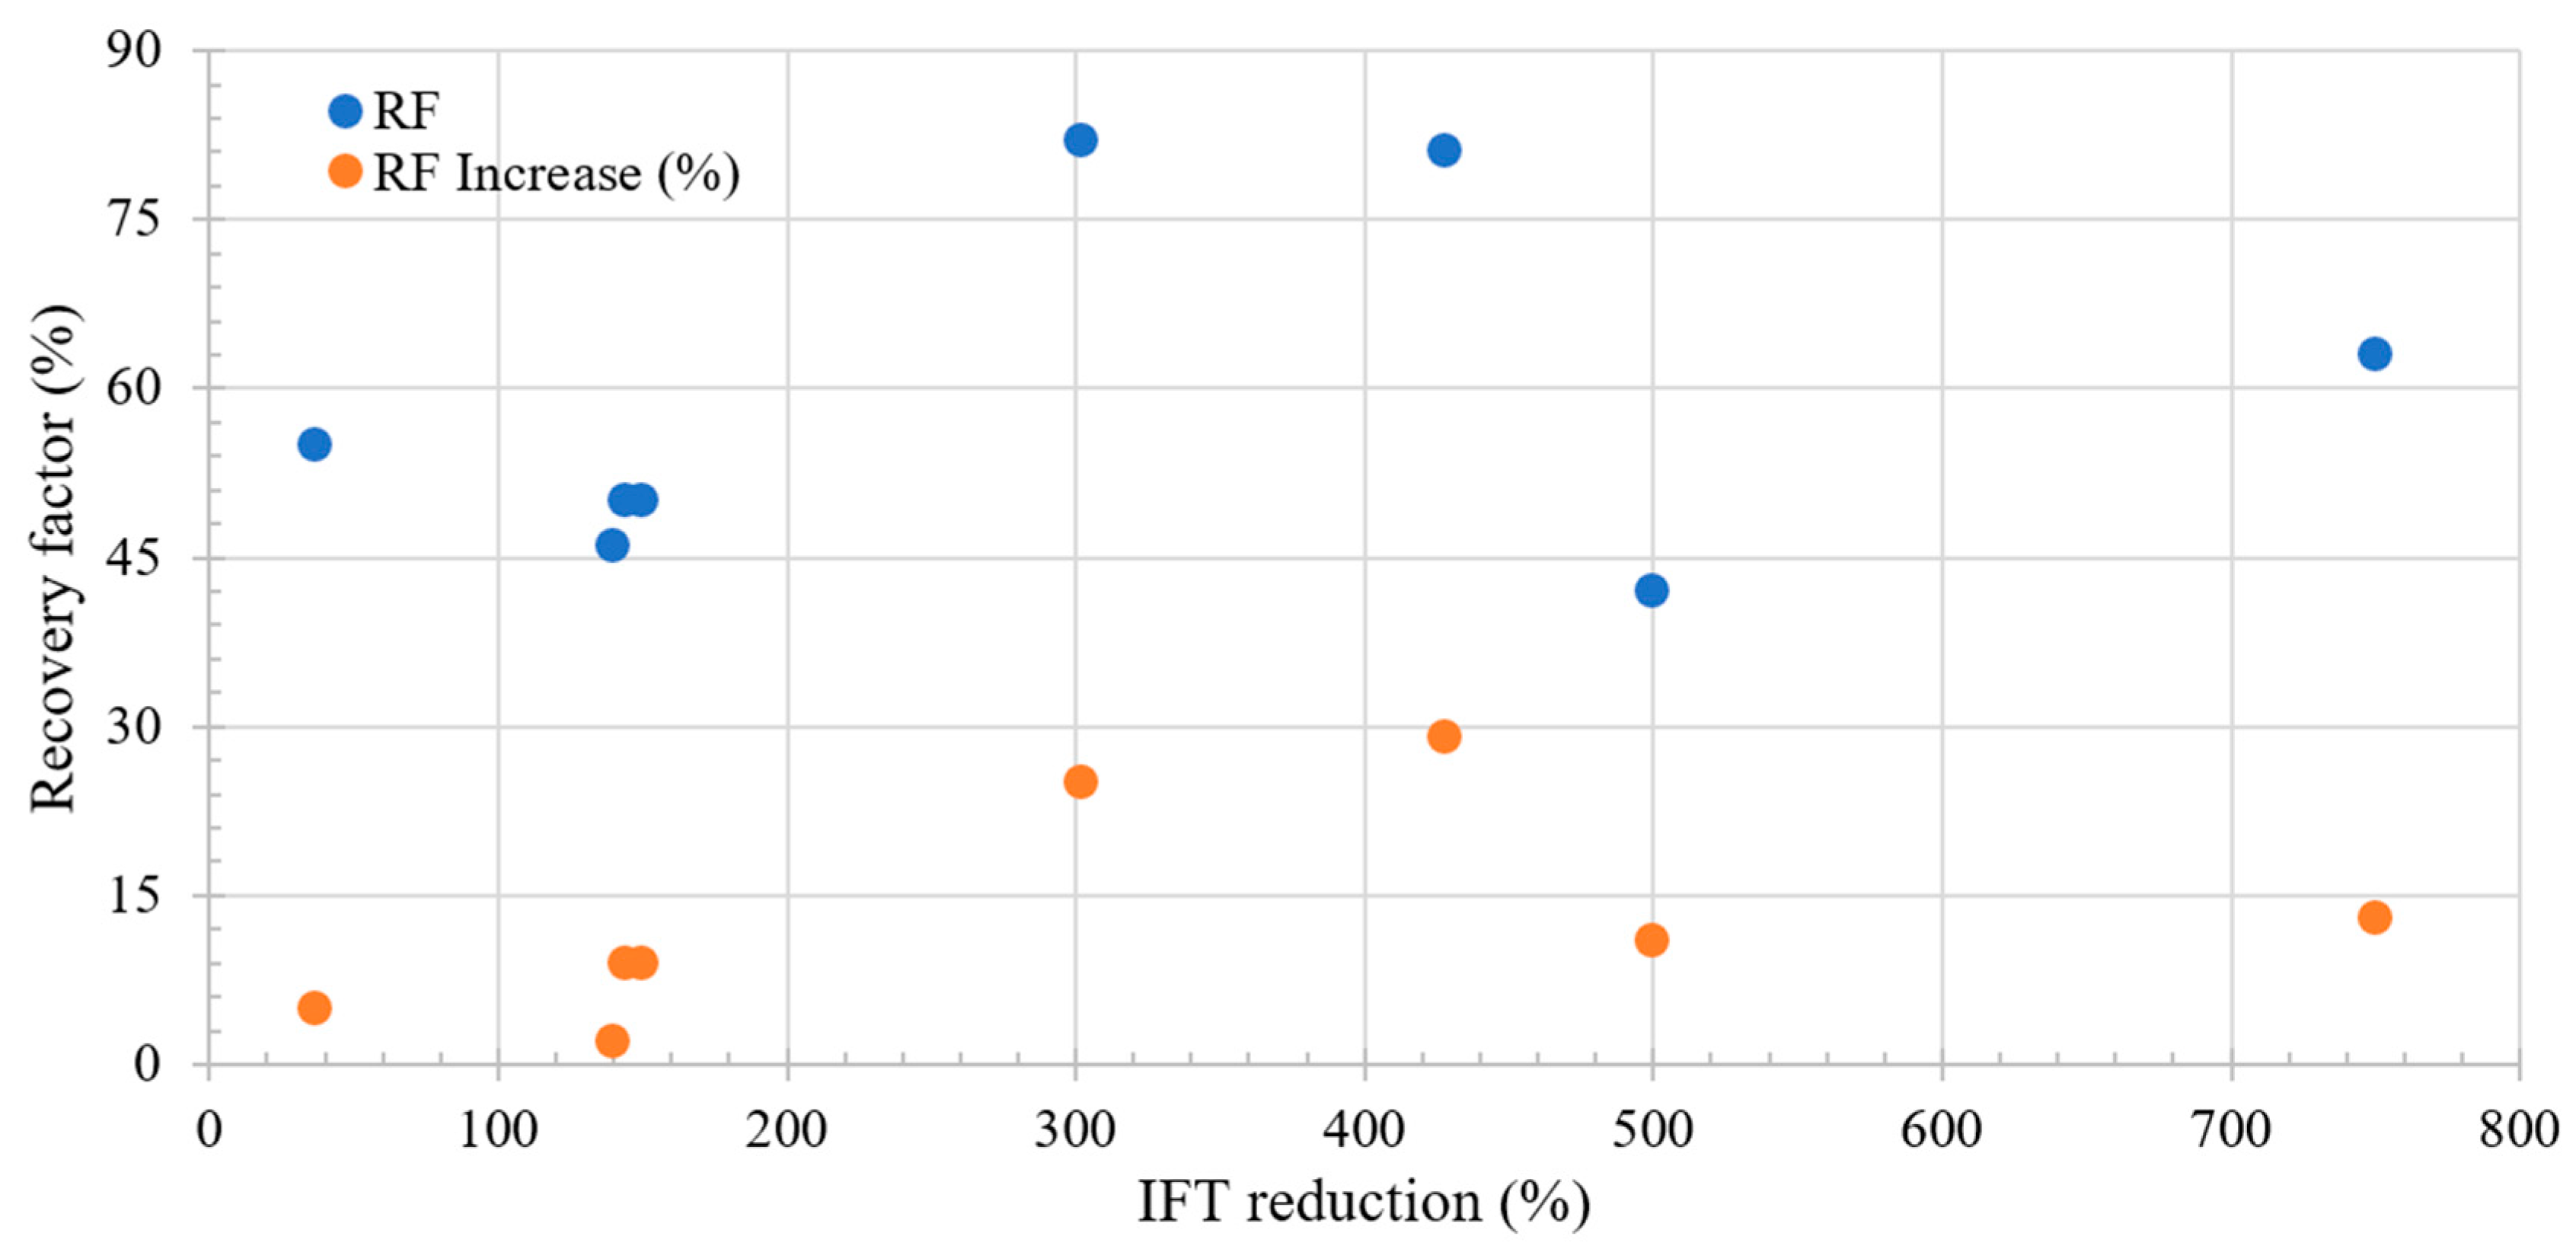
Figure 9 shows the relationship between the recovery factor and the change in elastic moduli during LSWF/SWF; a distinctive peak in oil recovery is evident with an increase of around 200–300% in the elastic moduli. This peak is associated with the energy required to displace the oil, signifying stability in the interface conducive to oil movement. As the interface becomes more rigid, the likelihood of oil movement decreases due to increased difficulty in deforming the interface. Notably, improvements in recovery are apparent even with increases of around 50% in the elastic modulus, disregarding the effect of IFT reduction.
Figure 10 shows the scenarios evaluated experimentally for the storage modulus in each sample; the higher the content of asphaltenes, there is drift from the sulfates to the divalent ions. This could also be associated with the type of asphaltenes and the TAN of the asphaltenes as presented by Almeida da Costa [44]. For sample A, the storage modulus demonstrates superior performance at high ionic concentrations within each group. Two distinct areas emerge: one near the sulfate, consistent with the findings of Mohamed and Alvarado [10], who emphasized a favorable 1:2 sulfates-to-monovalent ratio, and another area nearer to the divalent ions, aligning with the conclusions of Mahmoudvand and collaborators [26], Tetteh and Barati [16]. These studies highlighted a favorable 1:3 divalent-to-monovalent ratio, thus confirming Mg2+ and SO42- as a positive influence on the interface. For enhanced storage modulus (G′), the most effective brines are identified as Brine 2, Brine 3, Brine 5, Brine 6, Brine 8, and Brine 9.
For sample B, the storage modulus indicates a low value, signifying a favorable flow under these conditions. Interestingly, it exhibits an opposite trend compared to the microemulsions as the modulus values increase with higher ion concentrations. This suggests that the interface is not saturated and has room for the presence of surface-active components. The order of magnitude is around 10−6, in contrast to the 100 values observed for sample A. In this context, divalent ions demonstrate a higher G′, aligning with the findings of Mahmoudvand [26],. The ultralow G′ values are linked to a temperature response of the sample, and due to the high paraffinic content, it is impractical to evaluate the sample at room temperature. This effect aligns with the divalent and monovalent area, where a 1:2 divalent-to-monovalent ratio yields the best results. Brine 5 and Brine 8 emerge as the optimal choices in this scenario. The results obtained by our measurements are presented in Table 9.
3.4. Best Brine Selection
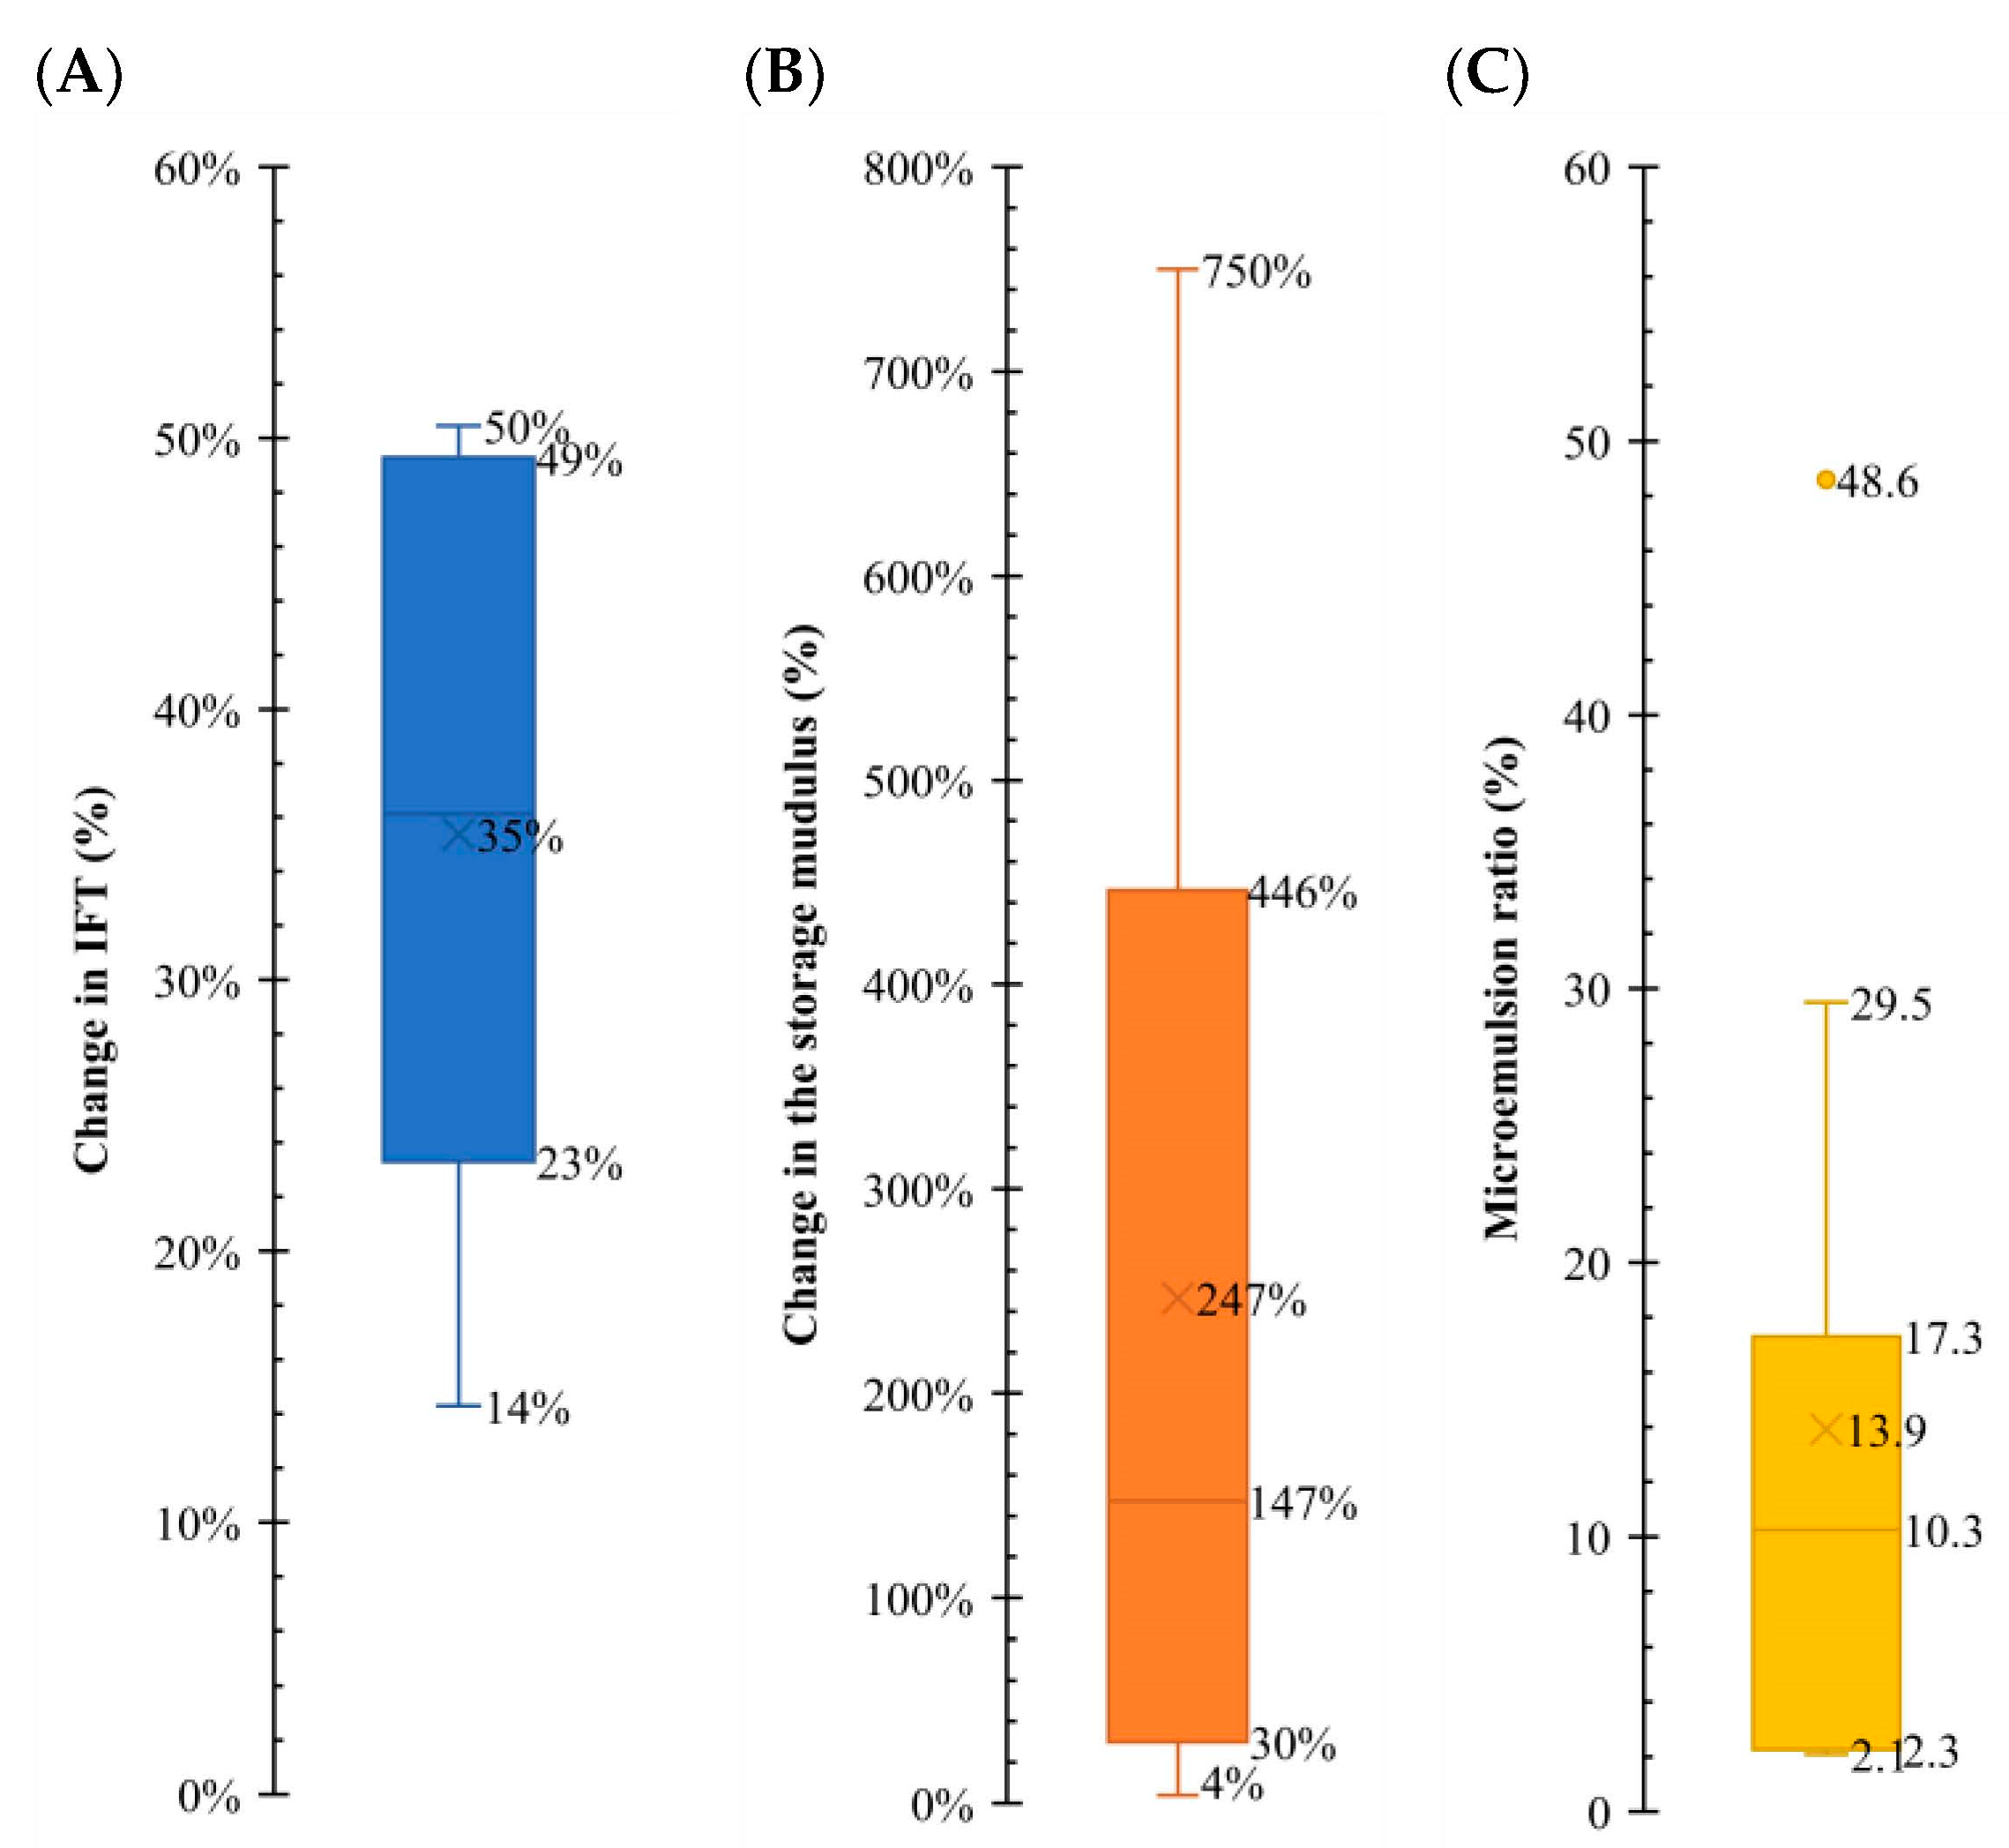
As mentioned, the fluid/fluid interaction mechanisms are studied in different sources in the literature. As a part of this study, all the data in the literature are collected to show the range of observed changes in the parameters, such as IFT, elasticity, and microemulsion formation. Figure 11 illustrates the range of change in these parameters. Each resulting data point on the graph corresponds to a specific mechanism, and a box plot is generated for each one. In the case of IFT, it is evident that an ultralow scenario is not anticipated. Instead, a reduction of approximately 25–45% is the most probable outcome, suggesting the potential for increased oil production capacity. The elastic modulus, also called the storage modulus (G′), shows an alteration of 150–400%, which is significant, compared to the changes in IFT. Microemulsion formation demonstrates a more clustered variation, and an expected change in the range of 6–14% is apparent. This is important as we could see the impact of the microemulsions on the G′ parameter.
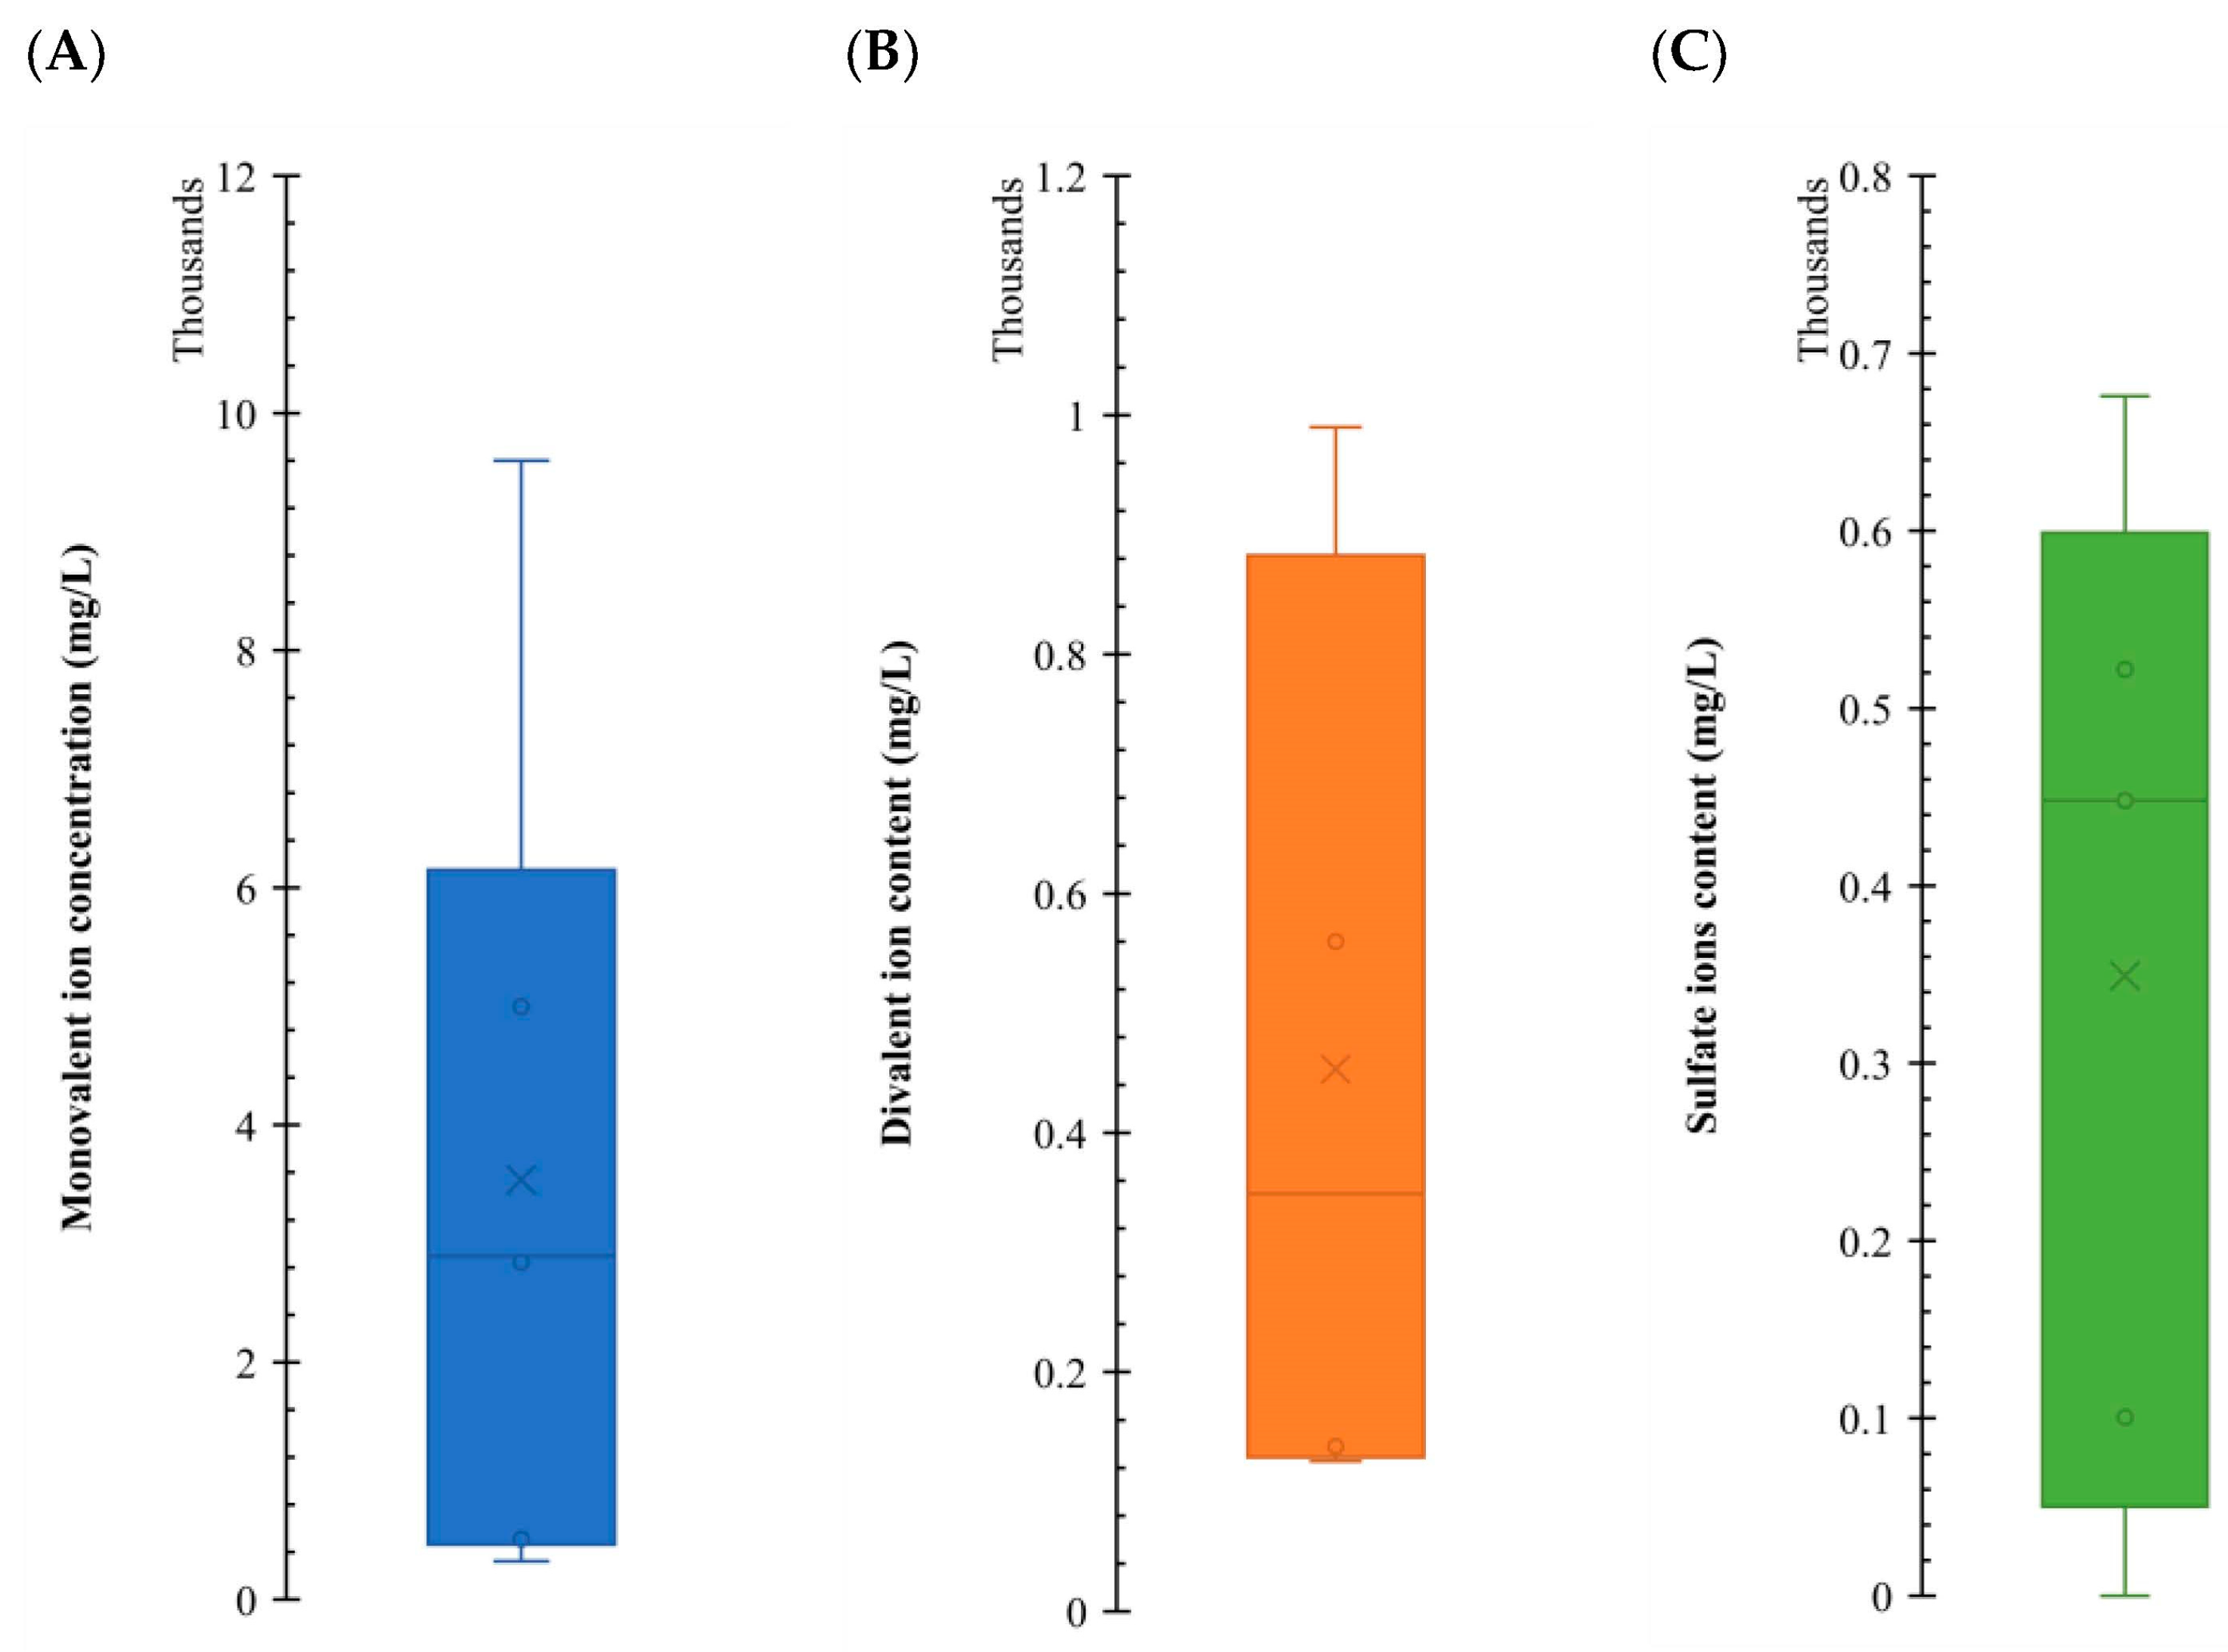
Figure 12 illustrates the concentration (in mg/L) for each ion group where an impact on IFT was observed. As can be seen, there are significant variations in the orders of magnitude for each group in the LSWF/SWF. Sulfates and divalent ions exhibit minimal differences, typically within two or three times, while monovalent concentrations tend to cluster approximately one order of magnitude greater than divalent ones. Based on this graph, we can add up the concentrations to get to a working concentration of around 5000 ppm; this aligns with the findings of Kazemi Nia Korrani and Jerauld [5], suggesting this salinity value is a compelling choice or proposing upscaling in LSWF/SWF projects.
The experimental analysis conducted reveals that the brine/oil properties play a significant role in enhancing fluid/fluid interaction mechanisms. Table 10 shows the optimal brine for each sample within the various fluid/fluid mechanisms in bold font. For sample A, the most favorable brine is identified as Brine 8, characterized by enrichment in the Mg2+ brine, highlighting the system’s affinity for divalent ions. Conversely, for sample B, the superior outcomes are associated with both Brine 8 and Brine 9, enriched with Mg2+ and SO42−, respectively. The observed distinctions in the asphaltene content and asphaltene types between the two samples influenced the behavior of the fluid/fluid interaction. Notably, the impact is more pronounced in sample A, where the effects are clearer. This suggests that the interface of sample A is more likely to influence LSWF/SWF. In the case of sample B, the experimental phase was dominated by the paraffin content and temperature. Although the effect is not as evident as in sample A, the reduction in IFT indicates that the interface in sample B also possesses the potential for improvement through LSWF/SWF. Moreover, the interface in sample B exhibits greater versatility in responding to ions in the brine, signifying promising practical applications.
4. Conclusions
The goal of this research aimed to identify fluid/fluid mechanisms that could aid the main mechanism in LSWF/SWF. Based on the results from the literature review and the experimental procedures, the following conclusions can be drawn:
- The zone between 0% and 3 wt.% asphaltene content exhibits the most prominent decrease in IFT, exceeding 45%. At low salinity (0–10,000 ppm), the IFT reduction is primarily influenced by oil composition, specifically the asphaltene content, as the interface lacks surface-active components.
- For oil sample A, the IFT demonstrates optimal outcomes at higher concentrations of divalent ions (Brine 6 and Brine 8), while for oil sample B, the controlling ion group for this mechanism is sulfates. A discernible trend emerges where the most favorable scenarios lie in the intermediate region between sulfates and monovalents (i.e., Brine 4, Brine 9, and Brine 10).
- At high asphaltene concentrations, the mechanism facilitating the micro-dispersion formation becomes less effective; for all the ratios exceeding this 10-fold threshold, a consistent average improvement of 5% in the recovery factor is evident, indicating that microemulsions are not a controlling mechanism in fluid/fluid interactions.
- W/O microemulsions in sample A may not be solely attributed to a lower CII but could be related to the characteristics of the asphaltenes. For oil sample A, the intensification of the microemulsion formation is evident as the system shifts toward divalent and sulfate-rich conditions (i.e., Brine 8, Brine 9, and Brine 10). For oil sample B, all the inner regions of the diagram display a high phase volume fraction, except for the innermost part (i.e., Brine 7, Brine 8, and Brine 9).
- The presence of asphaltene in the interface implies an increase in the energy required to disrupt it. Significant changes occur in the elastic moduli at low salinity (0–10,000 ppm) as ample space at the interface allows surface-active components to position themselves, inducing shifts in elasticity. In essence, the presence of these components in the available space affects how materials respond to stress.
- For oil sample A, the storage modulus demonstrates superior performance at high ionic concentrations within each group. A favorable 1:2 sulfates-to-monovalent ratio and 1:3 divalent-to-monovalent ratio confirm Mg2+ and SO42− as a positive influence on the interface (Brine 2, Brine 3, Brine 5, Brine 6, Brine 8, and Brine 9). Sample B exhibits an inverse relation between microemulsions and the storage modulus, as the modulus values increase with higher ion concentrations. This suggests that the interface is not saturated and has room for the presence of surface-active components (Brine 5 and Brine 8).
- For sample A, the most favorable brine is identified as Brine 8, highlighting the system’s affinity for divalent ions. For sample B, the experimental phase was dominated by the paraffin content and temperature, leading Brines 8 and 9 to be the best options, indicating the interface in sample B exhibits greater adaptability in responding to ions in the brine, signifying promising practical applications.
- Recognizing the ionic ternary diagram as a crucial tool in LSWF/SWF modeling enables the exploration of fluid/fluid interactions as potential mechanisms, alongside well-established rock/fluid mechanisms, like wettability alteration and fines migration.
Author Contributions
J.V.-M.: conducting experiments, modeling, analysis, writing the paper draft. P.P.: methodology, analysis, supervision, writing the final draft. M.R.: analysis, supervision, writing the final draft. All authors have read and agreed to the published version of the manuscript.
Funding
The authors would like to acknowledge the support of Nazarbayev University through the NU Faculty Development Competitive Research Grants Program (Grant number: 11022021FD2910).
Data Availability Statement
The data that support the findings of this study are available on request from the corresponding author.
Acknowledgments
The authors thank Nazarbayev University for supporting this research.
Conflicts of Interest
The authors declare no conflicts of interest.
References
- Austad, T. Chapter 13—Water-Based EOR in Carbonates and Sandstones: New Chemical Understanding of the EOR Potential Using “Smart Water”. In Enhanced Oil Recovery Field Case Studies; Sheng, J.J., Ed.; Gulf Professional Publishing: Boston, MA, USA, 2013; pp. 301–335. [Google Scholar] [CrossRef]
- Austad, T.; RezaeiDoust, A.; Puntervold, T. Chemical Mechanism of Low Salinity Water Flooding in Sandstone Reservoirs. In Proceedings of the SPE Improved Oil Recovery Symposium, Tulsa, OA, USA, 24–28 April 2010; SPE: Kuala Lumpur, Malaysia, 2010; p. SPE-129767-MS. [Google Scholar] [CrossRef]
- Sorop, T.G.; Suijkerbuijk, B.M.; Masalmeh, S.K.; Looijer, M.T.; Parker, A.R.; Dindoruk, D.M.; Goodyear, S.G.; Al-Qarshubi, I.S. Integrated Approach in Deploying Low Salinity Waterflooding. In Proceedings of the SPE Enhanced Oil Recovery Conference, Kuala Lumpur, Malaysia, 2–4 July 2013; SPE: Kuala Lumpur, Malaysia, 2013. [Google Scholar] [CrossRef]
- Masalmeh, S.; Al-Hammadi, M.; Farzaneh, A.; Sohrabi, M. Low Salinity Water Flooding in Carbonate: Screening, Laboratory Quantification and Field Implementation. In Proceedings of the Abu Dhabi International Petroleum Exhibition & Conference, Abu Dhabi, United Arab Emirates, 11–14 November 2019; SPE: Kuala Lumpur, Malaysia, 2019. [Google Scholar] [CrossRef]
- Korrani, A.K.N.; Jerauld, G.R. Upscaling Low-Salinity Benefit from Laboratory Scale to Field Scale: An Ensemble of Models with a Relative Permeability Uncertainty Range. SPE J. 2022, 27, 3674–3687. [Google Scholar] [CrossRef]
- Mamonov, A.; Puntervold, T.; Strand, S. EOR by Smart Water Flooding in Sandstone Reservoirs—Effect of Sandstone Mineralogy on Initial Wetting and Oil Recovery. In Proceedings of the SPE Russian Petroleum Technology Conference, Moscow, Russia, 16–18 October 2017; p. D033S021R003. [Google Scholar] [CrossRef]
- Tahir, M.; Hincapie, R.E.; Gaol, C.; Saefken, S.; Ganzer, L. Describing the Flow Behavior of Smart Water in Micromodels with Wettability Modified Pore Structures. In Proceedings of the SPE Latin American and Caribbean Petroleum Engineering Conference, Virtual, 27–31 July 2020; SPE: Kuala Lumpur, Malaysia, 2020. [Google Scholar] [CrossRef]
- Zhang, P.; Austad, T. Wettability and oil recovery from carbonates: Effects of temperature and potential determining ions. Colloids Surf. Physicochem. Eng. Asp. 2006, 279, 179–187. [Google Scholar] [CrossRef]
- Nasralla, R.A.; Bataweel, M.A.; Nasr-El-Din, H.A. Investigation of wettability alteration and oil-recovery improvement by low-salinity water in sandstone rock. J. Can. Pet. Technol. 2013, 52, 144–154. [Google Scholar] [CrossRef]
- Mohamed, M.I.; Alvarado, V. Smart Water Flooding in Berea Sandstone at Low Temperature: Is Wettability Alteration the Sole Mechanism at Play? In Proceedings of the SPE Annual Technical Conference and Exhibition, San Antonio, TX, USA, 9–11 October 2017; SPE: Kuala Lumpur, Malaysia, 2017; p. D031S046R007. [Google Scholar] [CrossRef]
- Yue, L.; Pu, W.; Zhao, S.; Zhang, S.; Ren, F.; Xu, D. Insights into mechanism of low salinity water flooding in sandstone reservoir from interfacial features of oil/brine/rock via intermolecular forces. J. Mol. Liq. 2020, 313, 113435. [Google Scholar] [CrossRef]
- Mokhtari, R.; Ayatollahi, S.; Fatemi, M. Experimental investigation of the influence of fluid-fluid interactions on oil recovery during low salinity water flooding. J. Pet. Sci. Eng. 2019, 182, 106194. [Google Scholar] [CrossRef]
- Farhadi, H.; Ayatollahi, S.; Fatemi, M. The effect of brine salinity and oil components on dynamic IFT behavior of oil-brine during low salinity water flooding: Diffusion coefficient, EDL establishment time, and IFT reduction rate. J. Pet. Sci. Eng. 2021, 196, 107862. [Google Scholar] [CrossRef]
- Chai, R.; Liu, Y.; He, Y.; Cai, M.; Zhang, J.; Liu, F.; Xue, L. Effects and Mechanisms of Acidic Crude Oil–Aqueous Solution Interaction in Low-Salinity Waterflooding. Energy Fuels 2021, 35, 9860–9872. [Google Scholar] [CrossRef]
- Kakati, A.; Sangwai, J.S. Effect of monovalent and divalent salts on the interfacial tension of pure hydrocarbon-brine systems relevant for low salinity water flooding. J. Pet. Sci. Eng. 2017, 157, 1106–1114. [Google Scholar] [CrossRef]
- Tetteh, J.T.; Barati, R. Crude-Oil/Brine Interaction as a Recovery Mechanism for Low-Salinity Waterflooding of Carbonate Reservoirs. SPE Reserv. Evaluat. Eng. 2019, 22, 877–896. [Google Scholar] [CrossRef]
- Moeini, F.; Hemmati-Sarapardeh, A.; Ghazanfari, M.-H.; Masihi, M.; Ayatollahi, S. Toward mechanistic understanding of heavy crude oil/brine interfacial tension: The roles of salinity, temperature and pressure. Fluid Phase Equilibria 2014, 375, 191–200. [Google Scholar] [CrossRef]
- Lashkarbolooki, M.; Riazi, M.; Ayatollahi, S.; Hezave, A.Z. Synergy effects of ions, resin, and asphaltene on interfacial tension of acidic crude oil and low–high salinity brines. Fuel 2016, 165, 75–85. [Google Scholar] [CrossRef]
- Kakati, A.; Kumar, G.; Sangwai, J.S. Oil Recovery Efficiency and Mechanism of Low Salinity-Enhanced Oil Recovery for Light Crude Oil with a Low Acid Number. ACS Omega 2020, 5, 1506–1518. [Google Scholar] [CrossRef] [PubMed]
- Lashkarbolooki, M.; Ayatollahi, S. Effects of asphaltene, resin and crude oil type on the interfacial tension of crude oil/brine solution. Fuel 2018, 223, 261–267. [Google Scholar] [CrossRef]
- Bidhendi, M.M.; Garcia-Olvera, G.; Morin, B.; Oakey, J.S.; Alvarado, V. Interfacial Viscoelasticity of Crude Oil/Brine: An Alternative Enhanced-Oil-Recovery Mechanism in Smart Waterflooding. SPE J. 2018, 23, 803–818. [Google Scholar] [CrossRef]
- Mehraban, M.F.; Farzaneh, S.A.; Sohrabi, M. Functional compounds of crude oil during low salinity water injection. Fuel 2021, 285, 119144. [Google Scholar] [CrossRef]
- Garcia-Olvera, G.; Reilly, T.M.; Lehmann, T.E.; Alvarado, V. Effects of asphaltenes and organic acids on crude oil-brine interfacial visco-elasticity and oil recovery in low-salinity waterflooding. Fuel 2016, 185, 151–163. [Google Scholar] [CrossRef]
- Chávez-Miyauch, T.E.; Lu, Y.; Firoozabadi, A. Low salinity water injection in Berea sandstone: Effect of wettability, interface elasticity, and acid and base functionalities. Fuel 2020, 263, 116572. [Google Scholar] [CrossRef]
- Alvarado, V.; Garcia-Olvera, G.; Hoyer, P.; Lehmann, T.E. Impact of Polar Components on Crude Oil-Water interfacial Film Formation: A Mechanisms for Low-Salinity Waterflooding. In Proceedings of the SPE Annual Technical Conference and Exhibition, Amsterdam, The Netherlands, 27–29 October 2014; SPE: Kuala Lumpur, Malaysia, 2014; pp. 3114–3128. [Google Scholar] [CrossRef]
- Mahmoudvand, M.; Javadi, A.; Pourafshary, P. Brine ions impacts on water-oil dynamic interfacial properties considering asphaltene and maltene constituents. Colloids Surf. Physicochem. Eng. Asp. 2019, 579, 123665. [Google Scholar] [CrossRef]
- Wang, X.; Liu, W.; Shi, L.; Zou, Z.; Ye, Z.; Wang, H.; Han, L. A comprehensive insight on the impact of individual ions on Engineered Waterflood: With already strongly water-wet sandstone. J. Pet. Sci. Eng. 2021, 207, 109153. [Google Scholar] [CrossRef]
- Emadi, A.; Sohrabi, M. Visual Investigation of Oil Recovery by Low Salinity Water Injection: Formation of Water Micro-Dispersions and Wettability Alteration. In Proceedings of the SPE Annual Technical Conference and Exhibition, New Orleans, LA, USA, 30 September–2 October 2013; SPE: Kuala Lumpur, Malaysia, 2013. [Google Scholar] [CrossRef]
- Maghsoudian, A.; Esfandiarian, A.; Kord, S.; Tamsilian, Y.; Soulgani, B.S. Direct insights into the micro and macro scale mechanisms of symbiotic effect of SO42−, Mg2+, and Ca2+ ions concentration for smart waterflooding in the carbonated coated micromodel system. J. Mol. Liq. 2020, 315, 113700. [Google Scholar] [CrossRef]
- Mahzari, P.; Sohrabi, M. Crude Oil/Brine Interactions and Spontaneous Formation of Micro-Dispersions in Low Salinity Water Injection. In Proceedings of the SPE Symposium on Improved Oil Recovery, Tulsa, OK, USA, 12–16 April 2014; Volume 2, pp. 731–745. [Google Scholar] [CrossRef]
- Collins, I.R. Holistic Benefits of Low Salinity Waterflooding. In Proceedings of the IOR 2011—16th European Symposium on Improved Oil Recovery, Cambridge, UK, 12–14 April 2011. [Google Scholar] [CrossRef]
- Rahimi, A.; Safari, M.; Honarvar, B.; Chabook, H.; Gholami, R. On time dependency of interfacial tension through low salinity carbonated water injection. Fuel 2020, 280, 118492. [Google Scholar] [CrossRef]
- Ghorbanizadeh, S.; Rostami, B. Surface and Interfacial Tension Behavior of Salt Water Containing Dissolved Amphiphilic Compounds of Crude Oil: The Role of Single-Salt Ionic Composition. Energy Fuels 2017, 31, 9117–9124. [Google Scholar] [CrossRef]
- Sauerer, B.; Al-Hamad, M.; Ma, S.M.; Abdallah, W. Effect of formation water salinity on interfacial tension of reservoir fluids. J. Pet. Sci. Eng. 2021, 204, 108700. [Google Scholar] [CrossRef]
- Alotaibi, M.B.; Nasr-El-Din, H.A. Effect of Brine Salinity on Reservoir Fluids Interfacial Tension. In Proceedings of the EUROPEC/EAGE Conference and Exhibition, Amsterdam, The Netherlands, 8–11 June 2009; SPE: Kuala Lumpur, Malaysia, 2009. [Google Scholar] [CrossRef]
- Mokhtari, R.; Ayatollahi, S. Dissociation of polar oil components in low salinity water and its impact on crude oil–brine interfacial interactions and physical properties. Pet. Sci. 2019, 16, 328–343. [Google Scholar] [CrossRef]
- Golmohammadi, M.; Mohammadi, S.; Mahani, H.; Ayatollahi, S. The non-linear effect of oil polarity on the efficiency of low salinity waterflooding: A pore-level investigation. J. Mol. Liq. 2022, 346, 117069. [Google Scholar] [CrossRef]
- Rostami, P.; Mehraban, M.F.; Sharifi, M.; Dejam, M.; Ayatollahi, S. Effect of water salinity on oil/brine interfacial behavior during low salinity waterflooding: A mechanistic study. Petroleum 2019, 5, 367–374. [Google Scholar] [CrossRef]
- Holmberg, K. Organic reactions in microemulsions. Curr. Opin. Colloid Interface Sci. 2003, 8, 187–196. [Google Scholar] [CrossRef]
- Mahzari, P.; Sohrabi, M.; Cooke, A.J.; Carnegie, A. Direct pore-scale visualization of interactions between different crude oils and low salinity brine. J. Pet. Sci. Eng. 2018, 166, 73–84. [Google Scholar] [CrossRef]
- Mahzari, P.; Sohrabi, M.; Facanha, J.M.F. The Decisive Role of Microdispersion Formation in Improved Oil Recovery by Low-Salinity-Water Injection in Sandstone Formations. SPE J. 2019, 24, 2859–2873. [Google Scholar] [CrossRef]
- Saad, A.M.; Aime, S.; Mahavadi, S.C.; Song, Y.-Q.; Yutkin, M.P.; Weitz, D.; Patzek, T.W. Adsorption of Polar Species at Crude Oil–Water Interfaces: The Chemoelastic Behavior. Langmuir 2022, 38, 6523–6530. [Google Scholar] [CrossRef] [PubMed]
- Garcia-Olvera, G.; Alvarado, V. Interfacial rheological insights of sulfate-enriched smart-water at low and high-salinity in carbonates. Fuel 2017, 207, 402–412. [Google Scholar] [CrossRef]
- Da Costa, A.A.; Trivedi, J.; Soares, J.; Rocha, P.; Costa, G.; Embiruçu, M. An experimental evaluation of low salinity water mechanisms in a typical Brazilian sandstone and light crude oil with low acid/basic number. Fuel 2020, 273, 117694. [Google Scholar] [CrossRef]
Figure 1.
The ternary diagram showing the brines used in this study.

Figure 2.
Comparative analysis of the literature review. Subplot (A) shows the relation between oil asphaltene content (wt.%) and IFT reduction. Subplot (B) shows the relation between total dissolved solids (ppm) and IFT reduction. Taken from Table 4.
Figure 2.
Comparative analysis of the literature review. Subplot (A) shows the relation between oil asphaltene content (wt.%) and IFT reduction. Subplot (B) shows the relation between total dissolved solids (ppm) and IFT reduction. Taken from Table 4.

Figure 3.
Literature review results of the relation between IFT reduction and recovery factor. Taken from Table 4.
Figure 3.
Literature review results of the relation between IFT reduction and recovery factor. Taken from Table 4.

Figure 4.
Comparative analysis of the experimental IFT reduction scenarios for each one of the samples. Each subplot shows a contour ternary diagram for the IFT reduction; the units of the scale are reduction rate (%). Subplot A shows sample (A) compared to DW IFT (26.14 mN/m). Subplot (B) shows sample B compared to DW IFT (17.37 mN/m).

Figure 5.
Comparative analysis of the literature review. Subplot (A) shows the relation between oil asphaltene content (wt.%) and microemulsion generation. Subplot (B) shows the relation between total dissolved solids (ppm) and microemulsion generation. Taken from Table 6.
Figure 5.
Comparative analysis of the literature review. Subplot (A) shows the relation between oil asphaltene content (wt.%) and microemulsion generation. Subplot (B) shows the relation between total dissolved solids (ppm) and microemulsion generation. Taken from Table 6.

Figure 6.
Literature review results of the relation between microemulsion generation and recovery factor. Taken from Table 6.
Figure 6.
Literature review results of the relation between microemulsion generation and recovery factor. Taken from Table 6.

Figure 7.
Comparative analysis of the microemulsion generation scenarios for each one of the samples. Each subplot figure shows a contour ternary diagram for the microemulsion generation in sample A; the units of the scale are phase volume fraction (%). Subplot (A) for sample A and subplot (B) for sample B.

Figure 8.
Comparative analysis of the literature review. Subplot (A) shows the relation between oil asphaltene content (%wt.) and G′ increase. Subplot (B) shows the relation between total dissolved solids (ppm) and G′ increase. Taken from Table 8.
Figure 8.
Comparative analysis of the literature review. Subplot (A) shows the relation between oil asphaltene content (%wt.) and G′ increase. Subplot (B) shows the relation between total dissolved solids (ppm) and G′ increase. Taken from Table 8.

Figure 9.
Literature review results of the relation between G′ increase and recovery factor. Taken from Table 8.
Figure 9.
Literature review results of the relation between G′ increase and recovery factor. Taken from Table 8.

Figure 10.
Comparative analysis of storage modulus scenarios for each one of the samples. Each subplot shows a contour ternary diagram for the storage modulus (G′) of sample A at shear strain 0.1 and angular frequency of 1; the units of the scale are Pascal (Pa). Subplot (A) for sample A and subplot (B) shows sample B where µ indicates 10−6.

Figure 11.
Comparative analysis of the fluid/fluid mechanism. Comparative analysis of fluid/fluid mechanisms, illustrating the range of work of each one of the variables, providing valuable insights into the behavior of the system. Subplot (A) shows a box plot with the range of change in IFT. Subplot (B) shows a box plot with the range of the storage modulus. Subplot (C) shows a box plot with the range of the microemulsion ratio. Data from Table 4, Table 5, Table 6, Table 7 and Table 8.

Figure 12.
Comparative analysis of the concentration for different ion groups affecting IFT reduction, illustrating the range of work of each one of the variables, providing valuable insights into the behavior of the system. Subplot (A) shows a box plot with the range of monovalent ion concentrations that had an effect. Subplot (B) shows a box plot with the range of divalent ion concentrations that had an effect. Subplot (C) shows a box plot with the range of sulfate ion concentrations that had an effect. Data from Table 4, Table 5, Table 6, Table 7 and Table 8.

Table 1.
Oil characteristics.
| Sample Name | Density (g/cc) | Kinematic Viscosity (cSt) | Dynamic Viscosity (cP) |
|---|---|---|---|
| Sample A (@20C) | 0.857 | 50.7 | 43.40 |
| Sample B (@63C) | 0.823 | 11.4 | 9.41 |
Table 2.
Salt properties.
| Required Salt | Chemical Formula | Purity |
|---|---|---|
| Sodium Cloride | NaCl | ≥99.9 |
| Sodium Sulfate | Na2SO4 | ≥99.9 |
| Magnesium Cloride hexahydrated | MgCl2 6H2O | ≥99.9 |
Table 3.
Properties and composition of the brine used in this study.
| # of the Brine. | NaCl (mg/L) | MgCl2 6H2O (mg/L) | Na2SO4 (mg/L) | Ionic Strength (M) | Density (g/cc) |
|---|---|---|---|---|---|
| DW | 0 | 0 | 0 | 0 | 1.0000 |
| Brine 1 | 5000 | 0 | 0 | 0.18 | 1.0028 |
| Brine 2 | 0 | 5000 | 0 | 0.55 | 1.0050 |
| Brine 3 | 0 | 0 | 5000 | 0.32 | 1.0030 |
| Brine 4 | 2500 | 0 | 2500 | 0.25 | 1.0022 |
| Brine 5 | 2500 | 2500 | 0 | 0.37 | 1.0025 |
| Brine 6 | 0 | 2500 | 2500 | 0.44 | 1.0019 |
| Brine 7 | 2500 | 1250 | 1250 | 0.31 | 1.0019 |
| Brine 8 | 1250 | 2500 | 1250 | 0.40 | 1.0032 |
| Brine 9 | 1250 | 1250 | 2500 | 0.34 | 1.0019 |
| Brine 10 | 1700 | 1650 | 1650 | 0.35 | 1.0031 |
Table 4.
IFT studies referenced.
| SARA | ION CONCENTRATION | ||||||||||||||
|---|---|---|---|---|---|---|---|---|---|---|---|---|---|---|---|
| References | Sat. (wt. %) | Aro. (wt. %) | Res. (wt. %) | Asph. (wt. %) | TAN (mg KOH) | TDS (mg/L) | Na+ (mg/L) | K+ (mg/L) | Ca2+ (mg/L) | Mg2+ (mg/L) | SO42− (mg/L) | IFT (mN/m) | IFT Change (%) | RF (%) | RF EOR Change (%) |
| (Kakati et al., 2020) [19] | 0.12 | 18,665.6 | 5545 | 1003 | 245 | 11.39 | 36 | ||||||||
| (Farhadi, et al., 2021) [13] * | 63.96 | 25.33 | 9.06 | 1.65 | 0.14 | 37,012.5 | 21,300 | 600 | 1350 | 10,297.5 | 3367.5 | 5 | 44 | ||
| (Rahimi et al., 2020) [32] | 51.35 | 30.28 | 9.78 | 8.59 | 35,000 | 6500 | 6500 | 419 | 1304 | 146 | 15 | 35 | |||
| (Kakati and Sangwai, 2017) [15] | 3000 | 3000 | 30.97 | 12 | |||||||||||
| (Moeini et al., 2014) [17] | 30.1 | 42.1 | 13.36 | 13.75 | 0.06 | 40,000 | 40,000 | 12 | 37 | ||||||
| (Ghorbanizadeh and Rostami, 2017) [33] * | 32.44 | 41.36 | 13.56 | 12.64 | 2.07 | 35,511 | 35,511 | 19 | 63 | ||||||
| (Sauerer et al., 2021) [34] | 100,000 | 4.7 | 46 | ||||||||||||
| (Lashkarbolooki, et al., 2016) [18] * | 1.46 | 43,336 | 7156 | 7156 | 479 | 1626 | 3029 | 14 | |||||||
| (Alotaibi and Nasr-El-Din, 2009) [35] | 50,000 | 50,000 | 42 | 5 | |||||||||||
| (Mokhtari and Ayatollahi, 2019) [36] * | 0.6 | 0.14 | 4162 | 2842 | 82 | 138 | 642 | 448 | 16 | 26 | |||||
| (Lashkarbolooki, et al., 2018) [20] * | 11 | 13 | 1.46 | 43,336 | 7156 | 7156 | 479 | 1626 | 3029 | 5 | 19 | ||||
| (Chai et al., 2021) [14] | 51.82 | 29.36 | 16.77 | 2.05 | 0.18 | 2105.41 | 512.62 | 24.15 | 44 | 125.7 | 100.6 | 14 | 26 | 46 | 2 |
| (Kakati, et al., 2020) [19] | 0.12 | 8188 | 2952 | 300 | 990 | 522 | 8.92 | 43 | 54 | 8 | |||||
| (Mokhtari, et al., 2019) [12] * | 0.6 | 0.14 | 4162 | 2842 | 82 | 642 | 138 | 448 | 10.33 | 50 | 82 | 20 | |||
| (Tetteh and Barati, 2019) [16] | 0.73 | 0.17 | 32,895 | 9600 | 100 | 2200 | 560 | 0 | 11.5 | 49 | 45 | 9 | |||
| (Golmohammadi et al., 2022) [37] | 63.96 | 25.33 | 9.06 | 1.65 | 0.14 | 5000 | 5000 | 12.5 | 29 | 75 | |||||
| (Wang et al., 2021) [27] | 31.63 | 38.78 | 8.66 | 20.93 | 1000 | 324 | 676 | 10.5 | 14 | 61 | 6 | ||||
| (Rostami et al., 2019) [38] * | 0.2 | 20,800 | 14,200 | 690 | 3215 | 2245 | 8.7 | 53 | |||||||
* Indicates that the research provides the total salt concentration (ppm.) rather than the ion concentration (ppm.).
Table 5.
IFT measurements for both samples at different brine concentrations.
| Sample A | Sample B | |||
|---|---|---|---|---|
| # of the Brine. | IFT (mN/m) | Bond Number | IFT (mN/m) | Bond Number |
| DW | 26.140 | 0.6706 | 17.367 | 0.9245 |
| Brine 1 | 21.617 | 0.6327 | 14.997 | 0.977 |
| Brine 2 | 22.503 | 0.6299 | 12.050 | 0.8688 |
| Brine 3 | 20.470 | 0.6333 | 15.090 | 0.8258 |
| Brine 4 | 15.780 | 0.8918 | 10.530 | 0.8096 |
| Brine 5 | 9.243 | 0.8918 | 15.447 | 0.8976 |
| Brine 6 | 8.597 | 0.8973 | 12.667 | 0.8519 |
| Brine 7 | 21.563 | 0.6057 | 11.420 | 0.8276 |
| Brine 8 | 6.613 | 0.9313 | 15.513 | 0.8037 |
| Brine 9 | 11.167 | 0.8631 | 11.460 | 0.8434 |
| Brine 10 | 9.887 | 0.9295 | 13.203 | 0.6592 |
Table 7.
Microemulsions measurements for both samples at different brine concentrations.
| Sample A | Sample B | |||
|---|---|---|---|---|
| # of the Brine. | Type | Phase Volume Fraction (%) | Type | Phase Volume Fraction (%) |
| DW | Lower | 50% | Lower | 50% |
| Brine 1 | Upper | 48% | Lower | 52% |
| Brine 2 | Upper | 49% | Lower | 50% |
| Brine 3 | Upper | 47% | Upper | 50% |
| Brine 4 | Upper | 46% | Lower | 50% |
| Brine 5 | Upper | 48% | Lower | 50% |
| Brine 6 | Upper | 49% | Lower | 65% |
| Brine 7 | Upper | 48% | Lower | 62% |
| Brine 8 | Upper | 46% | Lower | 60% |
| Brine 9 | Upper | 47% | Lower | 65% |
| Brine 10 | Upper | 48% | Lower | 50% |
Table 8.
Viscoelastic behavior studies referenced.
| SARA | ION CONCENTRATION | ION CONCENTRATION | |||||||||||||
|---|---|---|---|---|---|---|---|---|---|---|---|---|---|---|---|
| Reference | Sat. (wt. %) | Aro. (wt. %) | Res. (wt. %) | Asph. (wt. %) | TAN (mg KOH) | TDS (mg/L) | Na+ (mg/L) | K+ (mgL) | Ca2+ (mg/L) | Mg2+ (mg/L) | SO42− (mg/L) | Elastic Mod. (mN/m) | Change in Elastic Mod. (%) | RF (%) | RF EOR Change (%) |
| (Saad et al., 2022) [42] * | 38.3 | 19.8 | 36.6 | 3.97 | 1.19 | 14,204 | 14,204 | 25 | 4 | ||||||
| (Chávez-Miyauch, et al., 2020) [24] | 0.124 | 1000 | 1000 | 81.3 | 302 | 82 | 25 | ||||||||
| (Tetteh and Barati, 2019) [16] | 0.73 | 0.17 | 32,895 | 9600 | 100 | 2200 | 560 | 0 | 12 | 500 | 42 | 11 | |||
| (Garcia-olivera and Alvarado, 2017) [43] | 36.3 | 36.11 | 8.59 | 18.99 | 36,600 | 8700 | 12.5 | 150 | 50 | 9 | |||||
| (Wang et al., 2021) [27] | 31.63 | 38.78 | 8.66 | 20.93 | 1000 | 324 | 676 | 42.5 | 750 | 63 | 13 | ||||
| (Chai et al., 2021) [14] | 51.82 | 29.36 | 16.77 | 2.05 | 0.18 | 2105.41 | 512.62 | 24.15 | 44 | 125.7 | 100.6 | 24 | 140 | 46 | 2 |
| (Alvarado et al., 2014) [25] | 33.4 | 49.9 | 9 | 7.6 | 9551 | 3184 | 6367 | 110 | 144 | 50 | 9 | ||||
| (Bidhendi et al., 2018) [21] | 5 | 955 | 318 | 637 | 47.5 | 428 | 81 | 29 | |||||||
| (Mahmoudvand, et al., 2019) [26] | 38.99 | 50.59 | 4.25 | 6.17 | 9521 | 3184 | 27.5 | 10 | |||||||
| (Mohamed and Alvarado, 2017) [10] | 33.4 | 49.9 | 9 | 7.6 | 29670 | 14,500 | 41 | 37 | 55 | 5 | |||||
* Indicates that the research provides the total salt concentration (ppm.) rather than the ion concentration (ppm.).
Table 9.
Viscoelastic behavior measurements for both samples at different brine concentrations.
| Sample A | Sample B | |||
|---|---|---|---|---|
| # of the Brine. | G′ (Pa) | Complex µ (mPa.s) | G′ (Pa) | Complex µ (mPa.s) |
| DW | 7.109 | 1179.600 | 1.03 × 10⁻³ | 20.730 |
| Brine 1 | 5.435 | 963.970 | 1.50 × 10⁻⁵ | 30.149 |
| Brine 2 | 27.868 | 4410.700 | 1.39 × 10⁻⁵ | 27.879 |
| Brine 3 | 13.802 | 2216.200 | 1.16 × 10⁻⁵ | 23.332 |
| Brine 4 | 10.045 | 1624.900 | 1.32 × 10⁻⁵ | 26.446 |
| Brine 5 | 6.413 | 1144.300 | 1.27 × 10⁻⁵ | 25.475 |
| Brine 6 | 14.943 | 2702.900 | 1.34 × 10⁻⁵ | 26.870 |
| Brine 7 | 12.984 | 1918.700 | 1.71 × 10⁻⁵ | 24.418 |
| Brine 8 | 1.910 | 348.480 | 2.29 × 10⁻⁵ | 45.919 |
| Brine 9 | 5.794 | 1101.200 | 1.32 × 10⁻⁵ | 26.487 |
| Brine 10 | 4.146 | 953.660 | 1.37 × 10⁻⁵ | 27.510 |
| Sample A | Sample B | |
|---|---|---|
| IFT reduction | Brine 6 and Brine 8 | Brine 4, Brine 9, and Brine 10 |
| Microemulsion generation | Brine 8, Brine 9, and Brine 10 | Brine 7, Brine 8, and Brine 9 |
| G′increase | Brine 2, Brine 3, Brine 5, Brine 6, Brine 8, and Brine 9 | Brine 5 and Brine 8 |
| Best brine | Brine 8 | Brine 8 and Brine 9 |
Disclaimer/Publisher’s Note: The statements, opinions and data contained in all publications are solely those of the individual author(s) and contributor(s) and not of MDPI and/or the editor(s). MDPI and/or the editor(s) disclaim responsibility for any injury to people or property resulting from any ideas, methods, instructions or products referred to in the content. |
© 2024 by the authors. Licensee MDPI, Basel, Switzerland. This article is an open access article distributed under the terms and conditions of the Creative Commons Attribution (CC BY) license (https://creativecommons.org/licenses/by/4.0/).
Share and Cite
MDPI and ACS Style
Villero-Mandon, J.; Pourafshary, P.; Riazi, M. Oil/Brine Screening for Improved Fluid/Fluid Interactions during Low-Salinity Water Flooding. Colloids Interfaces 2024, 8, 23. https://0-doi-org.brum.beds.ac.uk/10.3390/colloids8020023
AMA Style
Villero-Mandon J, Pourafshary P, Riazi M. Oil/Brine Screening for Improved Fluid/Fluid Interactions during Low-Salinity Water Flooding. Colloids and Interfaces. 2024; 8(2):23. https://0-doi-org.brum.beds.ac.uk/10.3390/colloids8020023
Chicago/Turabian StyleVillero-Mandon, Jose, Peyman Pourafshary, and Masoud Riazi. 2024. "Oil/Brine Screening for Improved Fluid/Fluid Interactions during Low-Salinity Water Flooding" Colloids and Interfaces 8, no. 2: 23. https://0-doi-org.brum.beds.ac.uk/10.3390/colloids8020023