1. Introduction
A distributed video surveillance system consists of interconnected cameras that share information in specific environments for monitoring the human activities, motion detection, behavior, and interaction between individuals through the tracking of moving objects [
1,
2,
3,
4], thus providing great versatility in obtaining information for analyzing the acquired data. One of the main purposes of the distributed camera system is to provide an automatic interpretation of the scenes and predict the interactions of the objects; however, there are different factors that can provide an automatic understanding of the scenes and predict the interactions of the objects. Some of the different factors to consider when acquiring information about a specific scenario are the characteristics of the cameras available, the position, and the number of cameras [
5,
6]. One of the significant factors to consider when installing a video surveillance system is that, when increasing the number of cameras, the coverage area increases, and so does the amount of information to manipulate. Every day, we are exposed to different types of surveillance carried out with devices that constantly generate video data [
2,
7]. According to the analyses carried out by [
8,
9], the increase in information obtained by video surveillance devices has grown exponentially to the point that up to 100 GB in data is acquired for each video surveillance camera in a monthly period. Particularly, IntelliVision have deployed more than four million surveillance cameras [
10]. In video surveillance systems, various challenges must be met to achieve the interconnection and exchange in information from one point to another through different functional units such as cameras, means of sending information, and storage units. With an increase in distributed systems, it is necessary to propose or apply architectures that help to achieve interoperability between the different existing elements, such as sensors and actuators, to facilitate the sending and reception of data. Some works, such as [
11,
12,
13,
14,
15], describe different middleware architectures to carry out the exchange in data and use of information in addition to describing the elements that influence successful interoperability between different sources of information, such as the communication medium, programming techniques, software architecture, sensors, semantics, and adaptive control, among others.
The most common use of the information obtained from a distributed camera system is motion detection and the tracking of objects of interest [
3]. Distributed camera systems have proven useful as a passive means of detecting events or situations of interest; for example, the detection of an atypical behavior [
16,
17,
18], the evolution of the dynamics of movement of an object in time [
19,
20,
21], target tracking for surveillance applications [
3,
22,
23,
24,
25,
26,
27], and tridimensional reconstruction [
28,
29,
30]. Other important works are [
16,
31,
32,
33,
34,
35]. These works have already shown that they are useful for recognizing events of interest in a defined context. However, it has been observed that the complexity of these approaches increases considerably when the local dynamics are very complicated [
36] or when there is a distributed system of cameras [
37]. Many authors have proposed different methodologies and tools to automatically or semi-automatically detect atypical events in a monitored area. Currently, the high quality and high rate of image acquisitions per second are more frequently used in video surveillance systems, for which increasingly innovative methods are being presented to find motion primitives that help to interpret the activities raised in the stage [
38].
Due to the diversity of approaches that exist, the fusion of information is a complex task due to the parameters each one requires and the results each delivers.
Table 1 shows a table that represents the heterogeneity in the results when applying different object-tracking methods [
39].
Most of the works focused on automated video surveillance can be split into two main approaches: (1) Surveillance system model techniques, where different approaches are concerned with the integration of various vision algorithms to build a completed surveillance system; (2) Distribution, communication, and system design, where it is analyzed how such methods need to be integrated into large systems to mirror the needs of practical closed-circuit television (CCTV) installations in the future.
When applying methods to obtain the characteristics of interest from the data, the displayed information must have visual support when interpreting the patterns obtained. Visualization is the best way to convert a large amount of information into small spaces that allow a quick and efficient interpretation of results [
40]. According to works such as [
41], data visualization must undergo seven steps: acquisition, grammatical analysis, filtering, data mining, representation, and representation improvement and interaction (within the representation part). Works such as [
42,
43,
44,
45] indicate that visualization depends on the amount of data, the information to be displayed, the homogeneity or heterogeneity of the data, the representation medium, and the dimensionality of the data. A good visualization technique and the right technologies can turn abstract information into a visual representation that can be decoded more easily, efficiently, and meaningfully [
46]. Currently, with the technological advances in recent years, new information visualization alternatives, called interactive technologies, have emerged. These seek to form a three-dimensional representation that can be captured within the real world through the projection of data, the creation of virtual scenarios that resemble what exists in the real world, and the display of information through conventional devices—such as cell phones or tablets and cellphone gadgets—which turn these technologies into tools where users can interact with the information [
43,
47,
48,
49]; an example of these interactive technologies are augmented and virtual reality systems.
In particular, augmented reality is a technology of great interest due to the representation of information. Augmented reality is an interactive technology that allows computer-generated three-dimensional objects to be added to the real world through a viewing device such as a monitor, a cell phone, or more specialized devices such as augmented reality glasses or headsets. This technology emerged in the late 60s [
50,
51]; however, it has been widely used for about a decade due to the technological advances that facilitate its visualization. One of the characteristics that arouses the most significant interest is the improvement in user perception and interaction with the real world [
52]. Among the most essential characteristics of its development are the following [
50]:
Since it is an interactive technology, it manipulates information from visualization in the real world, therbey representing the information of interest for a different interpretation of the data. Many applications can find uses in different sectors such as medicine [
53], industry [
54], education [
55], video games [
56], tourism [
57], and marketing [
58].
This work aims to show the feedback of the heterogeneous historical information stored in a data repository generated from a distributed camera system by applying different motion detection methods. The proposal of homogeneity of heterogeneous information for its comparison and visualization is given by the generation of a global space where feedback is achieved. This generates a reference trajectory obtained from the global space with the help of an augmented reality system, which is compared with the data repository allowing the proposal of a new metric to form queries from heterogeneous information. The results are then finally shown in real environments through augmented reality using a client–server model.
2. Methodology
The states of this work can be summarized as follows:
2.1. Detection of Movement Dynamics
In the literature, several works have proposed different methodologies and tools to automatically or semi-automatically detect information of interest such as contours, trajectories, and characteristic extraction to represent objects of interest or abnormal behavior. For example, Hugo Jimenez et al. [
32] proposed an unsupervised approach to detect the atypical behaviors of vehicles at intersections; in [
16], the movement of vehicles was encoded as a set of finite states generating hierarchical rules that are associated with normal behaviors in a scenario; in [
39], the authors described the basic methods for motion detection and object tracking in video systems in addition to describing the steps required to carry out this process. There are three steps for this: the detection of the object of interest (people, vehicles, birds, etc.), classification, and the tracking of the object. For object detection, the methods that are most frequently used in the literature are mentioned: image difference, background subtraction, and optical flow.
In distributed monitoring systems, it is common for each camera to have a particular method applied; this is identified as a model, which helps to interpret the dynamics in specific scenarios. Each model generates historical information ; however, for a couple of models , , for an instant in time t, it is known that . This means that the information is not comparable; therefore, searches or data queries require that an model contain a transformation. This transformation is defined as .
This work aims to show the feedback of the heterogeneous historical information stored in a data repository that was generated from a distributed camera system by applying different motion detection methods. Motion dynamics detection aims to represent objects of interest with a set of pixels on a sequence of images [
59].
Table 2 shows some of the models widely used in the literature for detecting the movement dynamics of objects of interest [
39,
60].
It is known that, by applying an model to the information provided by a camera, results can be obtained that allow feedback on what has happened or is happening in a specific scenario. Based on this idea, by combining the results of different models, the information can be complemented to better interpret the dynamics generated by the objects of interest. The latter can only be achieved if a way is defined to homogenize the information from different models.
This work proposes a way through which to homogenize the information of different models, defining a global space where all the trajectories can be mapped regardless of the model used to obtain the dynamics of movement of objects of interest (the objects of interest in the models are people who are moved from one point to another within the viewing area of a distributed two-camera system). A different model is applied to each camera to detect movement dynamics, temporal differences [
32], and Gaussian mixtures [
61]. In particular, temporal differences is a model that is tolerant to light changes [
32], whereas Gaussian mixture is a widely used model with static cameras [
62]. The movement dynamics of the objects were stored in an independent data repository for each camera.
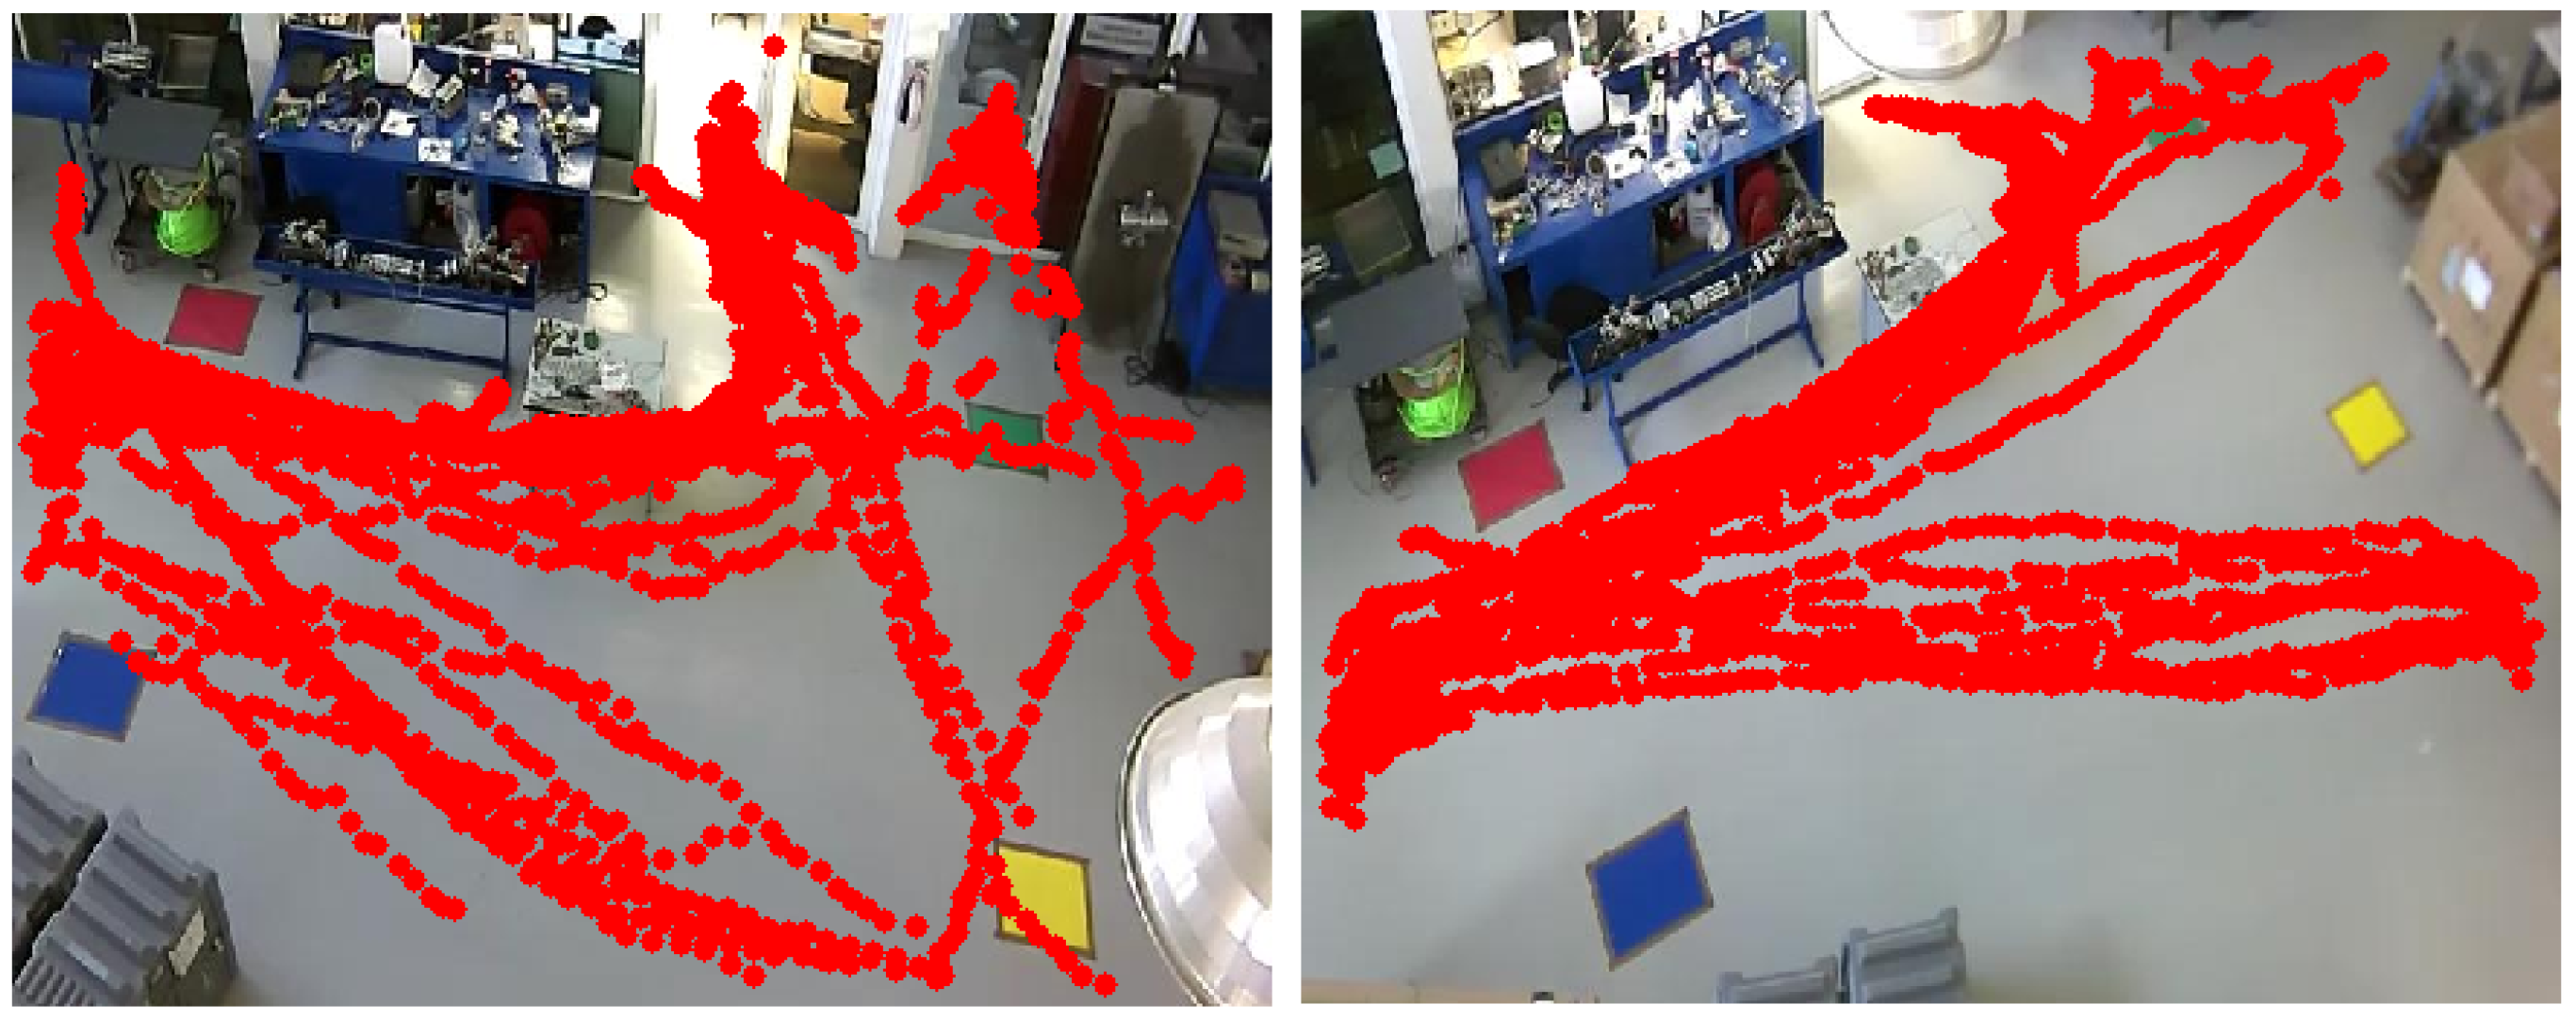
Figure 1 shows the movement dynamics generated by the objects of interest. Only one part of each video captured by each camera was analyzed, whereas for Camera 1, the temporal differences model was applied, and 38 trajectories were generated. In contrast, for Camera 2, the Gaussian mixture model was applied, and 22 trajectories were generated. These trajectories that were used for the acquisition of information are expressed in pixels.
2.2. Common Global Space
A common global space can be defined as where information becomes homogeneous, thus allowing for comparison and manipulation. Different ways through which to obtain equivalences exist in artificial vision systems with different workspaces. To obtain equivalences of the information provided by different cameras, a process that can be divided into two aspects must be generated. The first is through a calibration process where the intrinsic and extrinsic parameters of the cameras are considered; this also requires a pattern, or elements within the scenario, that allows for characteristics to be extracted, the same ones from which, by applying a transformation, equivalences are obtained between the information obtained by the cameras expressed in pixels and the real-world information commonly expressed in millimeters or centimeters. The second is to obtain equivalences without a calibration process. A linear transformation is applied through homography, which is based on the information extracted from the scenario that can be taken from active or passive marks.
In this work, it is necessary to define the global space and its units of measurement to create a unified space. The global space becomes defined in a global position and local orientation. The global position is given by the UTM coordinates of the building. The center of the building represents the origin. The UTM ID is then used to store the information in DB. Each camera becomes linked to this origin by the projection of a local homograph. As a linear transformation, the homograph becomes constructed by active color markers in the scenario. These markers are associated with all cameras used, and the colors are used to orientate the camera direction in the scenario. Then, all camera positions are indexed and stored relative to the origin.
The global space is expressed with two-dimensional coordinates. The transformation is carried out using the information obtained by each camera, which contains all the information expressed in centimeters to make queries that can provide feedback through visualizations in augmented reality in the real world.
To obtain the equivalences between the 2D or 3D coordinates of two different spaces [
63], a linear projective transformation is estimated using homography on a homogeneous vector of
, which is represented by a non-singular matrix of
.
In other words .
To map the spaces generated by each camera to the common global space, several common points, which were defined as active marks, were installed (rectangles: red, yellow, green, and blue), as shown in
Figure 2.
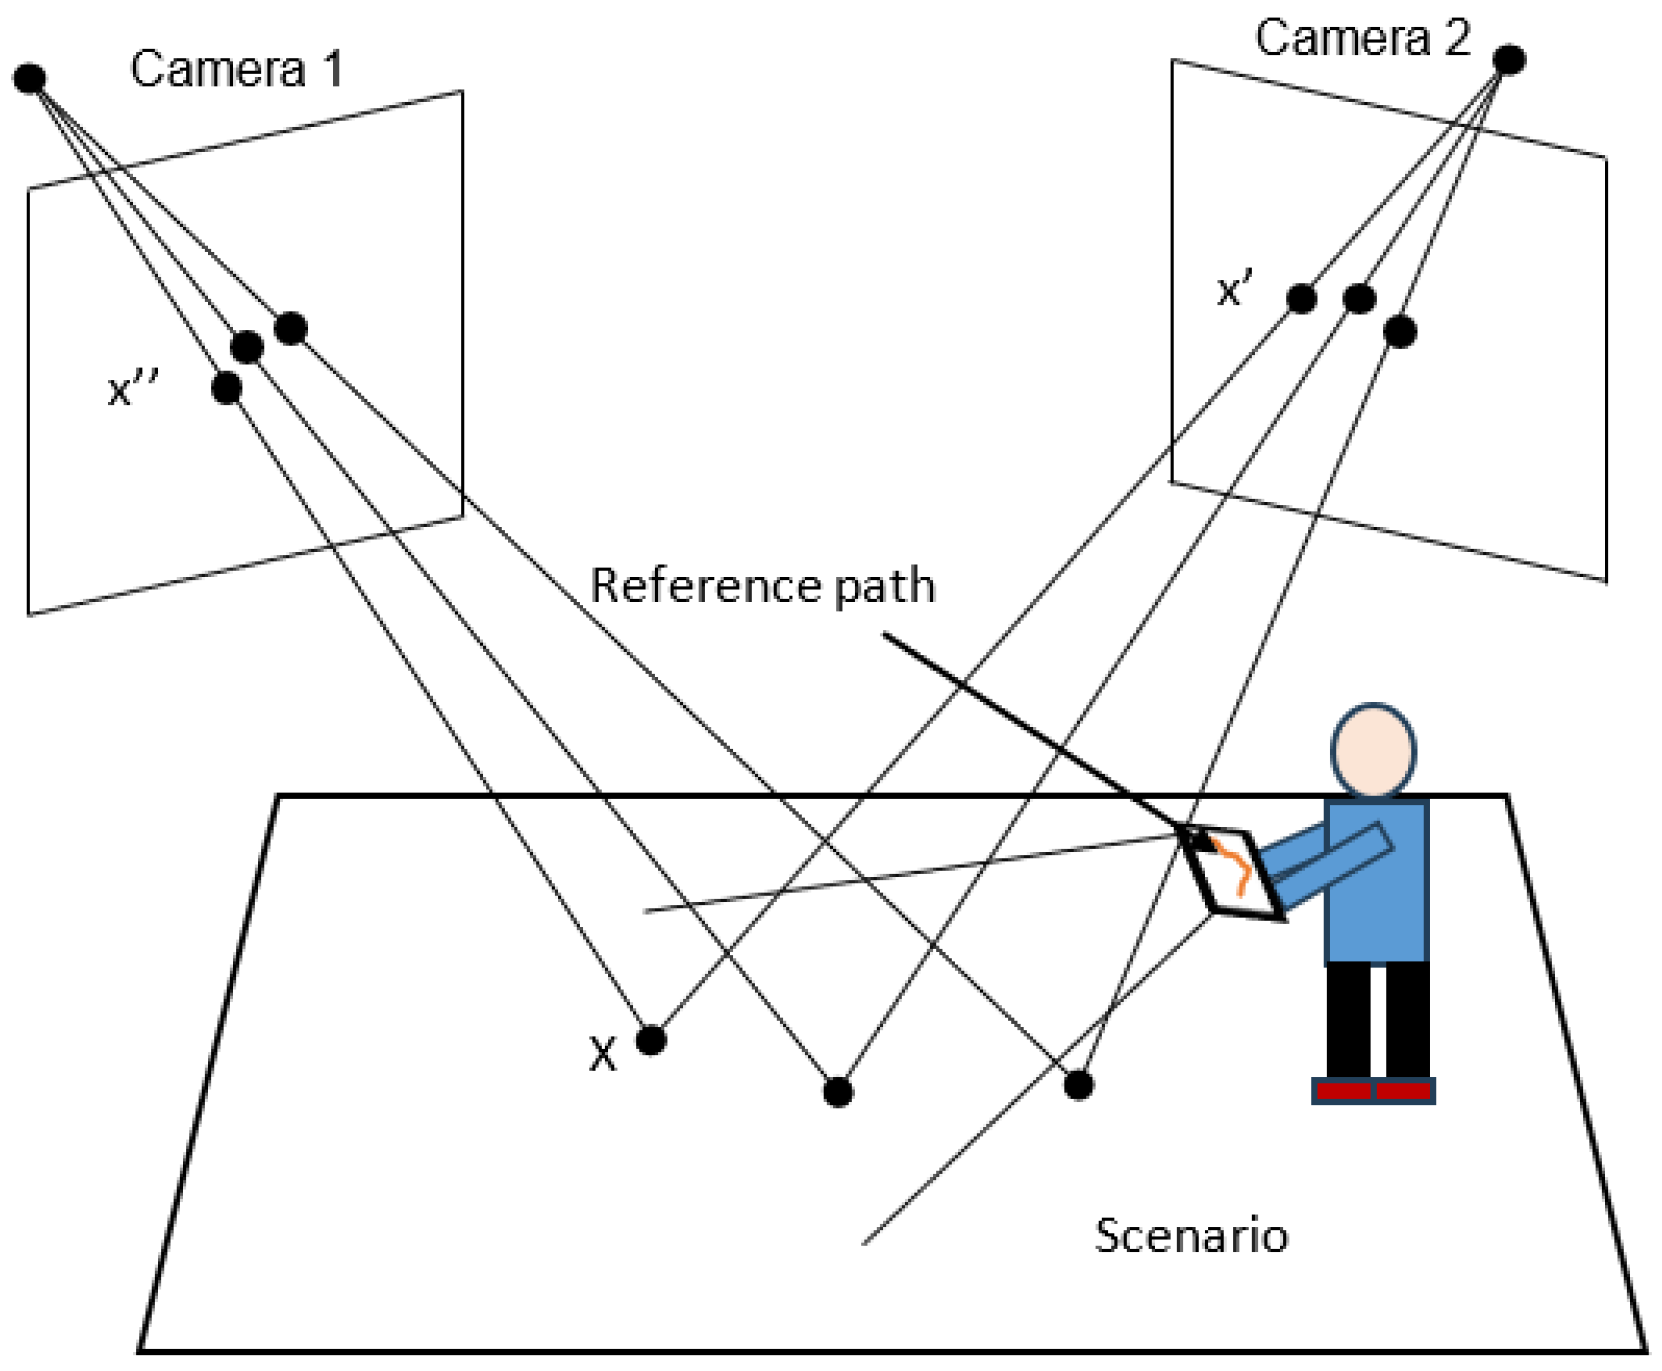
A representation of the distributed system and the common points is shown in
Figure 3, where the colorful blocks represent the active marks called points of interest.
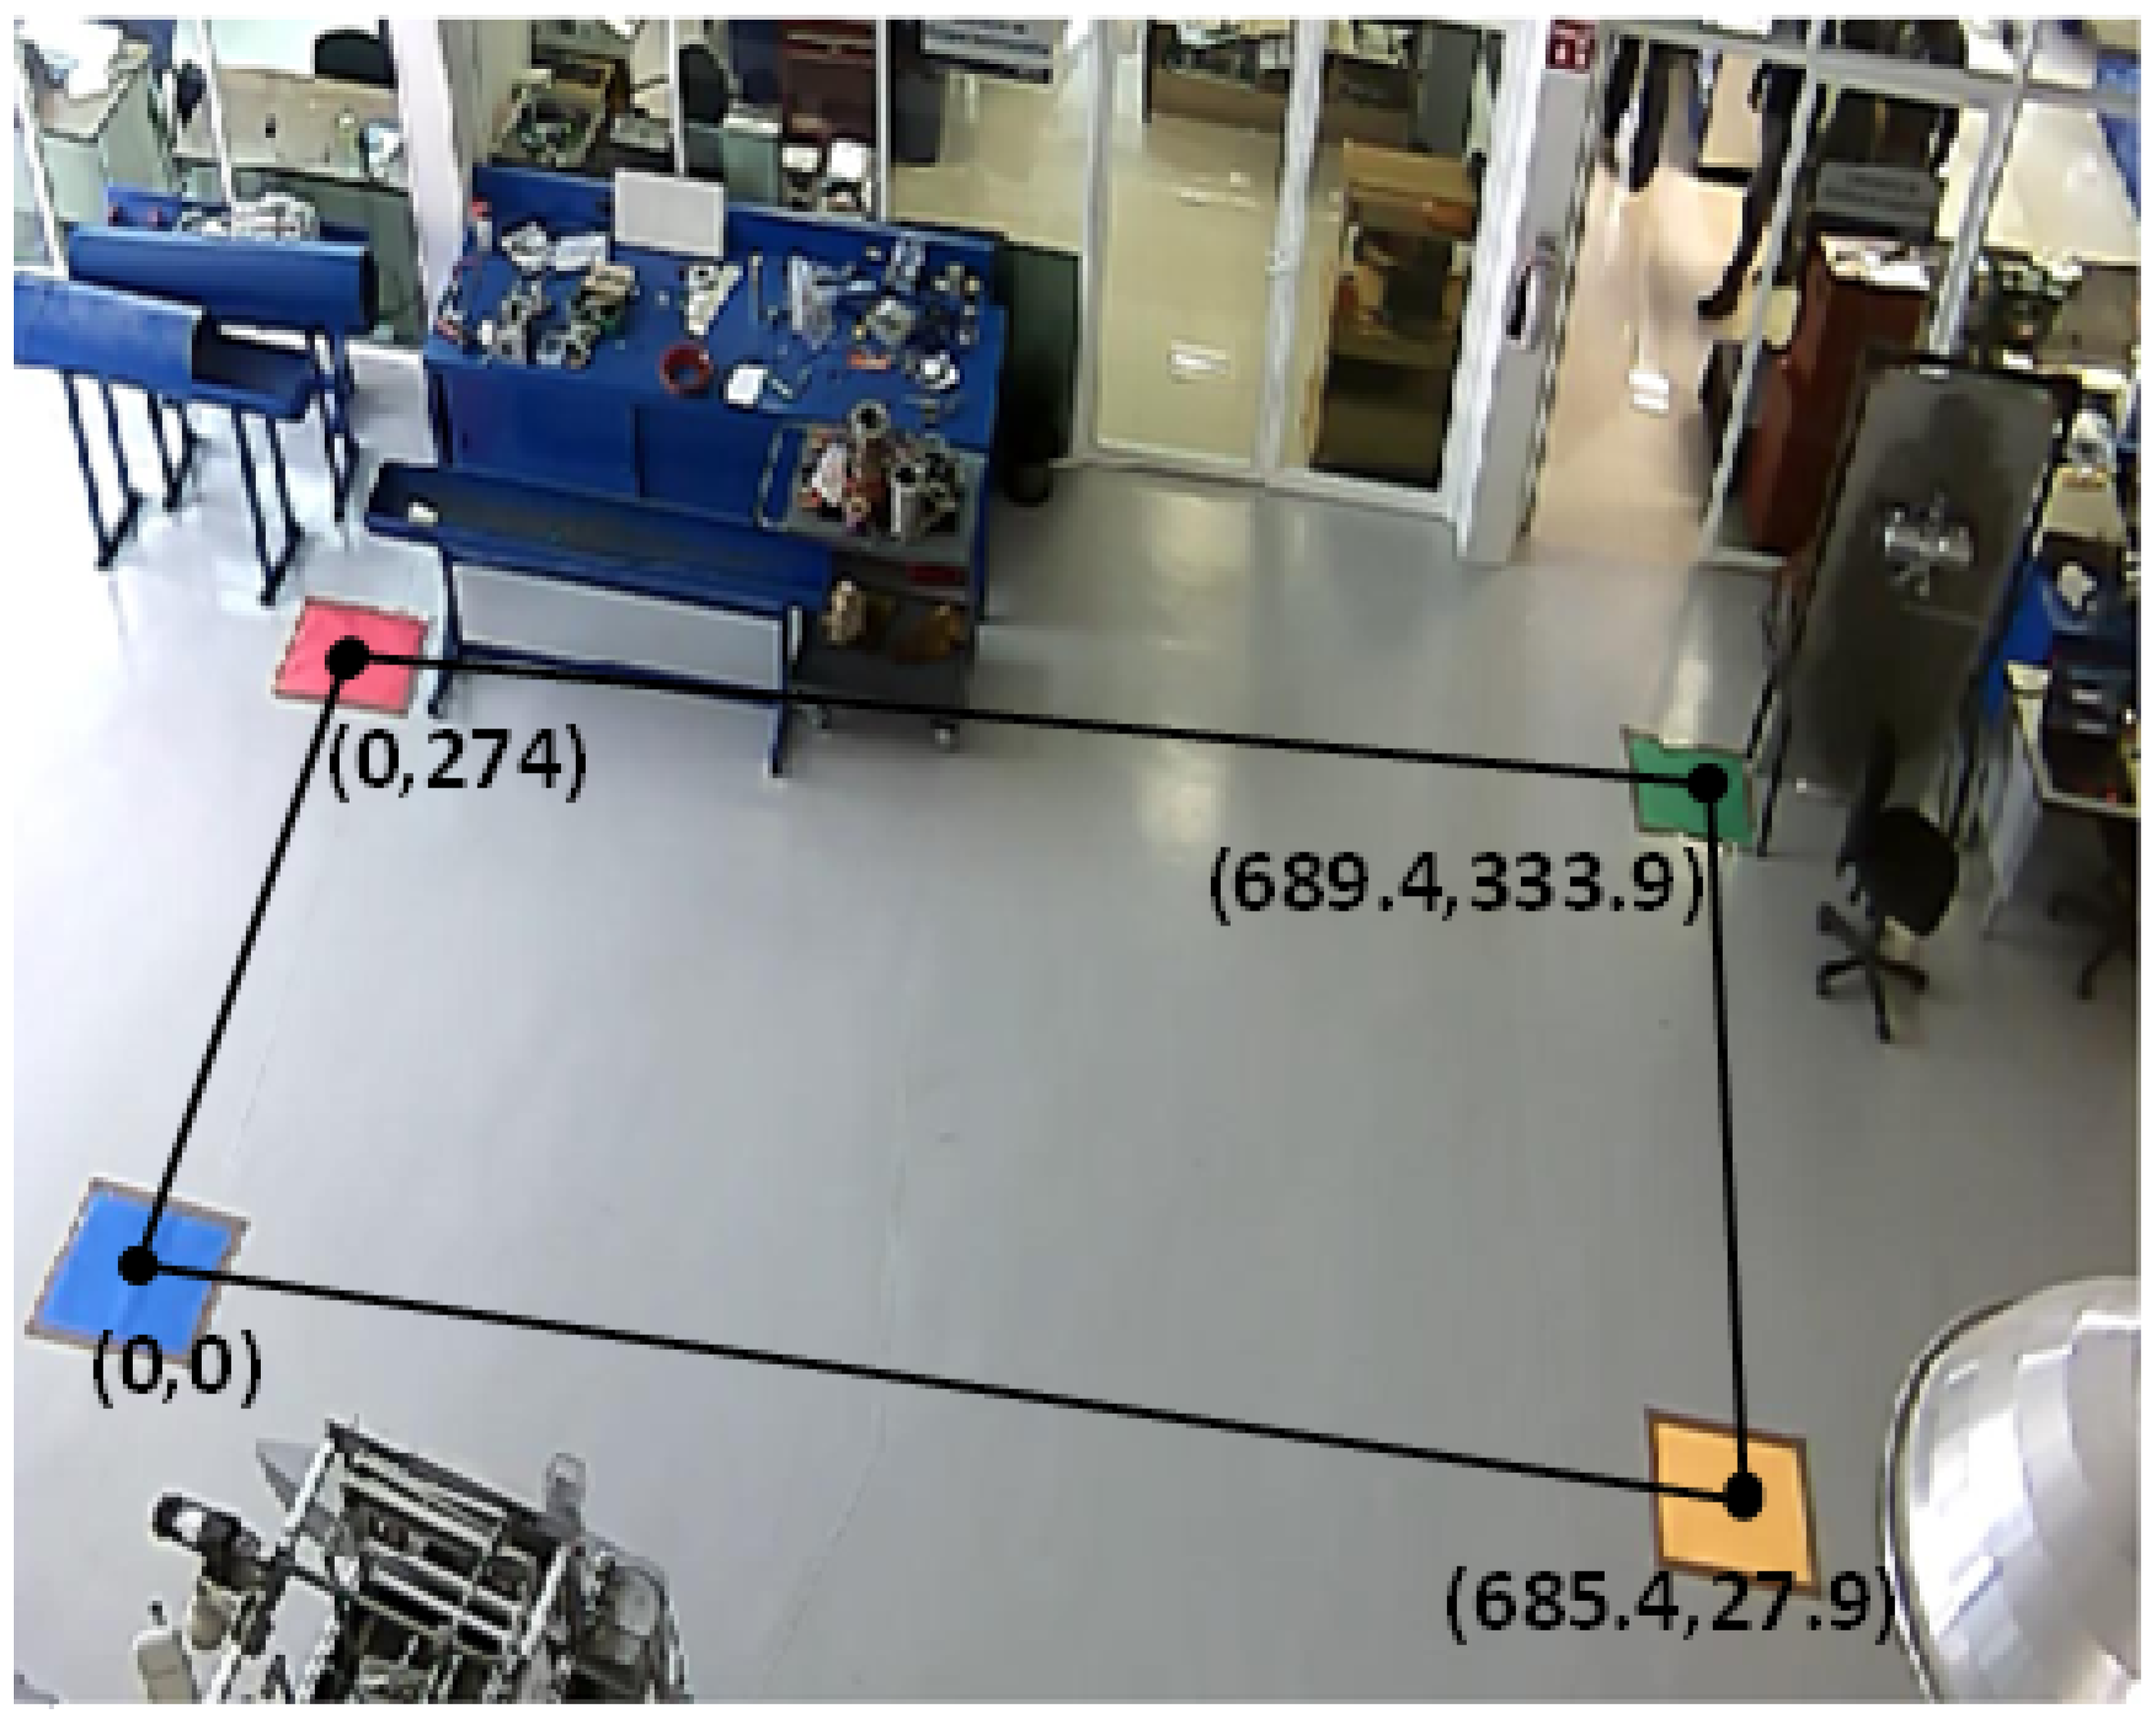
The centroid of each mark indicates the four reference coordinates for the transformation from each of the spaces generated by each camera to the global space, which is physically defined in the real world by measuring from one point to another, thus establishing the coordinates
at the centroid of the blue rectangle. The other physical measurements are shown through an image in
Figure 4; each physical measurement is expressed in centimeters.
A segmentation is carried out within the images obtained in each perspective to obtain the information used in the process of applying homography. Methods that are widely used in the literature were applied, such as morphological filters, area filters, and the detection of the central point of the objects of interest [
64] (rectangles: red, yellow, green, and blue).
Figure 5 shows the segmentation of the spaces of interest that are compared with the real coordinates.
The parameters defined up to this point allow for the application of the projective transformation for the generation of the global space where the trajectories found can be mapped using different methods for each camera. Trajectories, which are expressed in pixels, were obtained and, when mapping the global space, they become expressed in centimeters, thus defining the equivalence from one two-dimensional space to the other and leaving the trajectories in the global space, which are represented in
Figure 6.
Figure 6 shows the 60 trajectories used that were found in the videos. The scale goes on the “x” axis from approximately −200 cm to 1200 cm and on the “y” axis from −200 cm to around 800 cm. To be able to provide feedback through augmented reality, a 3D space is required; for this reason, and due to the equivalences on the “x” and “y” plane, the “z” axis was defined with a height constant of 100 cm. This is because what is analyzed in the present work is the dynamics generated by objects in motion on the planes of “x” and “y”.
3. Querying Trajectories
Query information is a process in which we seek to know the similarity between a reference and a data repository that allows us to simplify analysis in search of patterns or behaviors of interest. The process for performing the trajectory query depends on three essential factors: the trajectory that serves as a reference, the data repository that contains historical information, and a similarity measure.
In this work, to carry out queries, the generation of reference trajectories was compared with a data repository to determine the most similar ones and to be able to visualize them.
The generation of the reference trajectories was carried out from an augmented reality application in the global space. In this sense, a user generates a temporal trajectory from the application installed on a device (in this case, a tablet gadget); however, it is not exclusive to that device since devices with API 5.0 of the Android operating system or higher can run the application.
The application was developed in Unity3D, where all the trajectories of the moving objects were mapped to global space.
Figure 7 shows, in a general way, how the application works. First, the reference trajectory was created in global space, as shown in
Figure 8, and then the trajectory information was sent to a central unit that contains the data repository of the homogenized trajectories. In the same main unit, all the processing was carried out to calculate the similarity between the trajectories and to send the resulting information back to the application for viewing in the space where the information was acquired, that is, a client–server model was generated to send the data from the application to the central unit in both directions.
It is necessary to take into account the different aspects of carrying out querying and displaying the results through augmented reality, the first of which is that all the information obtained is in a known space where the information can be recovered. This allows for the creation of temporal reference information and a metric through which to estimate the similarity between the information.
By generating a global space where homogenized trajectories are represented, it is possible to propose a new metric to obtain similarities. For this, you can define a three-tuple as follows:
where
contains all the trajectories, in real coordinates, and is expressed in centimeters.
is the reference trajectory created from the global space generated. This is temporary information that is used for comparison with all the trajectories stored in the data repository with those that define the similarity.
is the metric applied to order the information contained in the data repository in order to visualize the results that are more similar to the reference. Finally,
R is a matrix that includes the trajectories sorted to start from the reference and the applied metric.
4. Similarity Analysis
The most common way to define the similarity between trajectories is by applying some metric that allows for knowing the spatial or space–time distance [
65], which exists between two trajectories
.
This work aims to provide a proposal to unify and consult heterogeneous data, to generate and visualize information through interactive technologies, and to propose a novel way through which to determine the similarity between trajectories by analyzing their dynamics through a metric.
4.1. Metric for the Comparison of Movement Dynamics
The information supplied by a perspective camera is given in a two-dimensional space , where a vector space expressed by V has elements , and V, in such a way so that, for each trajectory generated by a moving object, there are pairs of points that evolve over time. When taking only one path, it can be represented as , where x and y are the elements belonging to the vector space V, which has its domain in and t is the time. Starting from this idea, it can be said that, in vector space, two orthogonal components can be parameterized and expressed as a function of time to define a function F.
Each of the trajectories stored in the data repository represents points in the two-dimensional space that can be characterized with a small set of parameters, that is, they can be defined by a representative function, with which the analysis of the trajectories can be performed on the functions and not on the total data that make up each of the trajectories. For this purpose, the discrete points of a trajectory can be modeled with a continuous parametric set of functions with t parameters and m independent components of the trajectory.
The proposed similarity measure analyzes the difference between two different dynamics
and
, and it involves calculating each
parametric for the
m components using all of the samples of each trajectory, thereby obtaining, for each component
i, an error as follows:
Given a vector of errors e under a norm of represents the similarity between the trajectories, where is any valid norm. Additionally, the proposed measure of similarity can calculate the similarity between the intervals defined as the vectors d and e of dimension , with these being determined by the lower limit and upper limit between all components . However, the expression strictly compares the dynamics, and it is totally dependent on the initial conditions of F and G. For this reason, it was observed that the behavior of the dynamics can be estimated by , which, in vector form, can be expressed by .
Then, the similarity between the system dynamics is denoted by
e in the interval
as
and, consequently, the dissimilarity of the system is denoted by
where
F and
G are the dynamics of a function. Since Equation (
3) assumes that
, it can be rewritten as
If the functions
and
have intersections, then it is possible to define
as the ordered intersection of points from the lowest to highest, where
. In this way, Equation (
3) can be expressed in terms of
as follows:
where Equation (
6) represents the measure of similarity between
and
in the interval
, thus expressing Equation (
3) in a parametric way as follows:
and representing each
as the representative points of each trajectory as follows:
For more details, check
Appendix A.
4.2. The Proposed Metric and Its Relationship with the Metric
This section shows how the proposal in specific circumstances becomes equivalent to the metric. This becomes important because, in several scenarios, it will improve and simplify its computation, speeding up the process of trajectory querying. The scenario in which this becomes equivalent is whenever the similarity criteria are approximated as a linear polynomial.
The proposed metric can be seen as a composition of the metric , but it produces different results in some aspects. Establishing whether two metrics are equivalent makes sense if the generated topological space has the same shape. The main difference between the two metrics is the domain and how the data are taken for comparison.
The metric takes the data in domain , subtracts for all components, and takes the absolute value. The proposed metric has its domain in , but the difference is the sense of instantaneous change, which coincides with the differences in the behavior of the trajectories. In this sense, metric can be seen as a particular case of the proposed metric when a first-order polynomial function represents the trajectories.
The proof is as follows: in having two functions
,
with the form
;
in the interval
, suppose
. The degree of similarity of these functions is calculated by
The second step is true because the derivative of any polynomial of degree 1 is the coefficient of the first-order term, and its area over the interval is the same coefficient. In the third step, we have , where is the absolute value. We can rewrite the expression as . Then, the proposed metric presented in a polynomial of degree 1 is the same as metric , which we wanted to prove as being a particular case.
5. Proposed Metric Application
The proposed similarity measure is suitable for analyzing the trajectories of moving objects found in a scenario from which information is acquired through one or more sources of information (cameras). In these scenarios, the curves are smooth and can be well-fitted by a low-order polynomial. Let us define a trajectory of a moving object as
, where each
represents the centroid of the defined object as
. Parametric curves can model this trajectory as follows:
where
t represents the sampling. Hence, we take, as an example, defining a second-order polynomial in such a way that the representative parametric functions of the trajectory are as follows:
y
. These were calculated using the least squares method, a simple and well-established method in the literature.
Suppose we have two trajectories, g and r, for which we want to calculate similarity using the proposed metric. If we take one of the components of each path on the same axis, we have and , which are defined by a second-order polynomial like and .
The proposed metric analyzes the behavior of the data and is invariant to the starting point of the trajectories. For this reason, the derivative of the functions is calculated as
y
. Both curves intersect at
for all
. If
, then Equation (
6) can be rewritten as
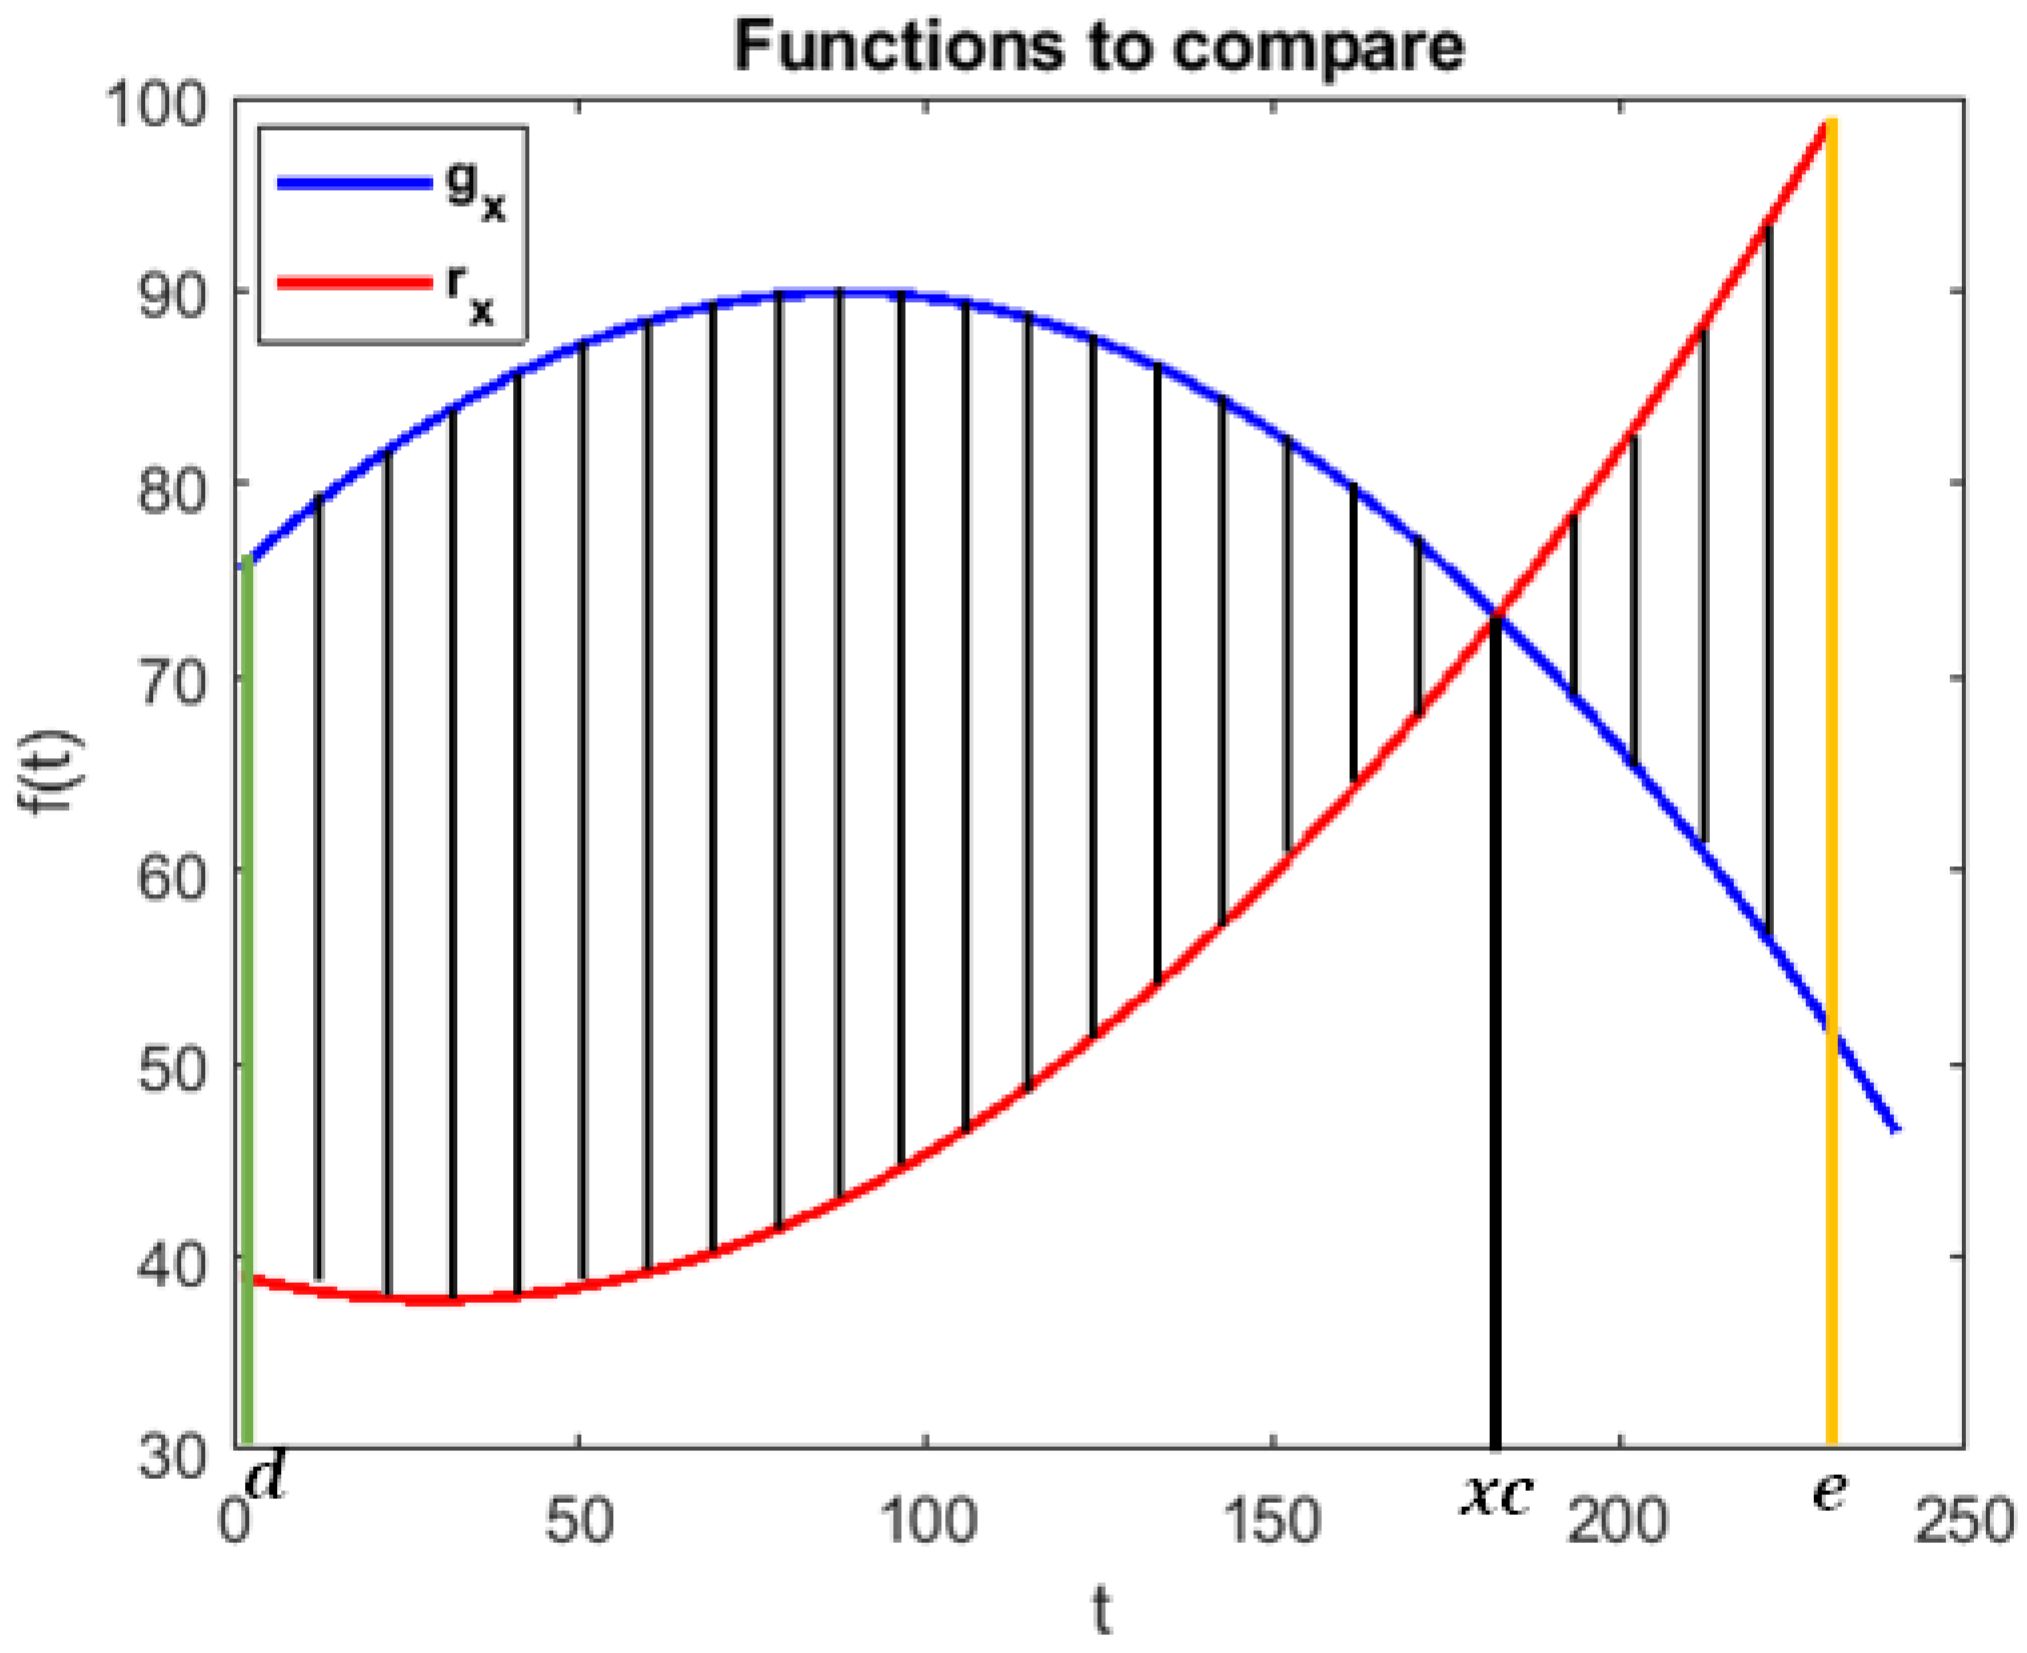
Figure 9 graphically shows the calculation performed using the proposed metric for a component of two different trajectories, where the shaded area is the area to be calculated.
The same process is repeated for each component of the trajectories, thus leaving the similarity defined by
, where
D can be expressed for two components as
The metric expression has been reduced to a simple expression with parameters , , d, and e, which are functions to be compared and the interval limits in which they coincide. The computational complexity of the last expression is in the order of , where k is a constant.
6. Augmented Reality for Querying and Visualization Data
Augmented reality systems have shown a novel way through which to visualize information, allowing for direct interaction between the real world and virtual elements that can be added to enrich the information contained in a scenario. The importance of using feedback through augmented reality in this work consists of generating queries and visualizing information in real-time to obtain a different analysis and interpretation by being present directly in the scenario where the trajectories of the objects of interest were raised.
In this work, the results obtained in the queryings were displayed via augmented reality through a client–server model. This model consists of a device (client) that helps to generate reference trajectories in the scenario where information on movement dynamics was previously acquired; these reference trajectories are sent and processed in a central unit (server) that returns the results for display to the device.
An application developed in Unity3D was installed on the device, which is designed to work in the global space that is generated where the trajectories of moving objects are mapped.
Figure 10 shows roughly how the application works. First, the reference trajectory was created in the unified space, as shown in
Figure 11, and then the trajectory information was sent to a central unit (server) that contains the trajectory data repository. In the same central unit, all the processing was carried out to calculate the similarities between the trajectories stored in the data repository, and the resulting information was then sent back to the application for viewing.
The communication between the developed application and the central unit was carried out by employing the TCP/IP protocol. The reference trajectory was encoded in a string message that traveled to the central unit; it was decoded for use in comparison with the trajectories stored in the data repository, and the ordering was performed according to the metric used. The five most similar trajectories to the reference were selected, encoded again in a message type
, then they traveled back to the application where they were decoded again for use, and then the results were displayed in augmented reality, as seen in
Figure 12a,b.
For the performance of the augmented reality application, the following points can be commented on:
Communication: The complete system is provided by Ethernet communication. The video cameras are Ethernet interfaces. The communication is achieved via a 1 Mbps camera streaming. The Ethernet infrastructure becomes a 1 Gb Ethernet VPN. Simultaneously, we process two cameras, which, in peak situations, give around 20 Mbs sustained in continuous streaming.
Computation of data for storage: The backend server aims to execute the tracking algorithm and store it in the global reference space. The transformation in a global reference space becomes complex because the cameras become fixed, and the projection is based on the active markers in the scenario. Once the camera computes the matrix projection, it becomes fixed until the camera position or orientation changes.
Computation of data for querying: This process involves the client (personal gadget) and requires sampling in a field of view of the orientation into the scene. A client app captures the trajectory for querying after locating the active markers. Projection markers are commutated to transform into active markers and global reference space. This operation is performed once after capturing the trajectory to be consulted as a reference.
Displaying process: This represents the most intensive resource because the position and orientation are continuously checked; the current camera orientation is continuously projected onto the trajectory into the reference space that communicates similar information to the server.
The displaying process represents a 3D view that uses the client’s current GPU or graphic interface. This operation becomes limited by the client and trajectory complexity dynamics expressed in the device. On the other hand, the backend server computes the similarity of the trajectories and sends the point trajectories to be shown on the device.
7. Results
The work was designed for application to any metric that can compare vectors of different lengths, such as those found in [
27,
66,
67,
68,
69,
70]. To prove the validity of the proposed metric, tests were first carried out with the trajectories being generated through a code developed in MATLAB; the trajectories were mapped to the global space such that the coordinates could be expressed in millimeters. The objective was to make a comparison with a widely used metric to compare data of different lengths, such as the Hausdorff distance [
71].
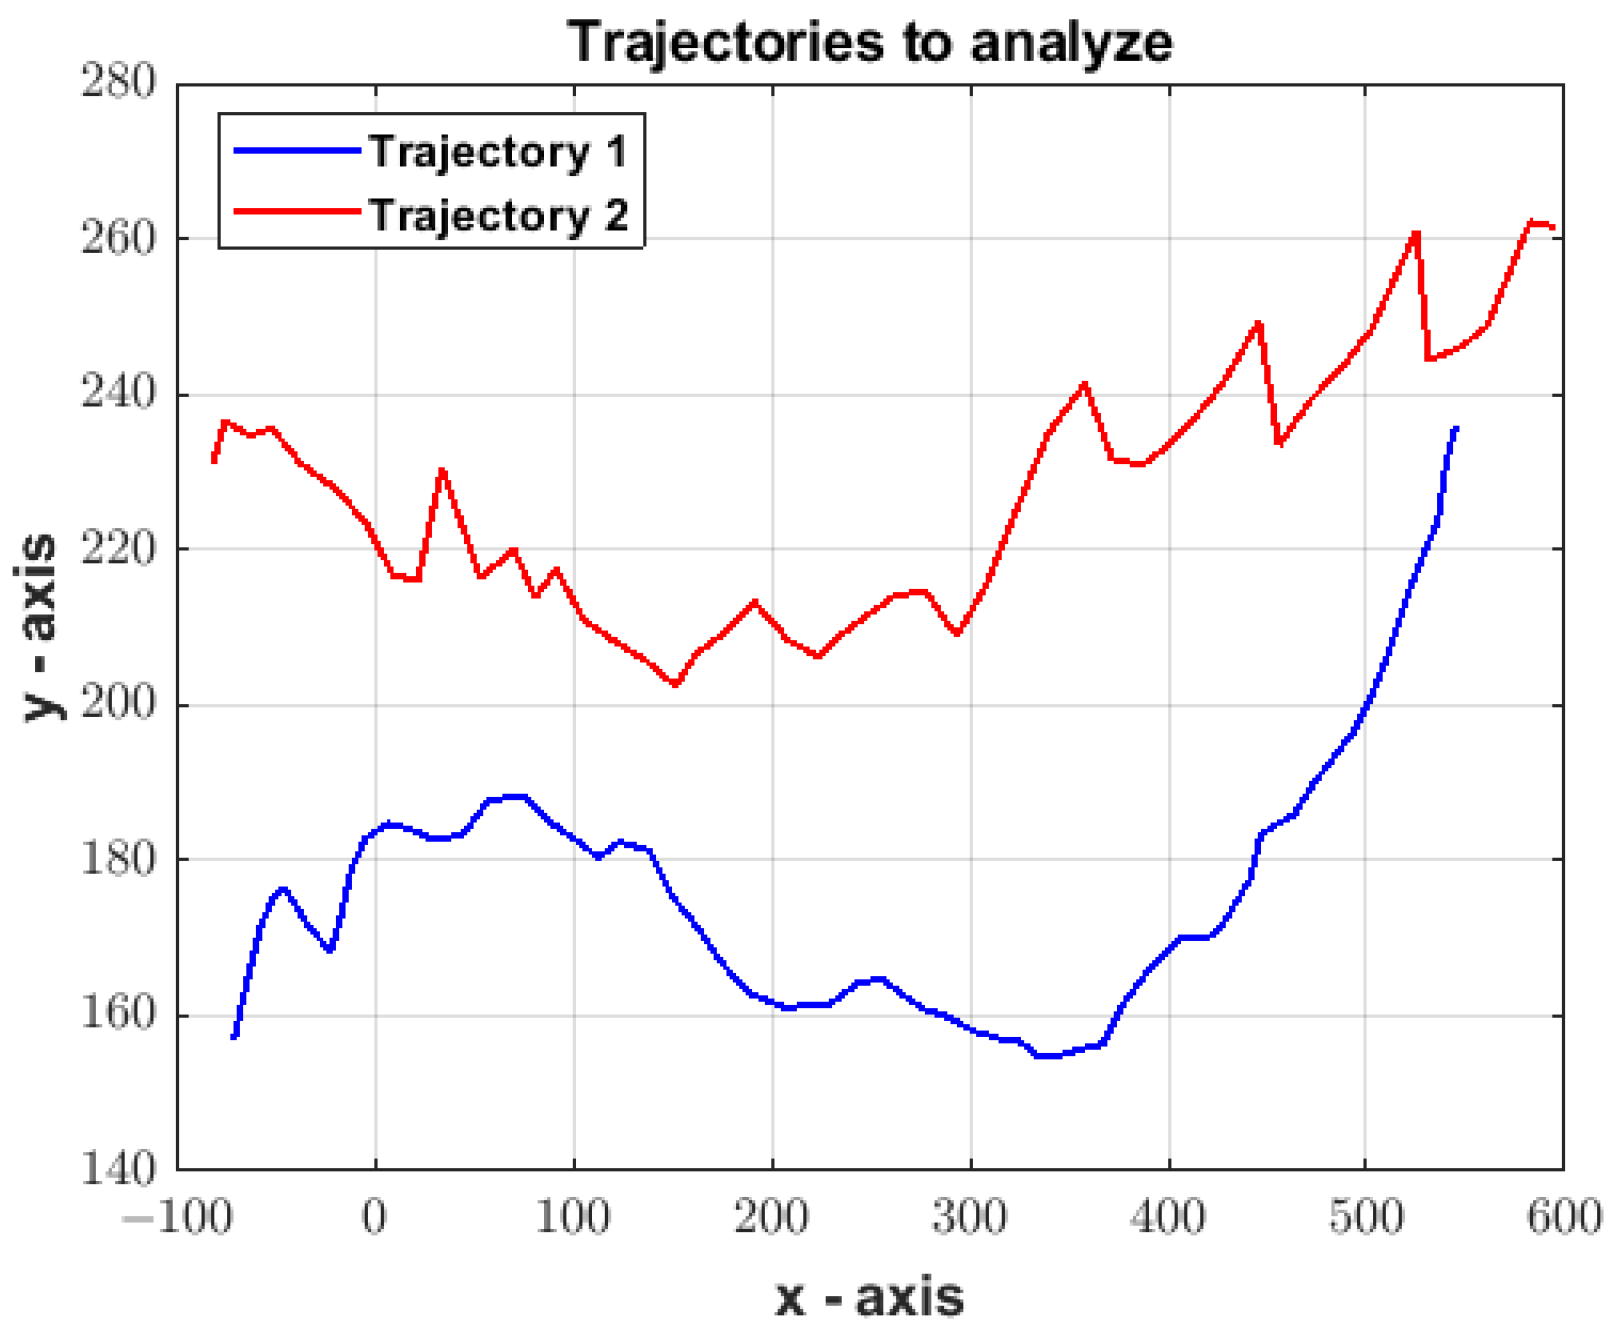
Figure 13 shows the two trajectories to be compared.
The process was carried out by applying the proposed metric where an orthogonal analysis was carried out for each trajectory, as well as by dividing the information into its components, “x” and “y”. Subsequently, the derivative was applied, as shown in
Figure 14. An adjustment of them was calculated by applying the least squares method, and
Figure 15 summarizes the abovementioned process. Finally, the proposed metric and the Hausdorff distance were applied, and a notable difference in the results was obtained.
Figure 16 shows the two trajectories to be compared. The third figure has two equal trajectories only out of phase in space, so it can show how the proposed metric works since it analyzes the dynamics of the data, which is why the value obtained should be equal to or very close to zero.
Table 3 shows the results of each of the tests carried out by applying the same metrics.
Once the validation of the proposed metric has been reviewed by comparing it with one of the metrics used in the literature, its implementation is carried out through real-time query generation that is applied augmented reality. The reference trajectory generation was carried out on the tablet gadget so that it could be sent to the central unit where a metric was applied and the results were displayed.
Figure 11 shows an example of elaborating a reference trajectory in the augmented reality application.
A spatial metric tolerant to trajectories of different lengths was applied first to obtain results and to compare them with the proposed metric. As mentioned before, the Hausdorff distance metric was used.
Figure 17 presents the results when applying this metric, and it shows a three-dimensional space that exemplifies the trajectories seen through augmented reality, where each one of them can be shown in an orderly manner starting with the one most similar to the reference followed by a less similar one (performed according to the similarity results obtained with the metric used). The user generates the blue color trajectory, which is the reference trajectory. Based on the results and the study of the Hausdorff distance, it can be seen that, with a spatial metric, the results are trajectories closer to the reference user generated.
The proposed metric differs from the metrics that are currently better known and used in the literature because it analyzes the trajectory dynamics. By making use of the derivative of a polynomial of degree n, it can be assumed that the analysis is about the behavior of the trajectory, and that it positions the trajectories to be compared at a point of origin, thus eliminating the translation that exists in the difference between one trajectory and another. For this reason, it does not matter that, spatially, the distance between a trajectory similar to the reference is very far away in the plane.
When applying the proposed metric,
Figure 18 shows the results of the first query seen from the tablet gadget, and it shows two different trajectories in red and blue; the trajectory in blue is the reference trajectory, while the trajectory in red is the most similar according to the applied metric. In
Figure 19, the five trajectories most similar to the created reference are graphically shown; each of them can be viewed in the augmented reality application in an orderly manner. For practical purposes, it is displayed one by one; however, with some quick changes to the source code, more similar trajectories can be displayed simultaneously.
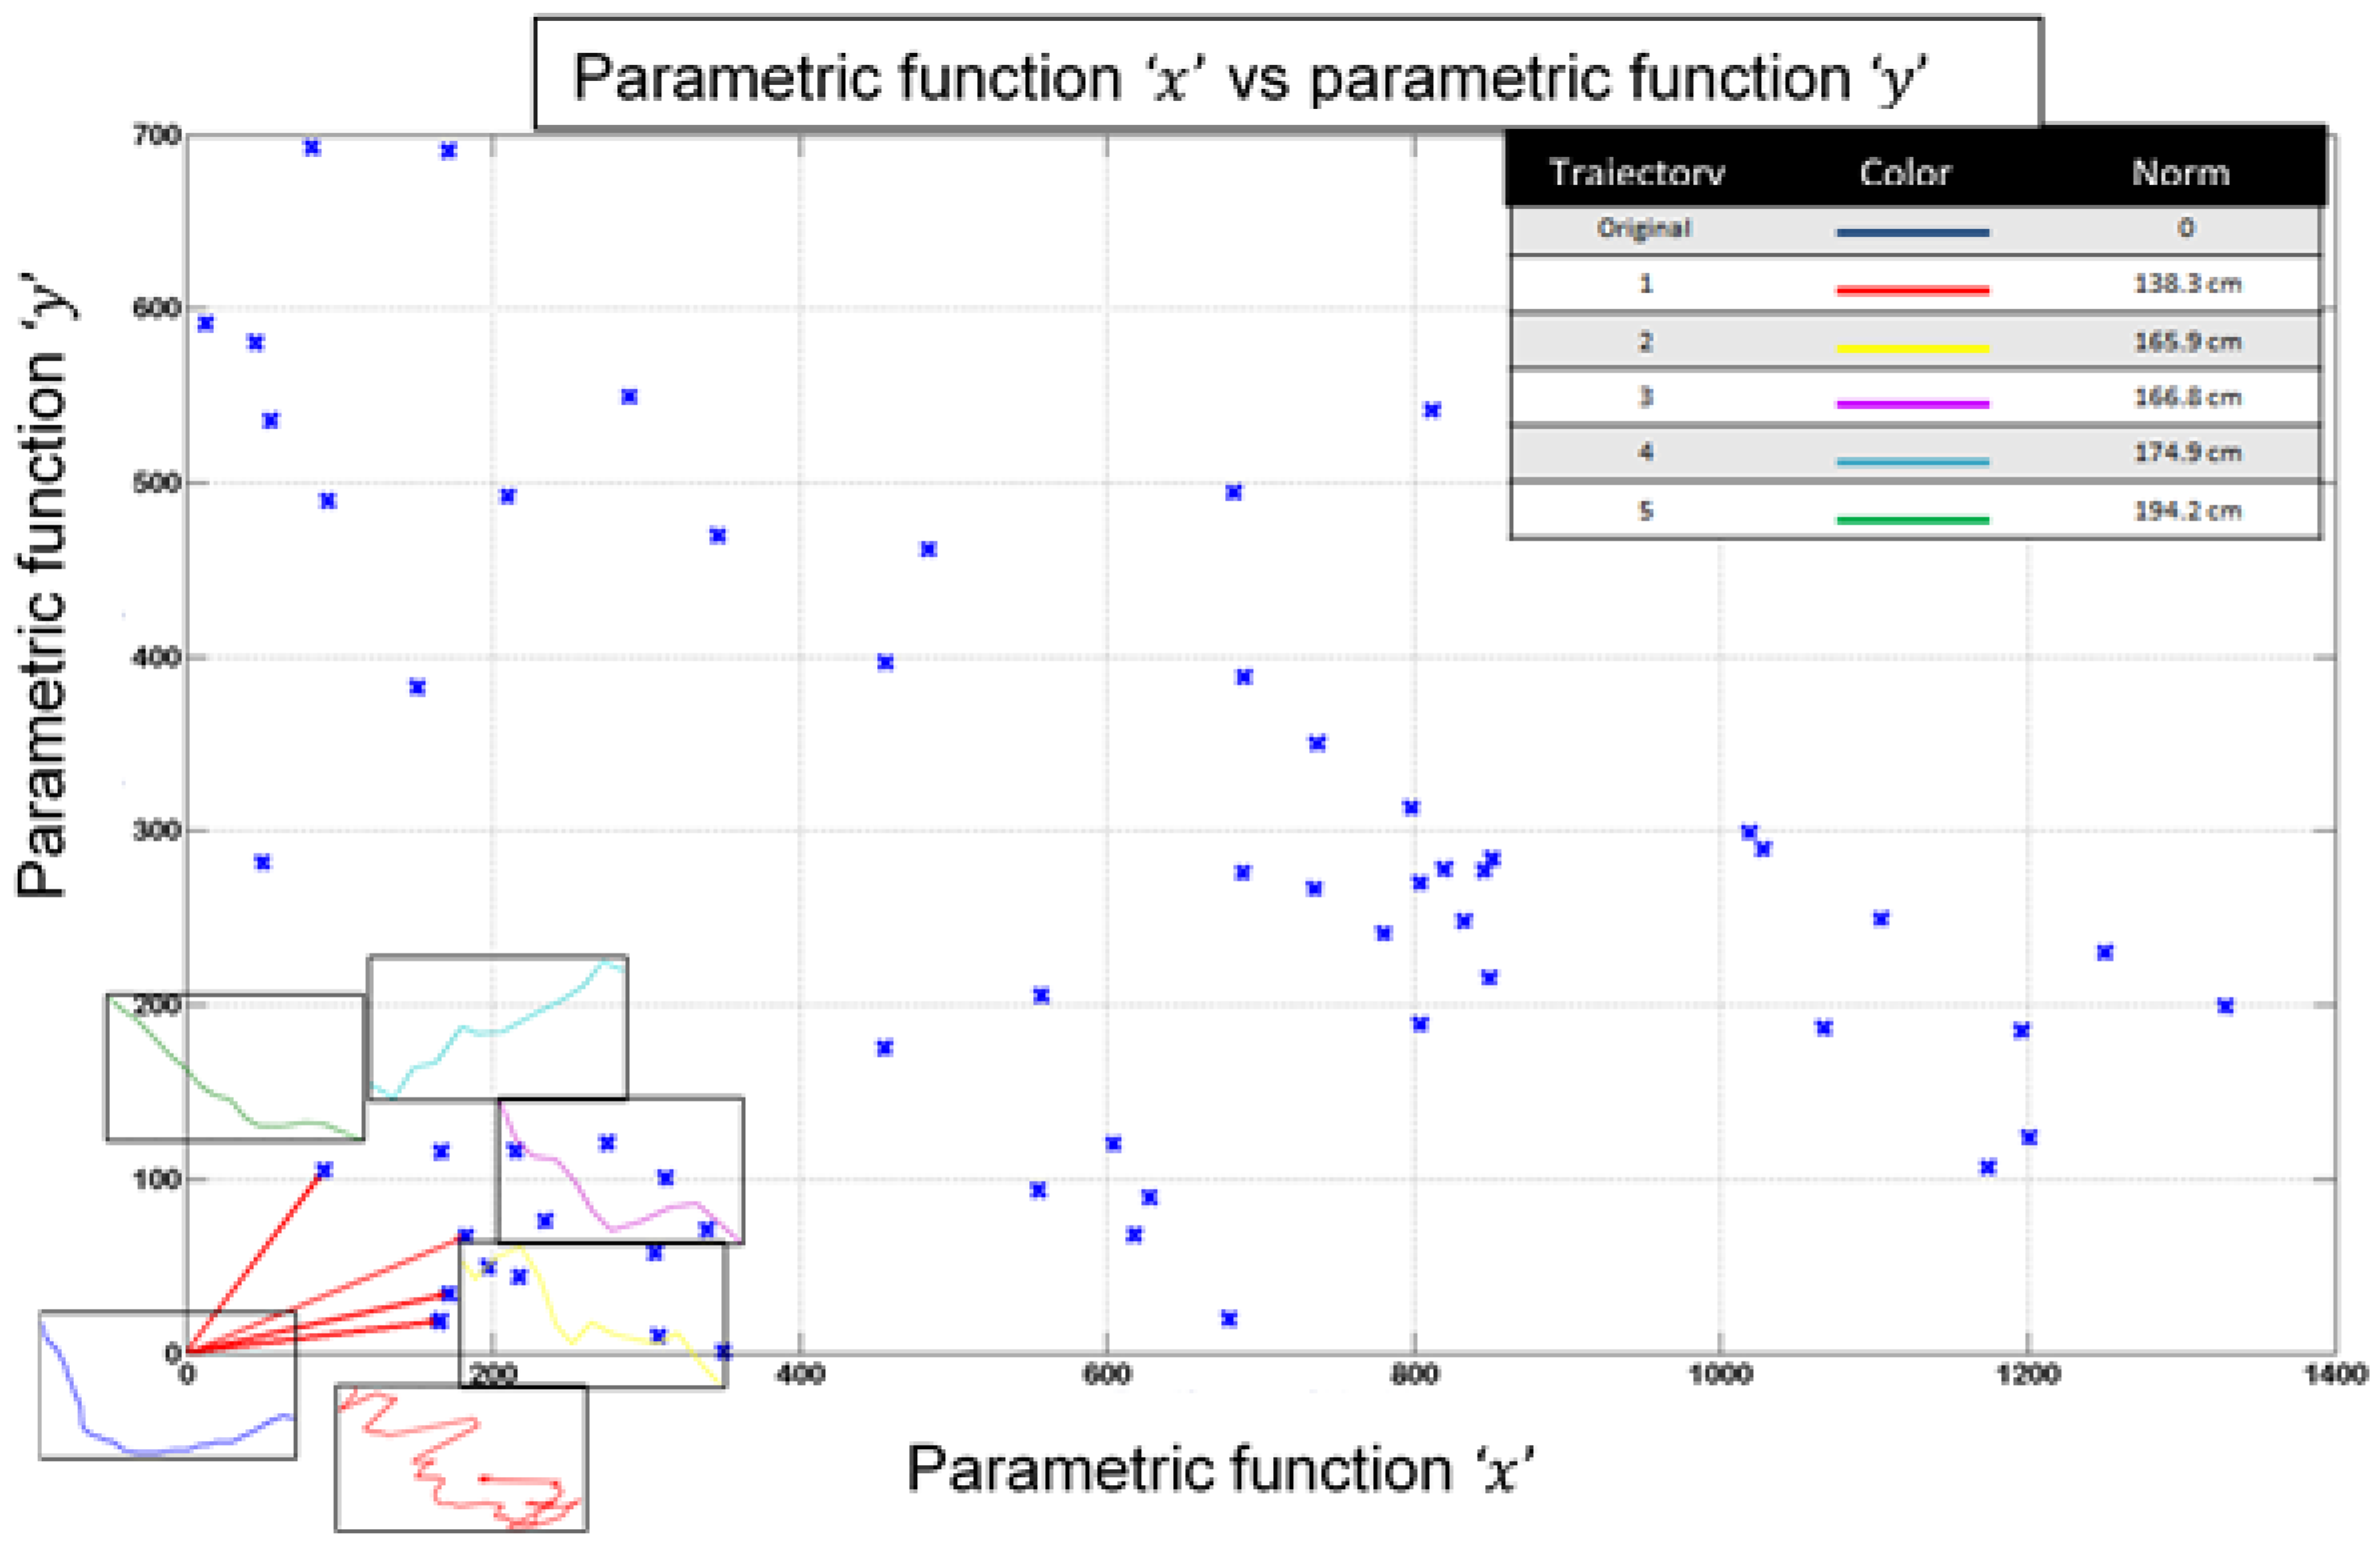
Each color represents a different trajectory, with the magenta color being the reference trajectory created from the augmented reality application.
Figure 20 and
Figure 21 show the new query made and the results.
Figure 22 shows the results of the querying, and they were displayed in the real world through the augmented reality application generated for this work.
Figure 23 shows several of the queries that were made applying the proposed metric, where the magenta trajectory represents the trajectory generated through augmented reality. These results are shown in 3D graphs for practicality to show all of the points that represent the trajectories found in the data repository (which stores the trajectories captured by the objects of interest).
In addition to the results shown when applying the metrics, the topological space created when applying the proposed metric can be shown. In
Section 5, it was explained that each trajectory is parameterized so that there are two orthogonal components to analyze. There is a representation that employs a parametric function on the
x axis and an expression by a parametric function on the
y axis; when the parametric functions are analyzed independently, a valid rule was applied to obtain the result of the similarity according to the dynamics generated by the trajectories to be compared.
Figure 24 shows the topological space generated from the reference trajectory when performing the query with the data repository.
It also follows that, regardless of the scenario to be analyzed, the number of dynamically different trajectories tends to be limited and generates classes. For the trajectories stored in the data repository and the reference trajectory used,
Figure 25 shows the number of classes that can be obtained with this information.
8. Discussion
Multi-camera systems have proven to be versatile and passive tools for detecting information of interest; however, the amount of information acquired has grown exponentially and has made its analysis a significant challenge when determining patterns and behavior within the monitored scenarios. The techniques and models used for analysis are increasingly new but simultaneously more complex because they require the help of advanced technology for their application and visualization, and this is in addition to generating heterogeneous information that is difficult to compare or manipulate.
In the present work, a way in which to work with heterogeneous information was sought by mapping it onto a global space with the help of methods that are widely used in the literature, such as homography, as well as by proposing a new metric to compare said information (achieved by taking the dynamics as a reference for the movement of objects of interest (pedestrians)). This provides a metric that does not focus on the temporal or spatiotemporal analysis that exists in the literature. Likewise, an application was developed to create reference and visualization information within the vision space of a test camera system, with excellent results showing the real-time queries of trajectories similar to the generated reference.
As there were implementation issues, the proposal involves a central server, which stores and creates the global space that is projected in each camera’s field-of-view motion data storage, as well as projects the current camera view of the query information made for a mobile device. The communication occurs over a VPN, where the server responds as a service for querying, and the communication is given by exchanging Jason files that provide the tuples of the trajectories required.
This approach elevates technologies to manage several information sources, and it represents all data in a common workspace once the common workspace is used as a global reference for which external queries become possible. In the proposal, queries become visual and are relative to the observer position projecting into the global space. One of the differences that was proposed when carrying out this work was the parameterization of trajectories generated by people within the test space that was built for the development of this research. In this case, they were parameterized using the least squares methodology, which represented the trajectories as square functions because, normally, the trajectories that are generated have smooth curves. In addition, analysis via orthogonal components was used to show that the metric applies to an n-dimensional space, and that it relates to the results at the end by calculating the magnitude of the orthogonal components obtained. As a result, the difference in dynamics between the trajectories was compared. This methodology is innovative as it applies the derivative of the function that is represented to the trajectories independently, thus eliminating spatiality and the integral as a means of defining the area between the trajectories, thereby allowing for an analysis of the data behavior. Additionally, the similarity function is useful because it provides a way through which to match the heterogeneous information stored in a global space.
Future work will include the following:
The possibility of representing the movement dynamics with polynomials of a different order.
The application of the arc length technique.
The homogenization of information with passive marks to use information through augmented reality.
The incorporation of more sources of heterogeneous information.
Dynamically selecting markers to orientate the systems.
9. Conclusions
In artificial vision systems, many challenges must be addressed to achieve an information unification that is better for interpreting the events occurring in specific settings. In the case of distributed systems, one of the biggest challenges is the fusion of information from different sources (cameras), which is needed to compare heterogeneous information. In the present work, the authors tried to explain that having a distributed system can obtain better coverage of the area from which data can be acquired, thus increasing the complexity of the information analysis considerably. By proposing a way through which to generate a global space, mappings of different spaces can be made to compare heterogeneous information and develop a unified space that allows information to be fed back by applying a valid metric. Finally, the interactive visualization of data provides a different way of presenting the results to improve their interpretation directly in the real world. The use of augmented reality as a means of generating and displaying information allows for, in a novel way, real-time analysis to be carried out directly in the space where pedestrians generate trajectories; this could be applied in video surveillance systems to compare the unusual trajectories related to criminal acts by showing the trajectory generated by a specific person.
Author Contributions
Conceptualization, H.J.-H.; methodology, J.-R.M.-M.; software, A.-M.H.-N. and J.-R.M.-M.; validation, H.J.-H. and J.-C.S.-V.; formal analysis, J.-R.M.-M. and H.J.-H.; investigation, J.-R.M.-M., L.-A.D.-J. and H.J.-H.; resources, H.J.-H. and J.-C.S.-V.; data curation, H.J.-H. and A.-M.H.-N.; writing—original draft preparation, J.-R.M.-M., A.-M.H.-N. and J.-C.S.-V.; writing—review and editing, H.J.-H., L.-A.D.-J. and J.-L.P.-R.; visualization, H.J.-H.; supervision, H.J.-H. and J.-L.P.-R.; project administration, H.J.-H.; funding acquisition, H.J.-H. All authors have read and agreed to the published version of the manuscript.
Funding
This research received no external funding.
Data Availability Statement
The data presented in this study are available on request from the corresponding authors. The data is not publicly available because it is in the improvement process and used for other related works.
Acknowledgments
We would like to thank the anonymous reviewers for their valuable comments, to the author Josué Rafael Montes Martínez, and to the government agency CONAHCyT.
Conflicts of Interest
The authors declare no conflict of interest.
Appendix A
To be a metric, Equation (
6) must satisfy the following four properties:
, i.e., the distance from a point to itself is zero;
positivity;
symmetry;
triangle inequality.
Demonstration of the properties with the proposed metric.
- 1.
. According to Equation (
5), the term on the left can be expressed as follows:
. Expanding the terms, we have
In general terms
, so, by substituting it into Equation (
A1), it follows that
y
—in other words
.
- 2.
. Si
. If
, then, at that time,
; otherwise, the first term on the left can be expressed as
. Expanding the terms, we have
Again, generally
y
. Using Equation (
A2), we have the following options:
y . Becomes .
y . Then .
y . Becomes , because k y l are negatives.
y . Then .
- 3.
. The left-hand term can be expanded to
;
. Applying the auxiliary function defined in Equation (
5), we can rewrite this as follows:
Assuming that
y
, then Equation (
A3) can be represented as:
so that
can be expressed by
If
If
If
- 4.
. The expression on the left can be rewritten as follows:
Assuming that , , , then only one of the following cases is possible:
- (a)
;
- (b)
;
- (c)
;
- (d)
;
- (e)
;
- (f)
.
With these verifications, it was concluded that is a metric, which is what we wanted to demonstrate.
References
- Elharrouss, O.; Almaadeed, N.; Al-Maadeed, S. A review of video surveillance systems. J. Vis. Commun. Image Represent. 2021, 77, 103116. [Google Scholar] [CrossRef]
- Subudhi, B.N.; Rout, D.K.; Ghosh, A. Big data analytics for video surveillance. Multimed. Tools Appl. 2019, 7, 26129–26162. [Google Scholar] [CrossRef]
- Olagoke, A.S.; Ibrahim, H.; Teoh, S.S. Literature survey on multi-camera system and its application. IEEE Access 2020, 8, 172892–172922. [Google Scholar] [CrossRef]
- Villani, M.L.; De Nicola, A.; Bouma, H.; van Rooijen, A.; Räsänen, P.; Peltola, J.; Toivonen, S.; Guarneri, M.; Stifini, C.; De Dominicis, L. A Modular Architecture of Command-and-Control Software in Multi-Sensor Systems Devoted to Public Security. Information 2023, 14, 162. [Google Scholar] [CrossRef]
- Mezhenin, A.; Izvozchikova, V.; Ivanova, V. Use of Point Clouds for Video Surveillance System Cover Zone Imitation. In CEUR Workshop Proceedings; CEUR-WS: Aachen, Germany, 2019; Volume 2344, Available online: https://ceur-ws.org/Vol-2344/short3.pdf (accessed on 7 December 2023).
- Jain, S.; Ananthanarayanan, G.; Jiang, J.; Shu, Y.; Gonzalez, J. Scaling video analytics systems to large camera deployments. In Proceedings of the 20th International Workshop on Mobile Computing Systems and Applications, Santa Cruz, CA, USA, 27–28 February 2019; pp. 9–14. [Google Scholar]
- Qiu, S.; Zhao, H.; Jiang, N.; Wang, Z.; Liu, L.; An, Y.; Zhao, H.; Miao, X.; Liu, R.; Fortino, G. Multi-sensor information fusion based on machine learning for real applications in human activity recognition: State-of-the-art and research challenges. Inf. Fusion 2022, 80, 241–265. [Google Scholar] [CrossRef]
- Kwon, O.; Lee, N.; Shin, B. Data quality management, data usage experience and acquisition intention of big data analytics. Int. J. Inf. Manag. 2014, 34, 387–394. [Google Scholar] [CrossRef]
- Yadav, C.; Wang, S.; Kumar, M. Algorithm and approaches to handle large Data—A Survey. arXiv 2013, arXiv:1307.5437. [Google Scholar]
- IntelliVision Now Inside 4 Million Smart Cameras—Leader in AI-Based Video Analytics Software. Available online: https://www.intelli-vision.com/news/intellivision-now-inside-4-million-smart-cameras-leaderin-ai-based-video-analytics-software/ (accessed on 10 November 2018).
- Truong, H.L.; Fahringer, T. Self-managing sensor-based middleware for performance monitoring and data integration in grids. In Proceedings of the 19th IEEE International Parallel and Distributed Processing Symposium, Denver, CO, USA, 4–8 April 2005; pp. 156–163. [Google Scholar] [CrossRef]
- Khalid, Z.; Fisal, N.; Rozaini, M. A survey of middleware for sensor and network virtualization. Sensors 2014, 14, 24046–24097. [Google Scholar] [CrossRef]
- Benayache, A.; Bilami, A.; Barkat, S.; Lorenz, P.; Taleb, H. MsM: A microservice middleware for smart WSN-based IoT application. J. Netw. Comput. Appl. 2019, 144, 138–154. [Google Scholar] [CrossRef]
- Eleftherakis, G.; Pappas, D.; Lagkas, T.; Rousis, K.; Paunovski, O. Architecting the IoT paradigm: A middleware for autonomous distributed sensor networks. Int. J. Distrib. Sens. Netw. 2015, 11, 139735. [Google Scholar] [CrossRef]
- Akanbi, A.K.; Masinde, M. Semantic interoperability middleware architecture for heterogeneous environmental data sources. In Proceedings of the 2018 IST-Africa Week Conference (IST-Africa), Gaborone, Botswana, 9–11 May 2018; IEEE: Piscataway, NJ, USA, 2018; pp. 1–10. [Google Scholar]
- García-Huerta, J.M.; Jiménez-Hernández, H.; Herrera-Navarro, A.M.; Hernández-Díaz, T.; Terol-Villalobos, I. Modelling dynamics with context-free grammars. In Video Surveillance and Transportation Imaging Applications; International Society for Optics and Photonics: San Francisco, CA, USA, 2014; Volume 9026, p. 902611. [Google Scholar]
- Rezaee, K.; Rezakhani, S.M.; Khosravi, M.R.; Moghimi, M.K. A survey on deep learning-based real-time crowd anomaly detection for secure distributed video surveillance. Pers. Ubiquitous Comput. 2021, 27, 1–17. [Google Scholar] [CrossRef]
- Bouma, H.; Villani, M.L.; van Rooijen, A.; Räsänen, P.; Peltola, J.; Toivonen, S.; De Nicola, A.; Guarneri, M.; Stifini, C.; De Dominicis, L. An integrated fusion engine for early threat detection demonstrated in public-space trials. Sensors 2023, 23, 440. [Google Scholar] [CrossRef] [PubMed]
- Wang, W.; Xie, Y.; Tang, L. Hierarchical Clustering Algorithm for Multi-Camera Vehicle Trajectories Based on Spatio-Temporal Grouping under Intelligent Transportation and Smart City. Sensors 2023, 23, 6909. [Google Scholar] [CrossRef]
- Li, X.; Hu, W.; Shen, C.; Zhang, Z.; Dick, A.; Hengel, A.V.D. A survey of appearance models in visual object tracking. ACM Trans. Intell. Syst. Technol. (TIST) 2013, 4, 58. [Google Scholar] [CrossRef]
- Malik, N.U.R.; Abu-Bakar, S.A.R.; Sheikh, U.U.; Channa, A.; Popescu, N. Cascading Pose Features with CNN-LSTM for Multiview Human Action Recognition. Signals 2023, 4, 40–55. [Google Scholar] [CrossRef]
- Joshi, K.A.; Thakore, D.G. A survey on moving object detection and tracking in video surveillance system. Int. J. Soft Comput. Eng. 2012, 2, 44–48. [Google Scholar]
- Adachi, T.; Hayashi, N.; Takai, S. Cooperative target tracking by multiagent camera sensor networks via Gaussian process. IEEE Access 2022, 10, 71717–71727. [Google Scholar] [CrossRef]
- Li, Y.; Yang, G.; Su, Z.; Li, S.; Wang, Y. Human activity recognition based on multienvironment sensor data. Inf. Fusion 2023, 91, 47–63. [Google Scholar] [CrossRef]
- Chen, K.-Y.; Chou, L.-W.; Lee, H.-M.; Young, S.-T.; Lin, C.-H.; Zhou, Y.-S.; Tang, S.-T.; Lai, Y.-H. Human motion tracking using 3D image features with a long short-term memory mechanism model—an example of forward reaching. Sensors 2022, 22, 292. [Google Scholar] [CrossRef]
- Shidik, G.F.; Noersasongko, E.; Nugraha, A.; Andono, P.N.; Jumanto, J.; Kusuma, E.J. A systematic review of intelligence video surveillance: Trends, techniques, frameworks, and datasets. IEEE Access 2019, 7, 170457–170473. [Google Scholar] [CrossRef]
- Yang, N.; Zheng, J.; Liu, Q.; Cao, Y. A Novel Trajectory Similarity Evaluation Method in VANETs. Int. J. Multimed. Ubiquitous Eng. 2014, 9, 183–192. [Google Scholar] [CrossRef]
- Jung, S.; Lee, Y.S.; Lee, Y.; Lee, K. 3D reconstruction using 3D registration-based ToF-stereo fusion. Sensors 2022, 22, 8369. [Google Scholar] [CrossRef] [PubMed]
- Kang, Z.; Yang, J.; Yang, Z.; Cheng, S. A review of techniques for 3d reconstruction of indoor environments. ISPRS Int. J. Geo-Inf. 2020, 9, 330. [Google Scholar] [CrossRef]
- Aharchi, M.; Ait Kbir, M. A review on 3D reconstruction techniques from 2D images. In Innovations in Smart Cities Applications Edition 3: The Proceedings of the 4th International Conference on Smart City Applications; Springer International Publishing: Cham, Switzerland, 2020; Volume 4, pp. 510–522. [Google Scholar]
- Yilmaz, A.; Javed, O.; Shah, M. Object tracking: A survey. ACM Comput. Surv. (CSUR) 2006, 38, 13. [Google Scholar] [CrossRef]
- Jiménez-Hernández, H.; González-Barbosa, J.J.; García-Ramírez, T. Detecting abnormal vehicular dynamic at intersection based on an unsupervised learning approach and a stochastic model. Sensors 2010, 10, 7576–7601. [Google Scholar] [CrossRef]
- Parekh, H.S.; Thakore, D.G.; Jaliya, U.K. A survey on object detection and tracking methods. Int. J. Innov. Res. Comput. Commun. Eng. 2014, 2, 2970–2978. [Google Scholar]
- Singla, N. Motion detection based on frame difference method. Int. J. Inf. Comput. Technol. 2014, 4, 1559–1565. [Google Scholar]
- Fortun, D.; Bouthemy, P.; Kervrann, C. Optical flow modelling and computation: A survey. Comput. Vis. Image Underst. 2015, 134, 1–21. [Google Scholar] [CrossRef]
- Yuan, G.; Sun, P.; Zhao, J.; Li, D.; Wang, C. A review of moving object trajectory clustering algorithms. Artif. Intell. Rev. 2017, 47, 123–144. [Google Scholar] [CrossRef]
- Lee, L.; Romano, R.; Stein, G. Monitoring activities from multiple video streams: Establishing a common coordinate frame. IEEE Trans. Pattern Anal. Mach. Intell. 2000, 22, 758–767. [Google Scholar] [CrossRef]
- Liu, W.; Camps, O.; Sznaier, M. Multi-camera multi-object tracking. arXiv 2017, arXiv:1709.07065. [Google Scholar]
- Hatwar, R.B.; Kamble, S.D.; Thakur, N.V.; Kakde, S. A review on moving object detection and tracking methods in video. Int. J. Pure Appl. Math. 2018, 118, 511–526. [Google Scholar]
- Ranković, N.; Radmanović, T.; Ranković, D.; Bjelica, M. Visualization tools for large amount of data. Appl. Internet Inf. Technol. 2019, 122, 122–127. [Google Scholar]
- Schmidt, J. Usage of Visualization Techniques in Data Science Workflows. In Proceedings of the VISIGRAPP (3: IVAPP), Valletta, Malta, 27–29 February 2020; pp. 309–316. [Google Scholar]
- De la Cruz Dorantes, C.R.; Thompson, E.F.B.; Vanoye, J.A.R.; Solís, J.A.A. Methodology for the comprehensive application of visualization techniques in data science as support for decision making. Strateg. Technol. Soc. 2017, 5, 31–50. [Google Scholar]
- Cavaller, V. Dimensional taxonomy of data visualization: A proposal from communication sciences tackling complexity. Front. Res. Metrics Anal. 2021, 6, 643533. [Google Scholar] [CrossRef] [PubMed]
- Jena, B. A review on data visualization tools used for big data. Int. Res. J. Eng. Technol. (IRJET) 2017, 4, 492–495. [Google Scholar]
- Hajirahimova, M.; Ismayilova, M. Big data visualization: Existing approaches and problems. Probl. Inf. Technol. 2018, 9, 65–74. [Google Scholar] [CrossRef]
- Khatri, A.; Gupta, N. Impact of Data Visualization on Management Decisions. Lond. J. Res. Manag. Bus. 2022, 22, 53–62. [Google Scholar]
- Mourtzis, D.; Siatras, V.; Zogopoulos, V. Augmented reality visualization of production scheduling and monitoring. Procedia Cirp 2020, 88, 151–156. [Google Scholar] [CrossRef]
- Venkatesan, M.; Mohan, H.; Ryan, J.R.; Schürch, C.M.; Nolan, G.P.; Frakes, D.H.; Coskun, A.F. Virtual and augmented reality for biomedical applications. Cell Rep. Med. 2 2021. [Google Scholar] [CrossRef]
- Reipschlager, P.; Flemisch, T.; Dachselt, R. Personal augmented reality for information visualization on large interactive displays. IEEE Trans. Vis. Comput. Graph. 2020, 27, 1182–1192. [Google Scholar] [CrossRef] [PubMed]
- Carmigniani, J.; Furht, B.; Anisetti, M.; Ceravolo, P.; Damiani, E.; Ivkovic, M. Augmented reality technologies, systems and applications. Multimed. Tools Appl. 2011, 51, 341–377. [Google Scholar] [CrossRef]
- Christoff, N.; Neshov, N.N.; Tonchev, K.; Manolova, A. Application of a 3D Talking Head as Part of Telecommunication AR, VR, MR System: Systematic Review. Electronics 2023, 12, 4788. [Google Scholar] [CrossRef]
- Azuma, R.T. A survey of augmented reality. Presence Teleoper. Virtual Environ. 1997, 6, 355–385. [Google Scholar] [CrossRef]
- Arafa, A.; Sheerah, H.A.; Alsalamah, S. Emerging Digital Technologies in Healthcare with a Spotlight on Cybersecurity: A Narrative Review. Information 2023, 14, 640. [Google Scholar] [CrossRef]
- Nunes, J.S.; Almeida, F.B.; Silva, L.S.; Santos, V.M.; Santos, A.A.; de Senna, V.; Winkler, I. Three-dimensional coordinate calibration models for augmented reality applications in indoor industrial environments. Appl. Sci. 2023, 13, 12548. [Google Scholar] [CrossRef]
- Bhang, K.J.; Huh, J.R. Effectiveness of Fine Dust Environmental Education on Students’ Awareness and Attitudes in Korea and Australia Using AR Technology. Sustainability 2023, 15, 16039. [Google Scholar] [CrossRef]
- Kleftodimos, A.; Evagelou, A.; Gkoutzios, S.; Matsiola, M.; Vrigkas, M.; Yannacopoulou, A.; Triantafillidou, A.; Lappas, G. Creating Location-Based Augmented Reality Games and Immersive Experiences for Touristic Destination Marketing and Education. Computers 2023, 12, 227. [Google Scholar] [CrossRef]
- Stappung, Y.; Aliaga, C.; Cartes, J.; Jego, L.; Reyes-Suárez, J.A.; Barriga, N.A.; Besoain, F. Developing 360° Virtual Tours for Promoting Tourism in Natural Parks in Chile. Sustainability 2023, 15, 16043. [Google Scholar] [CrossRef]
- Martín-Gutiérrez, J.; Mora, C.E.; Añorbe-Díaz, B.; González-Marrero, A. Virtual technologies trends in education. Eurasia J. Math. Sci. Technol. Educ. 2017, 13, 469–486. [Google Scholar]
- Nixon, M.; Aguado, A.S. Feature Extraction and Image Processing for Computer Vision; Academic Press: New York, NY, USA, 2012. [Google Scholar]
- Sharma, V.; Nain, N.; Badal, T. A survey on moving object detection methods in video surveillance. Int. Bull. Math. Res. 2015, 2, 209–218. [Google Scholar]
- Hernández-Díaz, T.; Vázquez-Cervantes, A.; González-Barbosa, J.J.; Barriga-Rodríguez, L.; Herrera-Navarro, A.M.; Baldenegro-Pérez, L.A.; Jiménez-Hernández, H. Detecting background and foreground with laser array system. Measurement 2015, 63, 195–206. [Google Scholar] [CrossRef]
- Piccardi, M. Background subtraction techniques: A review. In Proceedings of the IEEE International Conference on Systems, Man and Cybernetics (IEEE Cat. No. 04CH37583), Hague, The Netherlands, 10–13 October 2004; Volume 4, pp. 3099–3104. [Google Scholar]
- Hartley, R.; Zisserman, A. Multiple View Geometry in Computer Vision; Cambridge University Press: Cambridge, UK, 2003. [Google Scholar]
- Roushdy, M. Comparative study of edge detection algorithms applying on the grayscale noisy image using morphological filter. GVIP J. 2006, 6, 17–23. [Google Scholar]
- Magdy, N.; Sakr, M.A.; Mostafa, T.; El-Bahnasy, K. Review on trajectory similarity measures. In Proceedings of the 2015 IEEE Seventh International Conference on Intelligent Computing and Information Systems (ICICIS), Cairo, Egypt, 12–14 December 2015; pp. 613–619. [Google Scholar] [CrossRef]
- Xie, M. EDS: A segment-based distance measure for sub-trajectory similarity search. In Proceedings of the 2014 ACM SIGMOD International Conference on Management of Data, Snowbird, UT, USA, 22–27 June 2014; ACM: New York, NY, USA, 2014; pp. 1609–1610. [Google Scholar]
- Alt, H. The computational geometry of comparing shapes. In Efficient Algorithms; Springer: Berlin/Heidelberg, Germany, 2009; pp. 235–248. [Google Scholar]
- Guo, N.; Ma, M.; Xiong, W.; Chen, L.; Jing, N. An efficient query algorithm for trajectory similarity based on Fréchet distance threshold. ISPRS Int. J. Geo-Inf. 2017, 6, 326. [Google Scholar] [CrossRef]
- Faloutsos, C.; Ranganathan, M.; Manolopoulos, Y. Fast Subsequence Matching in Time-Series Databases; ACM: New York, NY, USA, 1994; Volume 23, pp. 419–429. [Google Scholar]
- Femiani, J.C.; Razdan, A.; Farin, G. Curve Shapes: Comparison and Alignment. Submitted to TPAMI. Available online: https://citeseerx.ist.psu.edu/document?repid=rep1&type=pdf&doi=68c25f7f1b3d7b0dddacad91933a3b4311942ed2 (accessed on 23 November 2023).
- Huttenlocher, D.P.; Klanderman, G.A.; Rucklidge, W.J. Comparing images using the Hausdorff distance. IEEE Trans. Pattern Anal. Mach. Intell. 1993, 15, 850–863. [Google Scholar] [CrossRef]
Figure 1.
Trajectories obtained by each camera. Red dots represent movement dynamics, and colorful blocks represent matching areas.
Figure 1.
Trajectories obtained by each camera. Red dots represent movement dynamics, and colorful blocks represent matching areas.
Figure 2.
The perspective of each camera. Colorful blocks are reference marks necessary for the construction of the global space.
Figure 2.
The perspective of each camera. Colorful blocks are reference marks necessary for the construction of the global space.
Figure 3.
Active marks—points of interest. Colorful blocks represent the marks shown in
Figure 2.
Figure 3.
Active marks—points of interest. Colorful blocks represent the marks shown in
Figure 2.
Figure 4.
Original coordinates of references.
Figure 4.
Original coordinates of references.
Figure 5.
Segmentation of the perspective images. In the binary images, the white color represents the colorful block (
Figure 2), and the red dots represent the centroid of each block.
Figure 5.
Segmentation of the perspective images. In the binary images, the white color represents the colorful block (
Figure 2), and the red dots represent the centroid of each block.
Figure 6.
The trajectories in global space. The colored dots represent the different real trajectories generated by the objects of interest mapped to the global space.
Figure 6.
The trajectories in global space. The colored dots represent the different real trajectories generated by the objects of interest mapped to the global space.
Figure 7.
Reference trajectory creation process—results display.
Figure 7.
Reference trajectory creation process—results display.
Figure 8.
Reference trajectories.
Figure 8.
Reference trajectories.
Figure 9.
Representation graphics of the proposed metric.
Figure 9.
Representation graphics of the proposed metric.
Figure 10.
Breakdown of the creation of the reference trajectory—result visualization.
Figure 10.
Breakdown of the creation of the reference trajectory—result visualization.
Figure 11.
Process of creation of the reference trajectory—result visualization. Blue dots represent the construction of the reference trajectory created by the user. The QR code is the active mark necessary for the augmented reality application.
Figure 11.
Process of creation of the reference trajectory—result visualization. Blue dots represent the construction of the reference trajectory created by the user. The QR code is the active mark necessary for the augmented reality application.
Figure 12.
(a) Server: communication process. (b) Client: communication process.
Figure 12.
(a) Server: communication process. (b) Client: communication process.
Figure 13.
Trajectories to compare.
Figure 13.
Trajectories to compare.
Figure 14.
Process of the proposed metric.
Figure 14.
Process of the proposed metric.
Figure 15.
Breakdown of the proposed metric.
Figure 15.
Breakdown of the proposed metric.
Figure 16.
Example trajectories to compare.
Figure 16.
Example trajectories to compare.
Figure 17.
Graphical representation of the result with Hausdorff. The colorful dots represent the different trajectories most similar to the reference, where dots in magenta color are the reference trajectory generated by the user.
Figure 17.
Graphical representation of the result with Hausdorff. The colorful dots represent the different trajectories most similar to the reference, where dots in magenta color are the reference trajectory generated by the user.
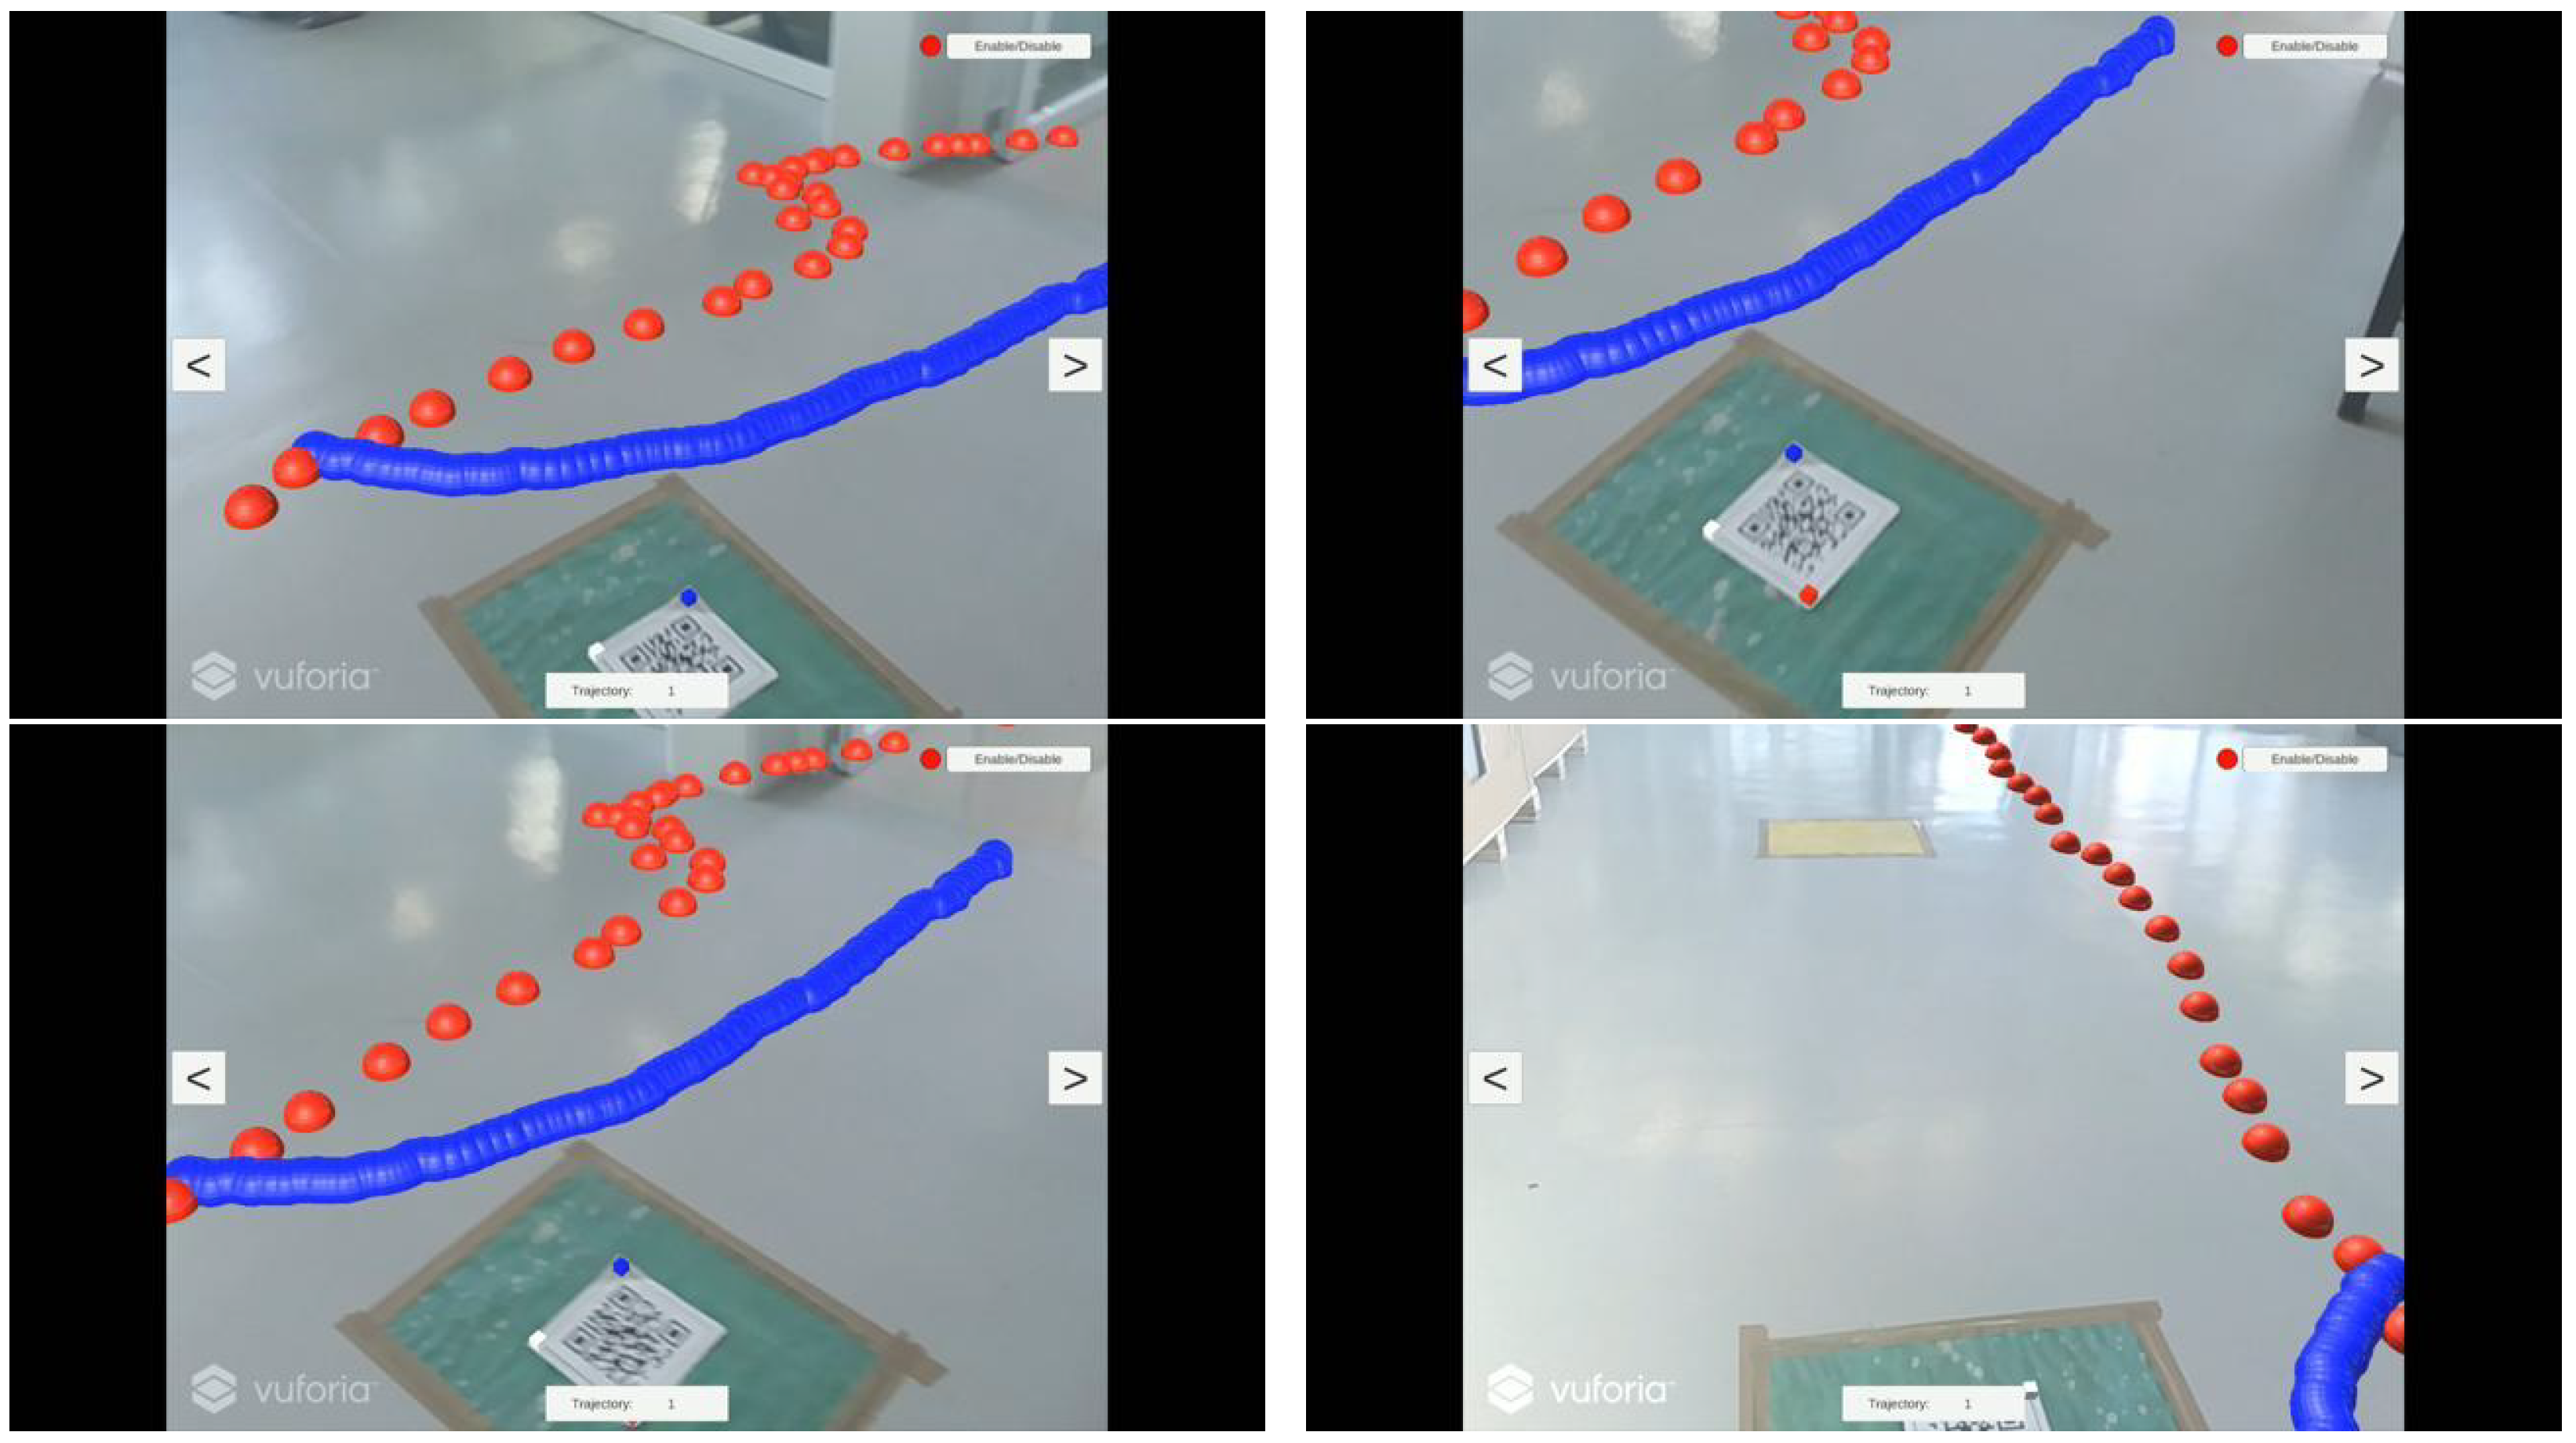
Figure 18.
Results from applying the metric proposal. Blue dots represent the reference trajectory created by the user, and red dots represent a similar trajectory as from the reference. The QR code is the active mark necessary for the augmented reality application.
Figure 18.
Results from applying the metric proposal. Blue dots represent the reference trajectory created by the user, and red dots represent a similar trajectory as from the reference. The QR code is the active mark necessary for the augmented reality application.
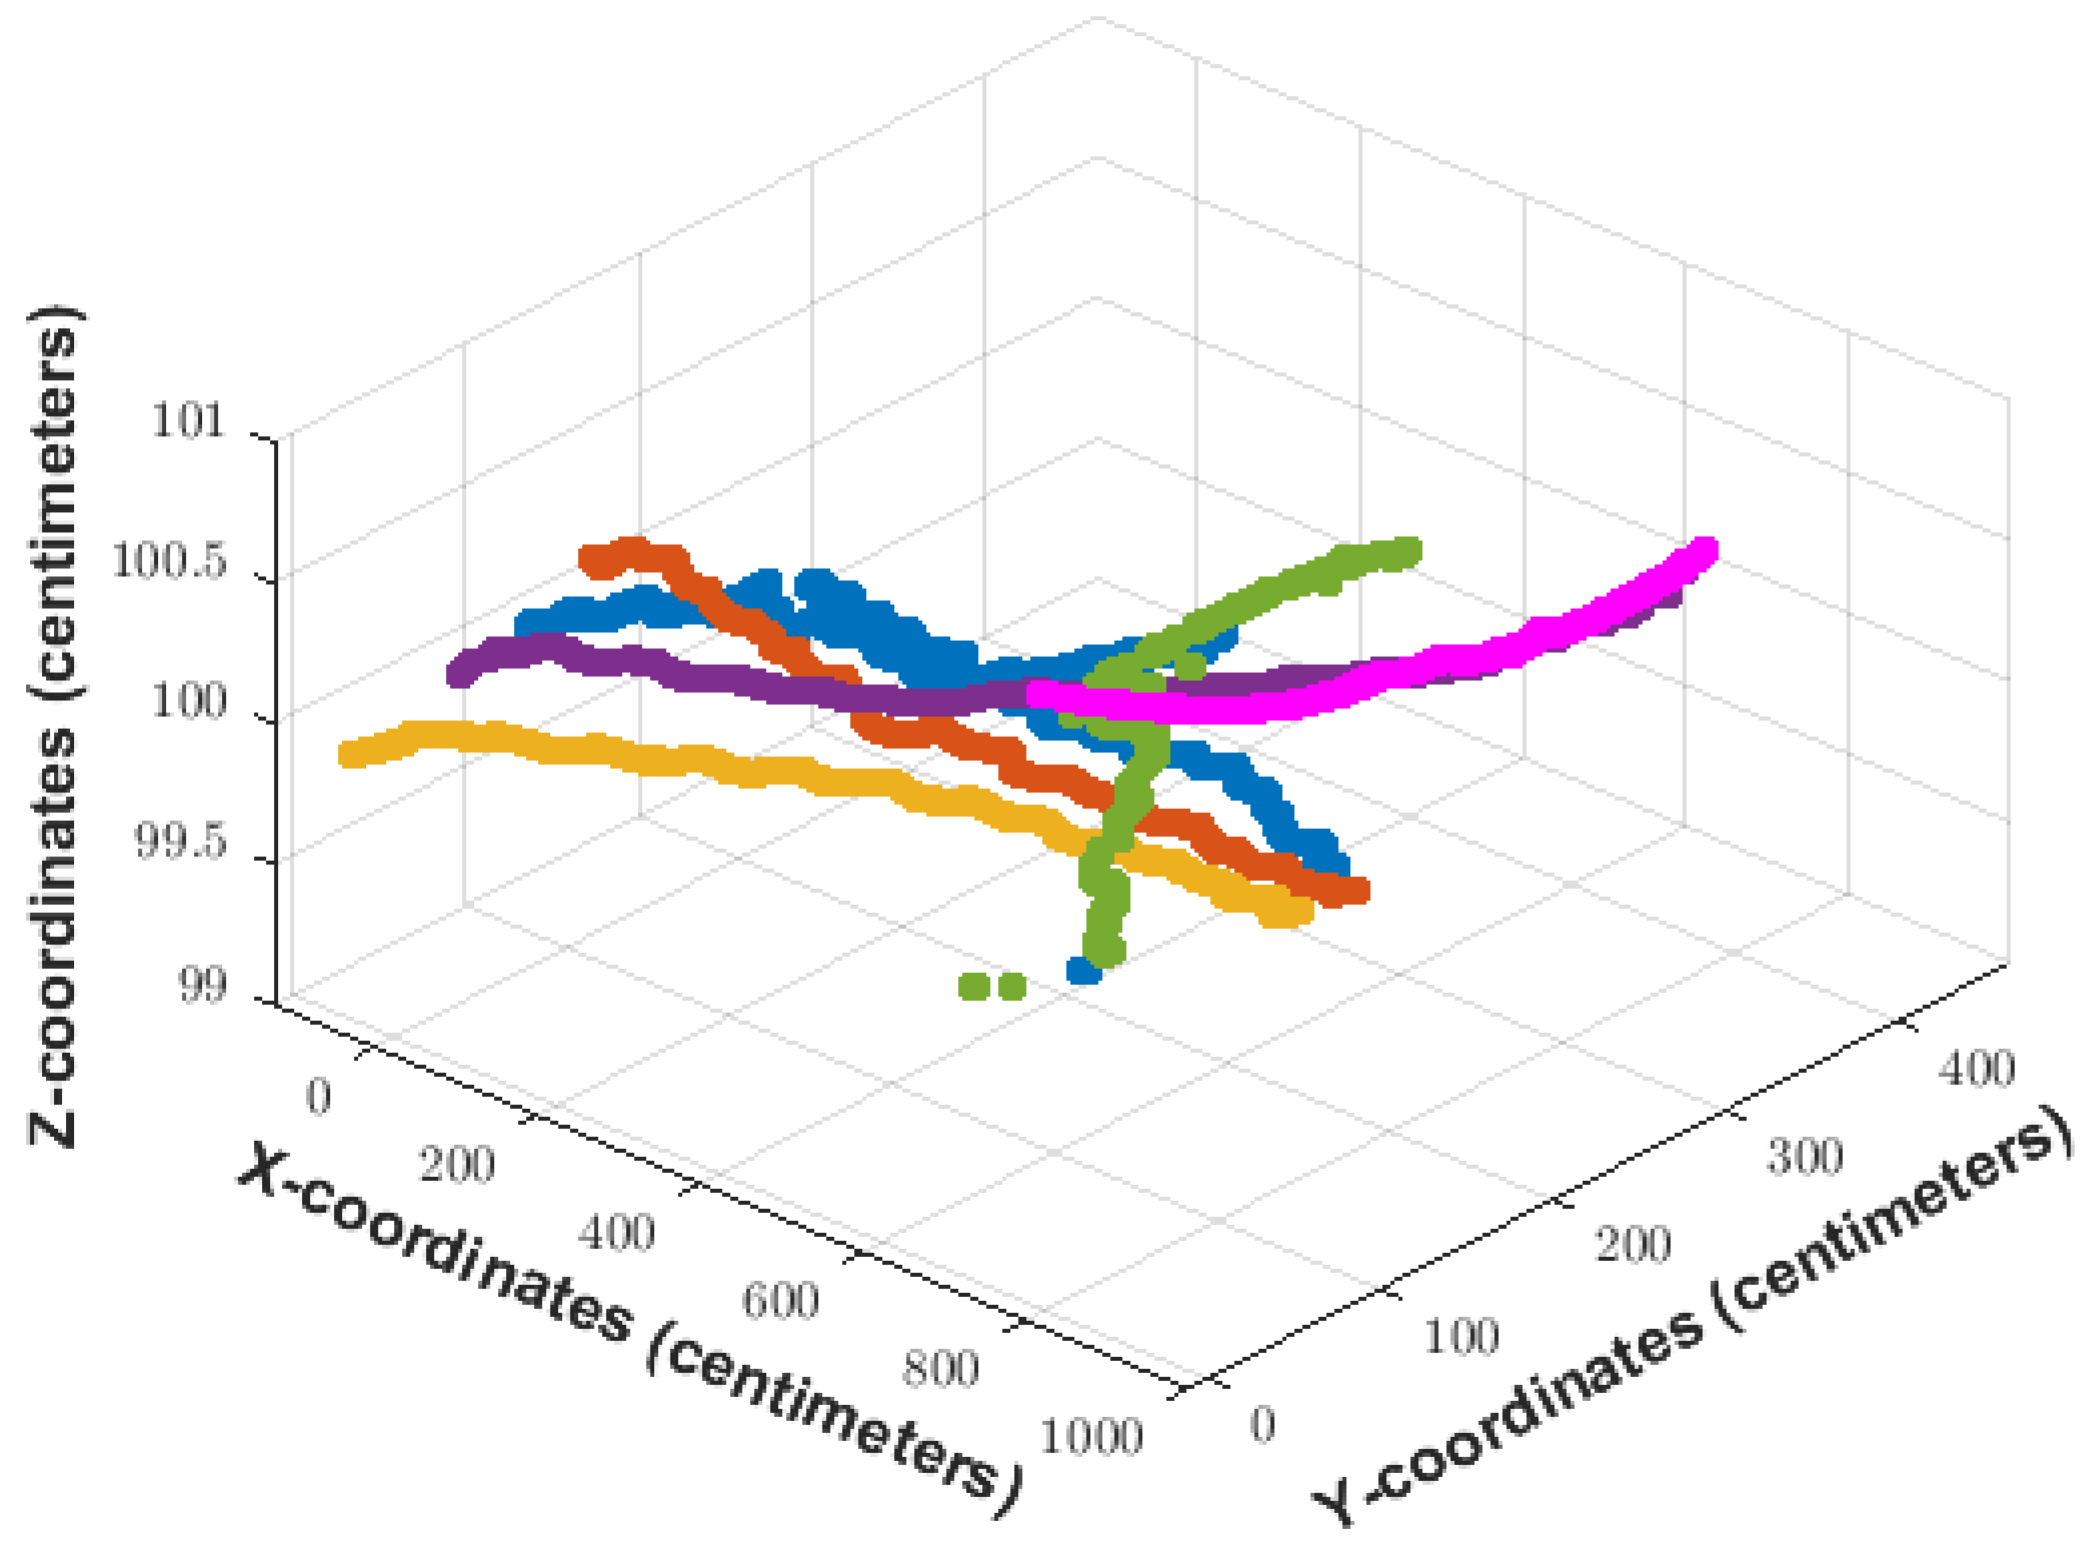
Figure 19.
Graphical representation of the results (Query 1). The colorful dots represent the different trajectories most similar to the reference, where dots in magenta color are the reference trajectory generated by the user.
Figure 19.
Graphical representation of the results (Query 1). The colorful dots represent the different trajectories most similar to the reference, where dots in magenta color are the reference trajectory generated by the user.
Figure 20.
Results of applying the metric proposal and visualization through augmented reality. The blue dots represent the trajectory created by the user, and the red dots represent one of the most similar trajectories according to the applied metric. The QR code is the active mark necessary for the augmented reality application.
Figure 21.
Graphical representation of the result (Query 2). The colorful dots represent the different trajectories most similar to the reference, where dots in magenta color are the reference trajectory generated by the user.
Figure 21.
Graphical representation of the result (Query 2). The colorful dots represent the different trajectories most similar to the reference, where dots in magenta color are the reference trajectory generated by the user.
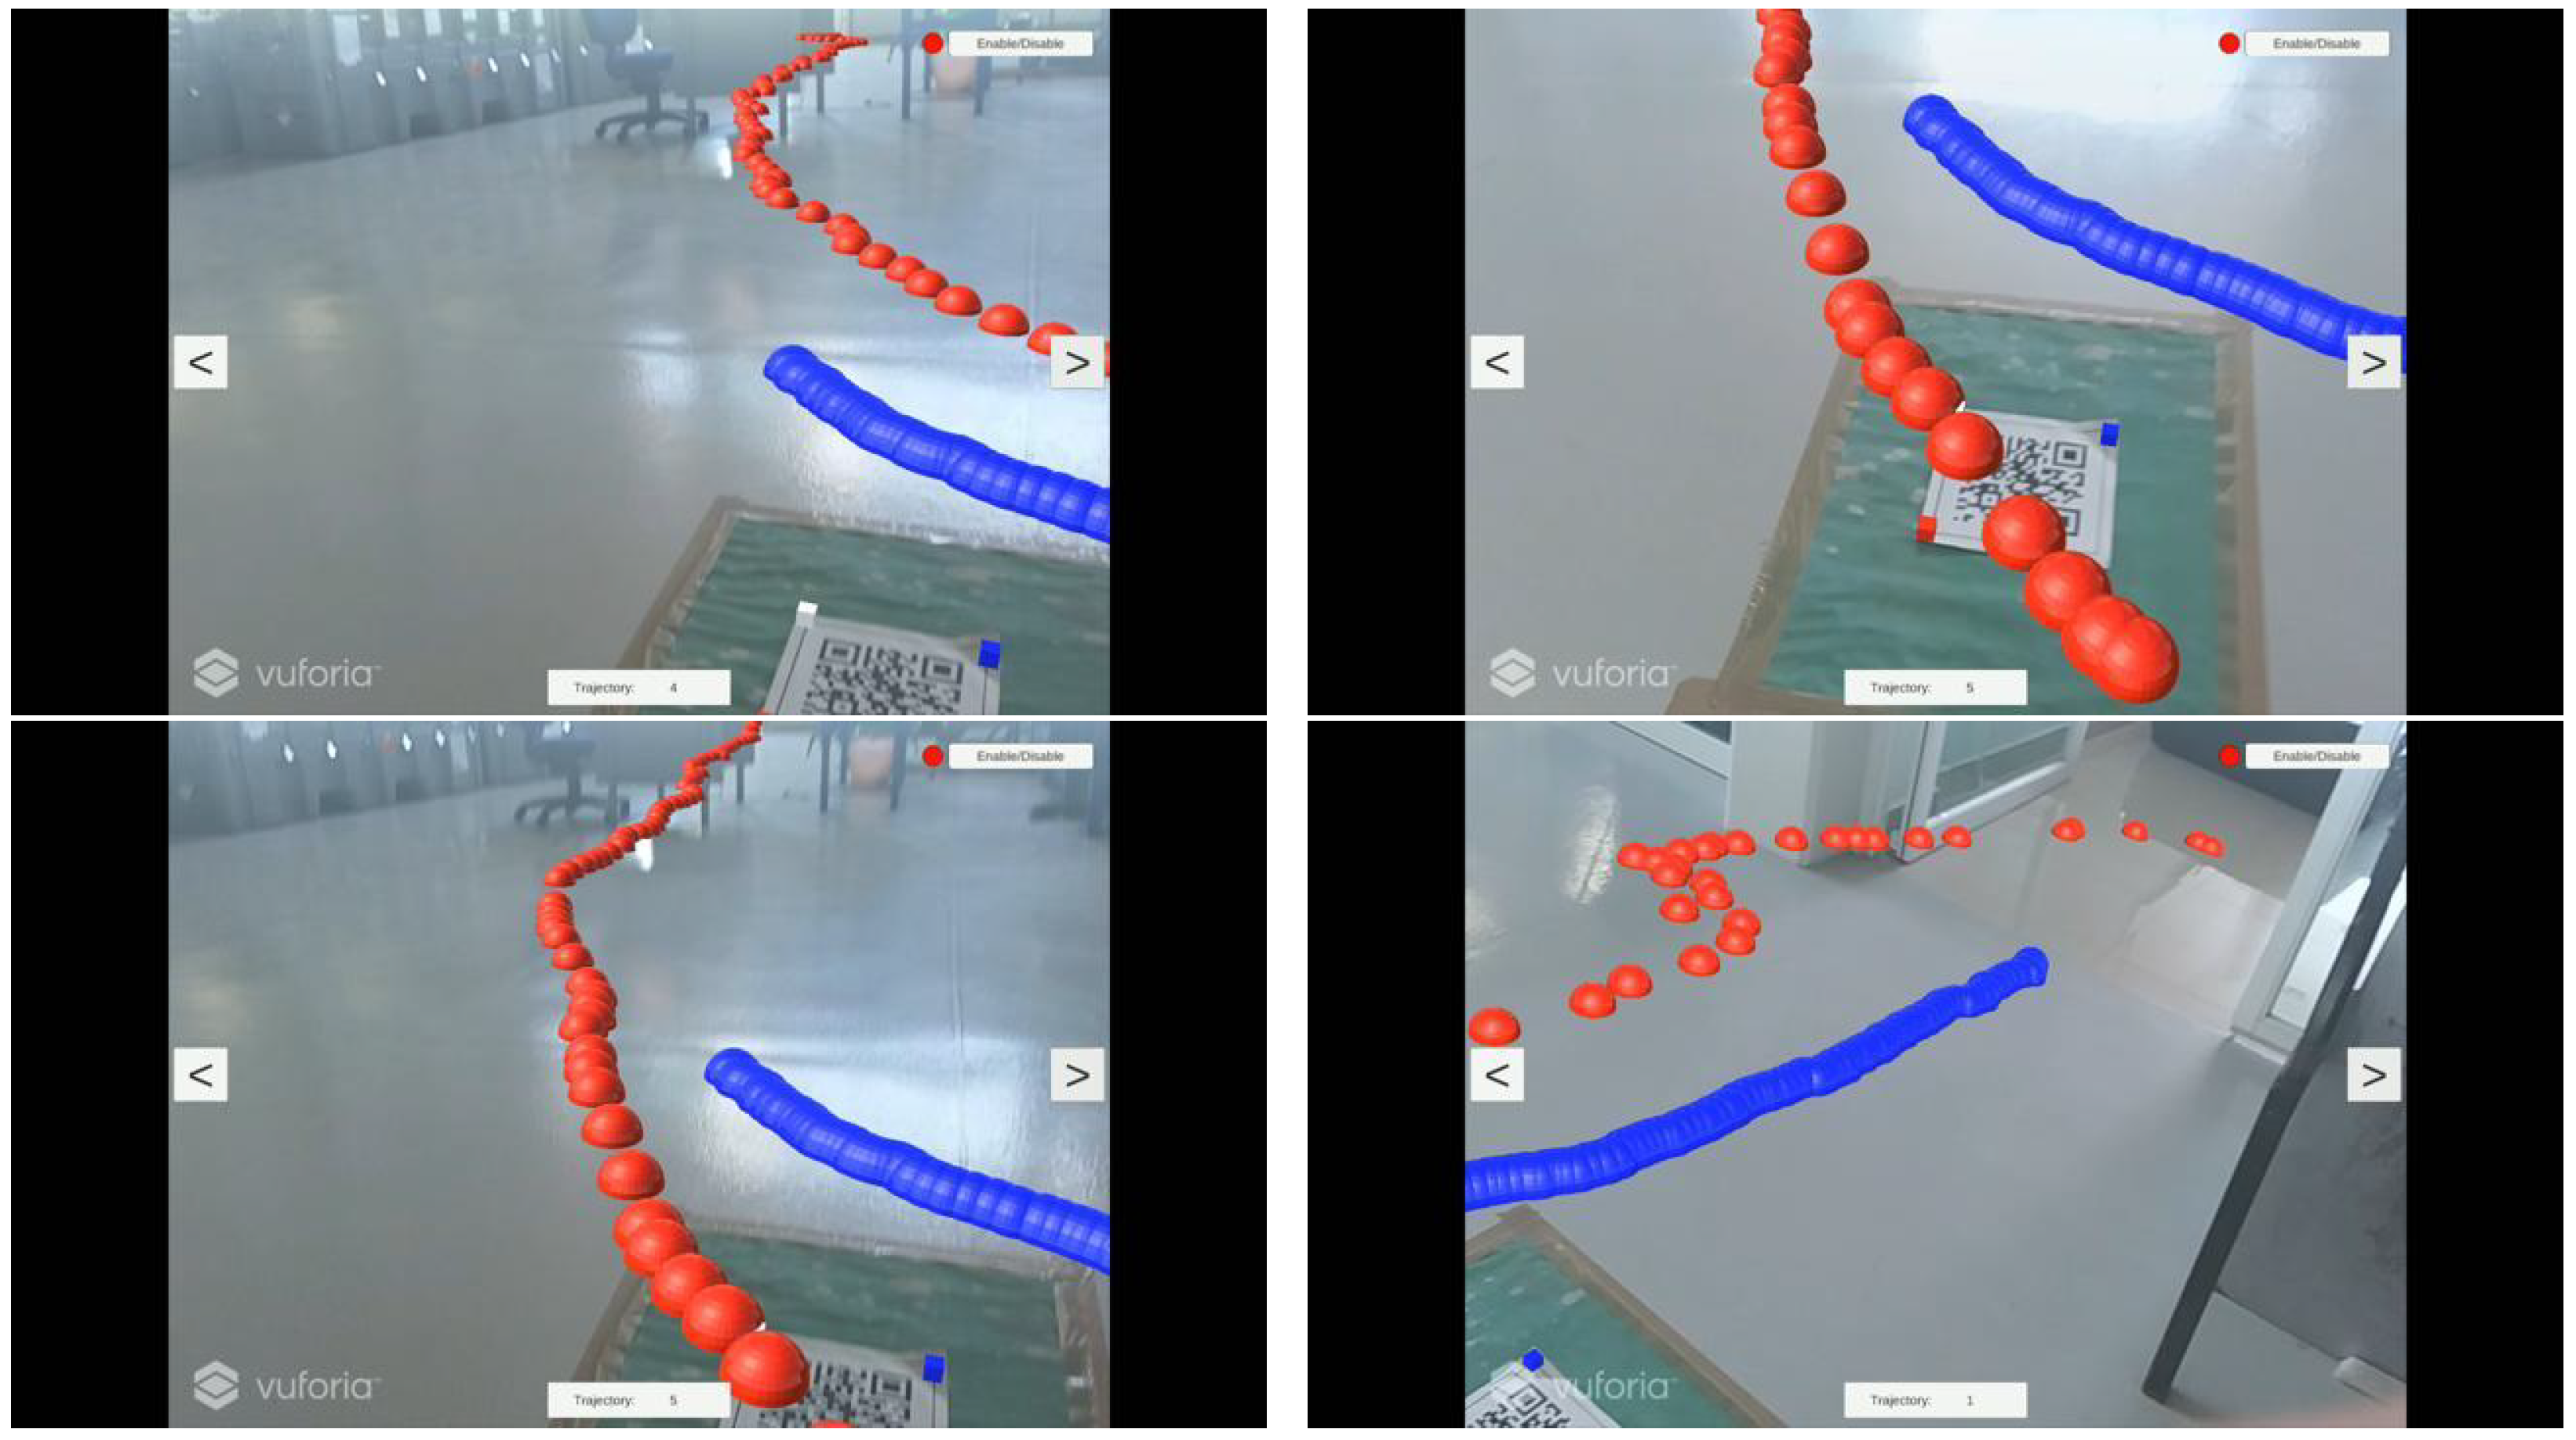
Figure 22.
The Figure shows new results by applying the metric proposal and visualization through augmented reality. The blue dots represent the trajectory created by the user, and the red dots represent one of the most similar trajectories according to the applied metric. The QR code is the active mark necessary for the augmented reality application.
Figure 23.
Graphical representation of the results. The colorful dots represent the different trajectories most similar to the reference, where dots in magenta color are the reference trajectory generated by the user.
Figure 23.
Graphical representation of the results. The colorful dots represent the different trajectories most similar to the reference, where dots in magenta color are the reference trajectory generated by the user.
Figure 24.
The topological space of the proposed metric. The blue dots represent different trajectories ordered according to the proposed metric, where the dispersion is obtained when a dynamic analysis is realized.
Figure 24.
The topological space of the proposed metric. The blue dots represent different trajectories ordered according to the proposed metric, where the dispersion is obtained when a dynamic analysis is realized.
Figure 25.
Generated classes from the reference. The colorful circles represent different classes obtained from applying the proposed metric and analyzing the dynamic of trajectories.
Figure 25.
Generated classes from the reference. The colorful circles represent different classes obtained from applying the proposed metric and analyzing the dynamic of trajectories.
Table 1.
The different object tracking methods.
Table 1.
The different object tracking methods.
| Methodology | Occlusion Tolerant | Detection Every Frame | Training Rule Required | Number/Type Objects Tracking |
|---|
| Simple Template Matching | Partial | No | No | One object |
| SVM | Partial | No | Yes | One object |
| Contour Matching | Yes | No | Yes | Multiple objects |
| Shape Matching | Yes | No | No | One object |
| Kalman Filter | Yes | Yes | No | Multiple objects |
| Particle Filter | Yes | Yes | No | Multiple objects |
| Mean Shift | Partial | No | No | One object |
Table 2.
Models of detection of movement.
Table 2.
Models of detection of movement.
| Model of Detection | Detected Movement | Description |
|---|
| Temporal differences | | The moving object is determined by calculating the difference between two consecutive images. |
| Image average | | The moving object is determined by calculating the addition of images in every frame and dividing by the total number of images added. |
| Optical flow | | Optical flow is to calculate the optical flow field of the image and perform clustering processing according to the optical flow distribution characteristics of the image. |
| Gaussian of mixture | | This method is used when there are multi-modal backgrounds. This method proposes modeling each pixel as a mixture of multiple Gaussians. |
| Background model | | This method compares a sequence of images with a reference image containing static elements; the reference image is called a background image. |
Table 3.
Results of the comparative proposed metric vs. the Hausdorff.
Table 3.
Results of the comparative proposed metric vs. the Hausdorff.
| Trajectories | Proposed Metric | Hausdorff |
|---|
| Trajectories in Figure 13 | units | units |
| Trajectories in Figure 16, first | units | 20 units |
| Trajectories in Figure 16, second | units | 0 units |
| Trajectories in Figure 16, third |
units | 10 units |
| Trajectories in Figure 16, fourth | 27.64 units | 10 units |
| Disclaimer/Publisher’s Note: The statements, opinions and data contained in all publications are solely those of the individual author(s) and contributor(s) and not of MDPI and/or the editor(s). MDPI and/or the editor(s) disclaim responsibility for any injury to people or property resulting from any ideas, methods, instructions or products referred to in the content. |
© 2023 by the authors. Licensee MDPI, Basel, Switzerland. This article is an open access article distributed under the terms and conditions of the Creative Commons Attribution (CC BY) license (https://creativecommons.org/licenses/by/4.0/).


 ,
, 


