Assessment of Fatigue Damage and Crack Propagation in Ceramic Matrix Composites by Infrared Thermography

Department of Materials Science &Engineering, University of Ioannina, 45110 Ioannina, Greece
*
Author to whom correspondence should be addressed.
Ceramics 2019, 2(2), 393-406; https://0-doi-org.brum.beds.ac.uk/10.3390/ceramics2020031
Submission received: 20 March 2019
/
Revised: 8 May 2019
/
Accepted: 27 May 2019
/
Published: 10 June 2019
(This article belongs to the Special Issue Damage and Lifetime of Ceramic Matrix Composites)
Abstract
:The initiation and propagation of damage in SiC fiber-reinforced ceramic matrix composites under static and fatigue loads were assessed by infrared thermography (IRT). The proposed thermographic technique, operating in lock-in mode, enabled early prediction of the residual life of composites, and proved vital in the rapid determination of the materials’ fatigue limit requiring testing of a single specimen only. IRT was also utilized for quantification of crack growth in the materials under cyclic loads. The paper highlights the accuracy and versatility of IRT as a state-of-the art damage assessment tool for ceramic composites.
1. Introduction
The highly desirable properties of ceramic matrix composites (CMC), including damage tolerance, fracture toughness, wear- and corrosion resistance, and crack growth resistance, allow them to withstand severe thermomechanical loading conditions [1]. As such, the materials are used today in aerospace applications, such as braking systems, structural components, nozzles, and thermal barriers. Glass–ceramic matrix composites reinforced with continuous SiC fibers have received particular scientific attention as they offer additional attractive properties, such as high strength and stiffness, low density, and chemical inertness at conventional and oxidative environments and over a wide range of temperatures [2].
The necessity of monitoring the structural integrity of aerospace composites and their structures is key to the prevention of failure as well as to the safe and economical operation of the structures. Such endeavors are accomplished by regular observation of the structures for signs of damage or deterioration which can trigger the proper repair actions hence helping extend the life of the components. Among the highly sought-after nondestructive methods capable of monitoring the structural integrity of aerospace structures in an efficient and economical manner, infrared thermography (IRT) stands out for its rapidness, straightforwardness, and reliability. Currently, both the National Aeronautics and Space Administration (NASA) and Astrium, the European Space Company, rely on IRT to detect defects in shuttle wings, rudders, tails, thruster chamber assemblies, and other composite components [3,4,5,6,7,8]. IRT captures the thermal energy emissivity of the specimen which is directly related to the damage mechanisms that form and develop during material fracture [9]. It is an accurate, facile to implement, fast, noncontacting technique which requires one-sided access to the component.
The present work reviews the application of IRT in monitoring the formation and development of damage during cyclic and fatigue loading of SiC fiber-reinforced barium osumilite (barium-magnesium-aluminium-silicate, BMAS) glass–ceramic matrix composites. IRT was used to identify the most critical, with respect to fracture, damage mechanisms as well as to monitor crack propagation under cyclic and dynamic loads and to predict the composite’s residual life [10]. IRT was used in state-of-the-art lock-in mode to rapidly and precisely assess the fatigue limit of the CMC, using data from single-specimen tests [11,12]. The potential of the technique in capturing crack propagation in passive mode was also demonstrated.
2. Experimental
The SiC/BMAS composites utilized in the present work were provided in the form of 3 mm thick cross-ply laminates. The BMAS glass-matrix, consisting of 50 wt% SiO2, 28 wt% Al2O3, 7 wt% MgO, and 15 wt% BaO was reinforced by SiC Tyranno fibers with nominal elastic modulus and strength values of 190 GPa and 3.3 GPa, respectively, as reported by the manufacturer. The laminates were stacked and hot-pressed at 1200 °C for 10 min in a symmetric (0/90)4s orientation. During hot-pressing, a chemical reaction between the fiber and the oxides of the matrix is known to result in the formation of a weak carbon-rich interphase [13] responsible for large-scale bridging and pull-out phenomena during composite fracture [14]. Rectangular specimens of dimensions 105 × 12 × 3 mm3 were prepared in a vertical CNC with fiber orientation in the external plies set to 0° with respect to the specimen’s longitudinal axis. Double-edge-notch (DEN) specimens of initial notch-to-width ratios of 0, 0.2, and 0.35 were prepared using a diamond wafering blade intended for cyclic tension testing. Dogbone specimens were prepared for monotonic tensile testing as well as for fatigue loading. Compact tension specimens for crack growth measurements under loading–unloading–reloading cycles, with provision for load-line crack opening displacement (COD) measurement, were prepared by abrasive water jet cutting according to ASTM E1820-01 specifications, width W = 50 mm, and notch length of a0 = 25 mm, corresponding to an initial notch-to-width ratio of 0.5.
All mechanical testing was performed at ambient temperature on an Instron 8800 servo-hydraulic frame equipped with a ± 100 kN load cell. DEN and dogbone specimens were gripped with a pressure of 4 MPa and were tested without end-tabs at a nominal gauge length of 50 mm. Static tensile testing, both monotonic and cyclic, was performed under crosshead displacement control with a rate of 0.2 mm/min corresponding to an initial strain rate of 4.0 × 10⁻³ min−1 within the 25 mm gauge length of the external, knife-edge-mounted axial extensometer. In cyclic tension experiments with unloading/reloading loops, unloading commenced at 10−3 strain and repetitions occurred with a step of 1.5 × 10⁻³ strain. The composites were unloaded to full relaxation before reloading. Compact tension specimens were tested under cyclic tension with unloading-reloading loops under crosshead displacement control with a rate of 0.4 mm/min. Load-line crack opening displacement was measured using an Instron® COD clip gauge with a gauge length of 10 mm. The imposed unloading–reloading cycles were based on crosshead displacement. The first unloading step commenced at 0.125 mm displacement and subsequent cycles occurred at a step of 0.075 mm. All specimens were unloaded to complete relaxation; the reloading sequence was essentially triggered by the attainment of a zero load reading.
Fatigue step-loading until fracture was conducted on dogbone specimens, each loaded at consecutively increasing stress amplitudes of the ultimate tensile strength, σUTS. The commencing stress amplitude was chosen as low as 10% σUTS to allow capturing of the whole mechanical response of the material. The subsequent four amplitudes, up to 50% σUTS, occurred with a step of 10% σUTS. At 60% σUTS, the fatigue loading step was decreased to 5% σULS and remained the same until ultimate failure of the materials. A total of 6000 cycles were applied to the specimen at each stress amplitude. It is important to highlight that the same specimen was cycled at increasing stress amplitudes, in order to demonstrate the rapidness of evaluation of the fatigue limit on a single specimen only. This differs from the classical fatigue limit determination methodology where a specimen is fatigue at a given stress amplitude for a very large number of cycles until failure, requiring testing a population of specimens equal to the stress amplitudes investigated. The frequency of the sinusoidal fatigue load was 10 Hz and R was 0.1.
Throughout tests, temperature variations due to the applied loading were monitored by an infrared thermography camera (CEDIP, MIW). The camera featured a cooled indium antimonide (InSb) detector (3–5 μm), a focal plane array (FPA) with pixel format of 320 (H) × 240 (V) and a temperature sensitivity of 20 mK. Temperature was recorded with a sampling rate of 100 Hz. Aliasing was avoided by recording the baseline emissivity of the material prior to load application which involved capturing the IR fingerprint of the surface with the thermal camera. Throughout cyclic loading of DEN specimens of the SiC/BMAS composite, thermographs were recorded from the high-stress concentration area between the notches. For lock-in thermography measurements during fatigue loading, specimens were spray-coated with a matte black varnish in order to achieve uniform high-level surface emissivity. Optimal field of view (FOV) conditions were achieved by positioning the camera at approximately 40 cm in front of the gripped specimen. The IR camera was connected to the lock-in amplifier which, in turn, was connected to the servo-hydraulic controller. This enabled synchronization of the lock-in amplifier and the testing machine frequencies and capturing of lock-in images and data during fatigue loading. The IR camera was used to measure the amount of energy emitted as infrared radiation, which is a function of the temperature and emissivity of the specimen. According to a previous study, the measured energy corresponds to the intrinsically dissipated energy while the fatigue limit is located at the break of the intrinsic dissipation regime of the loaded specimen [9].
3. Results and Discussion
3.1. Mechanical Response under Static Tension
The stress–strain response of notched and dogbone SiC/BMAS specimens under cyclic and monotonic tension, respectively, is presented in Figure 1. Un-notched specimens exhibited a triple regime behavior consisting of a linear initial part followed by a regime of gradually decreasing tangent modulus and a final regime of apparent stiffening. The second regime (regime “II”) is associated mainly with interfacial damage, most importantly interfacial debonding, but also with progressive matrix cracking evidenced as decreasing material stiffness (average slope of unloading/reloading loops). In the third regime (regime “III”) an increase in material stiffness and tangent modulus coupled with an almost linear stress–strain relationship are apparent. In this ultimate regime, the mechanisms of interfacial debonding and matrix cracking have reached a saturated state, hence material damage is not governed by the interface or matrix anymore, but by a mechanism of superior strength, essentially load bearing by intact fibers [15]. Similar triple regime phenomena with prefailure macroscopic stiffening and linear stress–strain relationships have been encountered before [16]. As observed in the curves of the bottom graph of Figure 1, Regime III is absent from the mechanical behaviors of notched specimens. This is probably due to premature fiber—hence also composite—failure stemming from stress concentration gradients in the vicinity of the notch roots. In notched specimens instead, the material failed soon after the maximum load was attained, giving minimal “tail” effects.
Most importantly, the stress–strain curves of un-notched specimens defined with unique precision have a common intersection point (CIP) of unloading–reloading curves in the first quadrant of the stress–strain curve in the tension domain. The coordinates of the CIP, 0.001 strain and 90 MPa stress, are directly related to the axial residual stress state of the composite [17,18]. While a thorough analysis of the CIP feature for the particular composite has been the subject of a previous work [19], it is interesting to repeat here that a self-assembled CIP has never before been encountered experimentally.
Comparing the monotonic and cyclic tension curves for the SiC/BMAS composite (top graph of Figure 1), it can be concluded that cyclic loading results in an increase by 20% in attainable material stress, calculated at fracture. If this increase is due to higher amounts of energy dissipated at damage mechanisms such as interfacial debonding, matrix cracking, and load bearing by intact fibers [20], it is then suggested that cyclic loading by itself improves the energy dissipation capacity of the material. The existence of another energy dissipation mechanism, pull-out, anticipated by the weak interfacial bond discussed in the experimental section, was verified after the end of the tests: Failed specimens had not separated in two pieces after removal from the grips, with the frame still indicating small load values of the order of a few Newtons. This meant that fibers had failed within the matrix environment and had pulled-out noncompletely before removal of the specimens from the grips [21].
Composite strength and modulus appeared to increase with decreasing notch length. Un-notched specimens enjoyed average strengths and moduli of 355 MPa and 151 GPa, respectively. The corresponding values for the 0.2 and 0.35 notched-to-width length were 280 MPa/119 GPa and 270 MPa/108 GPa, respectively.
3.2. Static/Cyclic Loading
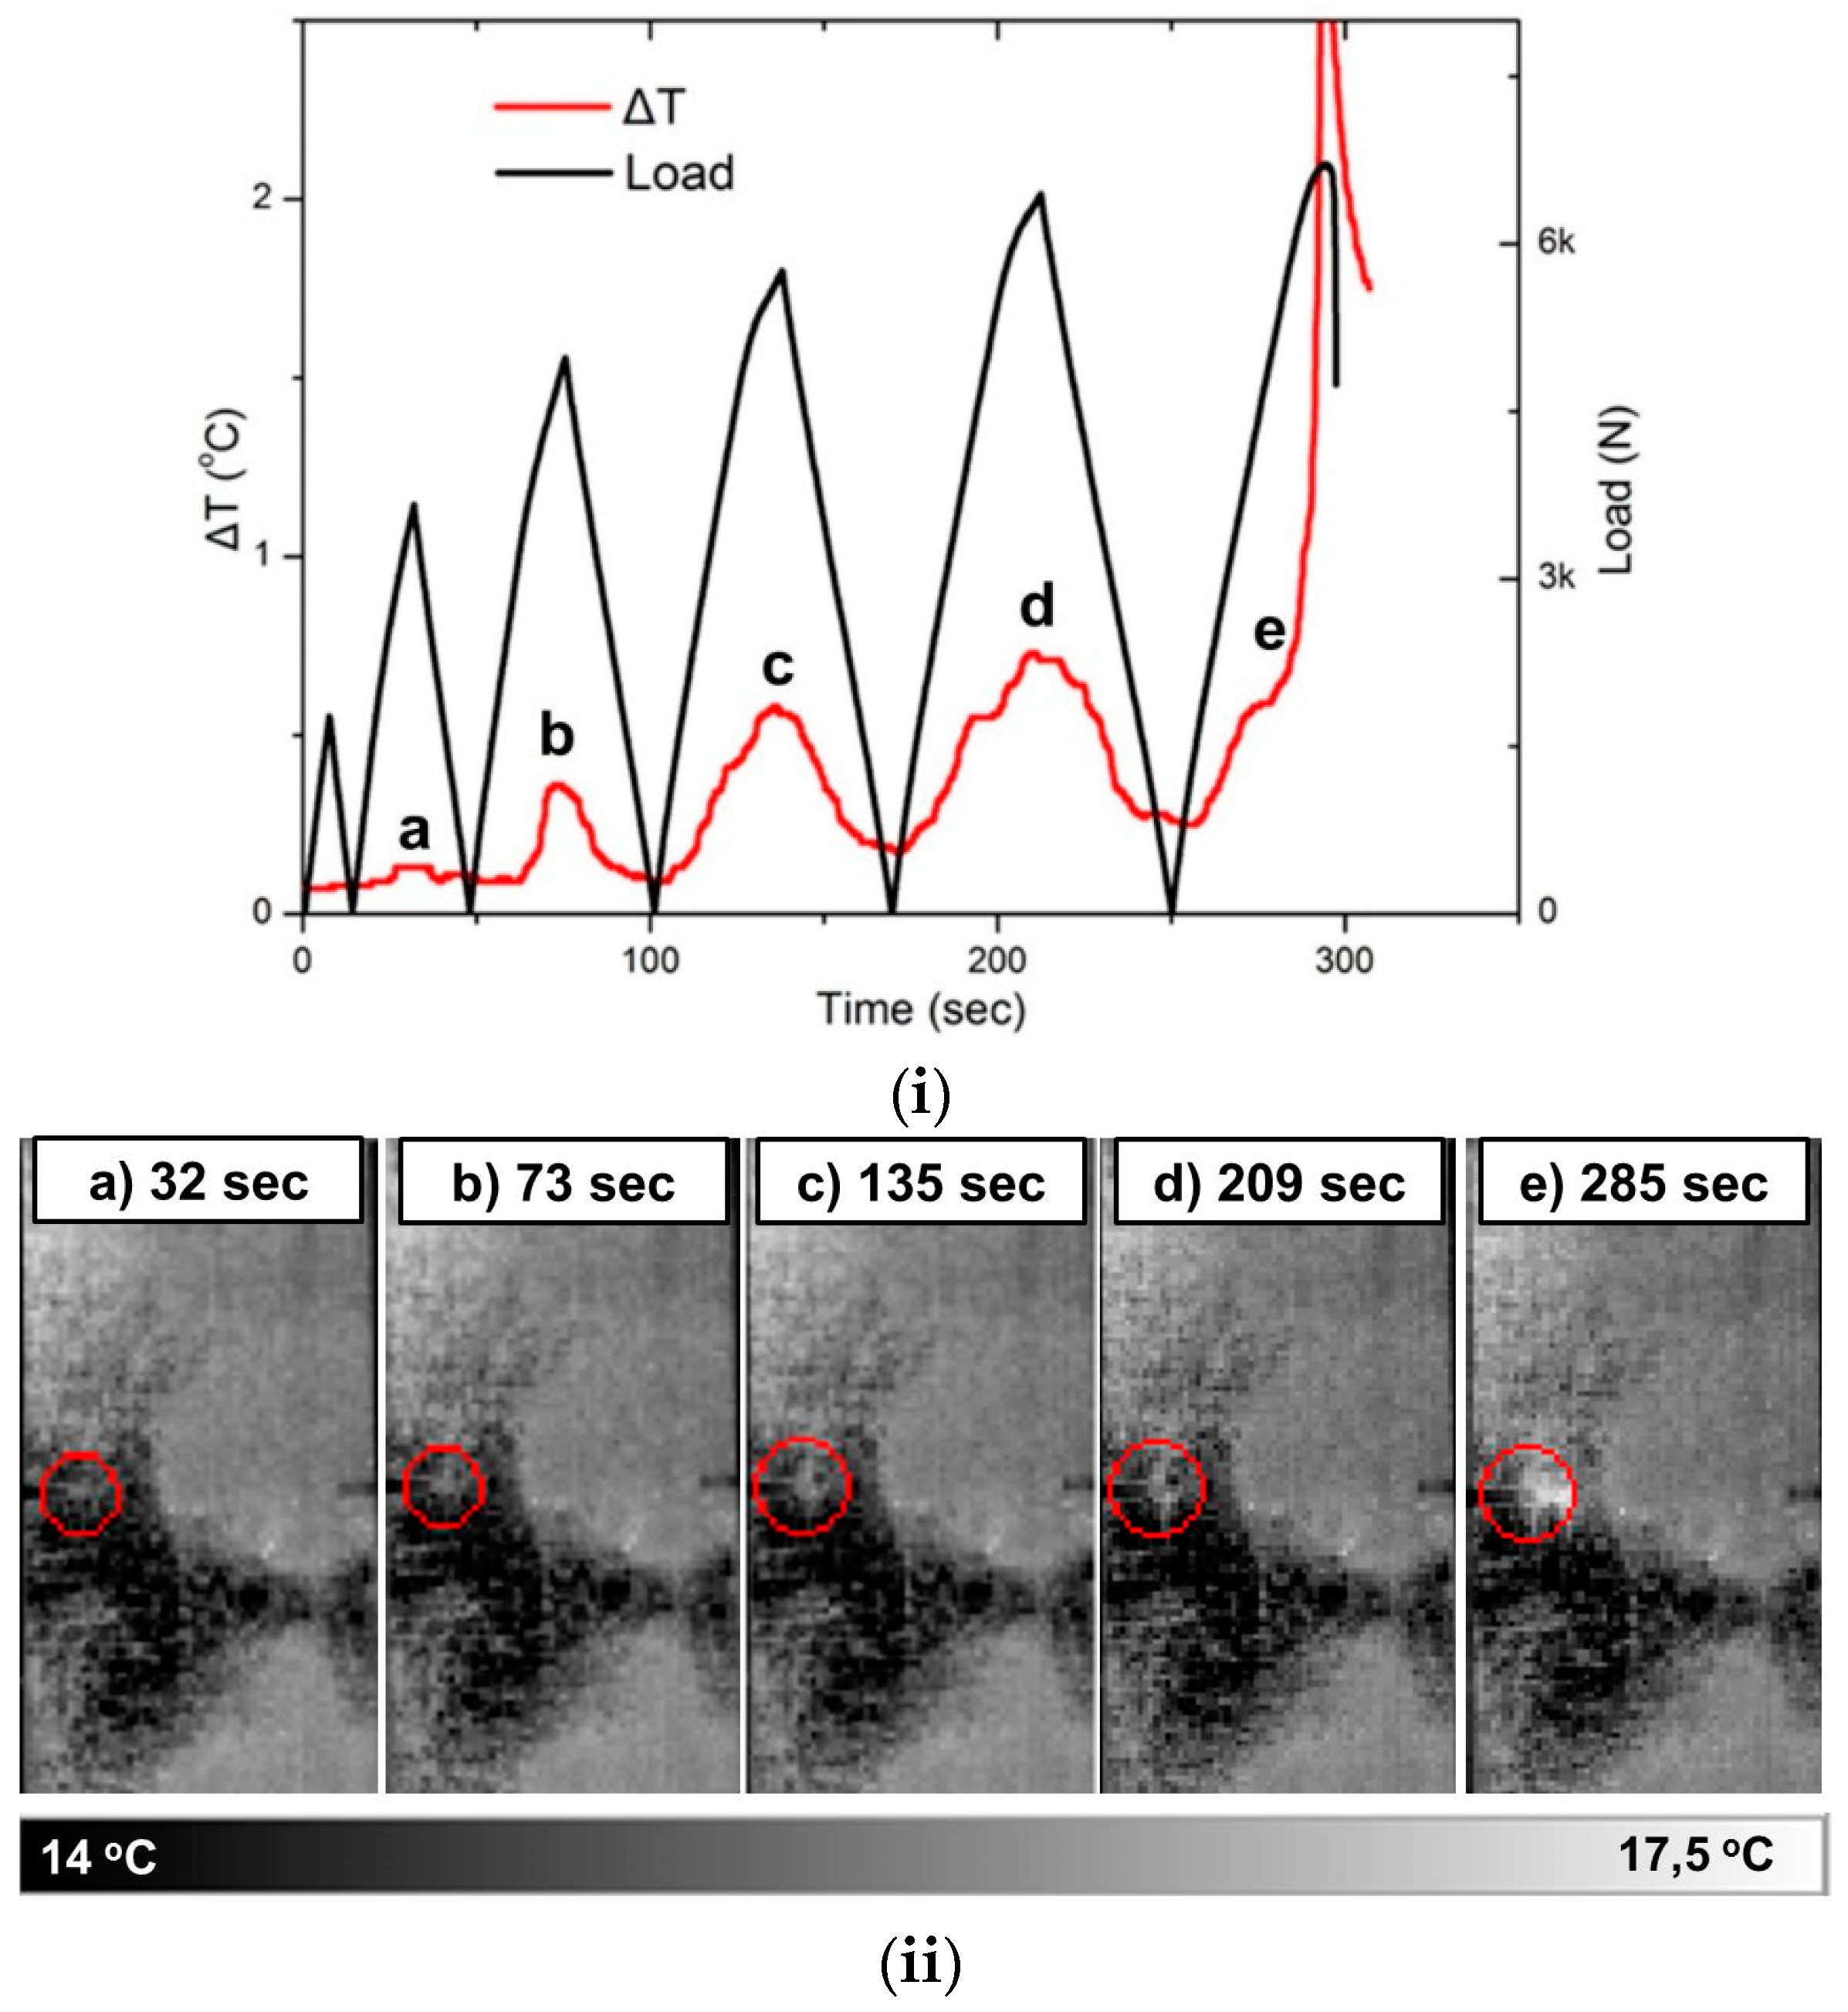
Temperature variation, ΔT, measured by IRT and instant load are plotted in Figure 2i as a function of time for a DEN specimen with a 0.35 notch-to-width ratio. Indices “a” through “e” denote the instances of the thermographs shown in Figure 2ii, collected at the notched ligaments of the composites. It is observed that peak ΔT location coincides with the location of maximum load for every cycle, whereas peak ΔT magnitude increases with progressing loading, hence also material damage. At the ultimate cycle, the ΔT trace appears to follow a completely different pattern to those in previous cycles, wherein temperature appears to drastically increase, indicating that the specimen is heading for catastrophic fracture.
In Figure 2ii, the locations of crack initiation, as identified by IRT, are indicated by a red circle mark. The apparent high-temperature area located outside and to the right of the circle mark is a baseline pattern that exists even before load application and remains constant until catastrophic failure. It is associated with the specimen’s surface emissivity, not with material damage. It should not be ignored that IRT is concerned with temperature variations as a result of progressive damage, not with absolute values. Under this rationale, no noticeable change in temperature is seen up to 32 s experimental time (Figure 2ii.a). Within 73 s of testing (Figure 2ii.b), very small temperature variations can be observed within the marked (circle) area. Temperature increases become more obvious in Figure 2ii.c,d, 135 s and 209 s into loading, respectively. It is indicated that damage is extending in area and magnitude. In the last loading cycle, 285 s in the test, a dramatic increase in temperature throughout the whole notched ligament signifies that material failure is imminent.
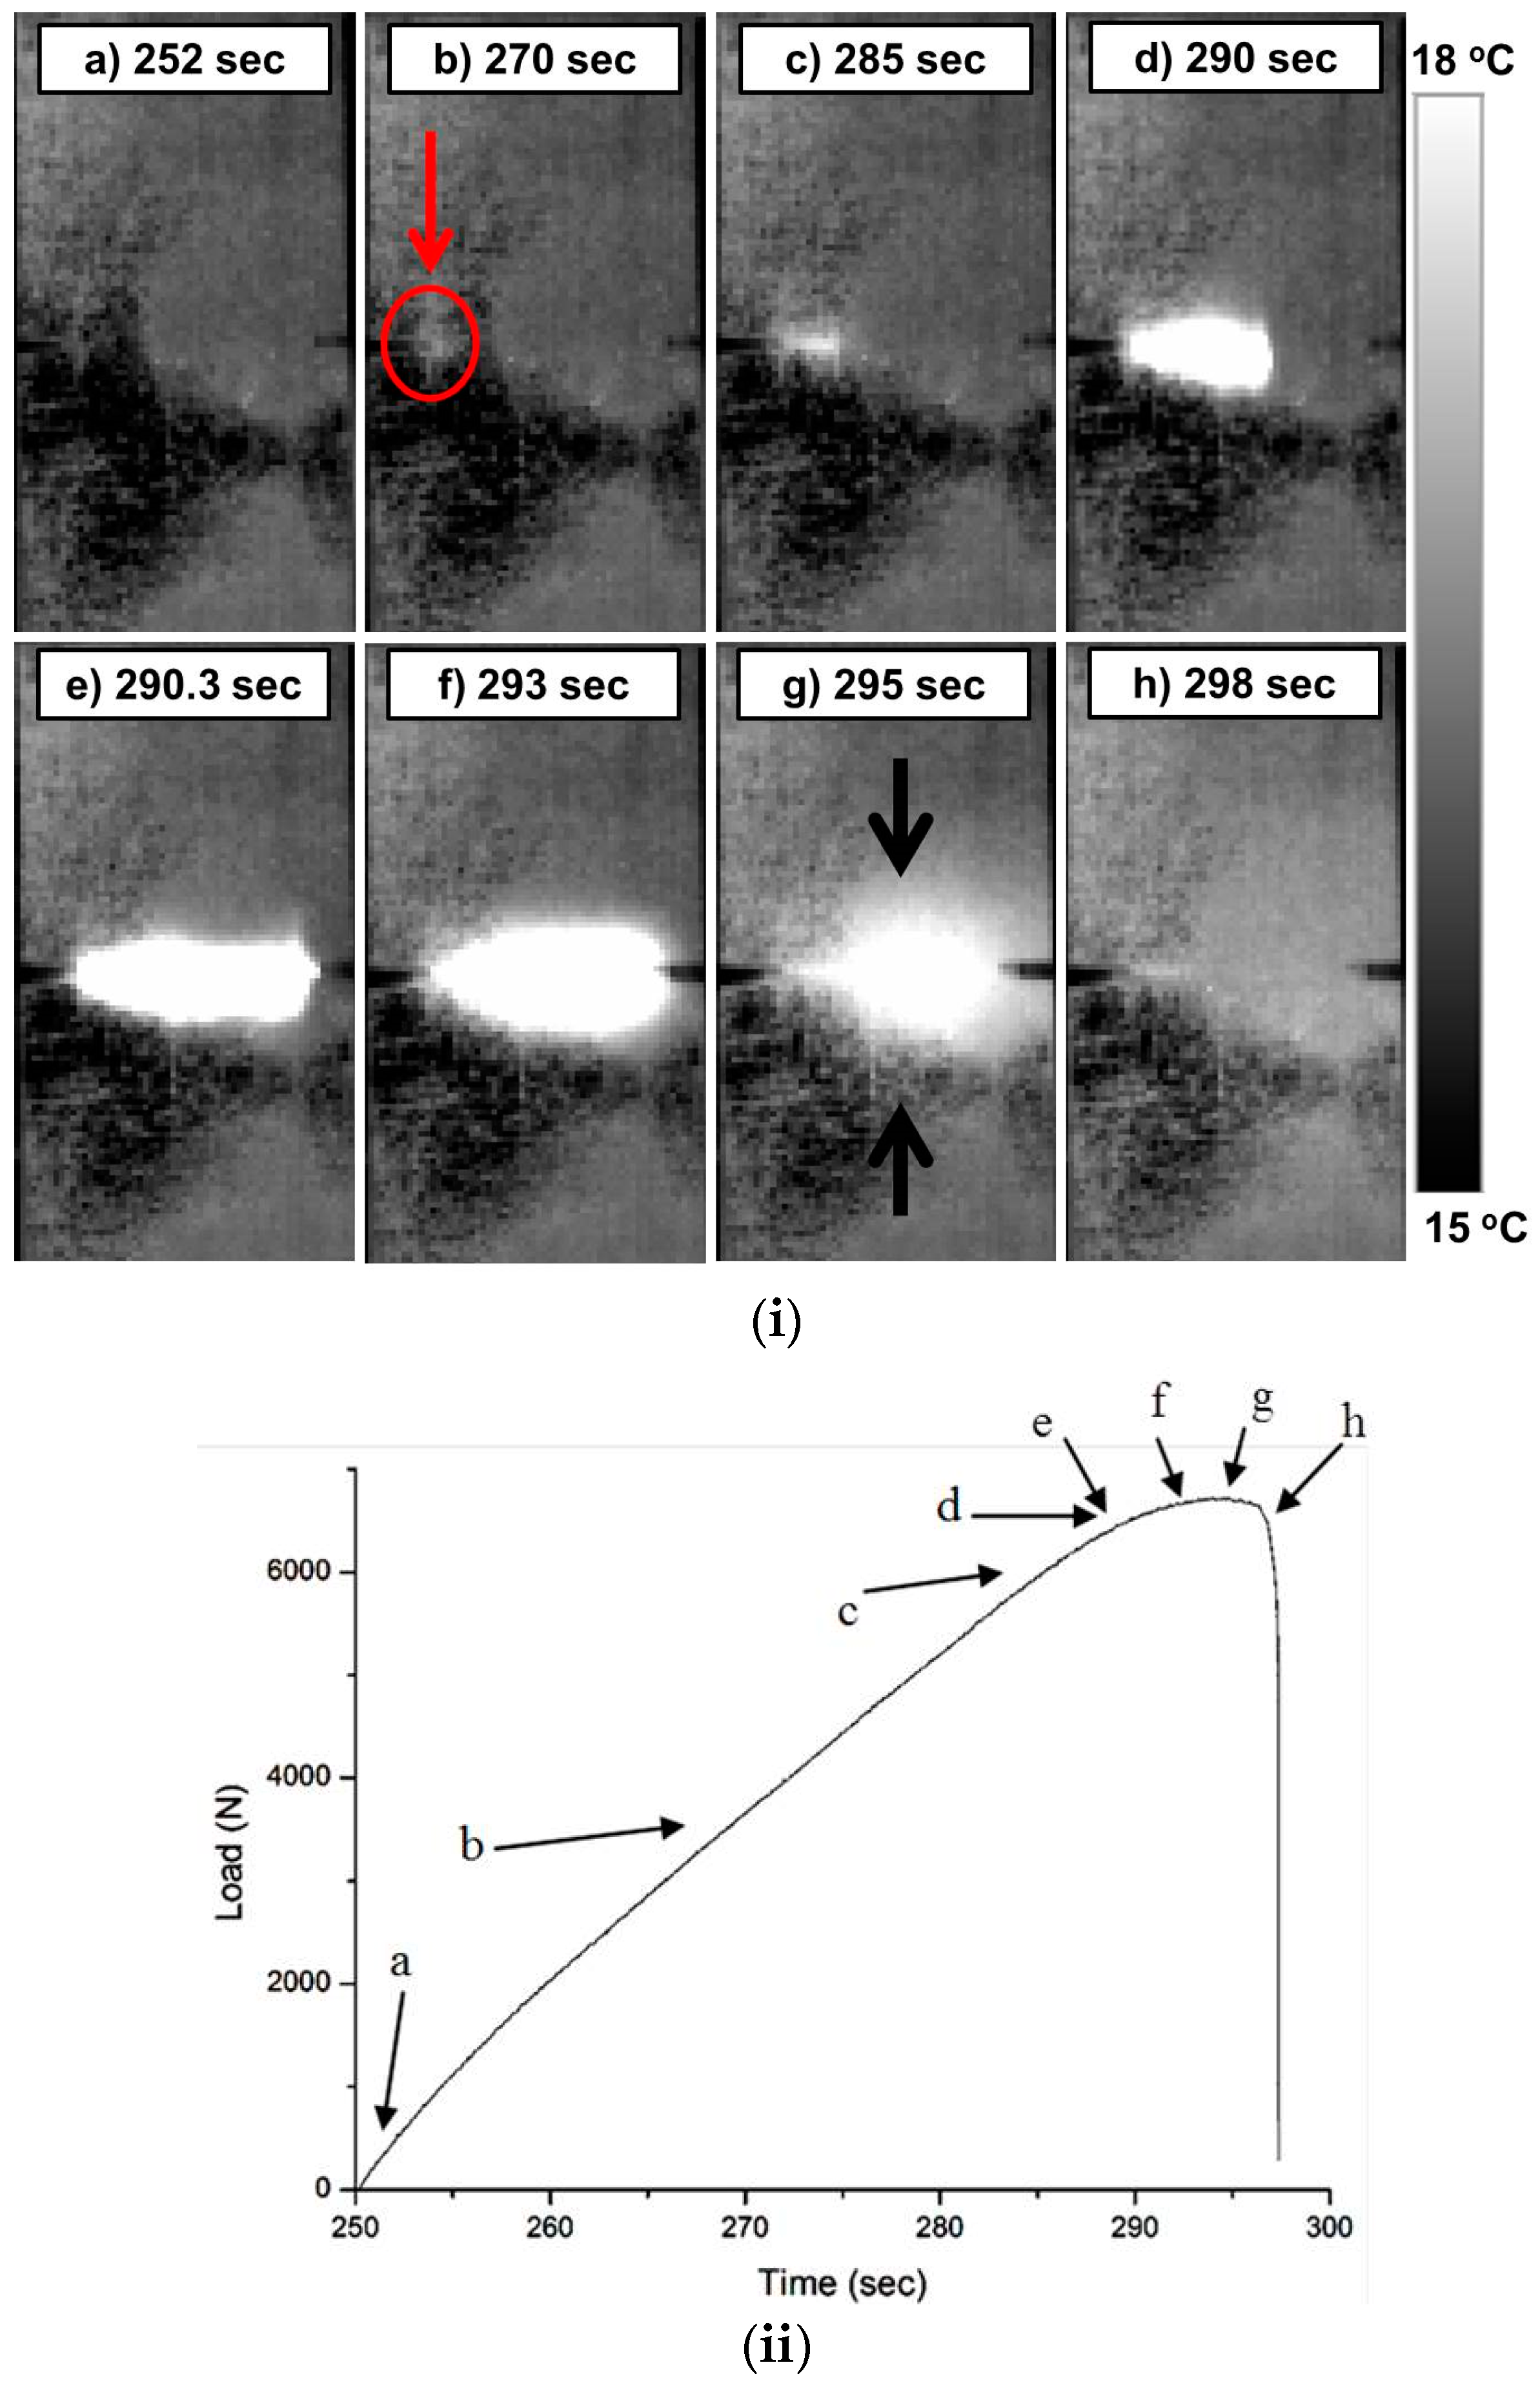
The thermographic behavior within the ultimate loading cycle of the same 0.35 notch-to-width ratio specimen is demonstrated in Figure 3 and analyzed in the following. Indices “a” through “h” presented in Figure 3ii define the instances of the thermographs in Figure 3i (note the notch roots). In Figure 3i.a, no heat appears to exist within the notched ligament. In the next instance, Figure 3i.b, a red arrow indicates what appears to be crack initiation. At 285 s, Figure 3i.c, a significant temperature difference is observed, which coincides with the change in the slope of the mechanical response curve. It is believed that from this instance on, subsurface cracks start propagating from the left notch root with direction to the right. It is important to establish this instance as precisely as possible, as this will facilitate early prediction of the final fracture. It is noted that the associated time (285 s) corresponds to 73% of the total duration of this ultimate loading cycle. Five seconds later (Figure 3i.d at 290 s) the subsurface crack appears to span half of the notched ligament, while only another 300 ms later (Figure 3i.e) it propagates abruptly and unstably towards the right notch. The maximum temperature is attained (Figure 3i.f) at an instance that coincides with the maximum load of the final loading cycle. This temperature is associated with the matrix cracking saturation and the load-bearing of the reinforcing fibers. Temperature starts decreasing at the left notch in the next Figure 3i.g, while it increases above and under the subsurface crack, as indicated by black arrows. This increase is due to the fiber failure under the critical level of applied load. Failed fibers pull-out, giving rise to the frictional thermal energy [20,22] evidenced in Figure 3i.h.
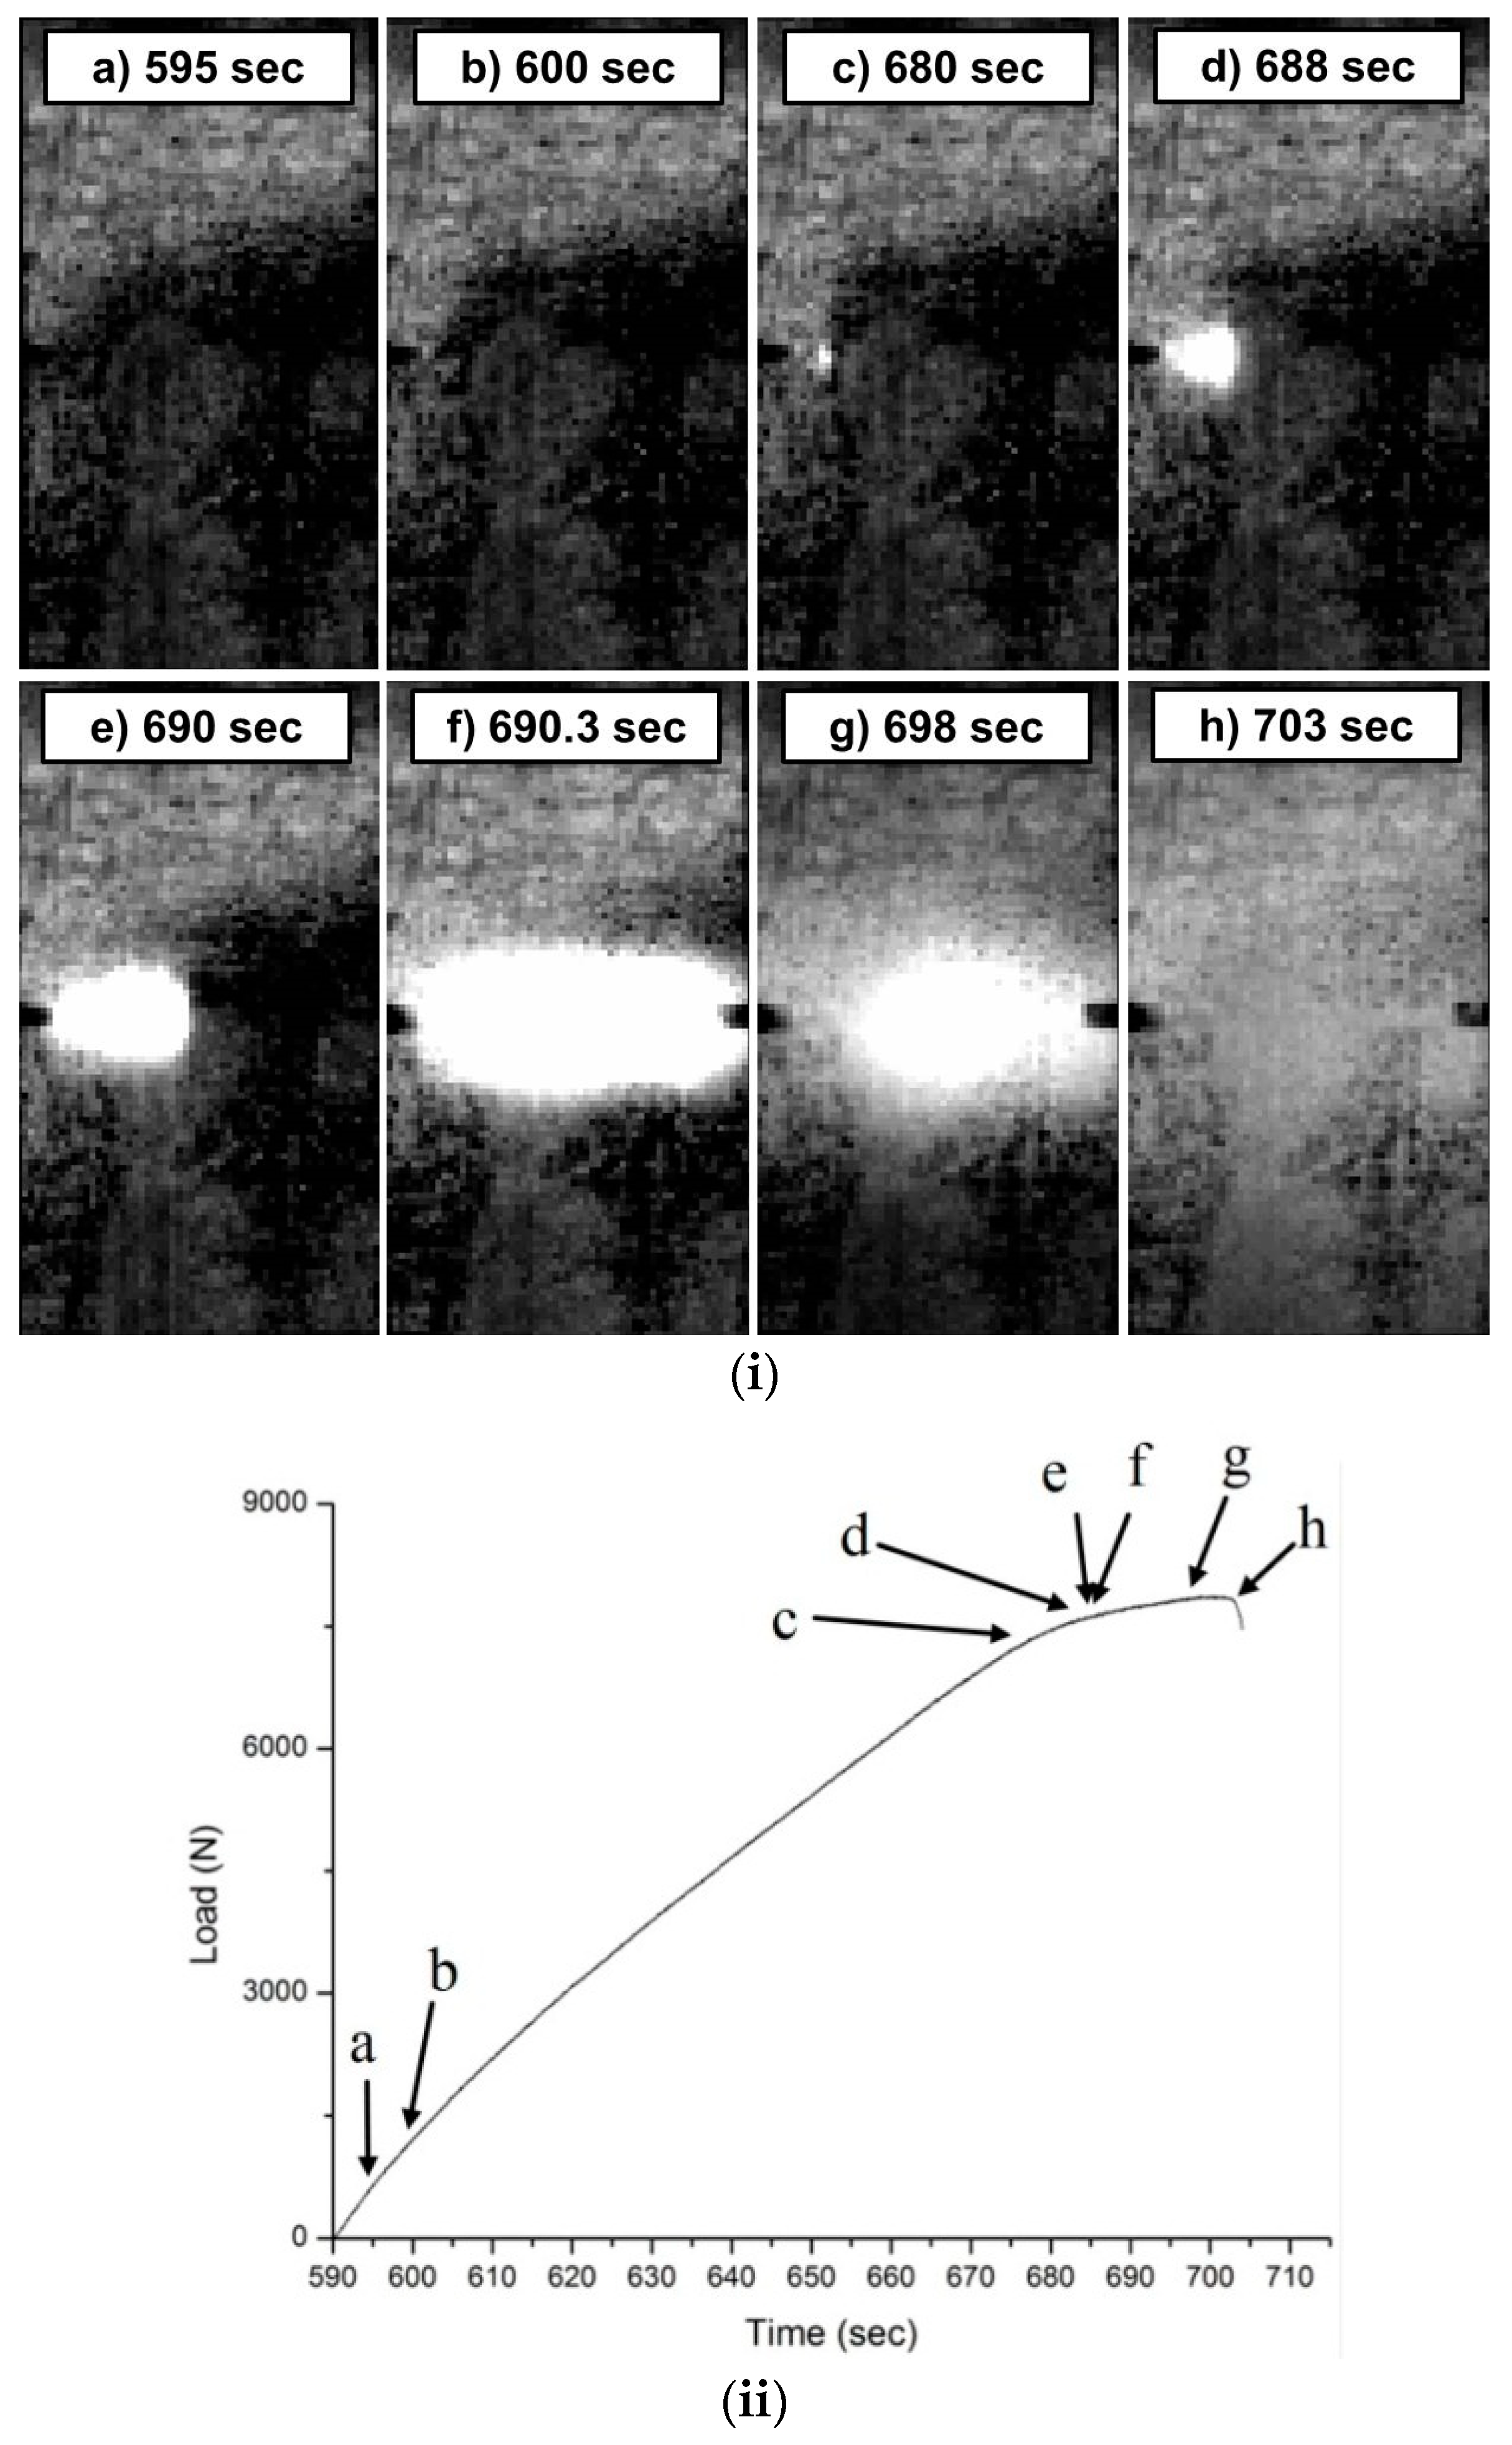
Similar trends were observed for DEN composites with smaller notches, as in specimens with 0.2 notch-to-width ratios; the thermographic behavior within the ultimate loading cycle of such a specimen is demonstrated in Figure 4 and analyzed in the following. Again, indices “a” through “h” presented in Figure 4ii define the instances of the thermographs in Figure 4i. After 600 s of testing time, Figure 4i.b, no “warm” damage areas are seen in the thermographs. Crack initiation appears at 680 s, Figure 4i.c, which compares favorably with the instance of slope change in mechanical behavior of the material. It is hence possible to foresee early fracturing at 80% of the final cycle duration. In the subsequent thermographs Figure 4i.d,e, the subsurface crack propagates from the left notch towards the middle of the notched ligament. The crack then propagates abruptly and unstably towards the right notch. A temperature variation profile compatible with pull-out is seen again in the last thermograph, Figure 4i.h, where the specimen has failed completely.
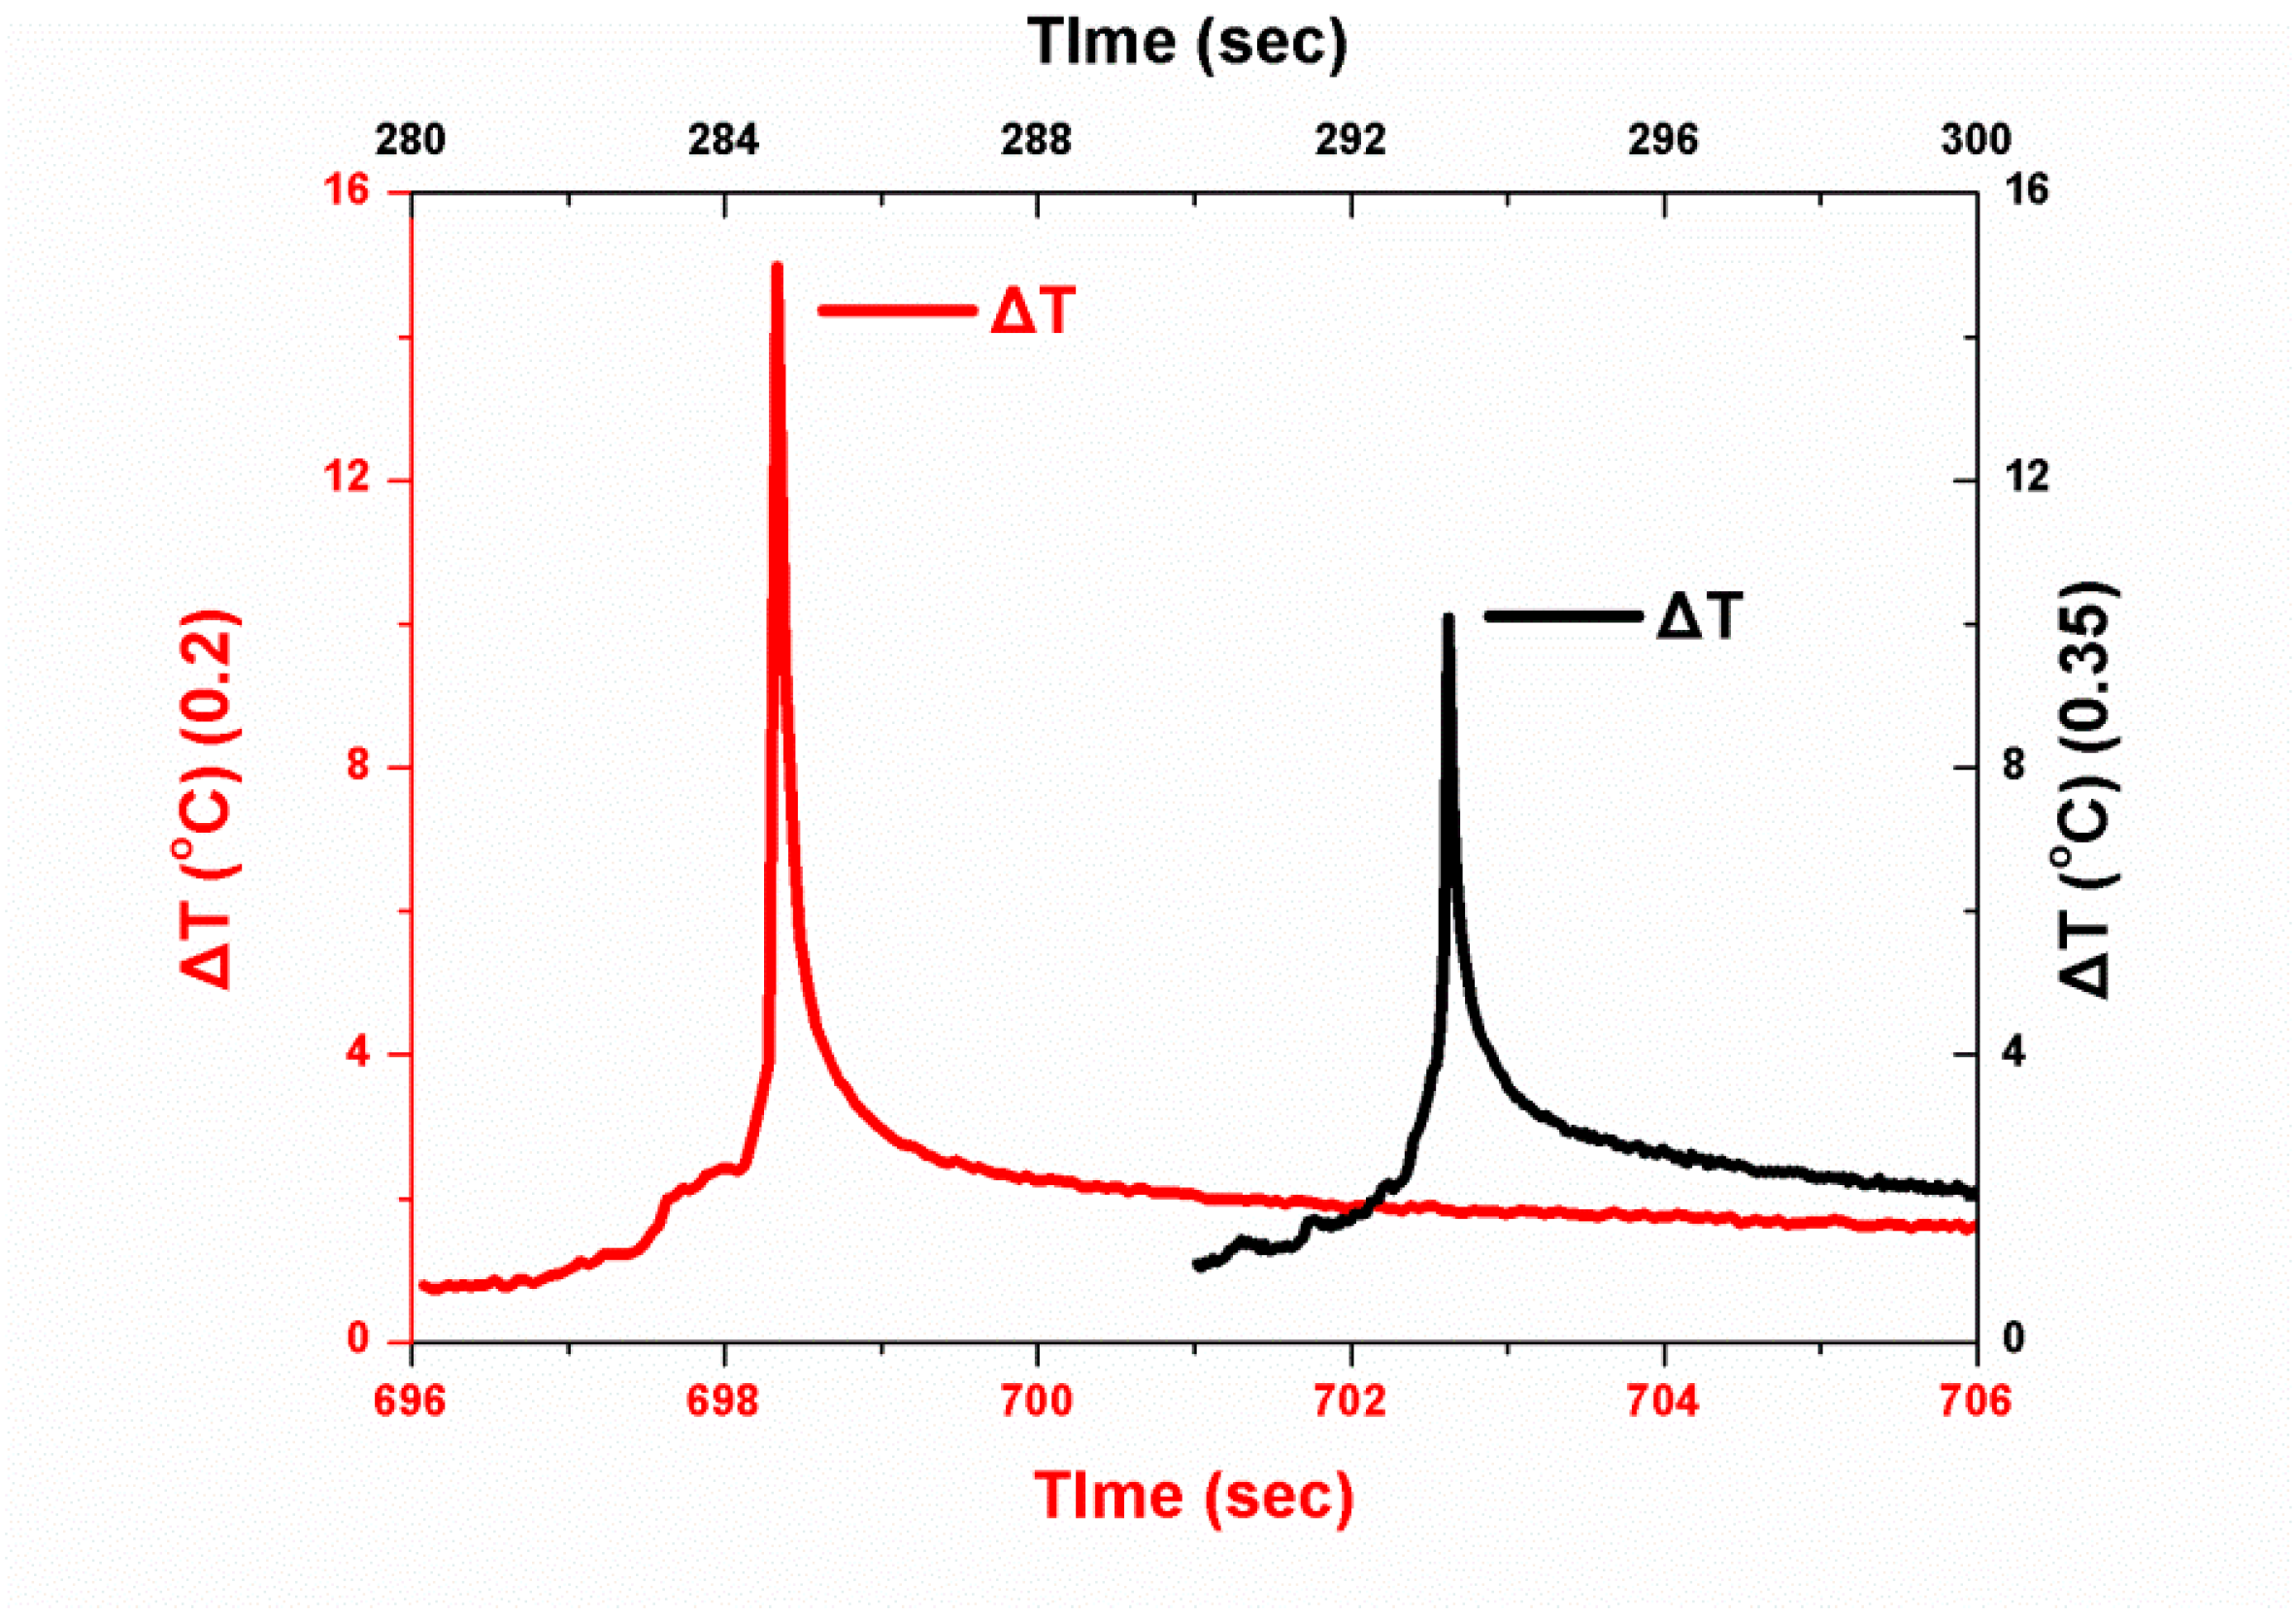
Variation of ΔΤ is shown in Figure 5 for the two notch lengths used in the current study. It is observed that temperature maximizes, from the baseline value, in a vertical manner and then gradually decreases. The steep maximization is due to heat release from the sudden ultimate failure of the specimen, which is the most prominent damage mechanism hence emitting the maximum heat, while the gradual decrease is due to natural dissipation of the released heat to the environment. Specimens with shorter initial notches, hence higher gauge length volumes, exhibit peak ΔΤ (increase of ΔΤ taken from the baseline value) of 12 °C at fracture, while the ones with longer notches exhibit lower peak ΔT values around 5 °C. It is believed that in specimens with larger notched ligaments (smaller notches), damage evolves over a wider material region throughout testing, hence peak temperature at the critical load is not high. On the other hand, damage is accumulated and relieved not so drastically in a specimen with less material available within the notched region.
3.3. Fatigue
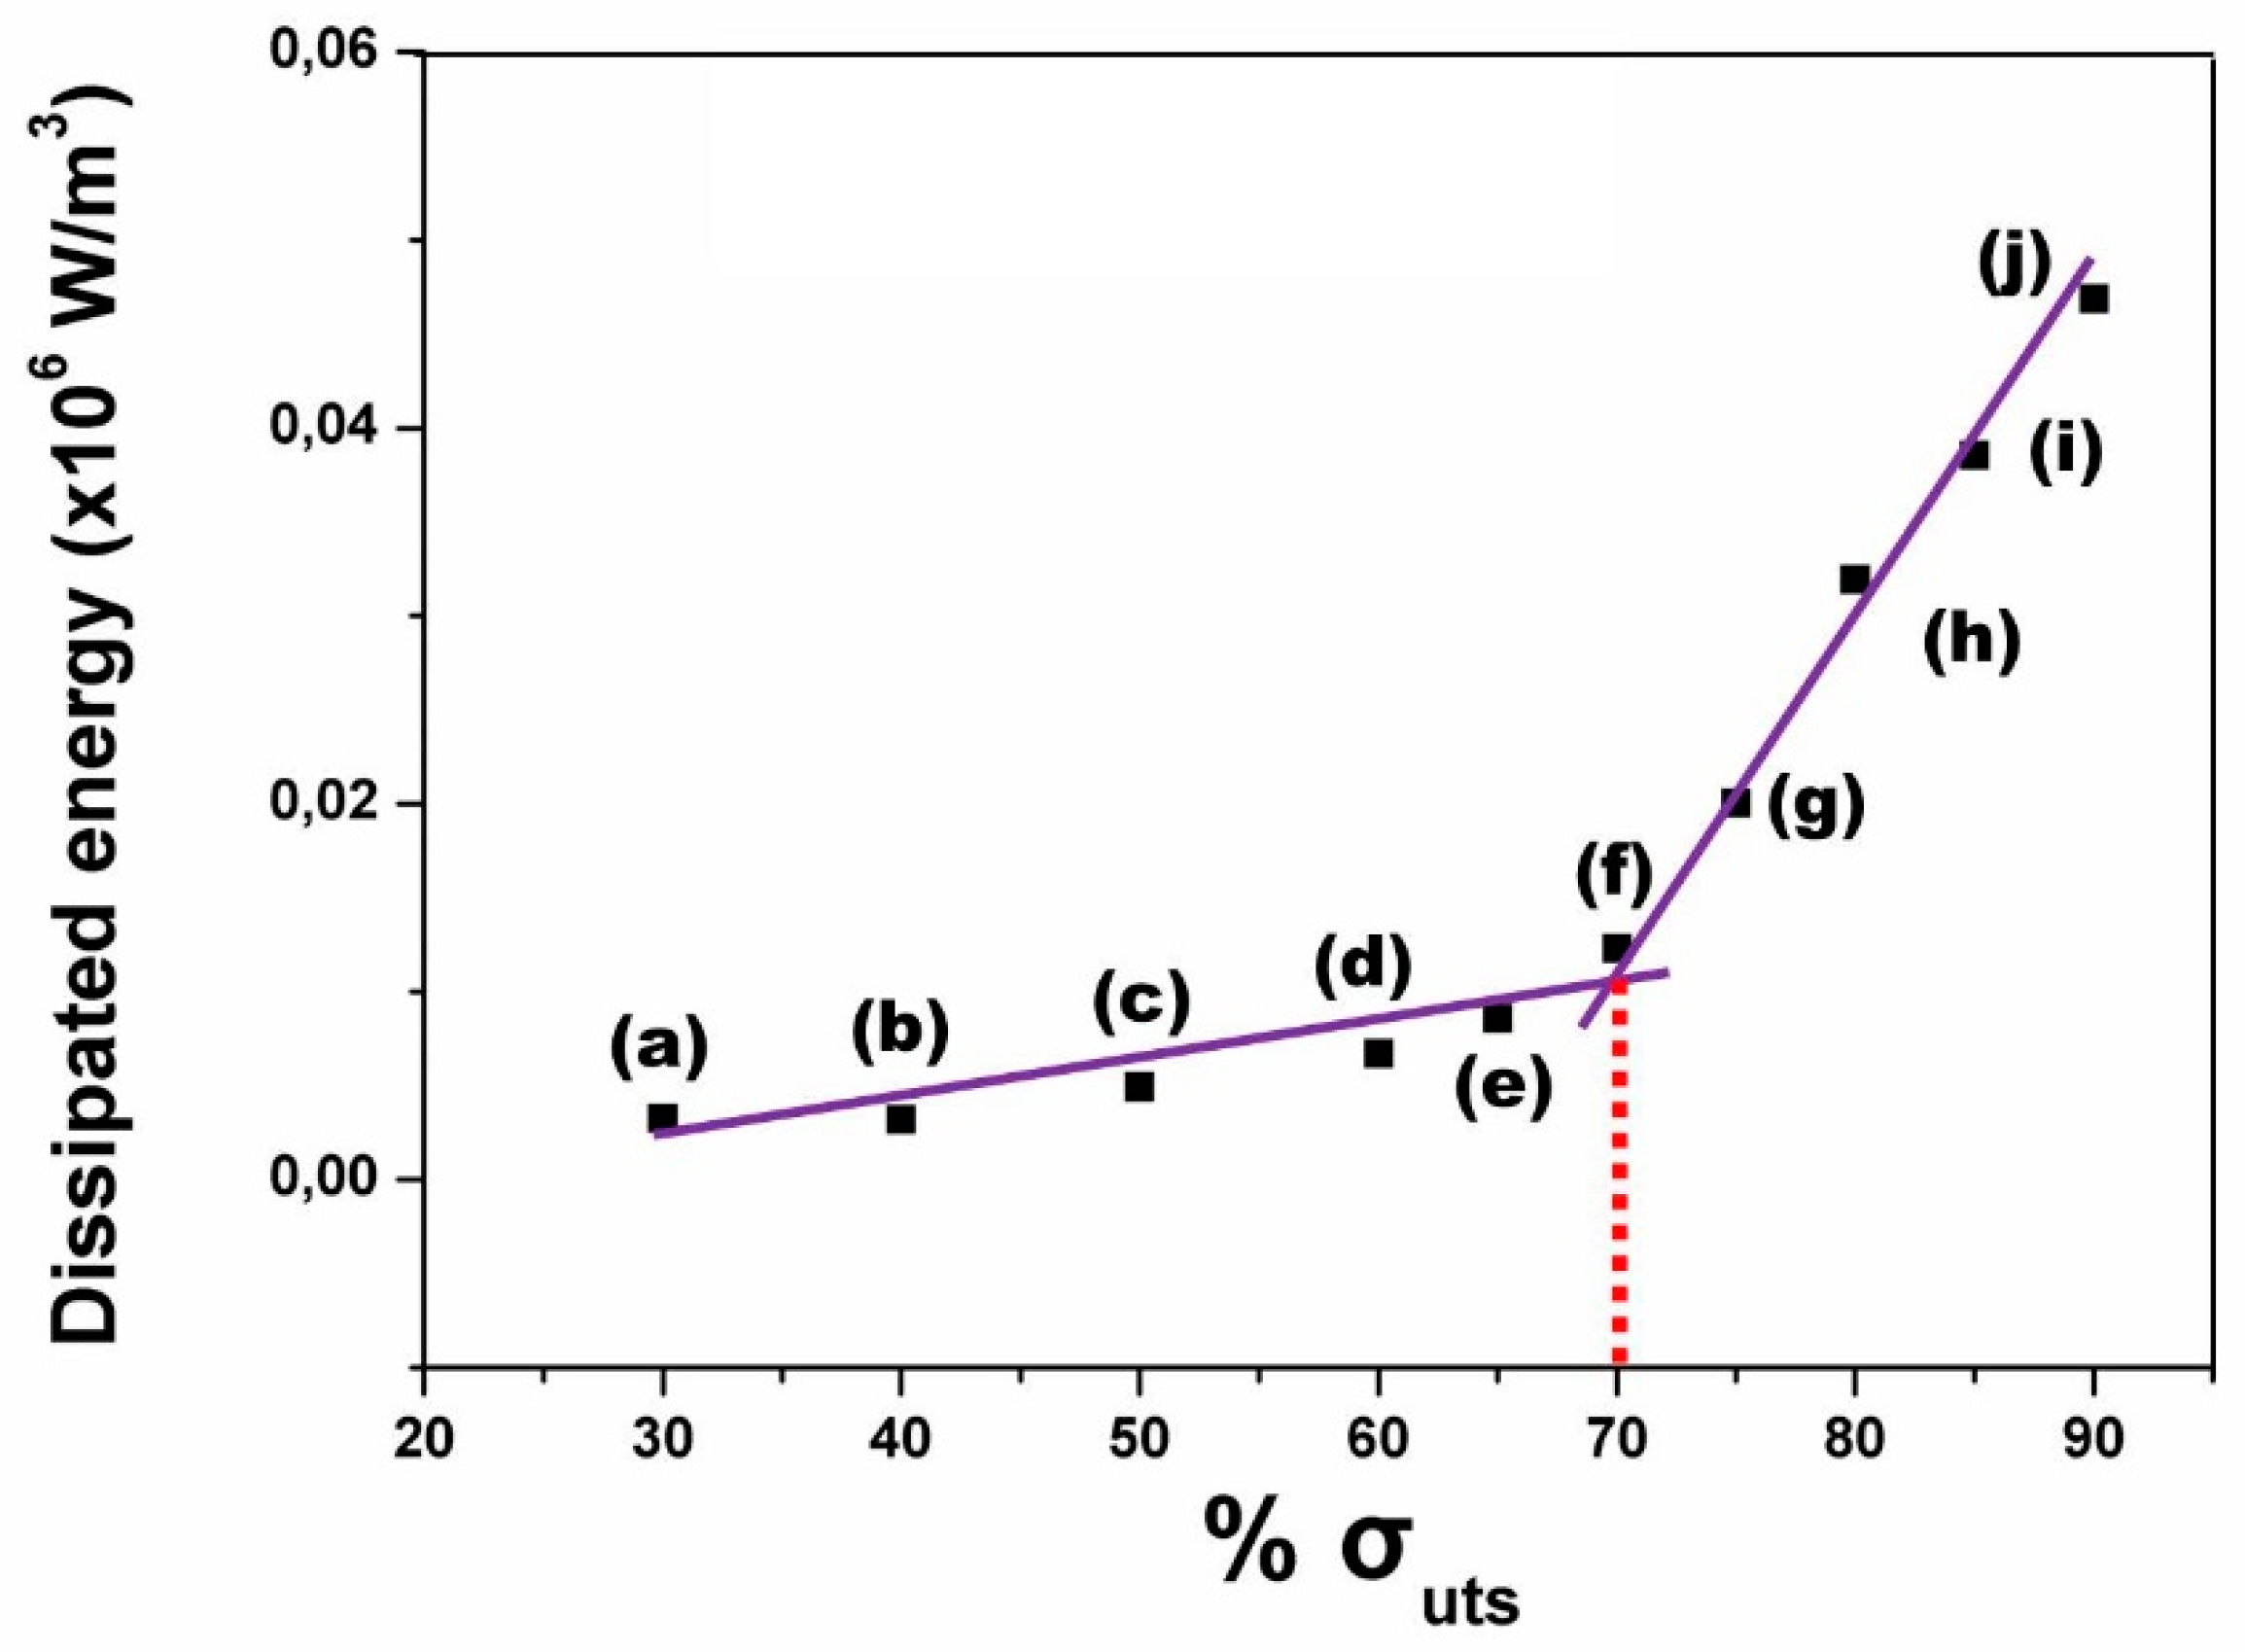
Lock-in thermography was applied during fatigue loading of SiC/BMAS dogbone specimens. The intrinsically dissipated energy, as monitored by the IR camera for ten different stress levels ranging from 30% to 90% σUTS, is plotted as a function of % σUTS in Figure 6.
Therein, the data can be visually categorized into two distinct groups depending on the intensity of the energy and the slope of the linear regressions which best approximate the data, as demonstrated in Figure 6. In the first regime, pertaining to stress levels from 30% to 60% σULS, the dissipated energy increases at a very low, almost constant rate, while from 70% σUTS and upwards, energy rises considerably more rapidly. Given the fact that thermal energy is a direct measure of damage accumulation in the material, the constant rate in the first regime signifies a minimal damage accumulation rate therein. Accordingly, the steep slope of data in the second regime indicates a high damage accumulation rate due to fatigue. Under the effect of cyclic stresses of the amplitudes pertaining to the second regime, the material is prone to fatigue failure. Hence, the transition from one behavior to the other defines the shift of damage accumulation from stable to fatigue failure. Correspondingly, the intersection point of the two regression lines defines the fatigue limit of the material [9]. The value of fatigue limit calculated for the cross-ply SiC/BMAS through the thermographic approach of this study is 70% σUTS, or 205 MPa.
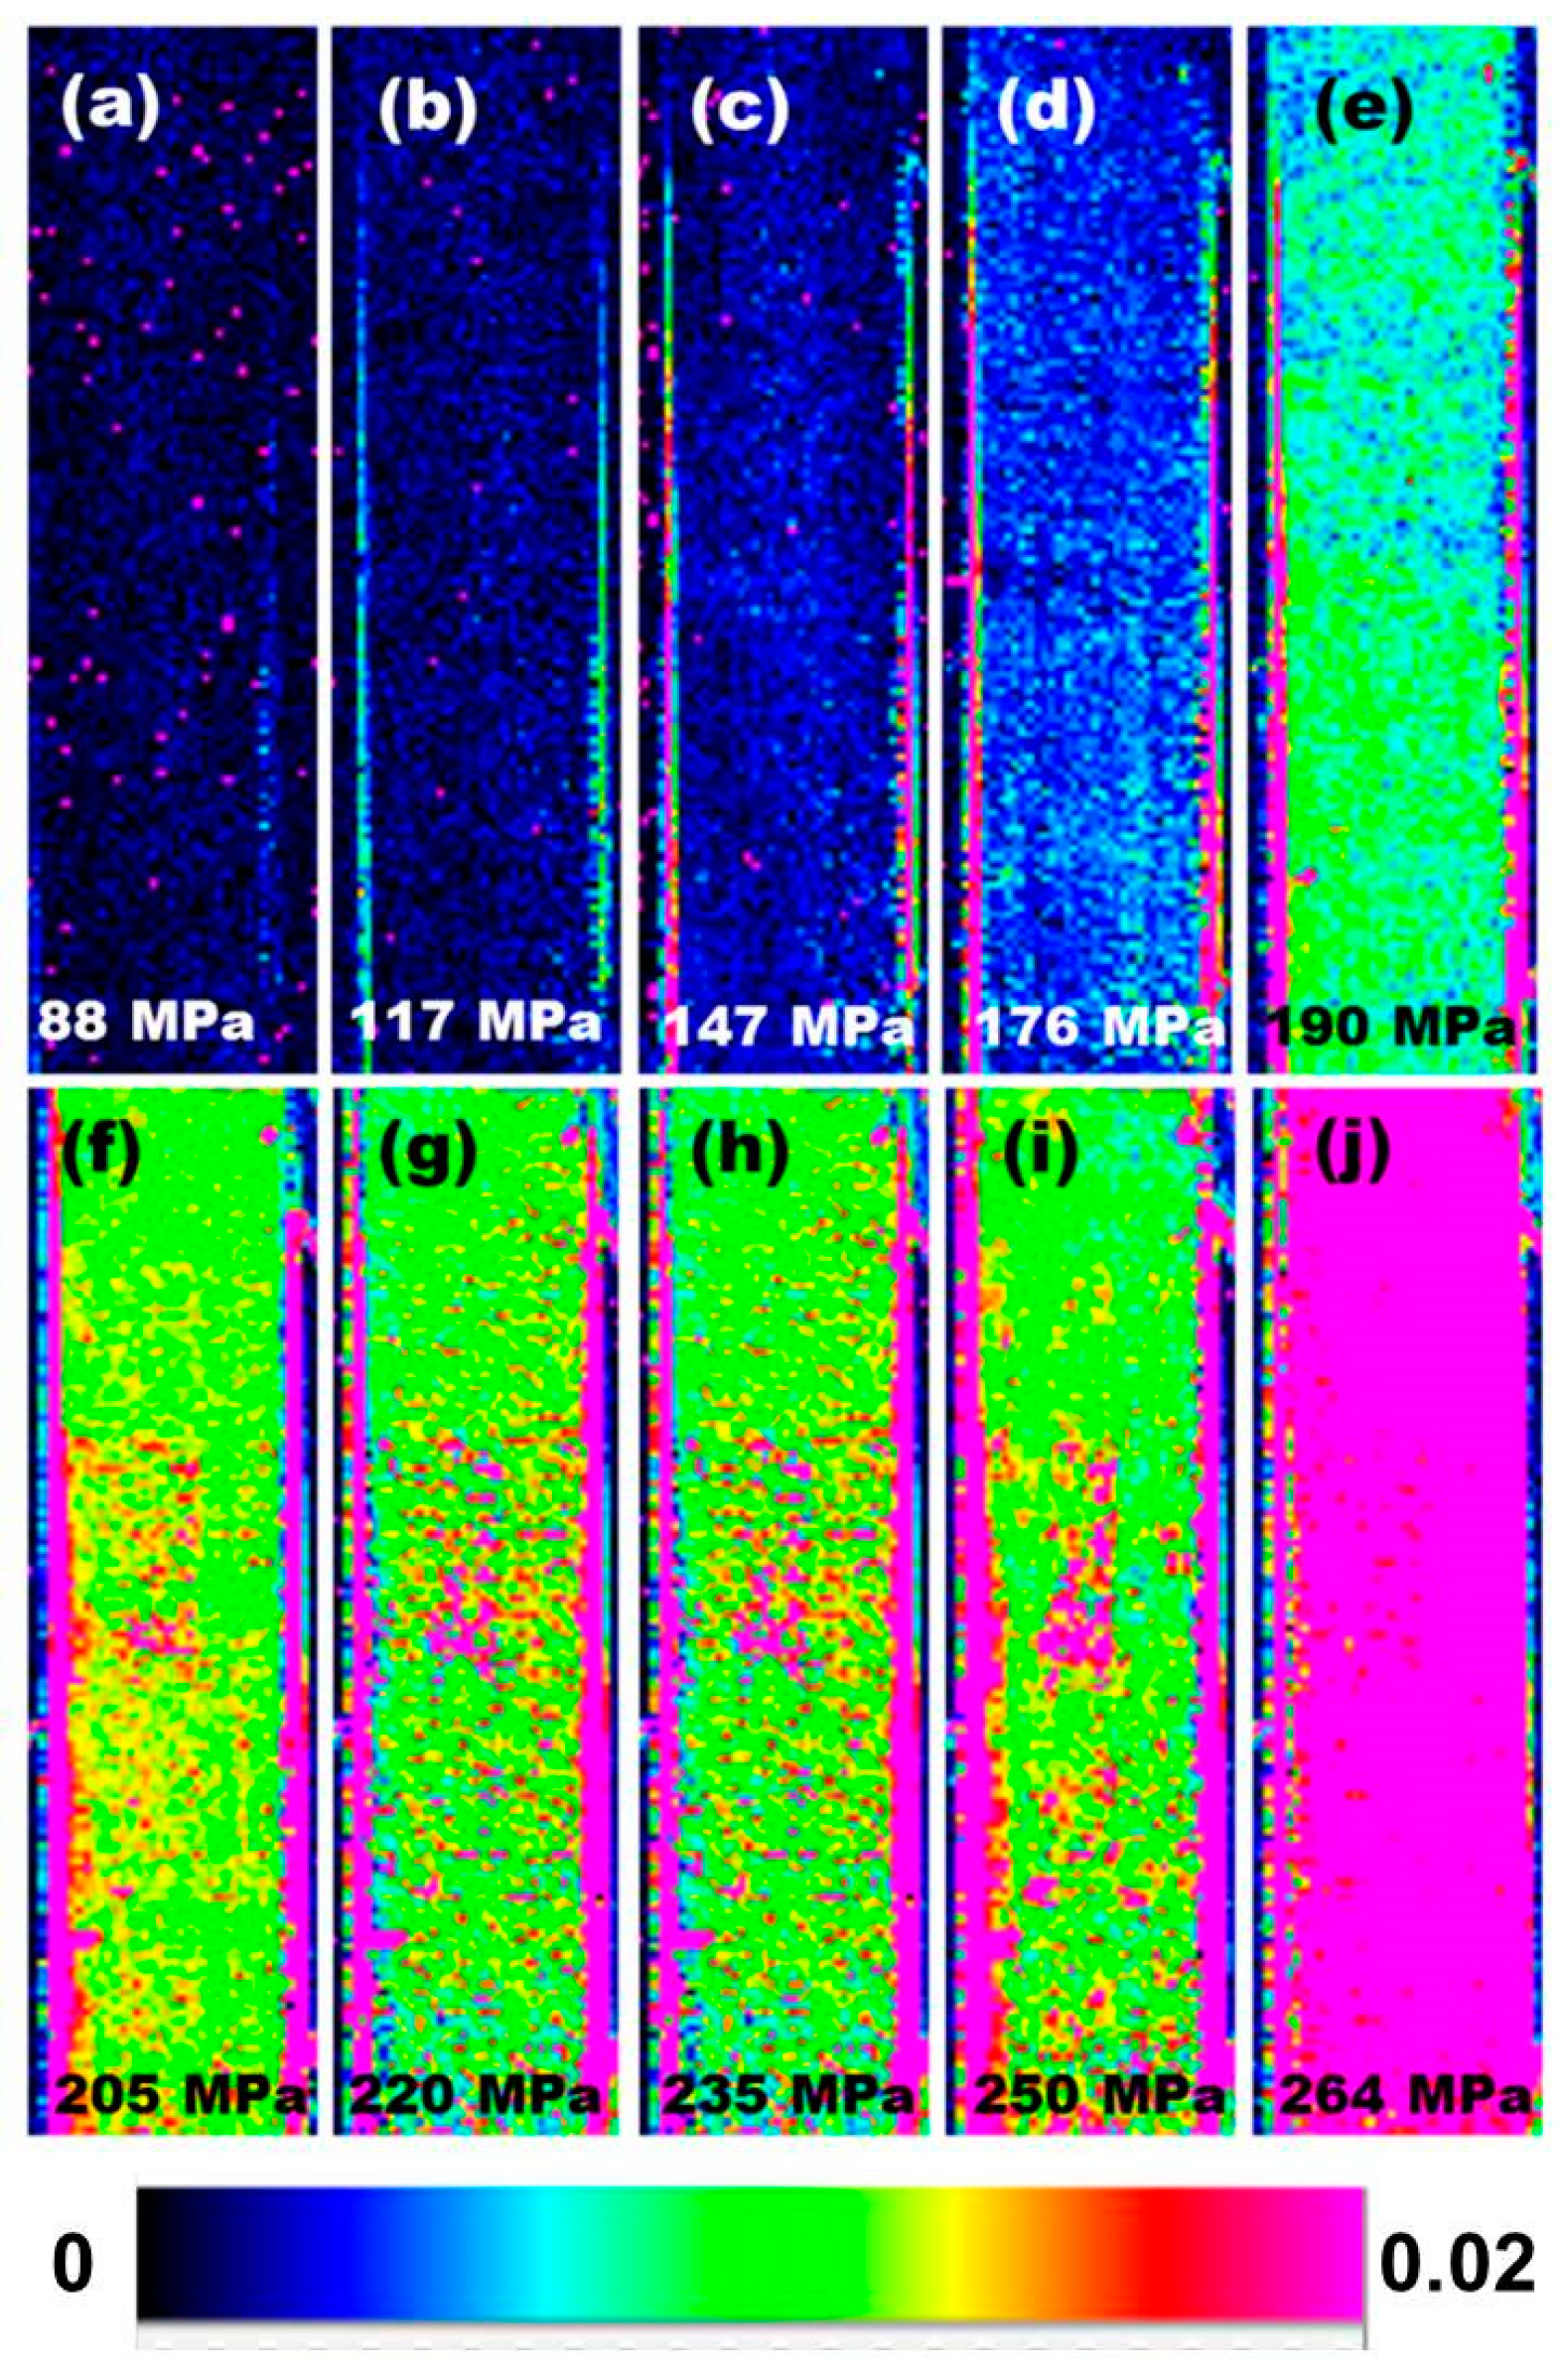
An examination of the thermographic pattern of cross-ply SiC/BMAS at different stress levels is of particular interest in view of the established fatigue limit value. This information is presented in Figure 7a–j, wherein the 70% σUTS fatigue level which corresponds to thermograph 7f. Two distinct cases are made obvious by examination of this Figure: (i) Thermographs 7a–d depict low energies in cold (blue) color coding in the initial loading stages associated with minimal material damage and (ii) thermographs 7e–j capture progressive damage accumulation is captured by increasingly warmer colors (high energy). In the first four thermographs, up to 176 MPa applies stress, there is practically no appreciable change in the dissipated energy. In the fourth thermograph, Figure 7, a slight change in color can be attributed to the saturation of elastic energy accumulation on the onset of appearance of fatigue. A totally dissimilar energy distribution pattern appears in thermograph 7f due to the unfolding of internal energy dissipation phenomena such as interfacial damage, delamination, and fiber sliding across the debonded interface [23]. In thermographs 7g–7j (75–90% of σUTS), a raise in energy can be noticed, as indicated by the increment of the magenta spots until fracture. At a particular loading level, this energy can be attributed to fiber bridging, fiber failure, and pull-out.
3.4. Crack Growth
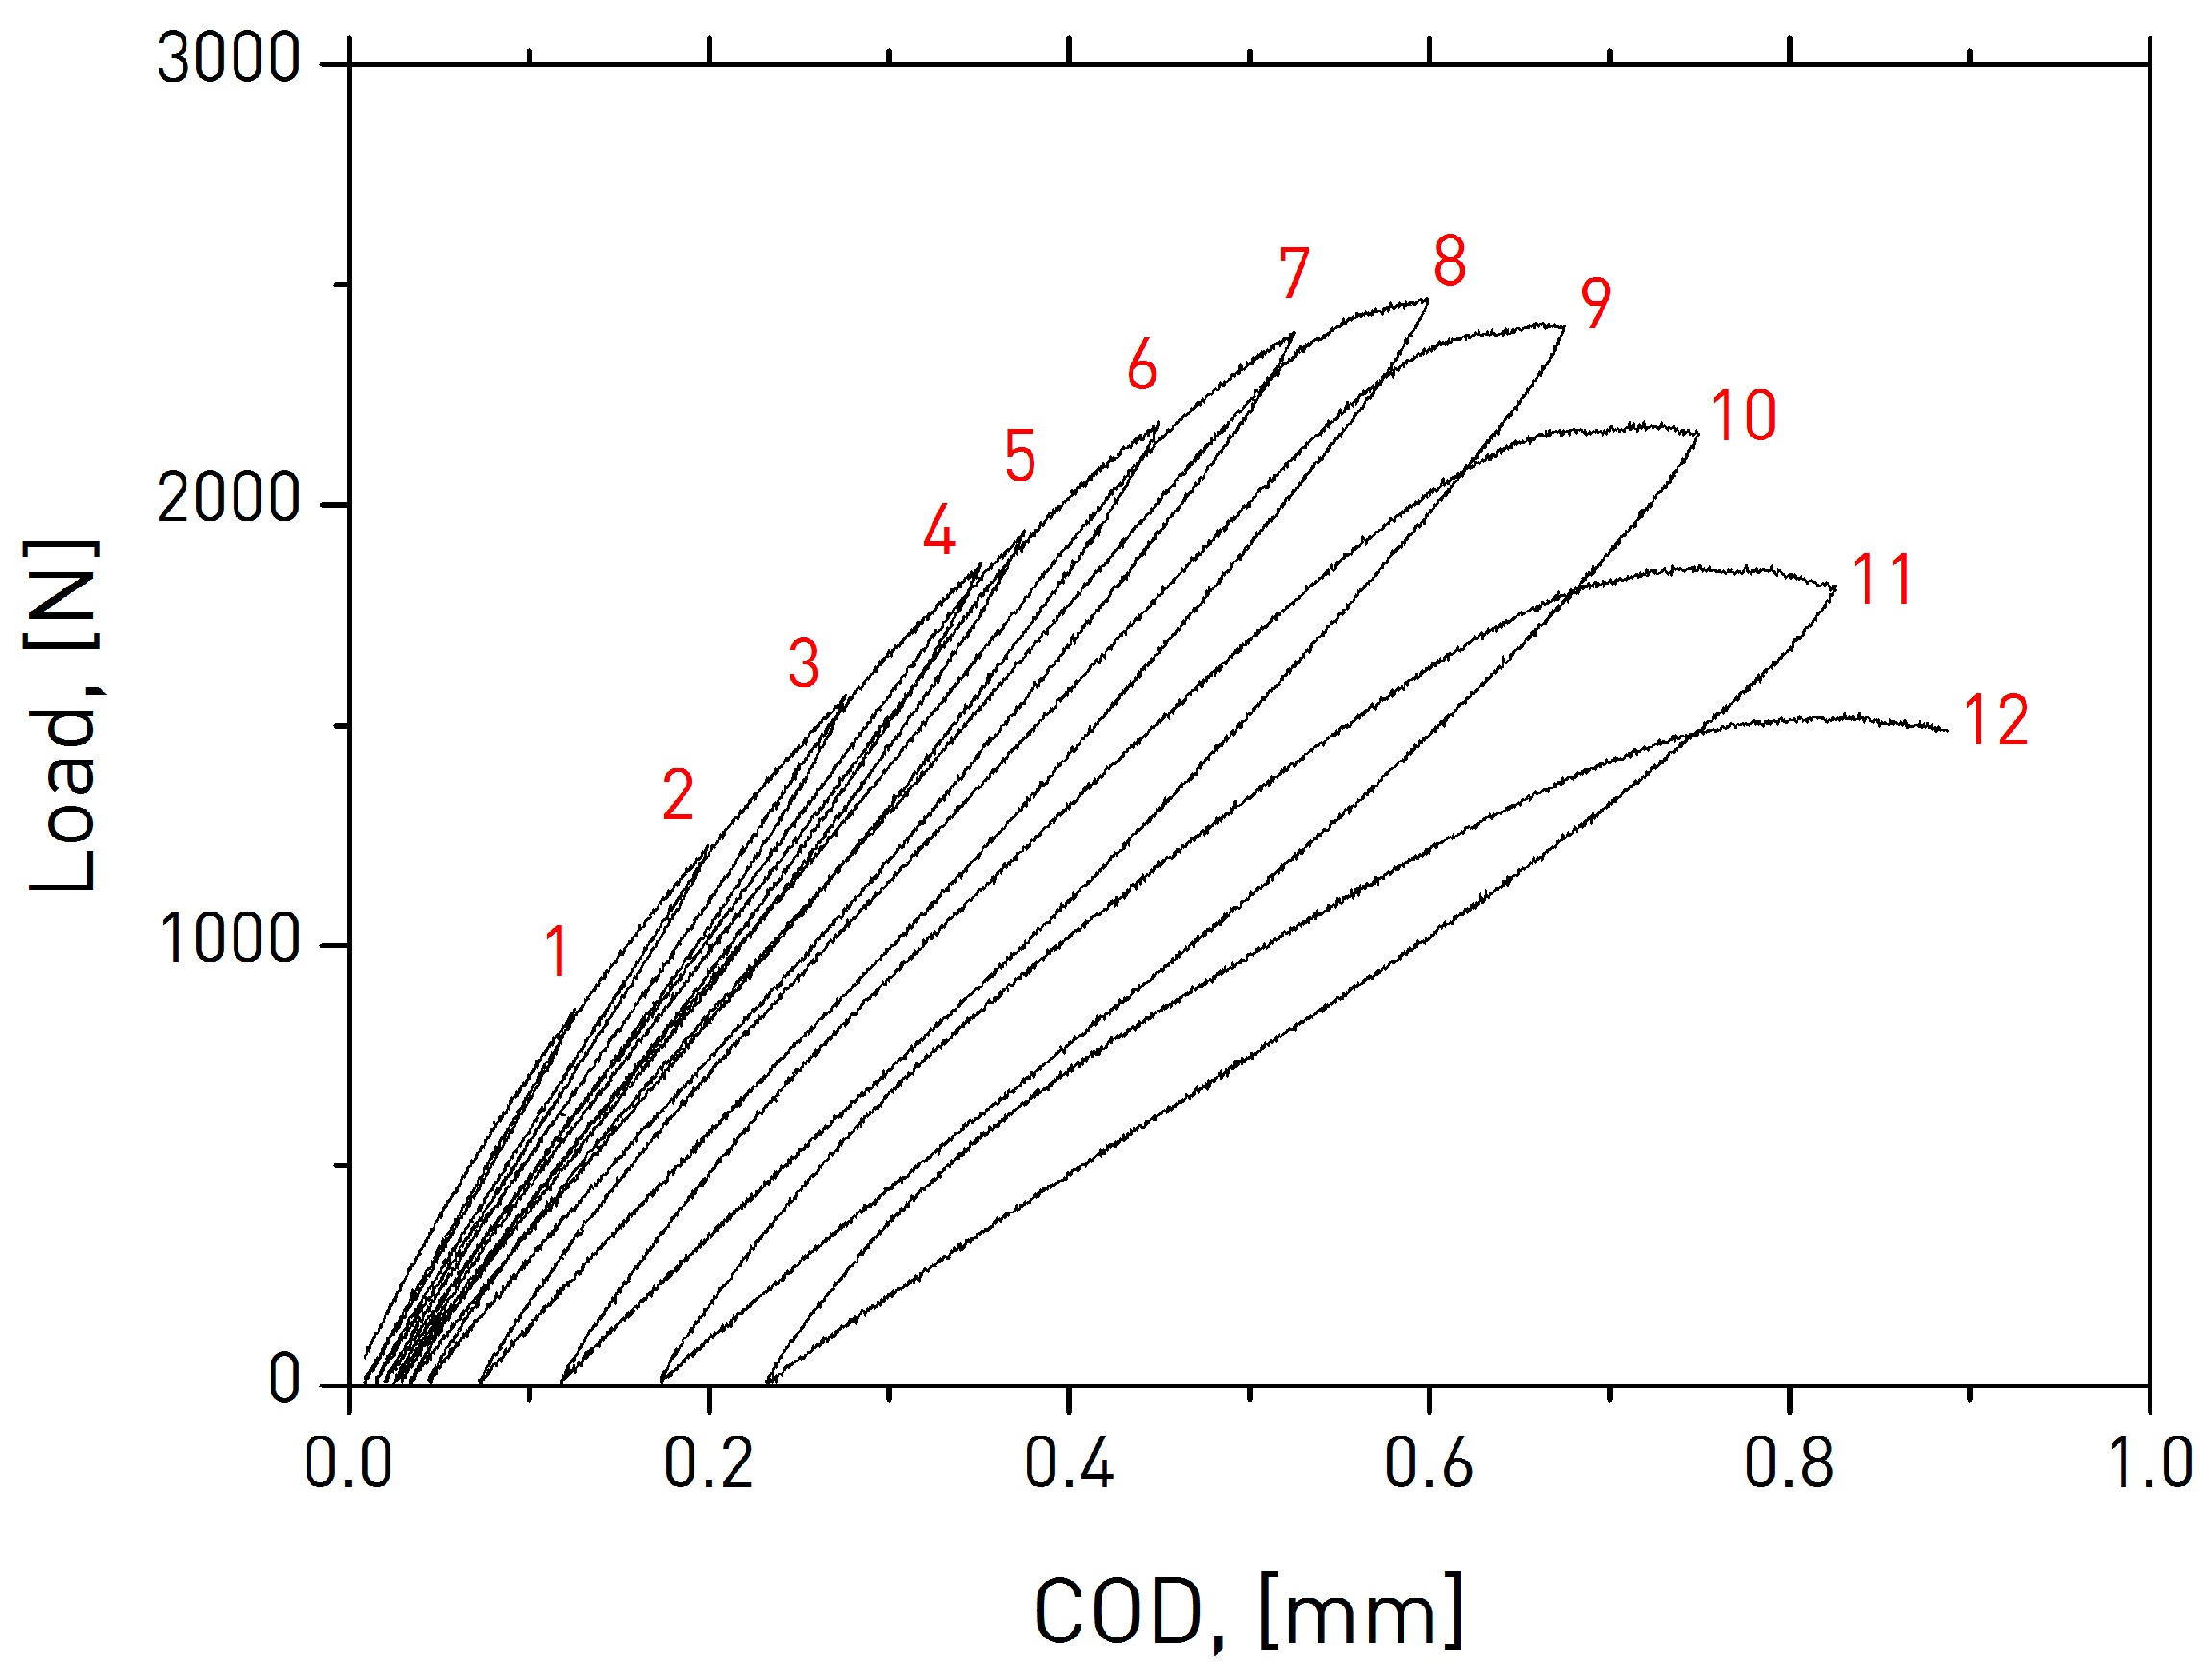
Measurement of crack growth in SiC/BMAS composites was made possible by analyzing the thermal energy dissipated by the material during cyclic loading with unloading/reloading loops, in terms of temperature variation. Information originating only from the area in front of the notch root, termed the “reference zone”, where crack growth and damage were anticipated to concentrate, was considered. For reference purposes in the forthcoming analysis, the mechanical response of CMCs under cyclic loading is presented in Figure 8.
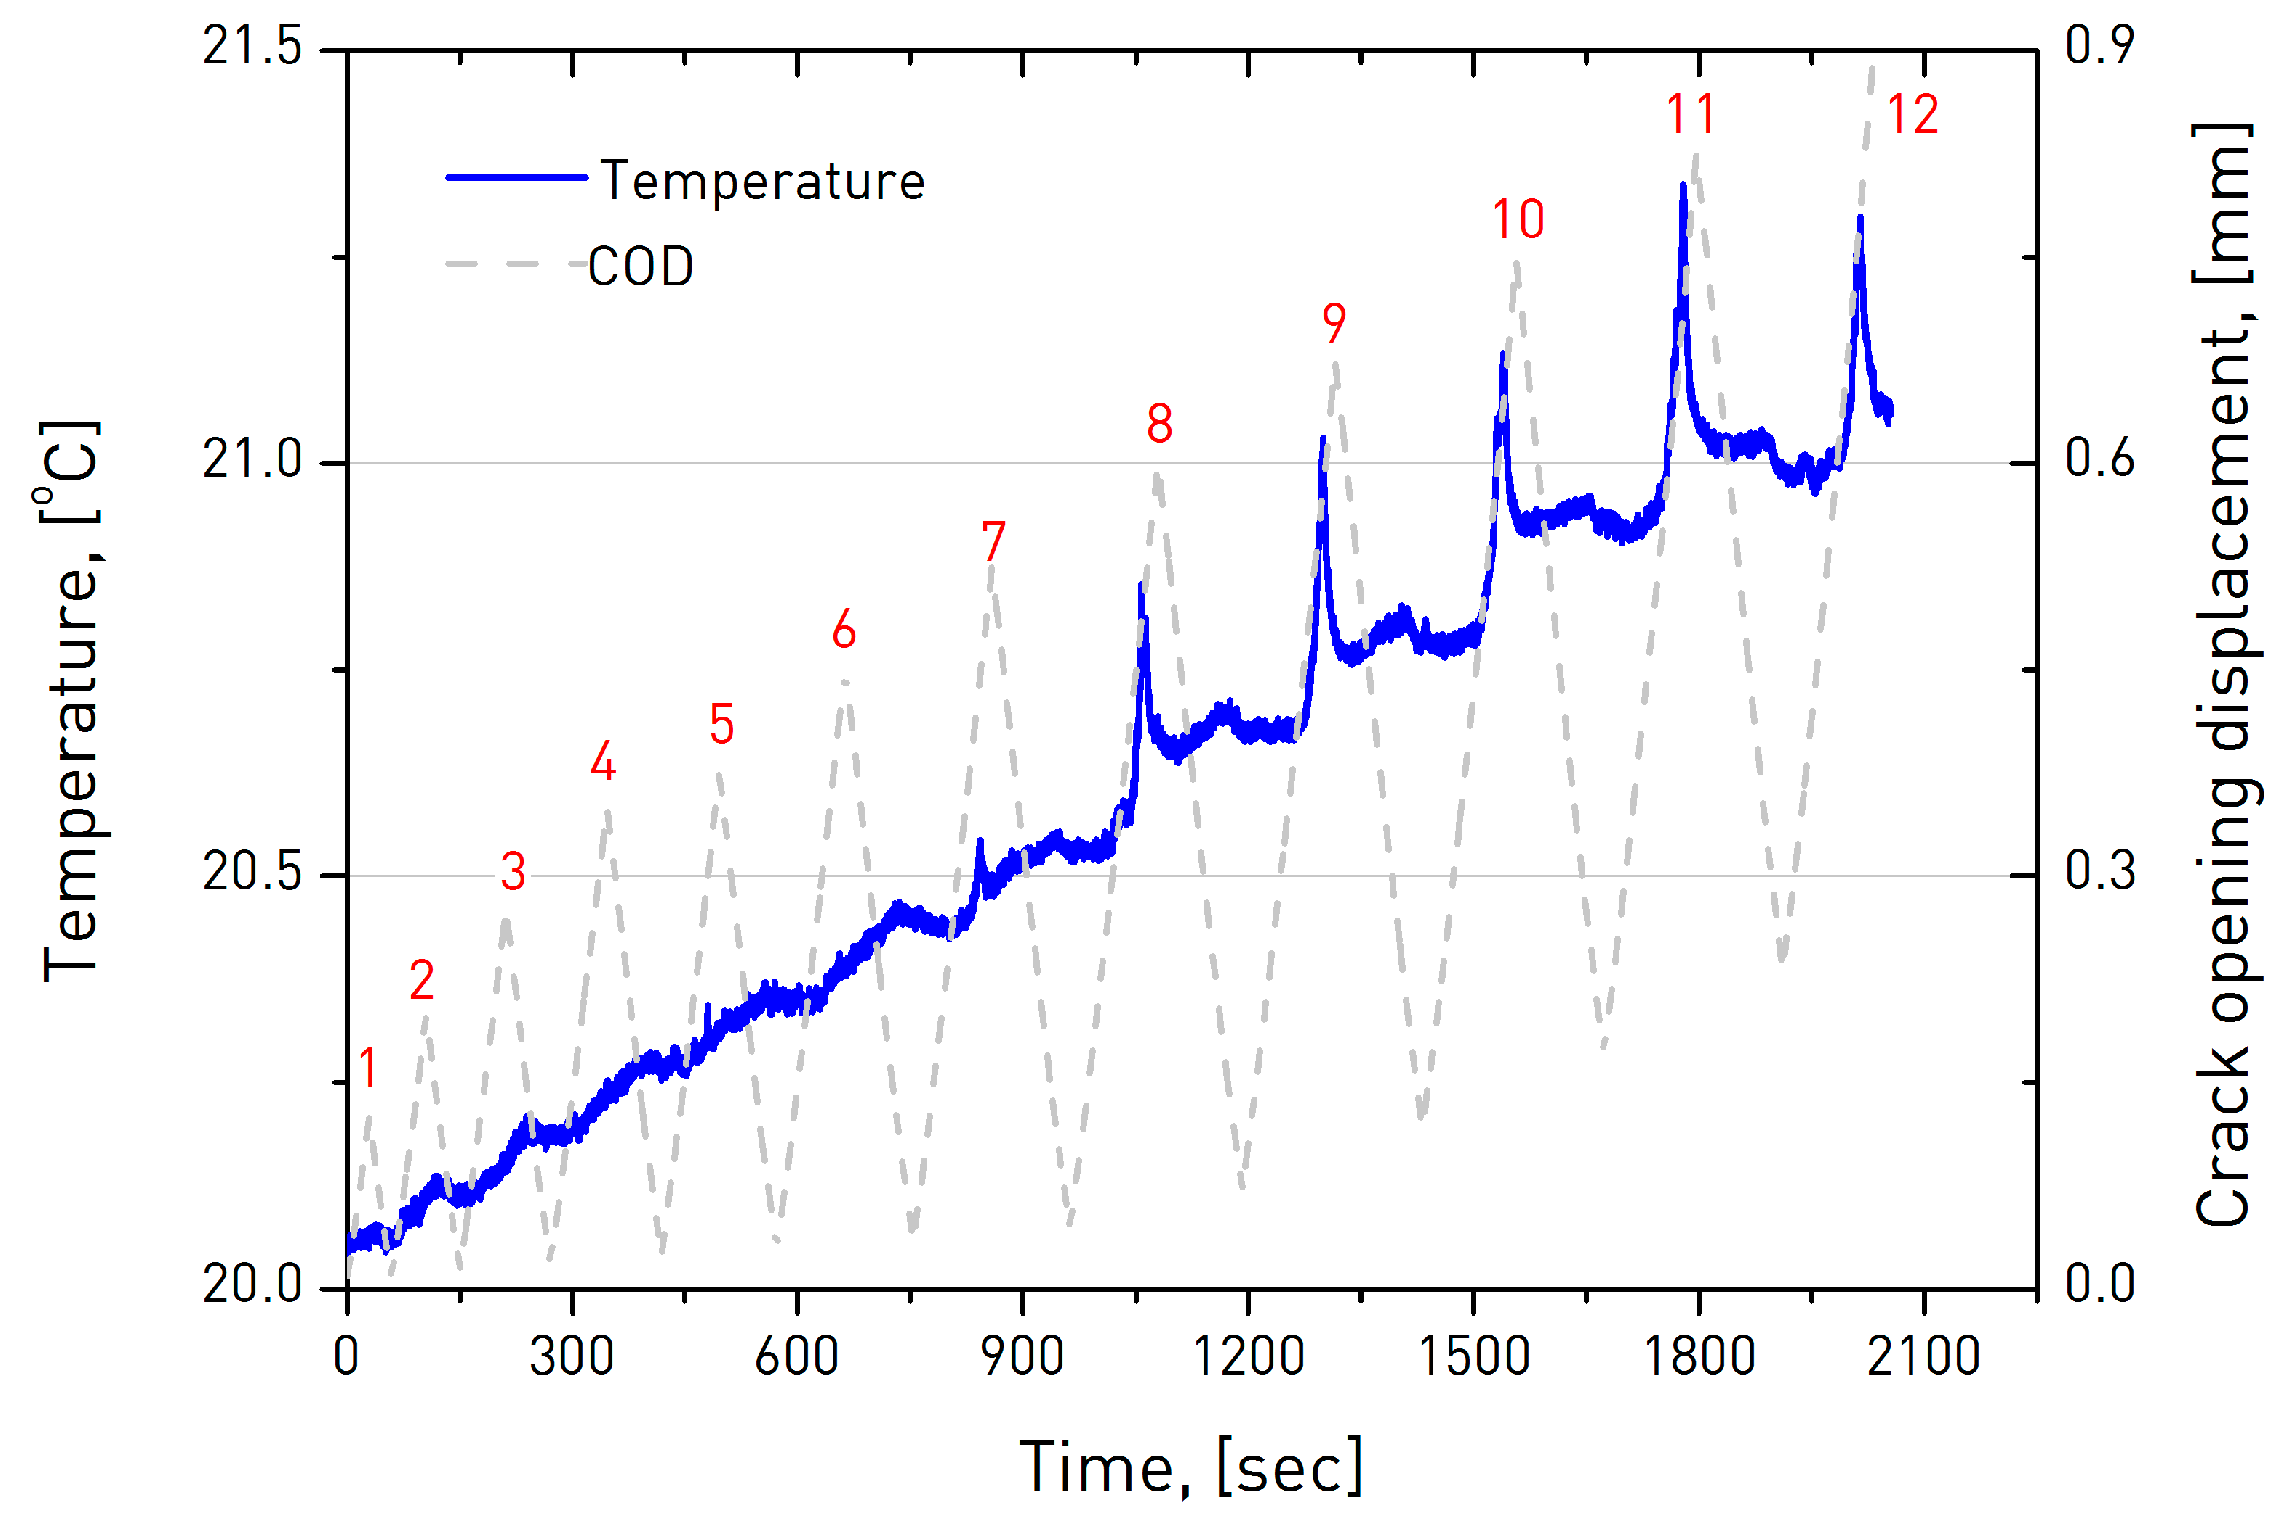
Initially, the maximum temperatures (relating to the maximum damage) were identified and plotted as a function of time as per Figure 9, wherein crack opening displacement (right axis) and cycle count (number in red) are included to facilitate perception of the loading instance. It is observed that temperature variation exhibits periodical local maxima which are prominent after 1000 s of testing time. Using the thermal camera’s native analysis software, the reference zone was divided into a large number of 0.226 mm wide subzones by introduction of neighboring vertical lines, called “control lines”. Knowledge of the exact time instance where these peak temperatures occur, from Figure 9, and realizing that these maxima originate from crack growth arriving at a specific control line, one can identify the exact corresponding control line, and hence derive the crack length.
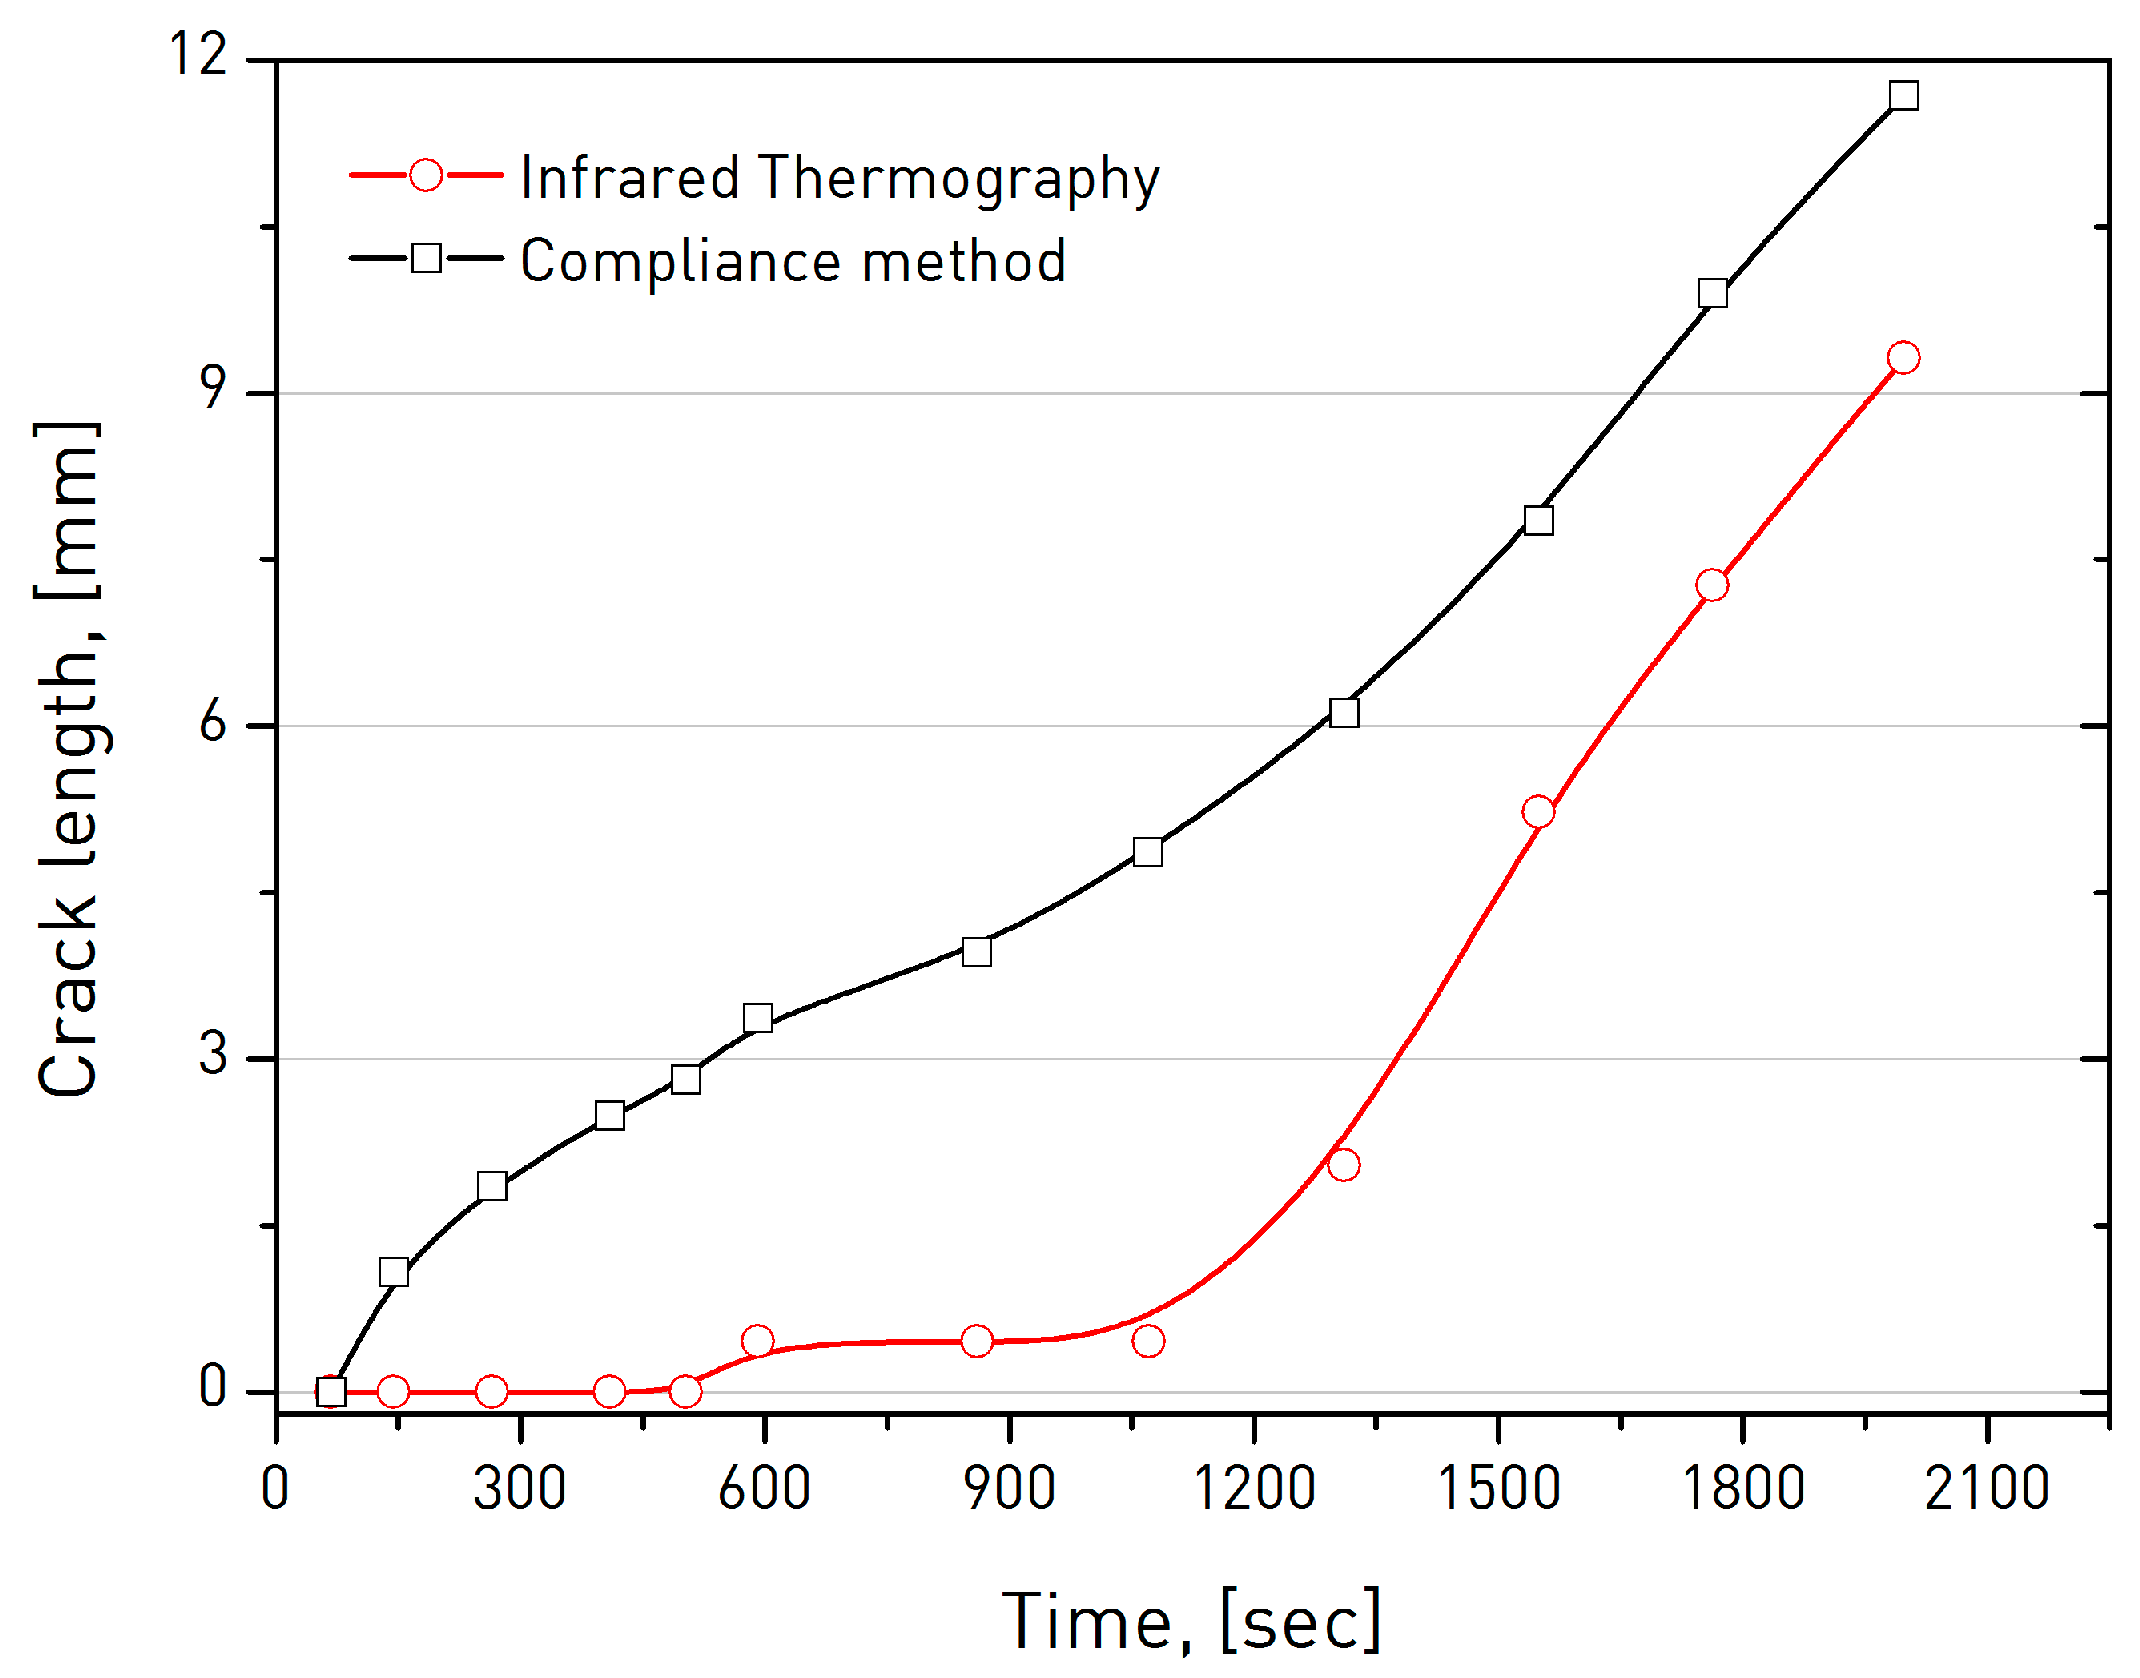
Crack lengths determined based on the aforementioned IRT approach are plotted versus testing time in Figure 10 (hollow cycle symbols). It is therein observed that the initial five loading/unloading cycles do not induce crack formation or growth. A 0.45 mm long crack is eventually formed at the 6th cycle, approximately 600 s into loading. In the subsequent 500 s, cycles 7 and 8, the crack does not appear to propagate further. Extensive but stable crack growth appears to commence after the eighth cycle, ca 1000 s into loading. Within the subsequent 1000 s, or four cycles, crack length eventually reaches 9.3 mm, or ca. 37% of the specimen’s un-notched ligament, before ultimate failure. It is noted that in the particular specimen configuration crack growth can only span a fraction of the un-notched ligament of the material as a result on the compressive forces that develop at the specimen’s back face. Plotted alongside the experimentally measured (IRT) crack growth in Figure 10 is the theoretically expected counterpart based on the conventional elastic compliance technique [24]. A wide discrepancy between experimental values and theoretical predictions is observed, especially within the initial nine cycles where actual crack growth is not significant. This discrepancy is due to the shortcoming of the analytical method to approach compliance changes independently of crack growth. Contrary to the theoretical approach, where compliance drops are considered only as results of crack growth, in a CMC, such decreases can also be promoted by mechanisms such as high stress concentration at the crack tip. Moreover, in view of the brittle nature of the glass–ceramic matrix, crack growth is not expected to follow the highly stable, almost linear, trend predicted by theory. Under the same rationale, within the last three unloading/reloading stages related to stable crack growth, the experimental values appear to follow the theoretically predicted trend, albeit with an overestimation in actual crack length by 25%.
Figure 11 represents typical thermographs collected at indicative successive stages of crack growth. Warmer colors correspond to higher amounts of thermally dissipated energy, representing areas of higher damage accumulation as opposed to colder colors. Violet color, corresponding to the maximum temperature, is attributed to crack growth. The onset of cracking is barely seen in Figure 11a, 1100 s into testing. As the crack propagates, the damage zone expands radially due to stress transfer from the high stress area to the surrounding material but also due to the unfolding of complementary damage mechanisms such as interfacial damage, fiber sliding along the debonded interface, fiber bridging, and pull-out [14]. Figure 11e, collected just before composite failure, represents the maximum damage span on the specimen. Using image analysis, the contours to the maximum temperature zones found at the crack tip (violet color) can be reconstructed as shown in Figure 11f. In this manner, the shape and size of the maximum-damage zone and its evolution with time during composite fracture can be visualized.
4. Conclusions
The present paper demonstrates the potential of infrared thermography in capturing the initiation and propagation of damage in SiC fiber-reinforced ceramic matrix composites under static, cyclic, and fatigue loads. The proposed infrared lock-in thermographic methodology enabled early prediction of the residual life of the material, as early as at 73% of the duration of the final loading cycle, as it also enabled the rapid determination of the fatigue limit of the ceramic matrix composites as 70% σUTS. Thermographic information collected from CMCs loaded in cyclic tension with successive unloading–reloading loops enabled establishment of the crack length at each cycle by correlation of the time stamp of thermographs of temperature maxima, related to maximum damaged assumed as crack growth, to control line count of known width in front of the notch root. The estimated crack propagation profile was substantially smaller than expected by the conventional elastic compliance method during the early loading stages where compliance drops in the composite are not linked to crack formation and growth. Visualization of the shape and size of the damage zone at representative loading stages throughout composite fracture was made possible by aid of thermograph analysis software.
Author Contributions
Conceptualization, K.G.D. and T.E.M.; Data curation, K.G.D.; Investigation, K.G.D. and T.E.M.; Methodology, K.G.D. and T.E.M.; Project administration, T.E.M.; Resources, T.E.M.; Writing – original draft, K.G.D.
Funding
This research received no external funding.
Acknowledgments
In this section you can acknowledge any support given which is not covered by the author contribution or funding sections. This may include administrative and technical support, or donations in kind (e.g., materials used for experiments).
Conflicts of Interest
The authors declare no conflict of interest.
References
- Nieto, A.; Bisht, A.; Lahiri, D.; Zhang, C.; Agarwal, A. Graphene reinforced metal and ceramic matrix composites: A review. Int. Mater. Rev. 2017, 62, 241–302. [Google Scholar] [CrossRef]
- Nasiri, N.A.; Patra, N.; Ni, N.; Jayaseelan, D.D.; Lee, W.E. Oxidation behaviour of SiC/SiC ceramic matrix composites in air. J. Eur. Ceram. Soc. 2016, 36, 3293–3302. [Google Scholar] [CrossRef]
- Sun, J.G.; Verrilli, M.J.; Stephan, R.; Barnett, T.R.; Ojard, G. Nondestructive Evaluation of Ceramic Matrix Composite Combustor Components. In Proceedings of the AIP Conference Proceedings, Riobamba, Ecuador, 9 April 2003. [Google Scholar]
- Madaras, E.I.; Winfree, W.P.; Prosser, W.H.; Wincheski, R.A.; Cramer, K.E. Nondestructive Evaluation for the Space Shuttle’s Wing Leading Edge. In Proceedings of the 41st AIAA/ASME/SAE/ASEE Joint Propulsion Conference & Exhibit, Tucson, AZ, USA, 13 July 2005. [Google Scholar]
- Winfree, W.P.; Madaras, E.I.; Cramer, K.E.; Howell, P.A.; Hodges, K.L.; Seebo, J.P.; Grainger, J.L. NASA Langley Inspection of Rudder and Composite Tail of American Airlines Flight 587. In Proceedings of the 46th AIAA/ASME/ASCE/AHS/ASC Structures, Structural Dynamics and Materials Conference, Austin, TX, USA, 18–21 April 2005. [Google Scholar]
- Mei, H.; Xu, Y.D.; Cheng, L.F.; Zhang, L.T. Nondestructive evaluation and mechanical characterization of a defect-embedded ceramic matrix composite laminate. Int. J. Appl. Ceram. Technol. 2007, 4, 378–386. [Google Scholar] [CrossRef]
- Sun, J.G.; Deemer, C.M.; Ellingson, W.A.; Wheeler, J. NDT technologies for ceramic matrix composites: Oxide and nonoxide. Mater. Eval. 2006, 64, 52–60. [Google Scholar]
- Levallois, F.; Sobeczko, A.; Proust, A.; Marlot, D.; Lenain, J.-C. Non-destructive testing of GAIA frame by means of acoustic emission monitoring during launch simulation tests. In Proceedings of the 30th European Conference on Acoustic Emission Testing & 7th International Conference on Acoustic Emission, Granada, Spain, 12–15 September 2012. [Google Scholar]
- Luong, M.P. Fatigue limit evaluation of metals using an infrared thermographic technique. Mech. Mater. 1998, 28, 155–163. [Google Scholar] [CrossRef]
- Dassios, K.G.; Kordatos, E.Z.; Aggelis, D.G.; Matikas, T.E. Crack Growth Monitoring in Ceramic Matrix Composites by Combined Infrared Thermography and Acoustic Emission. J. Am. Ceram. Soc. 2014, 97, 251–257. [Google Scholar] [CrossRef]
- Dassios, K.G.; Kordatos, E.Z.; Aggelis, D.G.; Exarchos, D.A.; Matikas, T.E. Monitoring the fracture behavior in ceramic matrix composites by infrared thermography and acoustic emission. In Proceedings of the SPIE-The International Society for Optical Engineering, San Diego, CA, USA, 9–13 March 2014. [Google Scholar]
- Dassios, K.G.; Kordatos, E.Z.; Aggelis, D.G.; Matikas, T.E. Nondestructive damage evaluation in ceramic matrix composites for aerospace applications. Sci. World J. 2013, 2013. [Google Scholar] [CrossRef] [PubMed]
- Benson, P.M.; Spear, K.E.; Pantano, G.C. Interfacial characterisation of glass matrix/Nicalon SiC fiber composites: A thermodynamic approach. Ceram. Eng. Sci. Proc. 1988, 9, 663–670. [Google Scholar]
- Padture, N.P. Advanced structural ceramics in aerospace propulsion. Nat. Mater. 2016, 15, 804–809. [Google Scholar] [CrossRef] [PubMed]
- Dassios, K.G.; Aggelis, D.G.; Kordatos, E.Z.; Matikas, T.E. Cyclic loading of a SiC-fiber reinforced ceramic matrix composite reveals damage mechanisms and thermal residual stress state. Compos. Part A Appl. Sci. Manuf. 2013, 44, 105–113. [Google Scholar] [CrossRef]
- Cady, C.; Heredia, F.E.; Evans, A.G. Inplane Mechanical-Properties of Several Ceramic-Matrix Composites. J. Am. Ceram. Soc. 1995, 78, 2065–2078. [Google Scholar] [CrossRef]
- Camus, G.; Guillaumat, L.; Baste, S. Development of damage in a 2D woven C/SiC composite under mechanical loading: 1. Mechanical characterization. Compos. Sci. Technol. 1996, 56, 1363–1372. [Google Scholar] [CrossRef]
- Steen, M. Tensile mastercurve of ceramic matrix composites: Significance and implications for modelling. Mater. Sci. Eng. A 1998, 250, 241–248. [Google Scholar] [CrossRef]
- Dassios, K.G.; Matikas, T.E. Residual Stress-Related Common Intersection Points in the Mechanical Behavior of Ceramic Matrix Composites Undergoing Cyclic Loading. Exp. Mech. 2013, 56, 1033–1038. [Google Scholar] [CrossRef]
- Dassios, K.G. A review of the pull-out mechanism in the fracture of brittle-matrix fibre-reinforced cowosites. Adv. Compos. Lett. 2007, 16, 17–24. [Google Scholar] [CrossRef]
- Dassios, K.G.; Matikas, T.E. Large-Scale Interfacial Damage and Residual Stresses in a Glass-Ceramic Matrix Composite. Compos. Interfaces 2013, 19, 523–531. [Google Scholar] [CrossRef]
- Thouless, M.D.; Evans, A.G. Effects of Pull-out on the Mechanical-Properties of Ceramic-Matrix Composites. Acta Metall. Mater. 1988, 36, 517–522. [Google Scholar] [CrossRef]
- Koimtzoglou, C.; Dassios, K.G.; Galiotis, C. Effect of fatigue on the interface integrity of unidirectional C-f-reinforced epoxy resin composites. Acta Mater. 2009, 57, 2800–2811. [Google Scholar] [CrossRef]
- Standard Test Method for Measurement of Fracture Toughness; ASTM Standard E 1820; ASTM International: West Conshohocken, PA, USA, 2001.
Figure 1.
Stress–strain response of SiC/BMAS under monotonic (top graph, dotted line) and cyclic tension with unloading/reloading loops for various notch lengths (un-notched in top graph and notched in bottom graph).
Figure 1.
Stress–strain response of SiC/BMAS under monotonic (top graph, dotted line) and cyclic tension with unloading/reloading loops for various notch lengths (un-notched in top graph and notched in bottom graph).

Figure 2.
(i) ΔΤ and load vs. time for a 0.35 notch-to-width ratio specimen loaded in cyclic tension. Sequential alphabet letters indicate instance of thermographs presented in (ii).
Figure 2.
(i) ΔΤ and load vs. time for a 0.35 notch-to-width ratio specimen loaded in cyclic tension. Sequential alphabet letters indicate instance of thermographs presented in (ii).

Figure 3.
Final loading cycle of 0.35 notch-to-width ratio double-edge-notch (DEN) specimen. (i) Thermographs showing crack propagation and (ii) load versus time curve.
Figure 3.
Final loading cycle of 0.35 notch-to-width ratio double-edge-notch (DEN) specimen. (i) Thermographs showing crack propagation and (ii) load versus time curve.

Figure 4.
Thermographs of crack propagation (i) and diagram of load versus time of final loading cycle (ii) for a 0.2 notch-to-width ratio specimen.
Figure 4.
Thermographs of crack propagation (i) and diagram of load versus time of final loading cycle (ii) for a 0.2 notch-to-width ratio specimen.

Figure 5.
Peak ΔT for the two notch lengths used in the DEN specimens.

Figure 6.
Dissipated energy vs. % σUTS for fatigue-loaded SiC/BMAS.

Figure 7.
Thermographic pattern during fatigue loading of a SiC/BMAS composite.

Figure 8.
Typical load–crack opening displacement (COD) behavior of the material under cyclic loading. Cycle count is denoted in red numerals.
Figure 8.
Typical load–crack opening displacement (COD) behavior of the material under cyclic loading. Cycle count is denoted in red numerals.

Figure 9.
Typical profile of maximum temperature within then the reference zone as a function of experimental time.
Figure 9.
Typical profile of maximum temperature within then the reference zone as a function of experimental time.

Figure 10.
Comparison of IRT-measured and theoretically predicted crack growth. Solid lines represent cubic spline regressions to the data.
Figure 10.
Comparison of IRT-measured and theoretically predicted crack growth. Solid lines represent cubic spline regressions to the data.

Figure 11.
(a–e): Indicative thermographs showing crack growth and extent of damage during composite fracture. (f): Contour plots (red lines) of maximum-damage zones at crack tip, scale in millimeters.
Figure 11.
(a–e): Indicative thermographs showing crack growth and extent of damage during composite fracture. (f): Contour plots (red lines) of maximum-damage zones at crack tip, scale in millimeters.

© 2019 by the authors. Licensee MDPI, Basel, Switzerland. This article is an open access article distributed under the terms and conditions of the Creative Commons Attribution (CC BY) license (http://creativecommons.org/licenses/by/4.0/).
Share and Cite
MDPI and ACS Style
Dassios, K.G.; Matikas, T.E. Assessment of Fatigue Damage and Crack Propagation in Ceramic Matrix Composites by Infrared Thermography. Ceramics 2019, 2, 393-406. https://0-doi-org.brum.beds.ac.uk/10.3390/ceramics2020031
AMA Style
Dassios KG, Matikas TE. Assessment of Fatigue Damage and Crack Propagation in Ceramic Matrix Composites by Infrared Thermography. Ceramics. 2019; 2(2):393-406. https://0-doi-org.brum.beds.ac.uk/10.3390/ceramics2020031
Chicago/Turabian StyleDassios, Konstantinos G., and Theodore E. Matikas. 2019. "Assessment of Fatigue Damage and Crack Propagation in Ceramic Matrix Composites by Infrared Thermography" Ceramics 2, no. 2: 393-406. https://0-doi-org.brum.beds.ac.uk/10.3390/ceramics2020031