Assessing the Impact of Climate Variability on Wildfires in the N’Zi River Watershed in Central Côte d’Ivoire


1
Laboratoire Science, Société & Environnement, Unité Mixte de Recherche et d’Innovation (UMRI) Sciences Agronomiques et Génie Rural, Institut National Polytechnique Félix Houphouët-Boigny (INP-HB), P.O. Box 1093, Yamoussoukro, Côte d’Ivoire
2
START International Secretariat, 1440 G Street NW, Washington, DC 20005, USA
*
Author to whom correspondence should be addressed.
Fire 2018, 1(3), 36; https://0-doi-org.brum.beds.ac.uk/10.3390/fire1030036
Submission received: 30 July 2018
/
Revised: 19 September 2018
/
Accepted: 25 September 2018
/
Published: 28 September 2018
Abstract
:This study evaluates the impact of climate variability on wildfire regime in the N’Zi River Watershed (NRW) in central Côte d’Ivoire. For that purpose, MODIS active fire and monthly burned area data are used to evaluate wildfire occurrence, impacts and trends. Wildfire data are compared to past trends of different climatic parameters extracted from long-term meteorological records. Generalized additive models and Spearman correlations are used to evaluate the relationships between climate variables and wildfire occurrence. Seasonal Kendall and Sen’s slope methods were used for trend analysis. Results showed that from 2001 to 2016, 19,156 wildfire occurrences are recorded in the NRW, of which 4443 wildfire events are observed in forest, 9536 in pre-forest, and 5177 in Sudanian zones. The burned areas are evaluated at 71,979.7 km2, of which 10,488.41 km2 were registered in forest, 33,211.96 km2 in pre-forest, and 28,279.33 km2 in Sudanian zones. A downward trend is observed in fire records. The results indicates a strong correlation between some climatic variables and wildfire regime in this ecoregion. These correlations can be used to develop models that could be used as prediction tools for better management of fire regimes and support decision-making in the NRW.
1. Introduction
Wildfires are recognized as one of the most widespread global environmental disturbances, along with natural disasters such as droughts, floods or hurricanes [1]. Each year, 350 million hectares of vegetation affected by fires around the world, half of them in sub-Saharan Africa [2]. These wildfires have several consequences, including global warming, loss of life, air pollution, desertification and loss of biodiversity [3,4,5].
Climate strongly influences global wildfire activity, and recent forest fire events can signal weather-induced pyrogeographic changes [6]. Various products of fire danger rating systems are based on ignition source but also on propagation factors with climate a major modulator [7].
According to the Intergovernmental Panel on Climate Change (IPCC), climate change is the largest and certainly the most critical of all the environmental challenges facing societies in the present century. Global average surface temperature at the land surface increased by 0.85 °C during the 1880–2012 period, with the warmest temperatures ever recorded over the past three decades [8]. Climate change and variability pose a growing challenge in wildfire control efforts with the biggest challenge in developing countries [9,10,11].
Wildfires are a key element in the landscape dynamics of West Africa [12,13]. Depending on the ecological zones and the periods of the year, wildfires are considered either as a threat to fight, or as a real management tool for sustainable resource use and conservation objectives [14]. Despite their benefits, wildfires cause significant damage to natural resources. They can lead to loss of organic matter, depletion of moisture reserves through intense evaporation, erosion and soil leaching, thus leading to lower crop yield, grazing productivity and biodiversity. The impact of wildfires on air quality is known: the release of emissions particles and volatile organic compounds, along with a significant amount of greenhouse gas [15,16].
Recent studies on drivers of deforestation in Côte d’Ivoire have shown that wildfires account for 3% and 23% of direct drivers of deforestation and forest degradation, respectively [17]. These wildfires cause devastating damage, threaten people and their activities, and have a very high social and economic cost [18]. Each year, around January and February, the country experiences wildfires that ravage hundreds of thousands of hectares of land suitable for agriculture, particularly in the northern half of the country. During 2016’s wildfire season, nearly 15,000 ha of cropland and 11,000 ha of forest were destroyed, and 10 villages were hit by flames, with many hundreds of huts lost and 17 deaths registered in the country. The financial loss related to the fire damage is estimated at nearly 204 billion CFA francs, equivalent to approximately USD 363 million [19].
However, wildfire occurrence in these areas is still poorly understood. Little information is available about fire regimes, the ecological effects of wildfires, and associated emissions from biomass combustion in a changing climate. The lack of a strong national fire monitoring policy makes fire statistics unreliable and, also, limits their usefulness. Also, several studies have revealed the downward trend of precipitation and the variability of temperature over the country [20,21,22,23,24]. Although the influence of climate change on wildfires has been studied globally, uncertainties about this influence at a global, regional and hyper-regional level still exist [25].
Therefore, it is very important to understand the impact of climate variability at a fine scale in order to define clear wildfire management and prevention methods and support decision-making in the NRW to mitigate any adverse consequences of changing climate and wildfires.
The purpose of this paper was to assess the potential relationship between climate conditions and wildfire occurrence in the N’Zi River Watershed in central Côte d’Ivoire.
2. Materials and Methods
2.1. Study Site
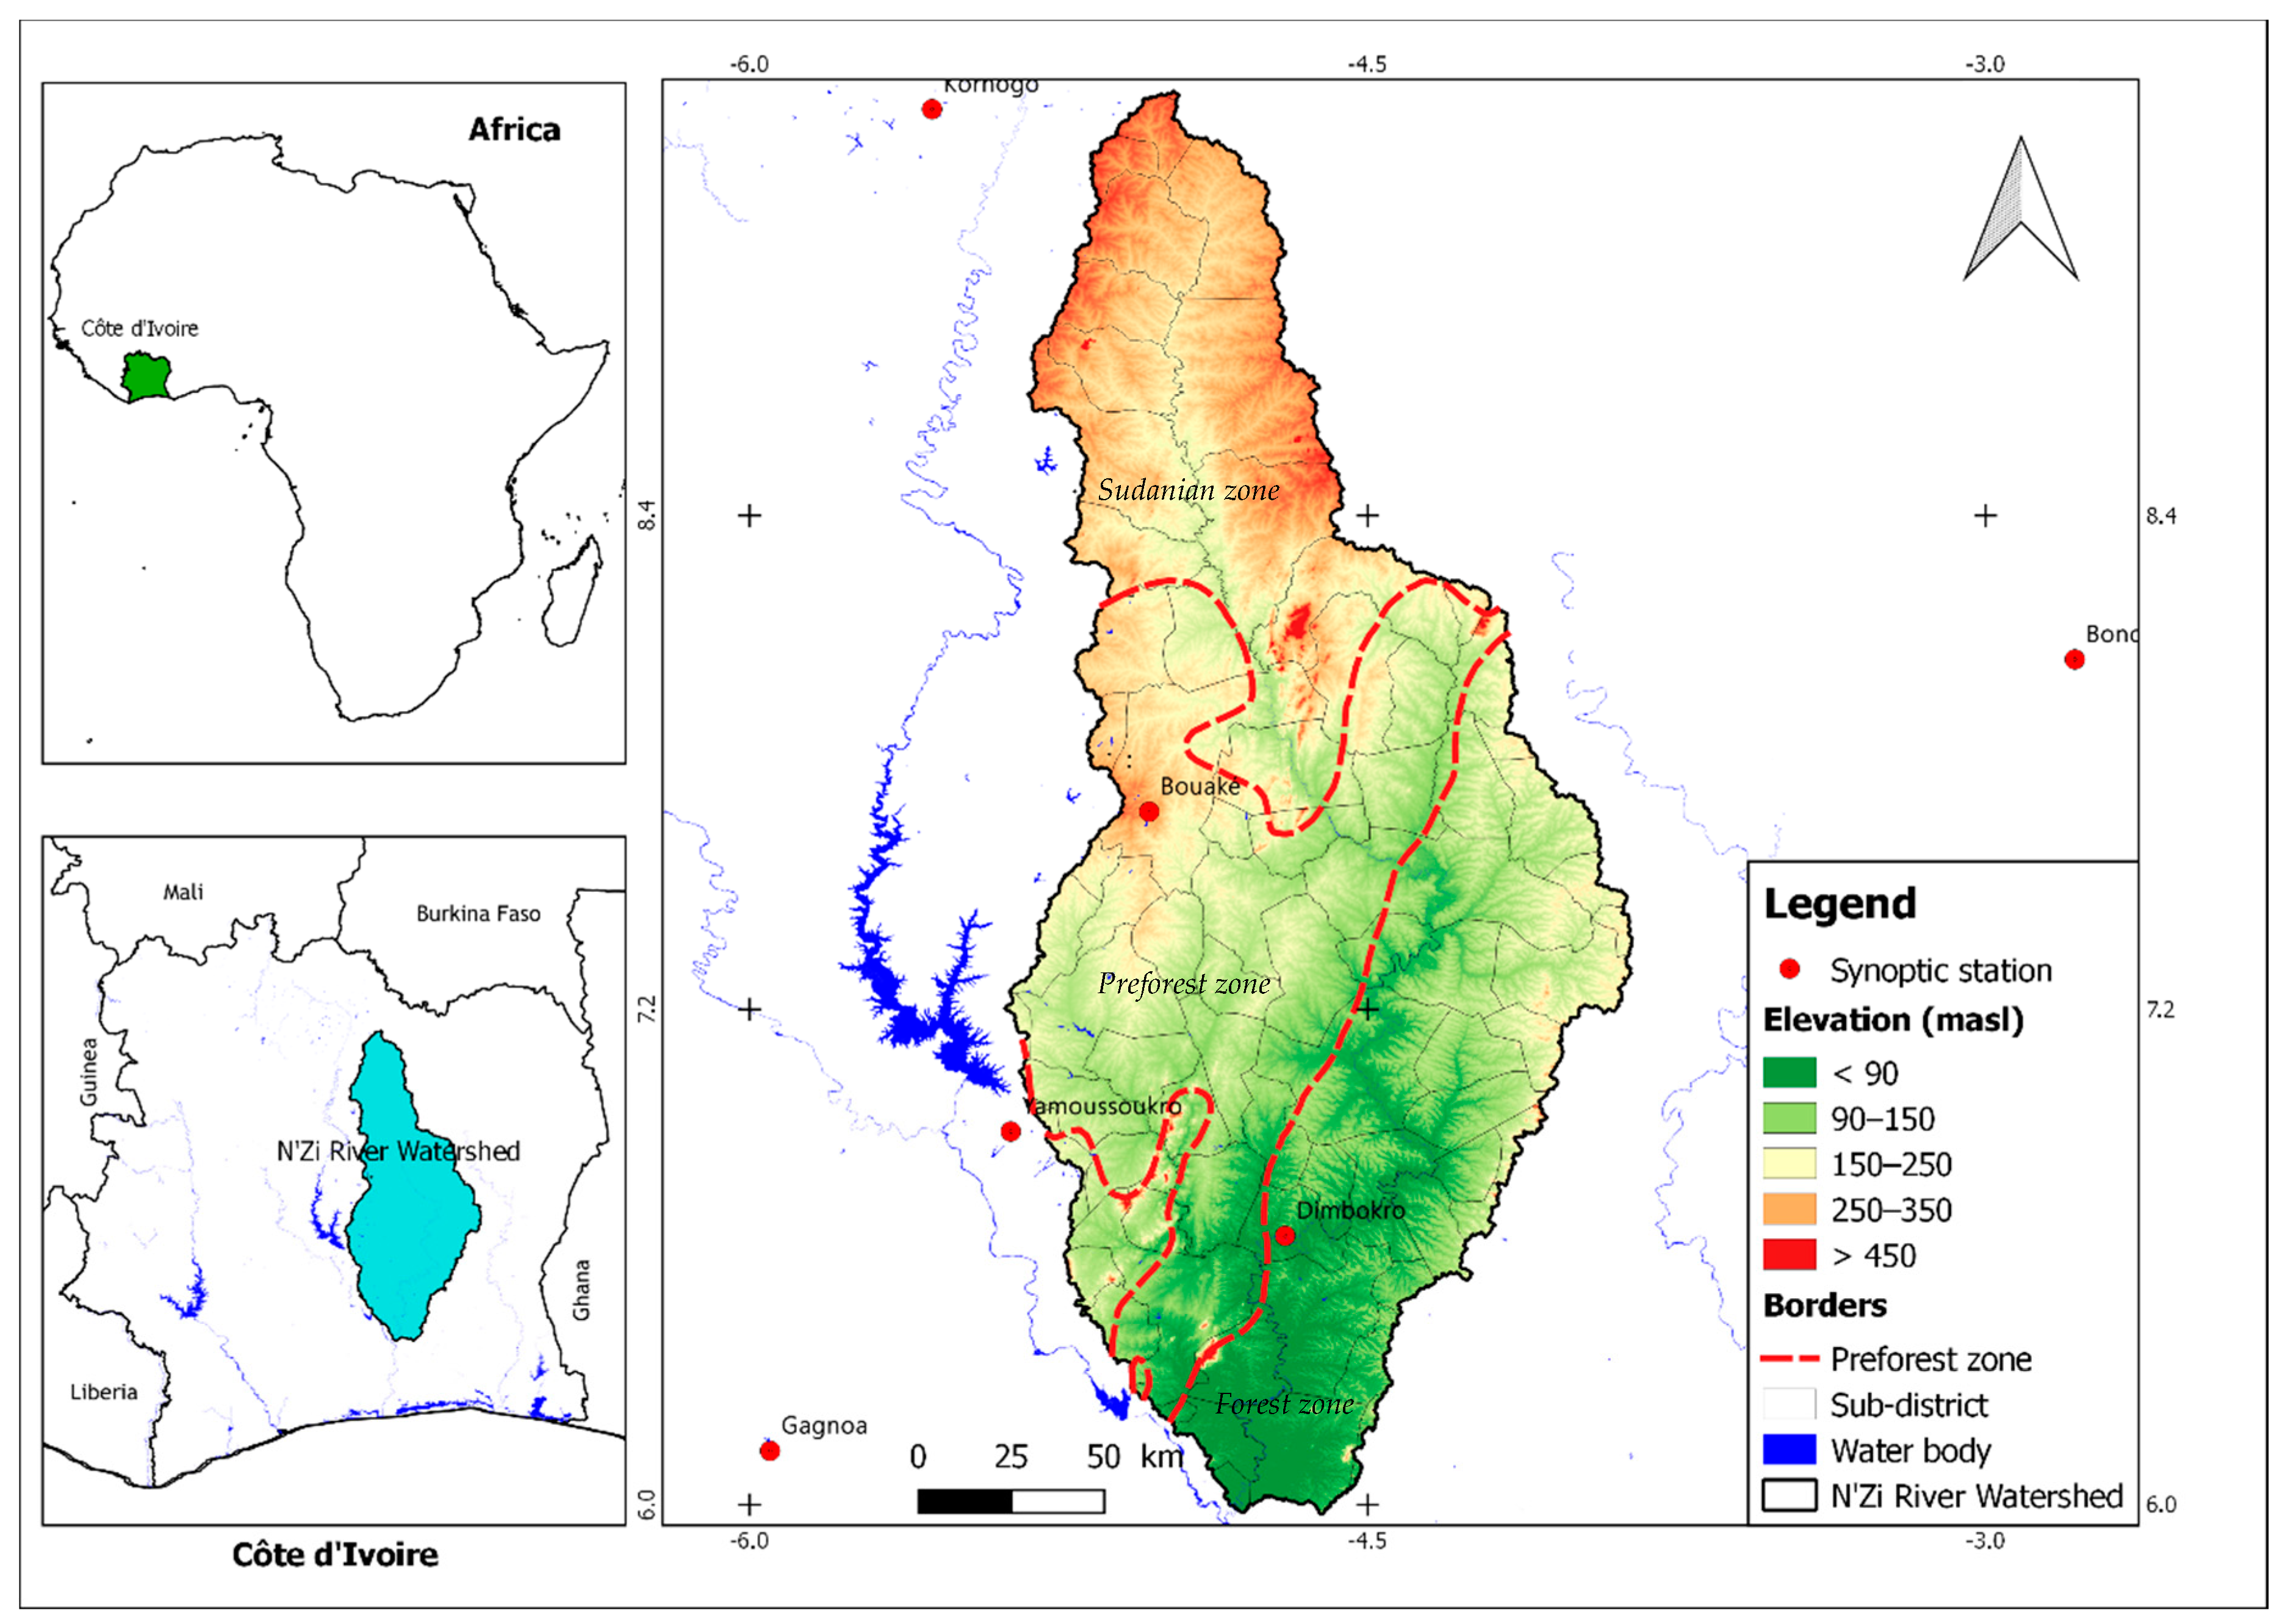
Located in central Côte d’Ivoire, the study area is the N’Zi River Watershed, a tributary of the Bandama River. It lies between 3°85′ W and 5°38′ W longitude and between 5°97′ N and 9°43′ N latitude, with an altitude ranging between less than 100 m a.s.l. in the south and more than 600 m a.s.l. in the north (Figure 1). With an approximate area of 35,309 km2, the NRW occupies nearly 11% of the national territory and straddles 80 small administrative entities (subprefectures) of the District of Yamoussoukro and eight administrative regions (Agneby-Tiassa, Belier, Gbeke, Hambol, Iffou, Moronou, N’Zi and Tchologo). Due to its longitudinal configuration, the NRW spans the major climatic regions of Côte d’Ivoire and is covered by forest ecosystems in the south, mosaic forest‒savannah ecosystems in the centre and savannah ecosystems in the north.
The forest zone is characterized by equatorial transition climate (Guinean climate) with annual rainfall between 1300 and 2400 mm. Dense moist forest is the characteristic vegetation found in this zone, with the remaining forest on the top of hills and in classified forests; the majority of the forest has been converted to agricultural land (mainly for cocoa, coffee and some food crops). In the pre-forest zone, there is an attenuated equatorial transition climate (Baoulean climate). The annual rainfall ranges between 1500 and 2200 mm. The vegetation is characterized by Guinean forest‒savannah mosaic, with forest patches along the river. The open forests are composed of trees whose crowns almost meet, below which the land and grass cover is very sparse. The wooded savannahs and open wooded savannahs are made up of trees or shrubs sparse with graminaceous groups (especially Panicum spp., Loudetia arundinacea, L. simplex, etc.) and elephant palm (Borassus aethiopum) stands, which are easily affected by wildfires. These two ecoregions have two dry seasons and two rainy seasons. In the Sudanian zone, the climate is characterized by a dry tropical transition climate (Sudano-Guinean climate) with two seasons. The landscape is mainly composed of grassland and wooded grasslands. In this area, the herbaceous cover, ranging in height from 20 cm to 1.5 m, is composed of species of Panicum and Pennisetum, which are regularly affected by wildfires [26,27].
2.2. Dataset Description
2.2.1. Meteorological Data
For this study, data were obtained from synoptic weather stations located in the catchment, and within a 100 km radius.
Time series of daily precipitation, maximum air temperature and minimum air temperature, wind speed, relative humidity, sea level pressure, etc. of each selected synoptic station were gathered from the NOAA National Climatic Data Center online data retrieval tool [28]. The data were then pooled and mean values were computed to evaluate long-term trends in terms of climate variables.
In addition to meteorological variables, we used three drought and fire danger indices in order to estimate the impact of these indices in wildfire occurrence in the area. These indices are:
- -
- the Angstrom Index (AI), used primarily in Sweden and its inputs are the air temperature and relative humidity to calculate a numerical index of fire danger [29];
- -
- the Lowveld Fire Danger Index (FDI), widely used in South Africa and providing a reasonably good measure of short-term wildfire risk. The inputs are the maximum temperature, the wind speed and the relative humidity [30];
- -
- the Standardized Precipitation Index (SPI), used to quantify the precipitation deficit and characterize meteorological drought on a range of timescales, and based only on precipitation [31].
2.2.2. Active Fire and Burned Area Data
Spatial and temporal patterns of wildfires occurrence in the area were assessed with a combination of the MODIS MCD14DL active fire products with a resolution of 1 km [32], VIIRS VNP14IMGTDL active fire products with a resolution of 375 m [33] derived from the MODIS and VIIRS sensors respectively, and burned area scars generated from the 500 m resolution MODIS burned area product MCD64A1 [34]. The Moderate Resolution Imaging Spectroradiometer (MODIS) is an onboard sensor aboard the Terra and Aqua satellites of the Earth Observing System (EOS) program of the National Aeronautical and Space Administration (NASA), launched in 1999 and 2002, respectively [35].
The MODIS MCD14DL Collection 6 and VIIRS VNP14IMGTDL products contain geographic coordinates, day of detection, brightness temperature, fire radiation power, and detection confidence level for all MODIS/VIIRS fire pixels. These data were produced by the University of Maryland and downloadable from the NASA LANCE FIRMS website [36,37].
The MCD64A1 Burned Area product is a monthly Level 3 MODIS 500 m resolution product, derived from Terra/Aqua MODIS sensor, containing per pixel burn information and metadata [38]. The pixels detected as burned pixels are directly converted to burnt areas. Monthly data from the MODIS subcontinental Windows 9, containing data on West African countries, are available from the University of Maryland server (ftp://ba1.geog.umd.edu) and were used for this study.
2.3. Methodology
2.3.1. Seasonal Kendall Test
Seasonal Kendall test is an extension of the Mann‒Kendall test, which is used for the detection of significant trend in environmental data series [39,40,41]. The seasonal Kendall test accounts for seasonality by computing the Mann‒Kendall test on each of m seasons separately, and then combining the results. This test, entirely based on ranks, is robust against non-normality and censoring [42]. Kendall’s S statistic Si for each season are summed to form the overall statistic S’ Equation (1):
Positive (negative) signs of the test S statistics indicate an upward (downward) trend in the data. When the product of number of seasons and number of years is more than about 25, the distribution of S’ can be approximated quite well by a normal distribution with expectation equal to the sum of the expectations (zero) of the individual Si under the null hypothesis, and variance equal to the sum of their variances. The variance of the seasonal Kendall statistics is given by Equation (2):
where ti is the number of ties present to sample i.
The standardized SK test statistics (Z) can be estimated by Equation (3):
The Z statistic follows a standard normal distribution; if its value is positive, it signifies an upward trend and if its value is negative it signifies a downward trend. If the value of Z is greater than Zα/2 then it is considered a significant trend (where α is the significance level) and the null hypothesis is rejected.
2.3.2. Sen’s Slope
Although the Kendall statistic indicates the presence of a monotonic trend in the time series, it is often supplemented by the Theil‒Sen slope estimator (tau or τ) [43], which gives the trend corresponding linear median. This is a nonparametric method that assumes a linear trend in the time series data and uncorrelated data.
2.3.3. Spearman Correlation
The correlation between meteorological and wildfire variables (number of wildfires NF and burned area SB) was assessed using the Spearman non-parametric correlation test (Spearman rank coefficient denoted by rho) at phytogeographic level using monthly data, in order to select most correlated climatic variables with wildfire variables. A correlation matrix was built at phytogeographic level by crossing the studied wildfire variables to the meteorological variables in Table 1.
2.3.4. Nonparametric Regression
As the distributions of wildfire variables were not normal, we analysed the relationship between environmental factors and wildfires variables using generalized additive model (GAM) [46]. The GAMs are useful for identifying non-linear relationships and do not require a priori knowledge of the shape of the response curves, which is determined by the data itself [47,48]. A GAM model is constructed by the sum of smoothed functions of the predictor variables, which can identify the types of effects and nonlinear relationships between variables. For this purpose, it is common to use polynomials defined based on intervals known as splines [48,49]. In general, the structure of a GAM according to Wood [48] could be estimated by Equation (5):
where µi ≡ E(Yi) and Yi∼EF (μi, ϕ). Yi is a response variable, EF (μi, ϕ) denotes an exponential family distribution with mean μi and scale parameter, ϕ, Ai is a row of the model matrix for any strictly parametric model components, θ is the corresponding parameter vector, and the fj are smooth functions of the covariates, xk.
We used a stepwise approach to determine the model with the optimal set of covariates based on the lowest Akaike Information Criterion (AIC) and lowest generalized cross-validation (GCV) score. Both process and observation error were assumed to have Gaussian distributions. The significance of the spline terms was assessed and fitted with linear interactions when non-significance was detected. The shapes of the functional forms for the selected covariates were plotted. When the slopes of the functional forms are positive, the covariates are related positively to the dependent variables, or vice versa.
For accuracy assessment, we used the 10-fold repeated cross-validation [50] (each model was re-fitted 10 times using 90% of the data and predictions derived from the fitted models were compared with observations of the remaining 10%). We derived the coefficient of determination (R2) and root mean squared error to quantify the goodness of fit of the models. Those with the lowest AIC [51], the highest R2 (adjusted for number of predictors in the model) and the highest deviance explained were considered. In this study, we performed in the R computing environment [45], GAM regression using the package mgcv [47], and 10-fold cross-validation using the package gamclass [52].
3. Results
3.1. Wildfire Regime and Trends
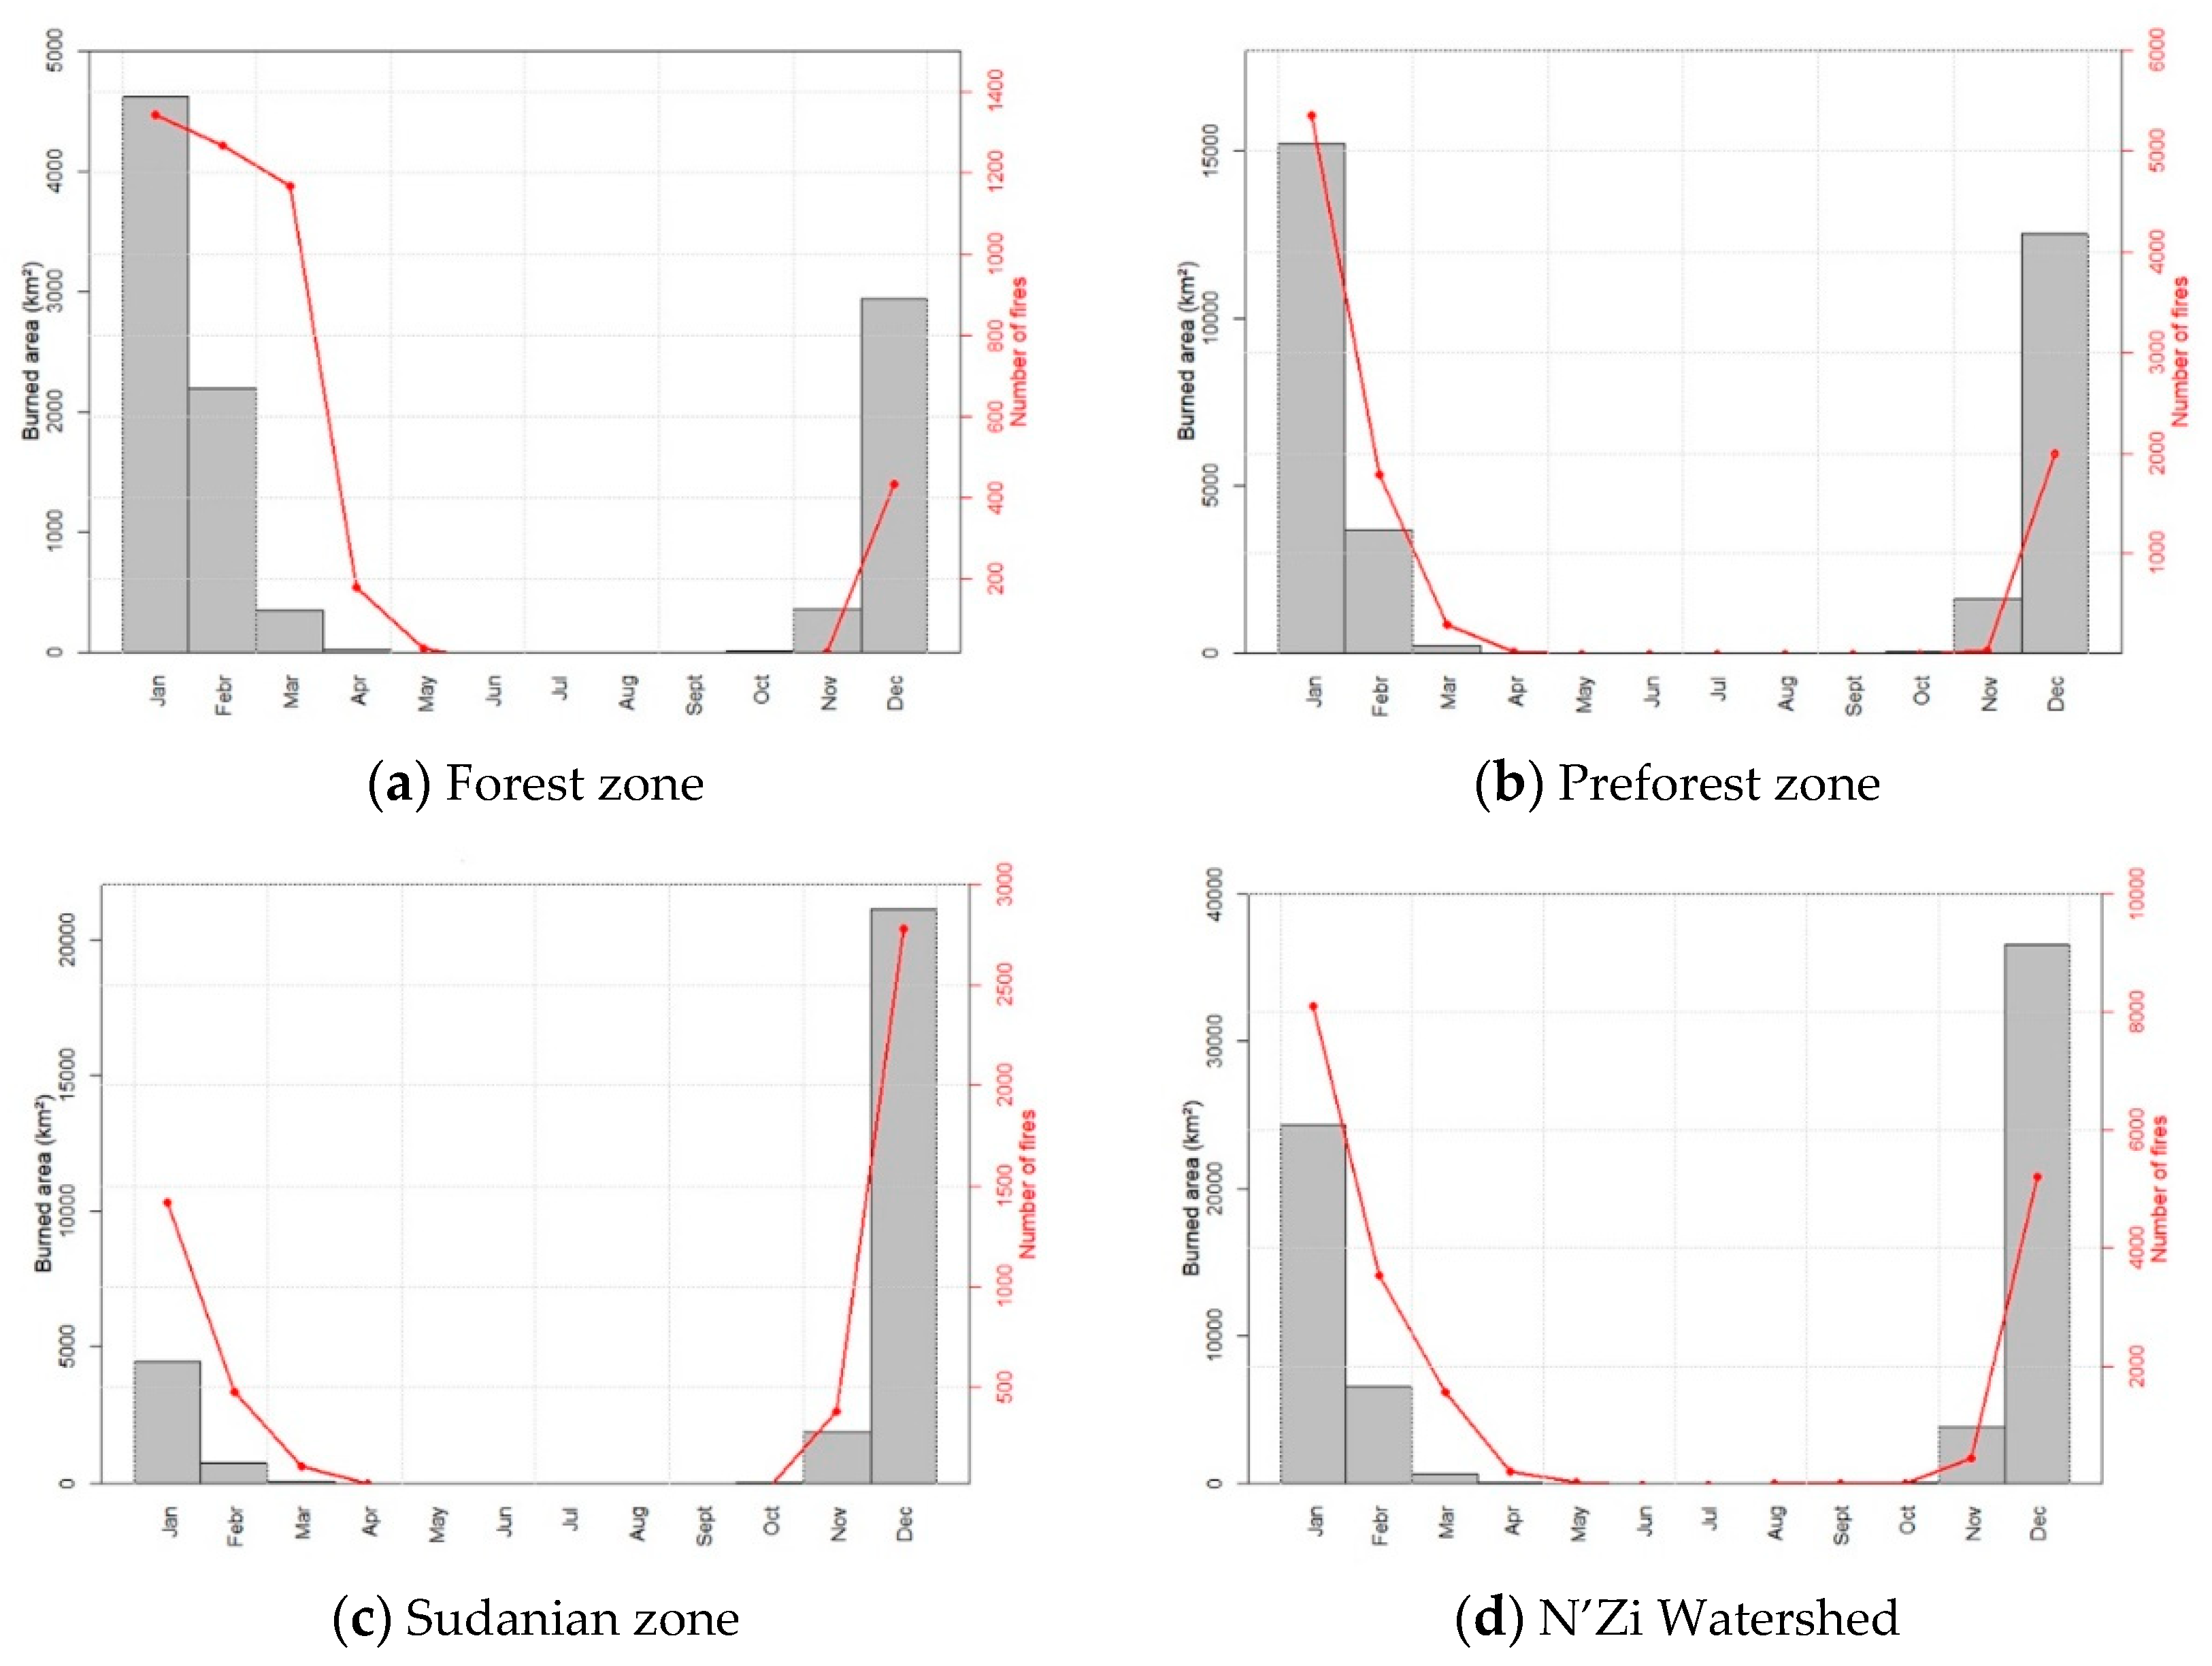
In the 2001–2016 period, 19,156 wildfires were detected in the N’Zi River Watershed (NRW), which burnt approximatively 71,979.7 km2 of vegetative lands. Wildfire occurrence showed strong seasonal dependence within the NRW. This seasonality was similar among ecological zones (Figure 2). Wildfires were most common during the warm season throughout both ecoregions, with moderate wildfire activity extending into the rainy season (March‒April). Wildfires typically peaked in terms of both numbers and surface burned (SB) from December to January across the preforest zone. Across the watershed, a high number of wildfires and a large burned area were detected in the preforest zone (Figure 2 and Figure 3). In the study area, December was the hotspot month, with 8116 wildfires detected (42.4%), and January the most impacted month, with 36,557.77 km2 of vegetation burned (50.8%).
At ecoregion level, the wildfire occurrence has been evaluated at 4443 wildfires, 9536 wildfires and 5177 wildfires for the forest, pre-forest and Sudanian zones, respectively. The damages associated to these wildfires were estimated at 10,488.41 km2, 33,211.96 km2, and 28,279.33 km2 for the forest, pre-forest and Sudanian zones, respectively.
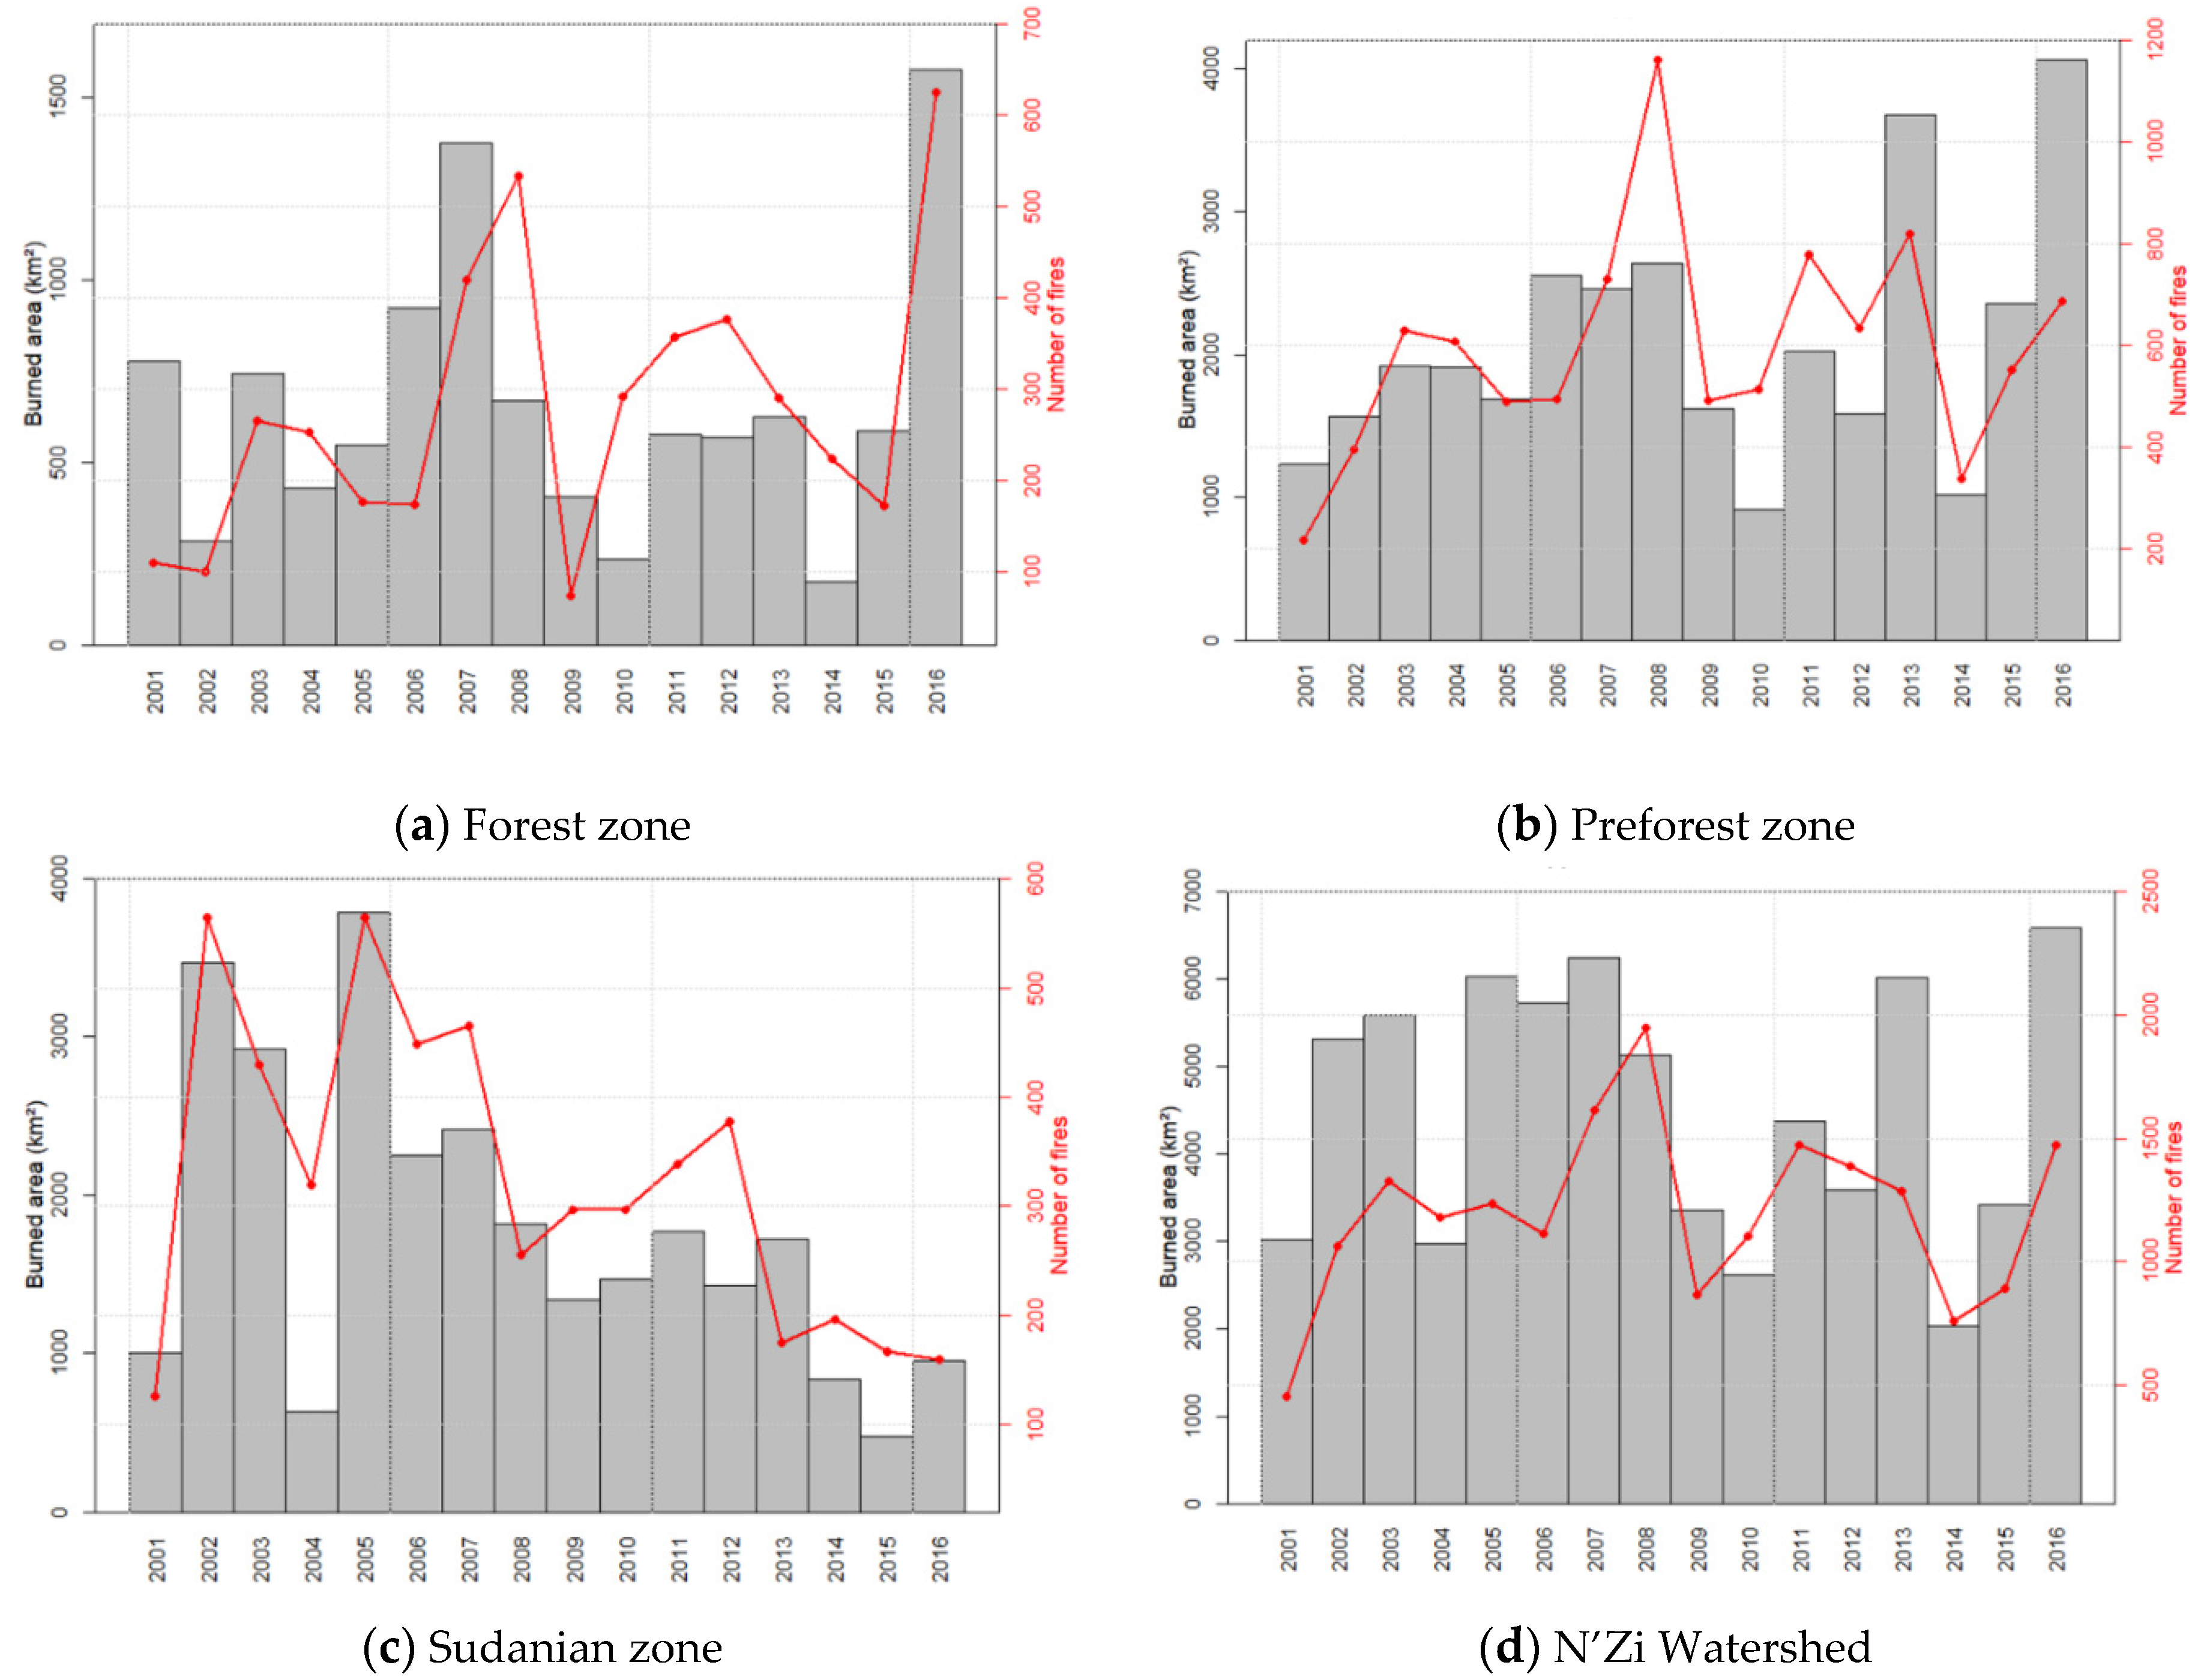
The highest wildfire occurrence and extent of burnt area were registered in 2008 (with 1949 wildfires representing 10.2% of active wildfires) and 2016 (with 6593.89 km2 representing 9% of total burnt areas), respectively. Their lowest values have been detected 2001 for NF and 2014 for SB (Figure 3). Considering the whole NRW, wildfire activity has increased from 2001 to 2008, and was decreasing in the last decade for both NF and SB. This activity was similar in all the ecoregions, with the exception of the Sudanian zone, where the wildfire activity was intense from 2002 to 2005 and decreased significantly after that date.
Wildfire data trends have been analysed both for the whole NRW and each ecoregion in order to make some inferences about the evolution of wildfires over the years. Table 2 shows the results of the seasonal Kendall test and Sen’s Slope for fire data for Burned Area (SB) and Number of wildfires (NF).
Considering the whole NRW, the SB monthly trend has not shown significance from a statistical point of view. By analysing the SB trend of each ecoregion, it is evident that the preforest and Sudanian zones did not show any significant trend for both tests, while the seasonal Kendall test was significant for the forest zone, with p < 0.05. In these ecoregions, the SB showed a negative trend.
In regard to NF, it showed a negative significant trend for the whole NRW (Table 2). All the ecoregions showed a highly significant downward trend for the seasonal Kendall test (p < 0.001).
The trends show that NF and SB were decreasing for the period 2001–2016, and could be seen especially in forest and preforest zone for both NF and SB.
3.2. Spearman Correlation
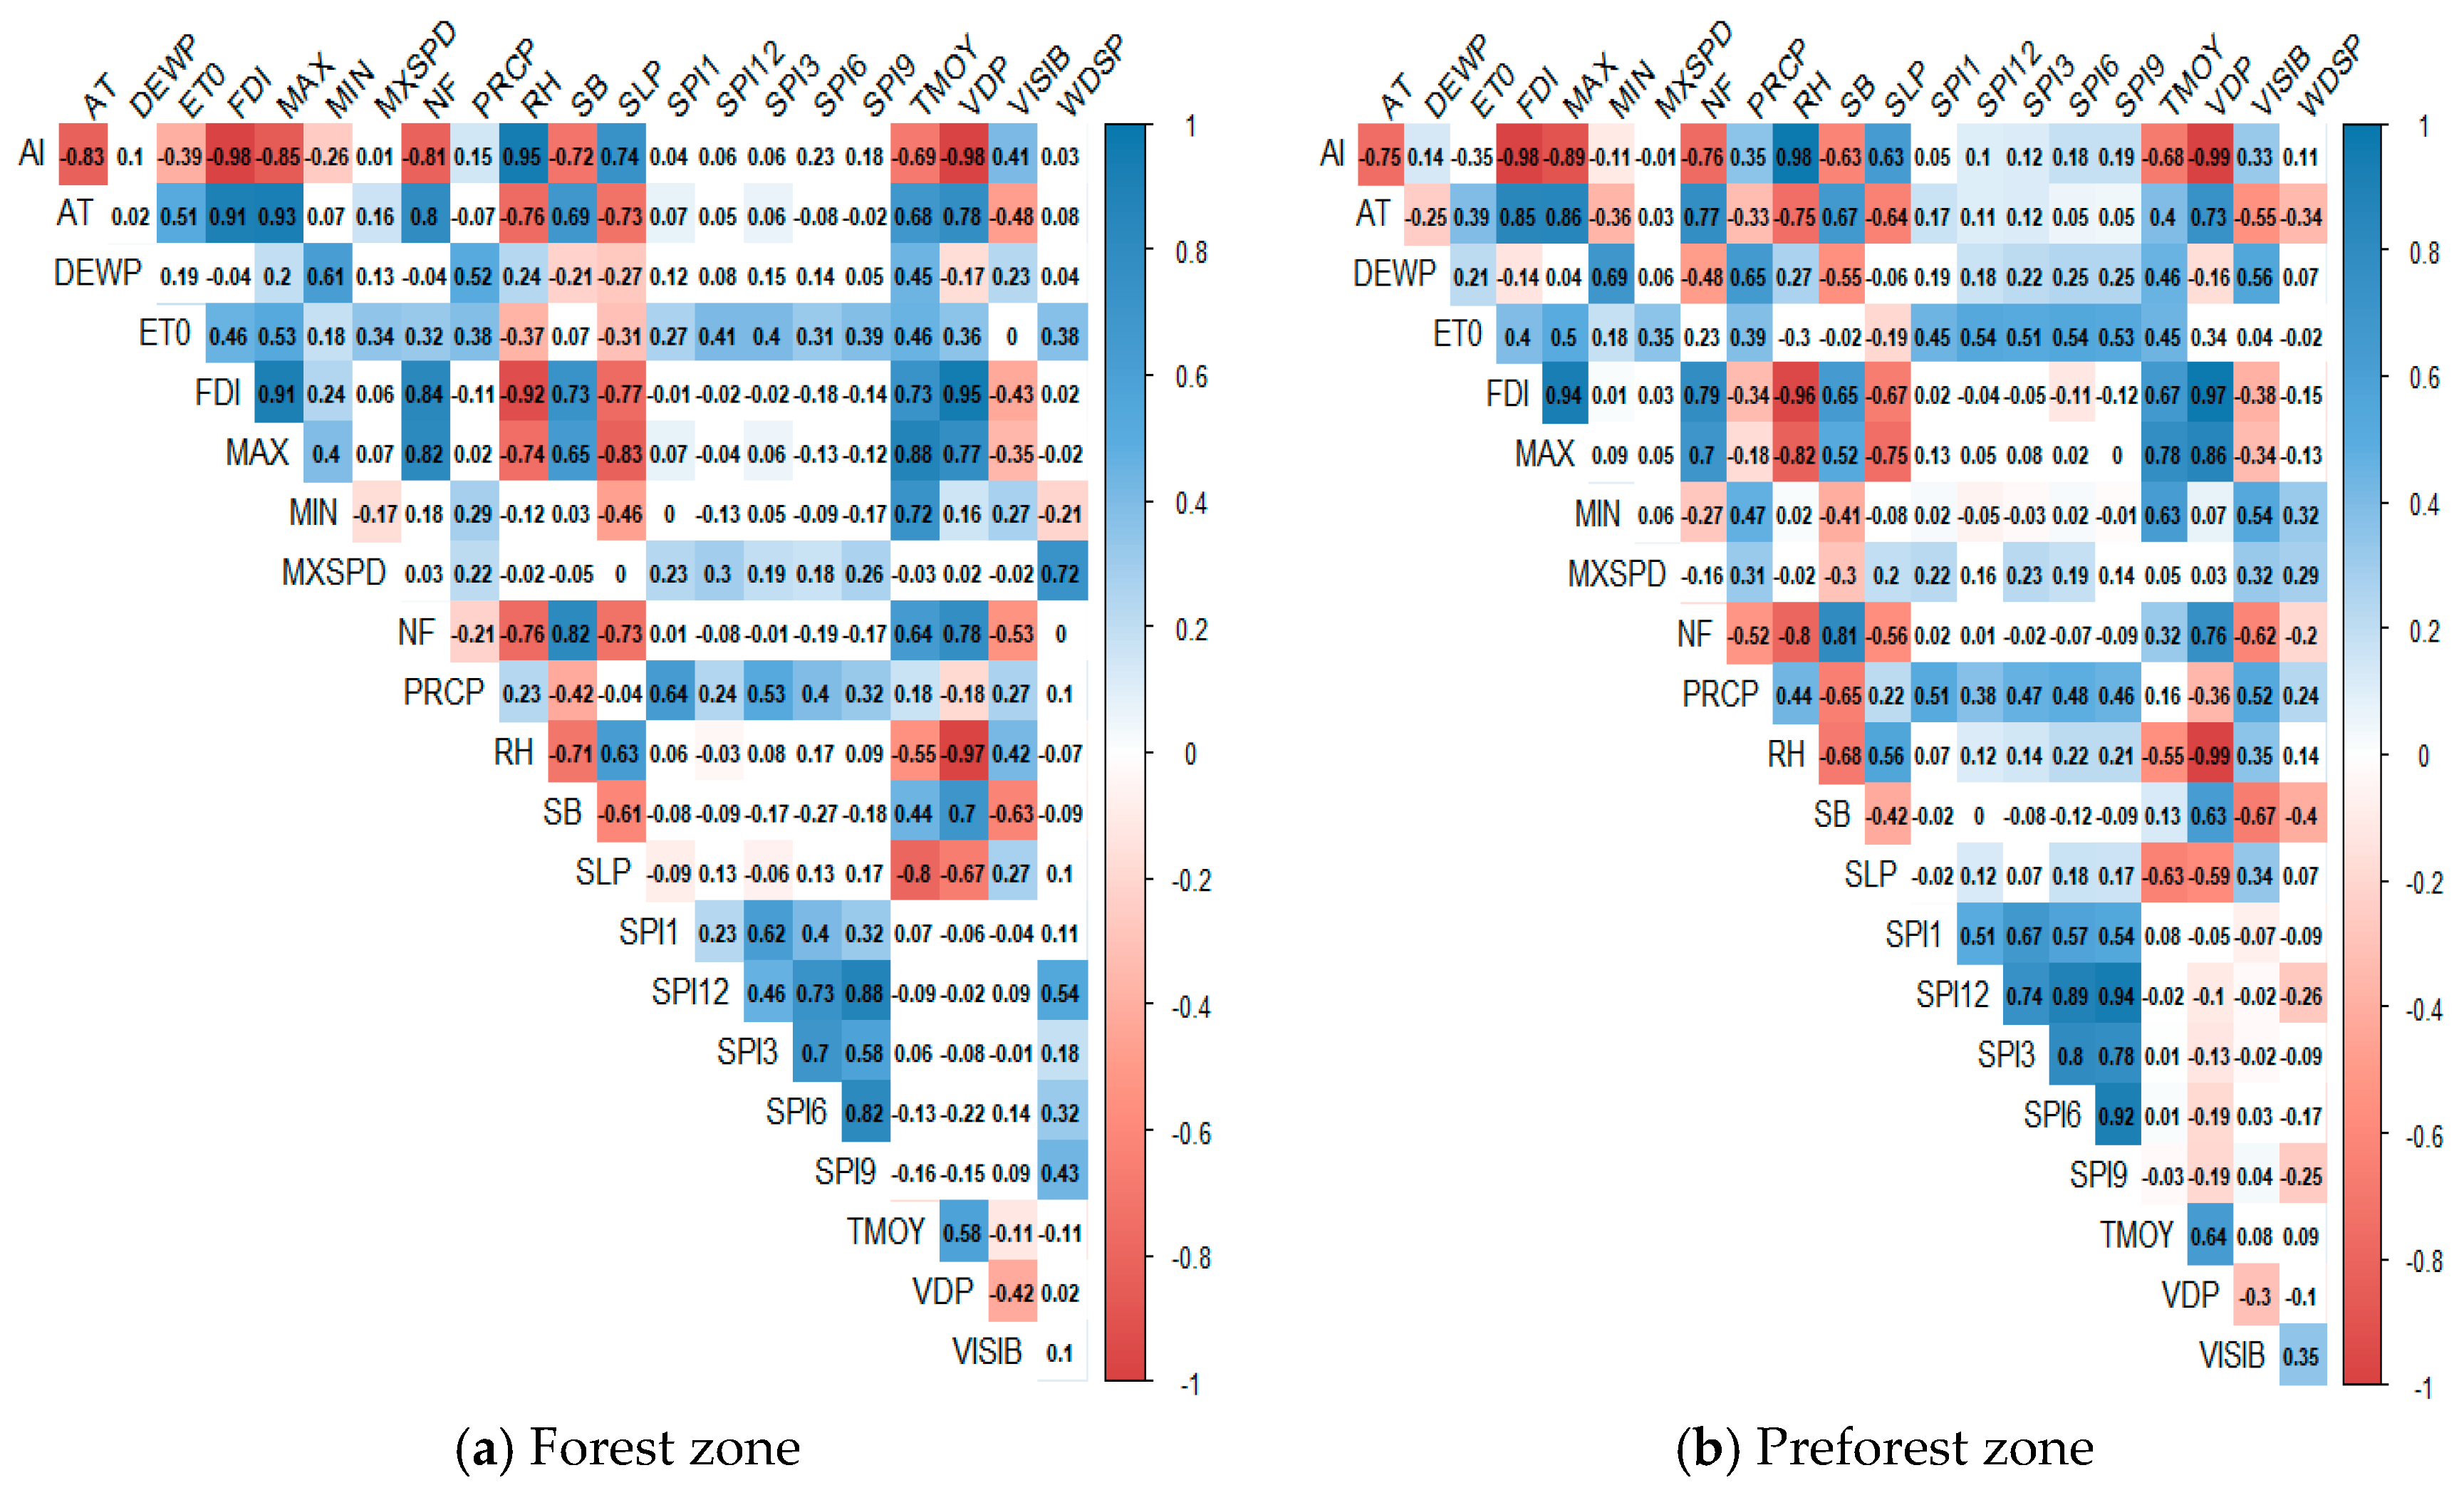
In order to analyse the relationships between wildfire and weather parameters, Spearman’s correlations between meteorological, fire danger indices and wildfire variables have been computed using correlation matrix at the watershed and ecoregion level by using monthly data (Figure 4); blank cells were not significant at the 5% significance level.
Considering the whole NRW, all the weather variables were significant at p < 0.05 except reference evapotranspiration (ET0), three-month Standardized Precipitation Index (SPI3), nine-month Standardized Precipitation Index (SPI9), 12-month Standardized Precipitation Index (SPI12) for SB, and minimum temperature (MIN), maximum wind speed (MXSPD), SPI3, SPI6, SPI9 and SPI12 for NF (Figure 4d). The most correlated variable for both SB and NF was the Lowveld fire danger index (FDI), positively correlated with NF and SB, which was followed by the relative humidity (RH), negatively correlated with NF and SB.
In the forest zone, the non-significant variables (p > 0.05) were MIN, MXSPD, wind speed (WDSP), Dewpoint (DEWP), SPI1, SPI3, SPI6, SPI9 and SPI12 for NF, and MIN, MXSPD, WDSP, ET0, SPI1, SPI3, SPI6, SPI9, SPI12 for SB (Figure 4a). The other variables were highly significant (p < 0.001). The most correlated variable for both NF and SB was FDI, positively correlated to wildfire activity.
In the preforest zone, almost the climatic variables were significant with p < 0.05 except ET0, MXSPD, SPI1-12 for NF, and ET0, SPI1-12 for SB. The most correlated variable was RH for both NF and SB, proportionally inverse to them (Figure 4b).
In the Sudanian zone, the non-significant climatic variables found were MIN, MXSPD, WDSP, ET0, SPI3, SPI9, SPI12 for NF, and MXSPD, WDSP, Sea level pressure (SLP), mean temperature (TMOY), ET0, SPI3, SPI6, SPI9, SPI12 for SB (Figure 4c). NF and SB showed better correlation with RH (rho < −0.85) and DEWP (rho < −0.79).
In addition, all the ecoregions and the whole NRW showed proportional negative correlation with rainfall (PRCP) and positive correlation with maximum temperature (MAX).
3.3. Nonparametric Regression
GAM regression was used to investigate the key meteorological and climatic factors affecting fire activity in the watershed. Table 3 and Table 4 present results from GAMs of the monthly number of wildfires (NF) and the monthly area burned (SB) for the three ecoregions across the NRW. All variables listed in Table 1 were available for stepwise GAM regression and only the significant terms were kept.
The shapes of the functional forms for selected covariates of the fire activity in each ecoregion are illustrated in Figure 5, Figure 6, Figure 7 and Figure 8. These indicate that the number of wildfires and the burned area of the three ecoregions and the whole watershed displayed non-linear responses to the covariates.
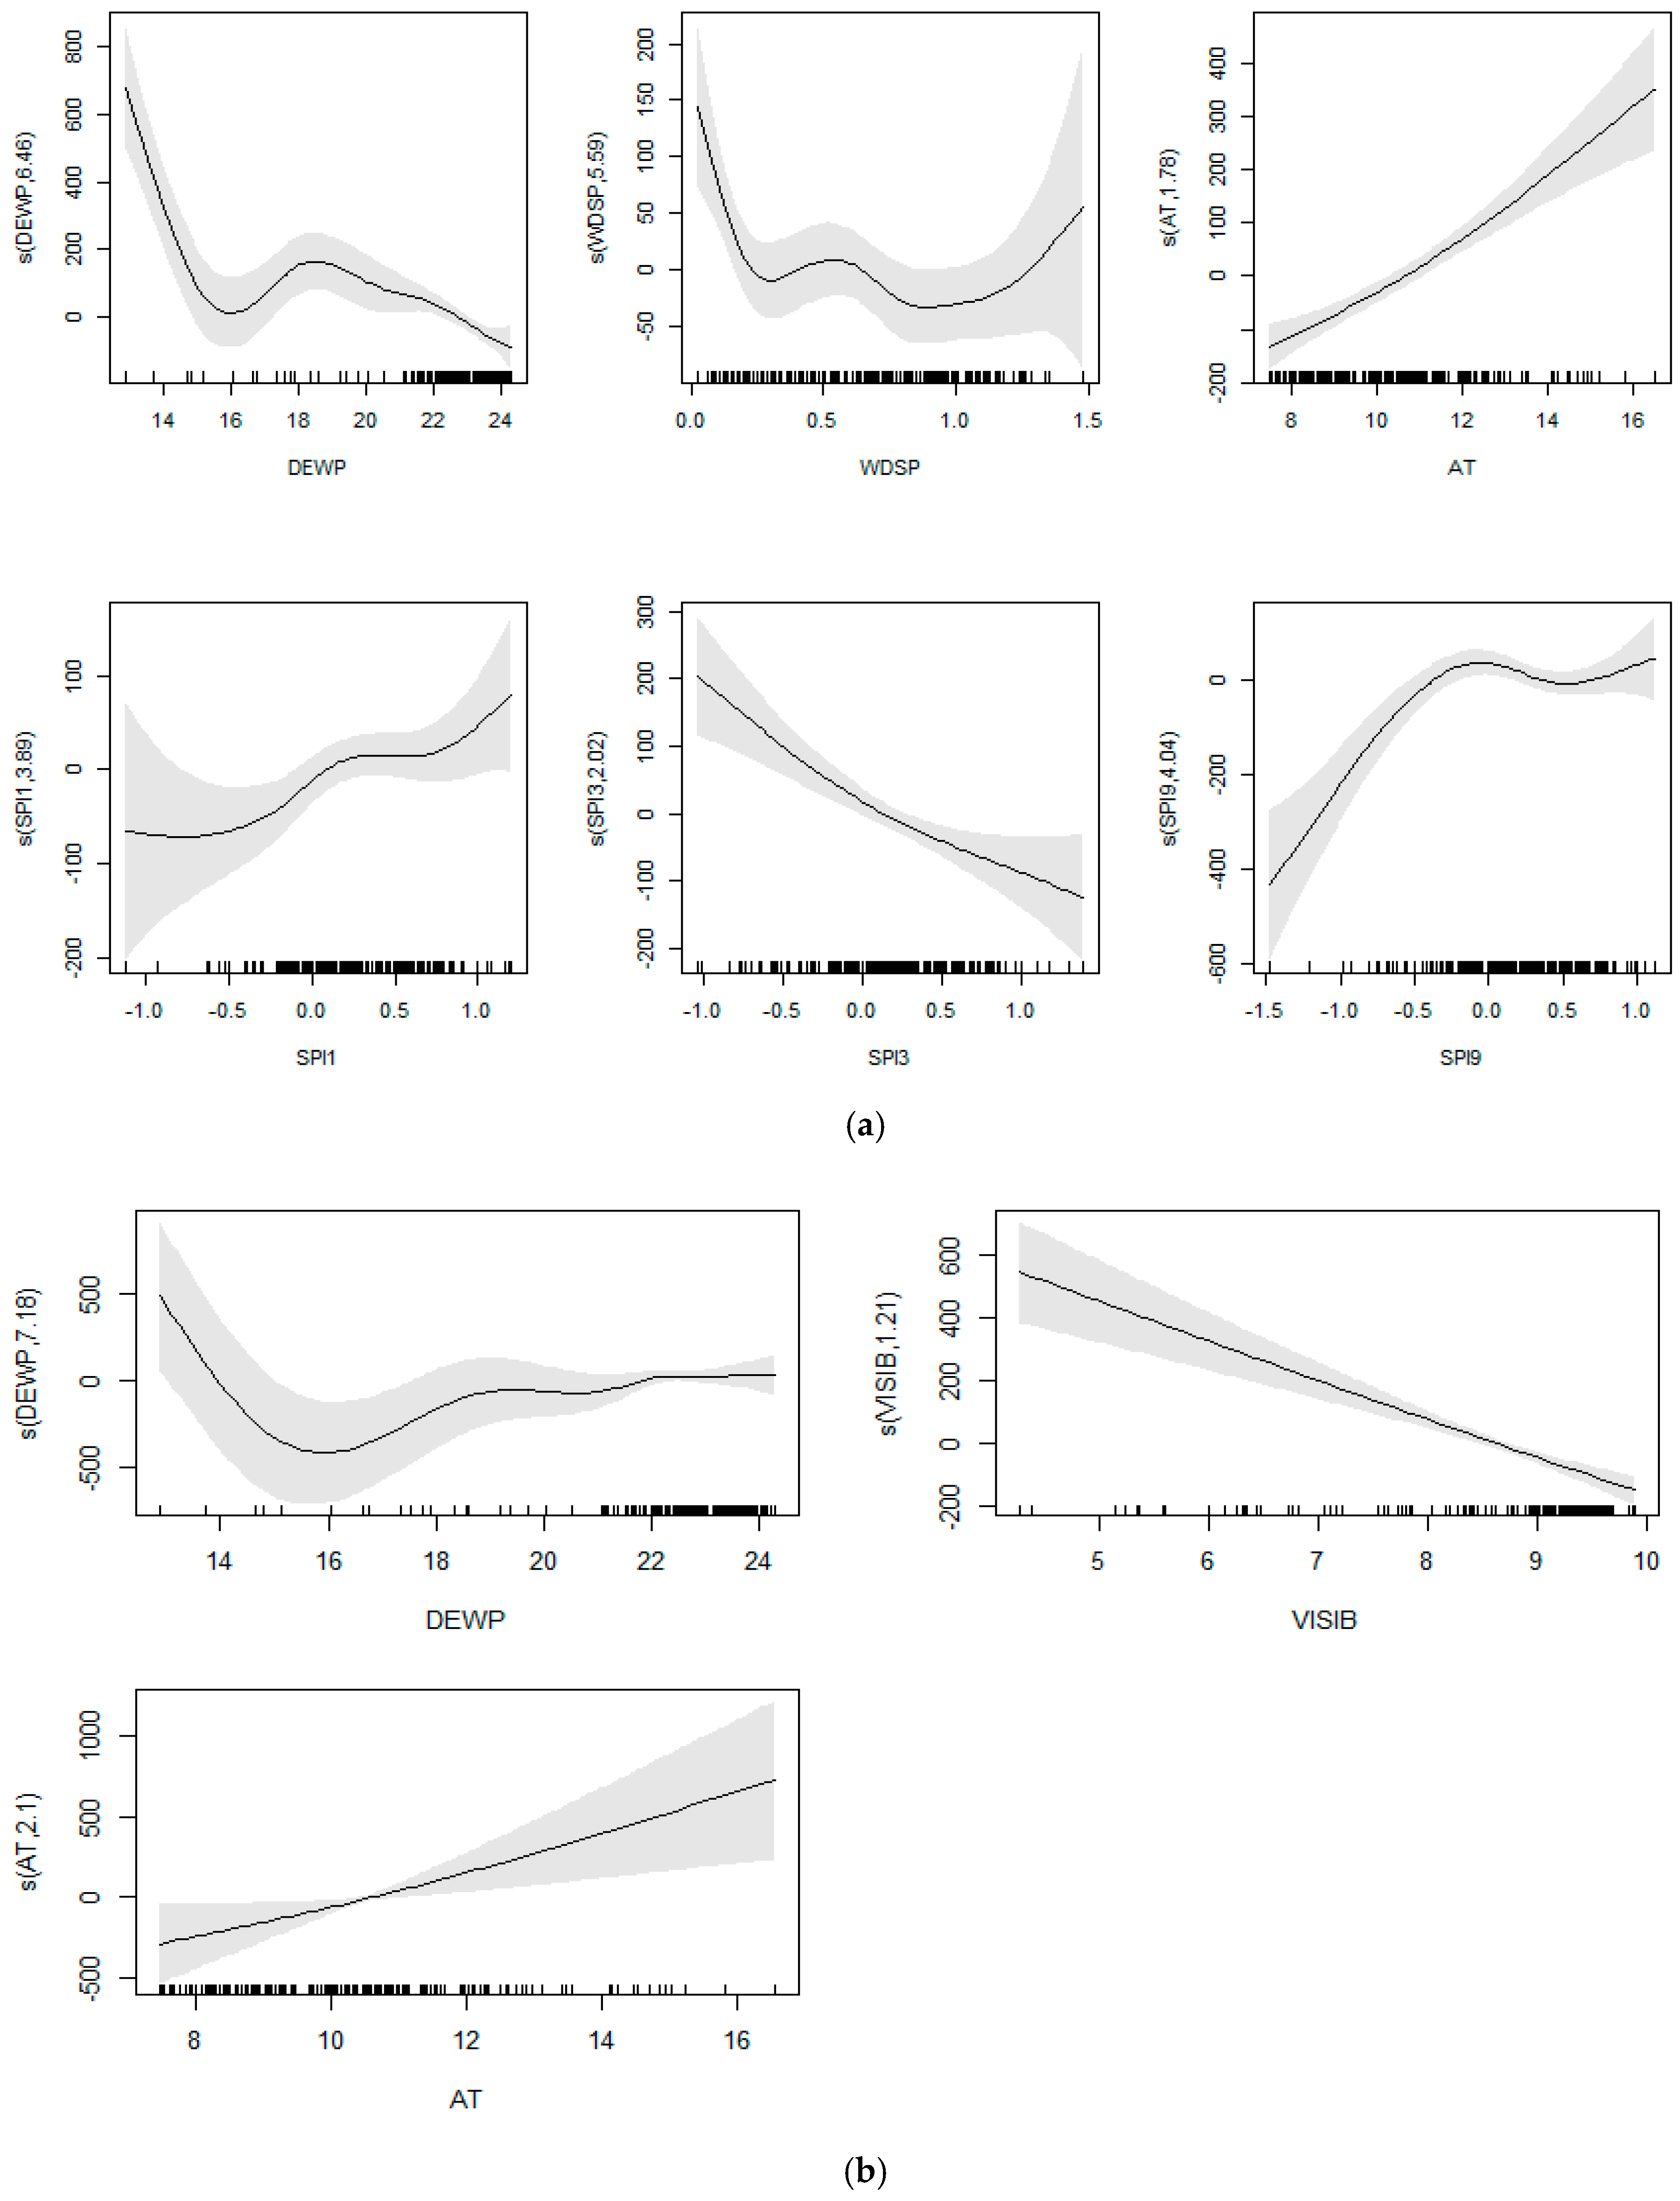
As far as the whole NRW is concerned, the key predictors in GAM were WDSP, AT, DEWP, SPI1, SPI3, and SPI6 for NF, and AT, DEWP, VISIB for SB. All the covariates included in GAM could explain about 80% for NF and 81% for SB. In this region, all the significant covariates had relatively simple nonlinear relationships with the number of wildfires (Figure 8a) and the burned areas (Figure 8b).
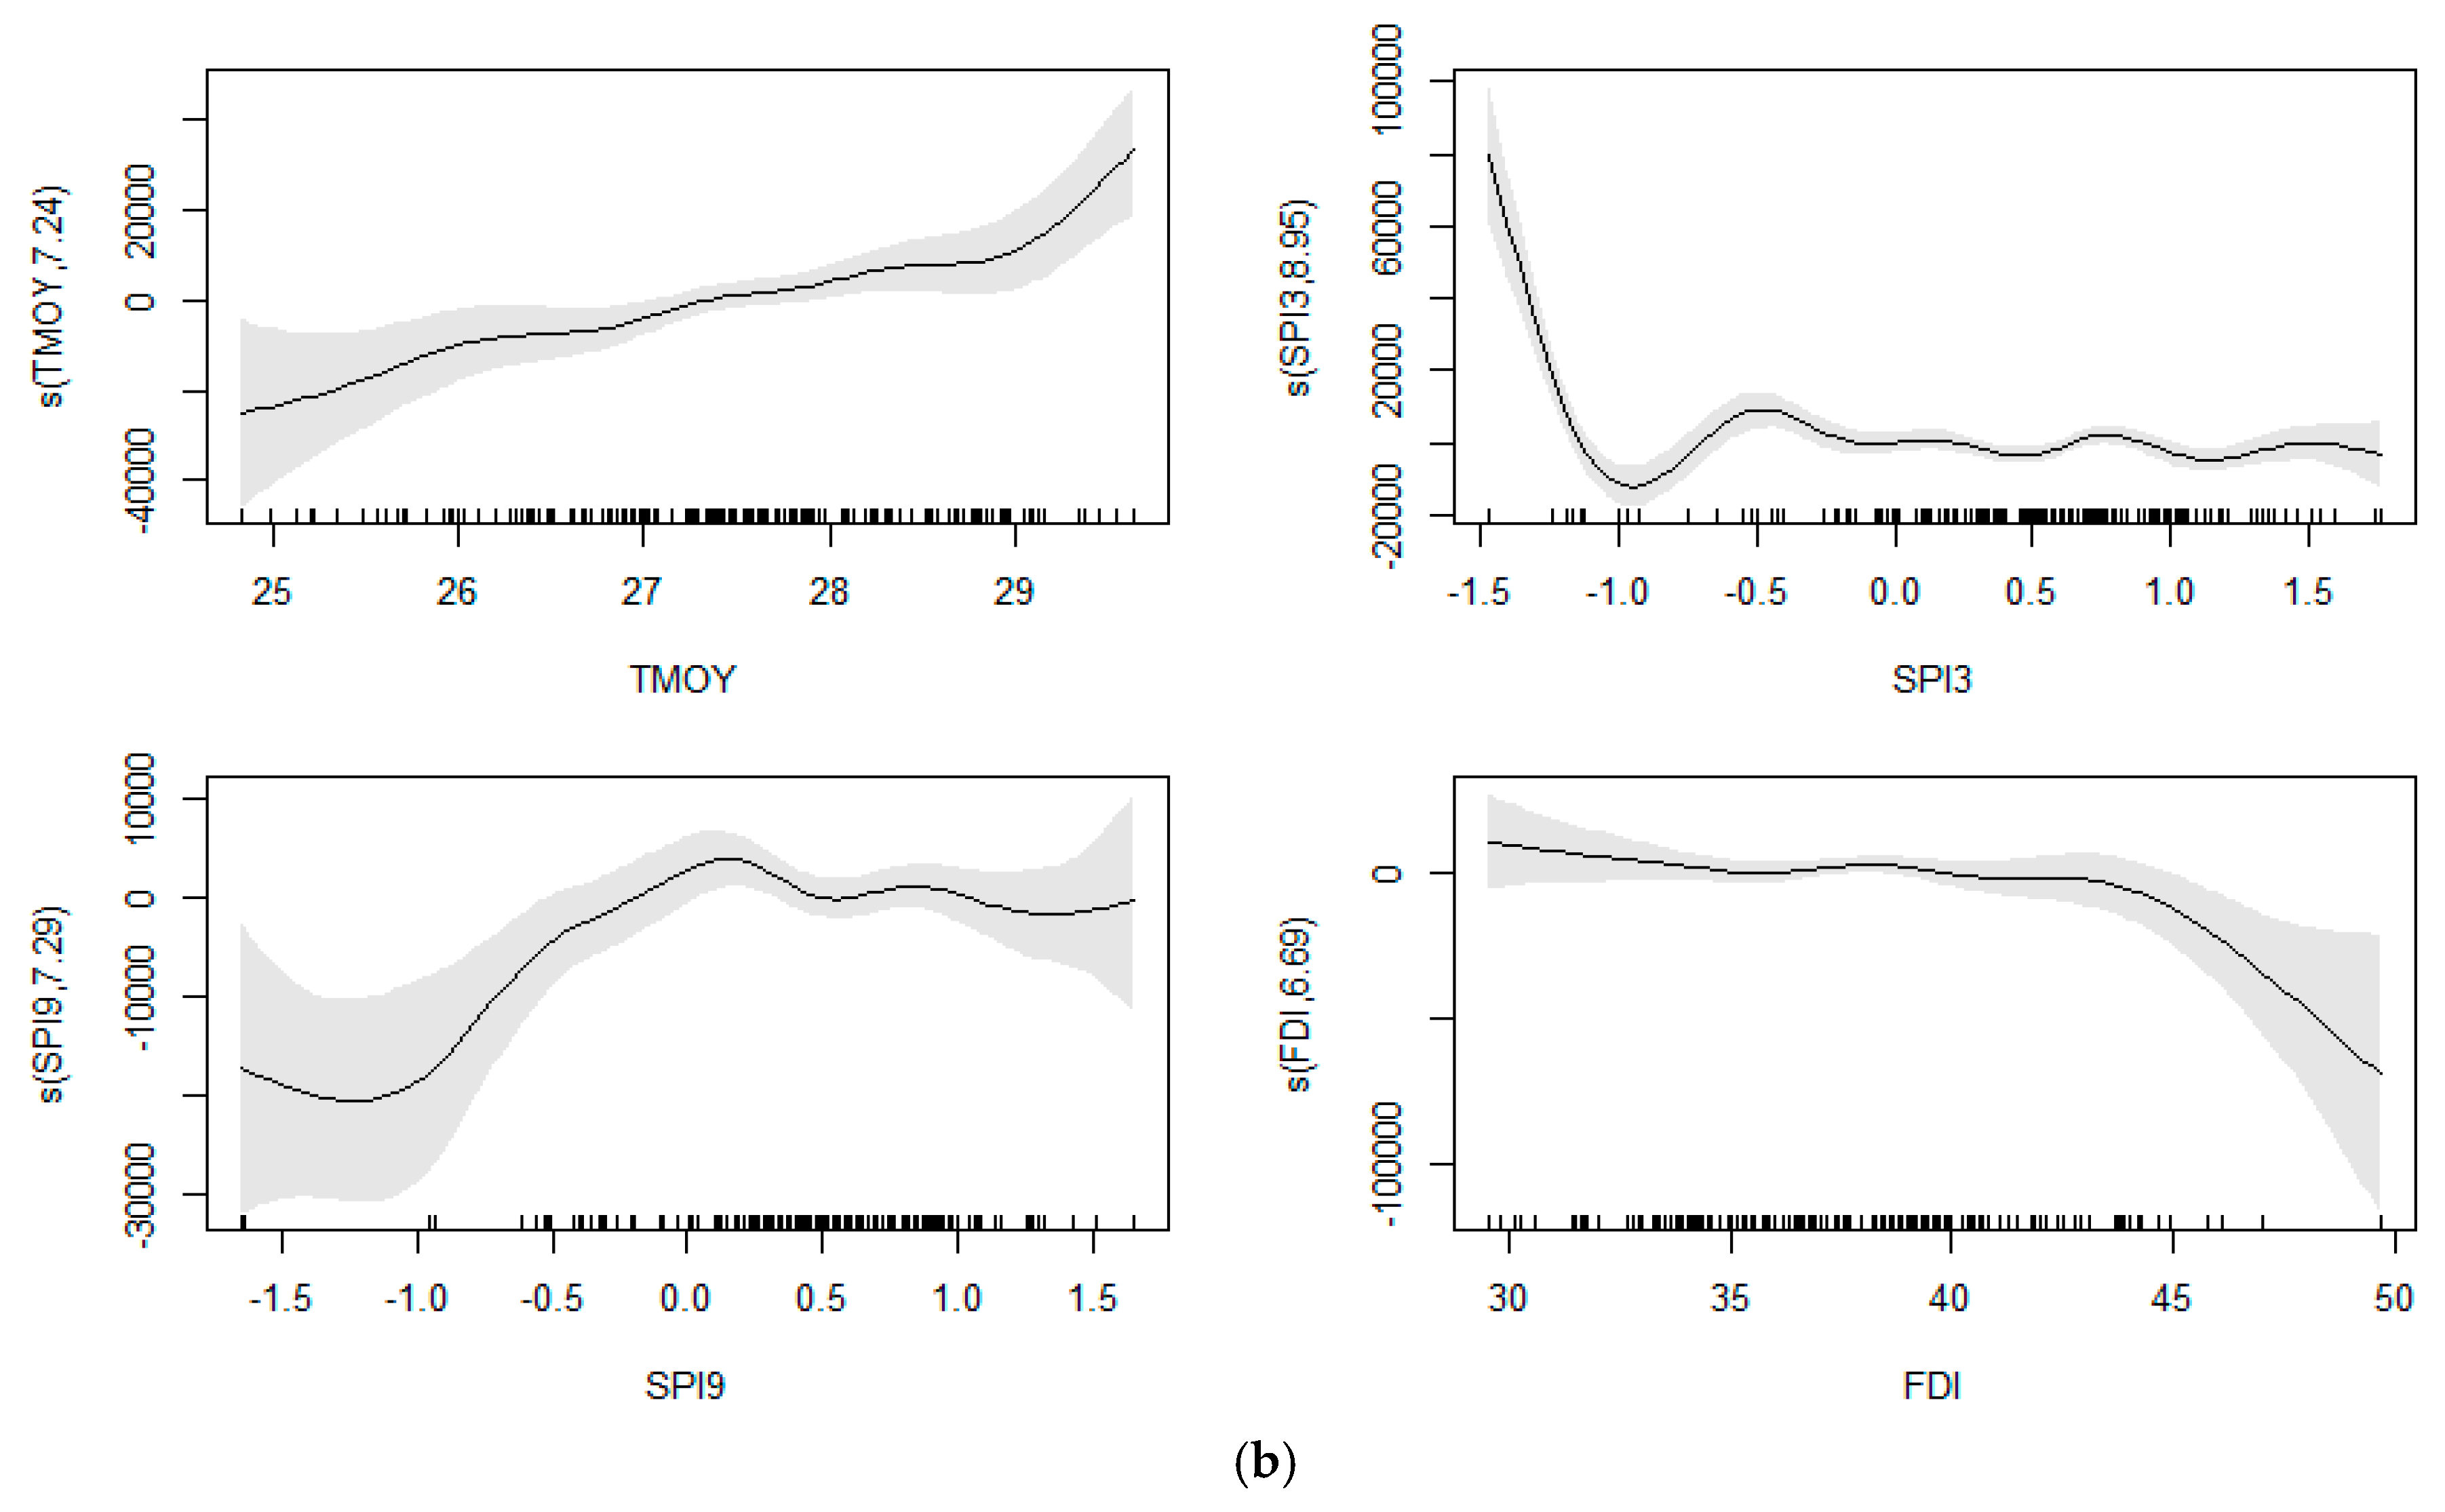
The relevant covariates were different according to ecoregions and wildfire variables. For instance, in the forest zone, different covariates were selected for models of NF and SB. For the number of wildfires, they included VDP, SPI6, SPI9, SPI12 and FDI. For the burned area, the relevant factors were TMOY, MIN, ET0, DEWP, VISIB, SPI3, SPI9 and FDI. The deviance explained for NF and SB was 84.7% and 84.2%, respectively. For this ecoregion, SPI6, SPI9 and SPI12 had relatively simple nonlinear relationships with the number of wildfires, whereas VDP and FDI had relatively complex nonlinear relationships with the number of wildfires (Figure 5a). By contrast, all the significant covariates had relatively simple nonlinear relationships with the burned areas (Figure 5b).
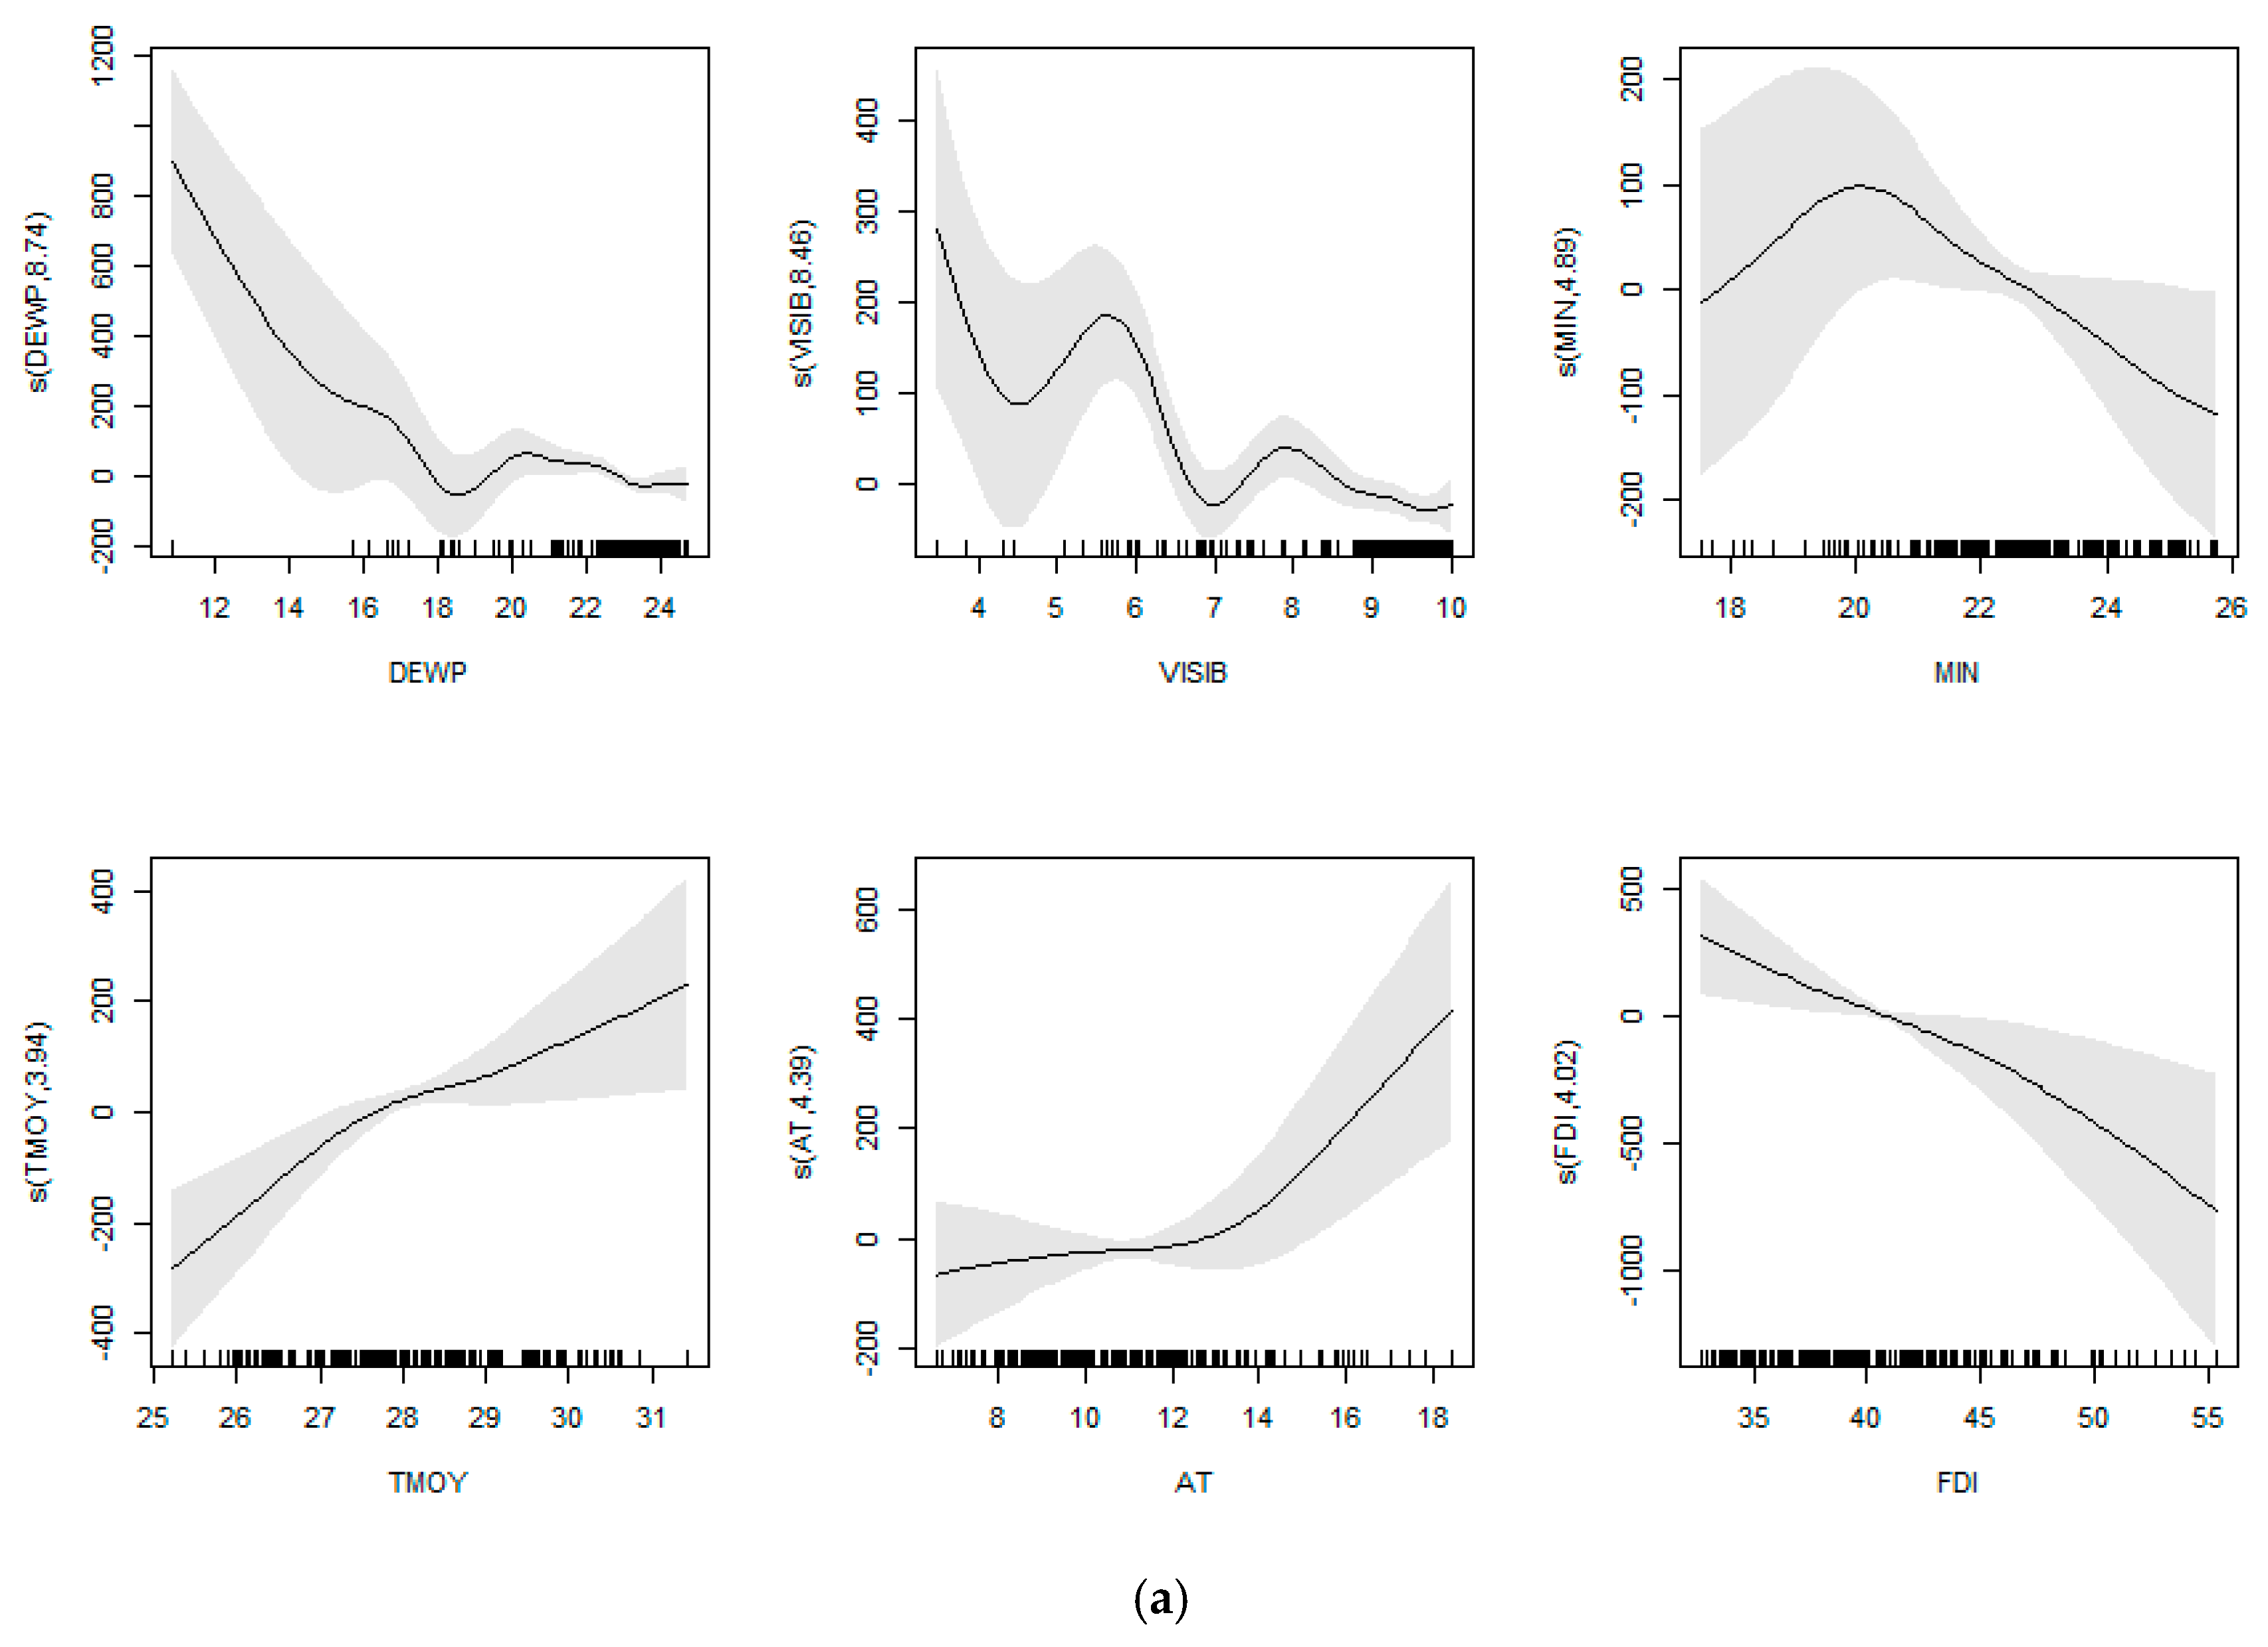
For the preforest zone, the predictors for both the number of wildfires and burned area included TMOY, MIN, AT, DEWP, VISIB and FDI. The deviance explained by the model for NF and SB was 89.7% and 89.3%, respectively. In this area, MIN, TMOY, AT and FDI had relatively simple nonlinear relationships with the number of wildfires and burned areas, whereas DEW and VISIB had relatively complex nonlinear relationships for both the number of wildfires and burned areas (Figure 6a,b).
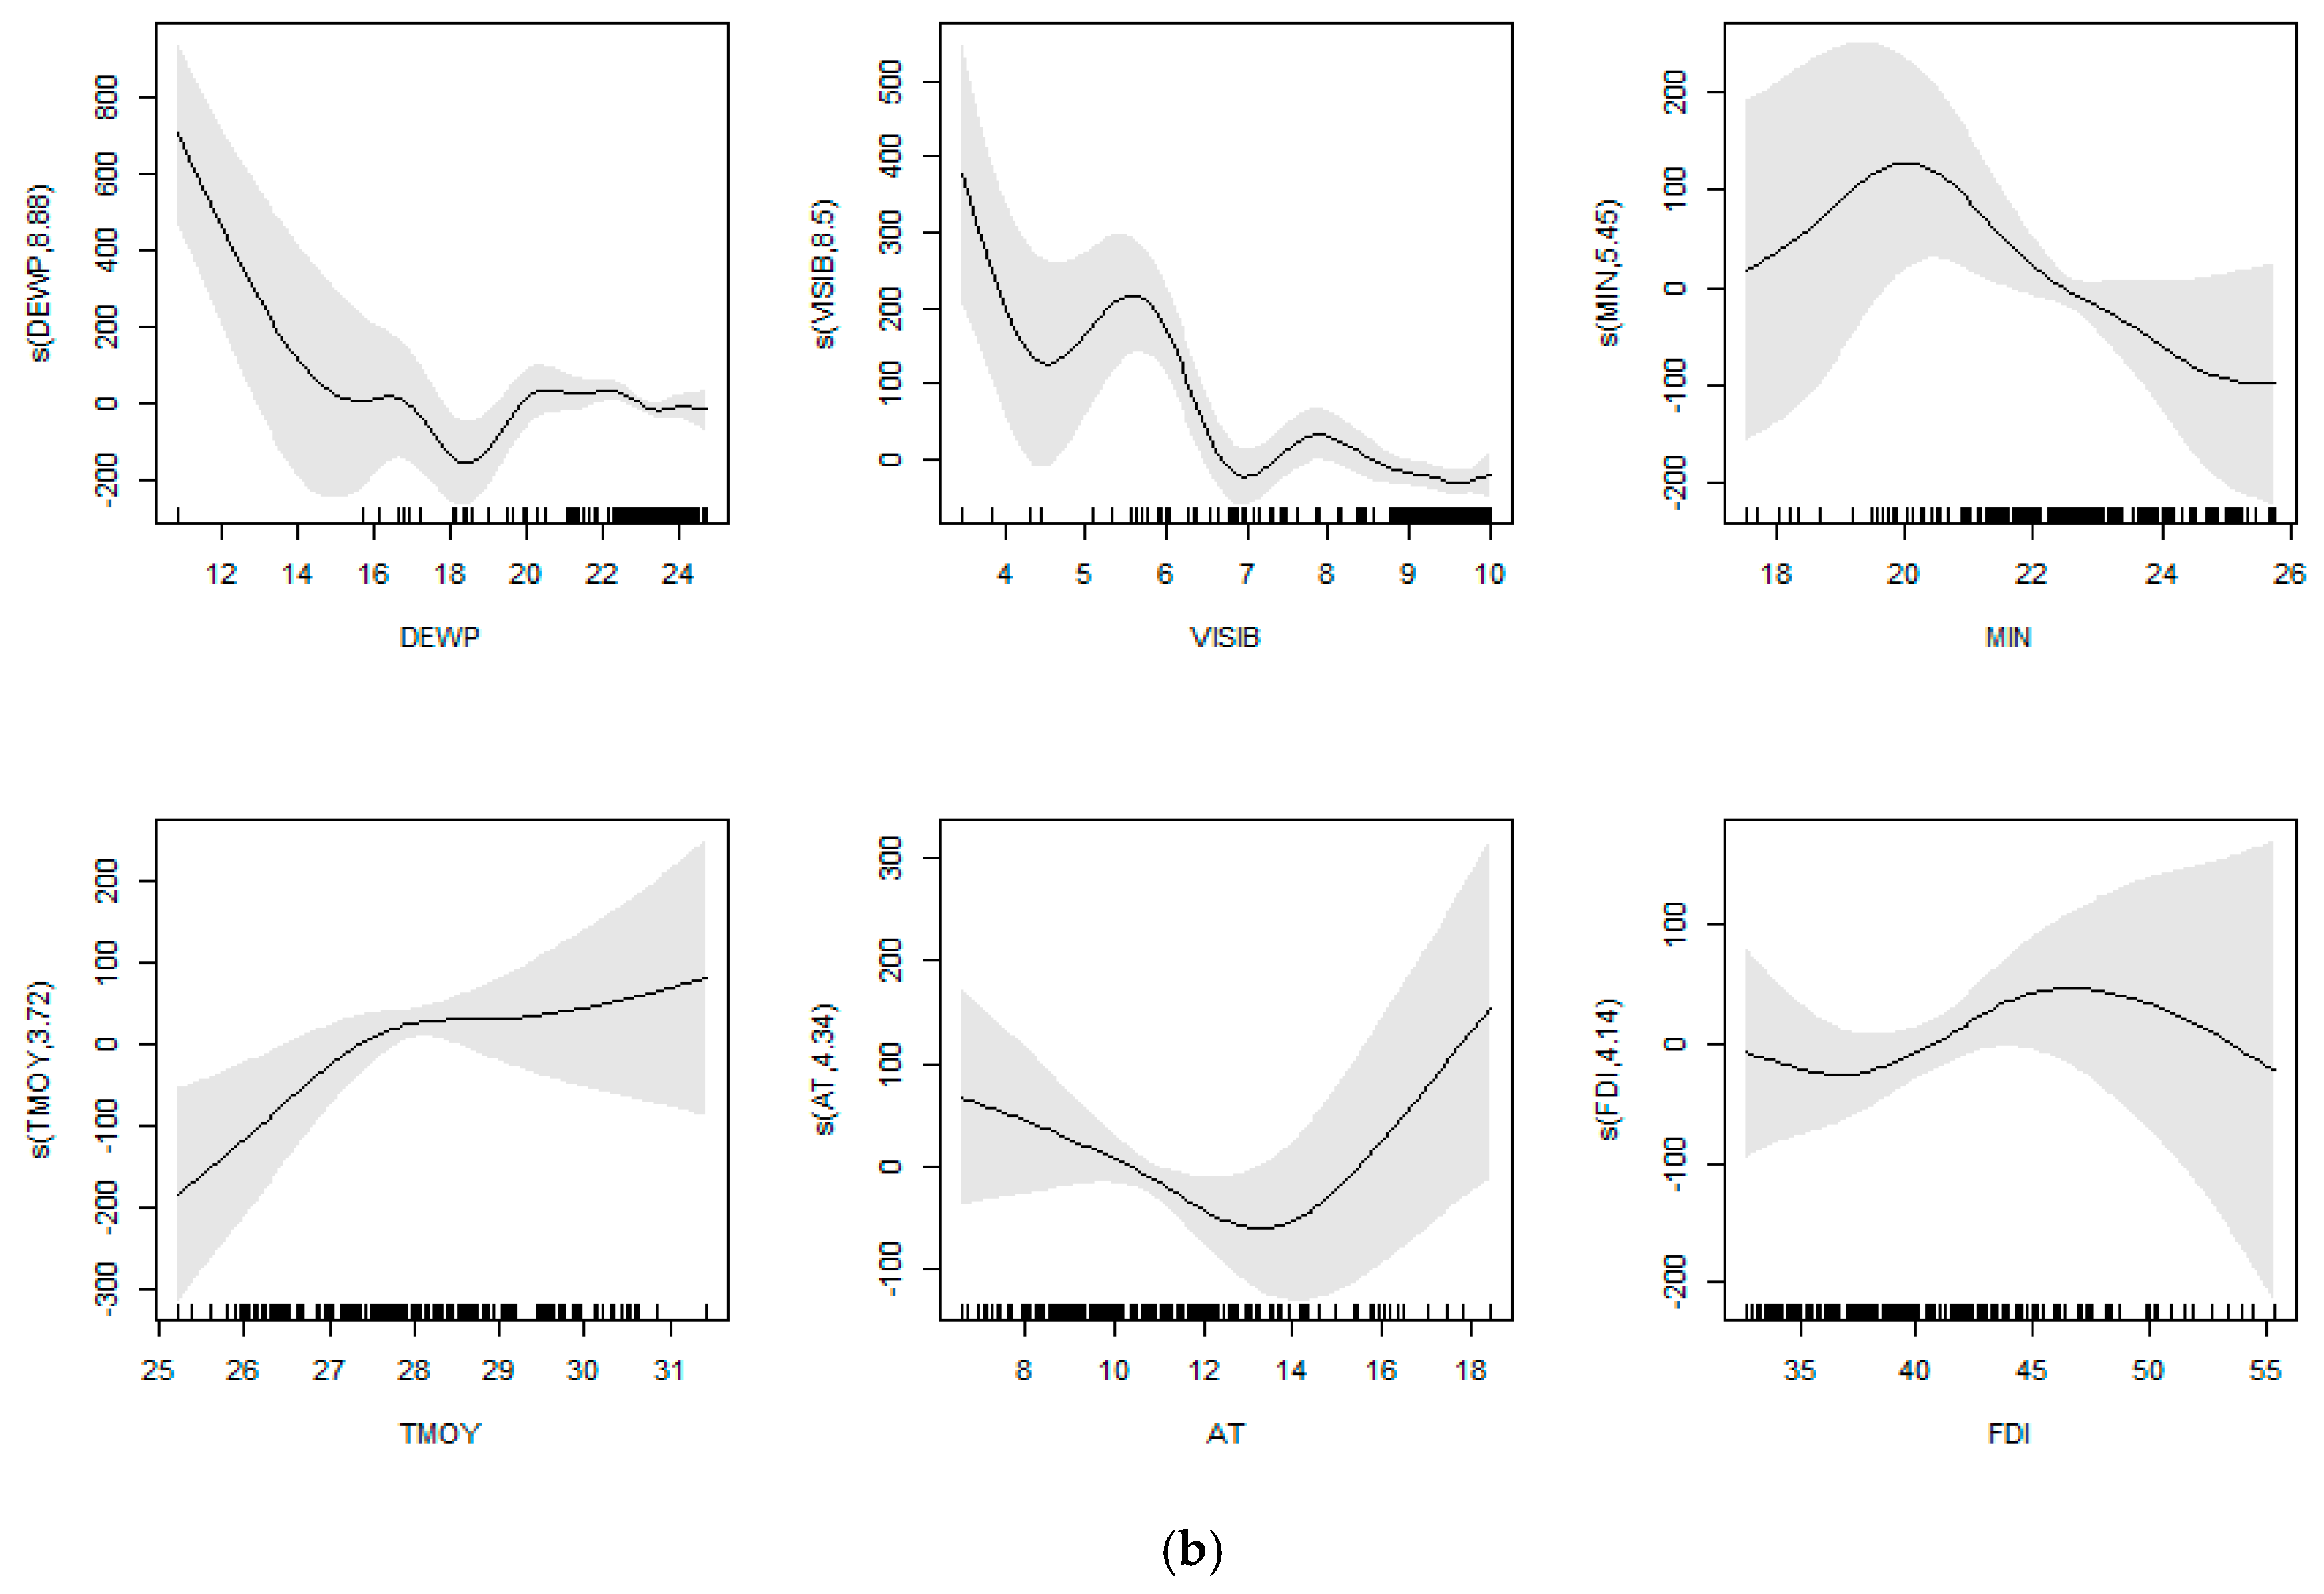
In the Sudanian zone, the deviance explained by the models for NF and SB was, respectively, 99.8% and 99.7%. In this area, the key covariates for NF included MIN, VISIB, SPI1, and FDI, while those for SB were AT, MXSPD, VISIB, and FDI. In this zone, all the significant covariates had relatively simple nonlinear relationships with the number of wildfires (Figure 7a) and the burned areas (Figure 7b).
For each significant covariate, the smooth function could be classified into one, two or more rough regions depending to their tendency. A positive (negative) influence region could be followed by a negative (positive) influence region, and so on. For instance, the smooth function of SPI6 in the Forest zone (Figure 5a) could be classified into one rough positive influence region. This result suggested that SPI6 had strong positive impacts on the number of wildfires within the region. Compared to SPI6, VDP showed a more complex smooth function, which changed directions multiple times (Figure 5a). VDP lowered the number of wildfires in the ranges 0.3–0.8 (region 1) and 0.9–1.2 (region 3) but increased the number of wildfires in the ranges 0.8–0.9 (region 2) and 1.2–1.4 (region 4). However, only a small number of observations were found in regions 3 and 4 and their confidence intervals were relatively wide, suggesting that the direction of the influence of VDP on the number of wildfires might not be highly significant.
4. Discussion
In this study, we used MODIS-derived data to investigate the active wildfires and burned area in the N’Zi River Watershed. The MODIS instruments that are onboard NASA EOS satellite platforms observe the watershed four times per day at approximately 01:30, 10:30, 13:30, and 22:30 local time. It is therefore important to keep in mind that the number of active wildfires detected in this study is only the result of observations made during the four satellite overpasses and only takes into consideration those wildfires that occurred in such conditions that MODIS was able to detect. In fact, wildfires burning outside the overpass times were not detected by MODIS and are therefore not included in the results of this study, just like those that occurred when the sky was covered by clouds or by thick smoke, and those that were masked by a canopy of trees [35,53,54]. The several overpasses of the satellites may cause a double counting of actives wildfires. Indeed, a single wildfire can spread over the landscape and burn for several hours or days and be detected by both satellites during their passage [55]. The shortage of burned area for some months under wildfires could be explained by the over-resolution of the satellite, which is approximately 23.5 ha. Wildfires with an area less than this value are not captured by the satellite. Of course, the spatial resolution of the MODIS burned area MCD64A1 is estimated at 500 m. This may overestimate or underestimate the extent of area burned. Wildfire omission errors occur when spatial extension is insufficient or highly fragmented to be discriminated as wildfires [56]; or those hidden by cloud cover and satellite observations [54].
Several studies on wildfire occurrence in sub-Saharan Africa, especially in West Africa, showed that fire activity has increased during the last decades [53,57]. Our study showed different results for the N’Zi River Watershed, underlining an opposite trend for wildfire occurrence. Similar results have been found in West Africa, identifying decreasing trends in both number of wildfires and burnt areas during recent decades [58,59]. Andela et al. [60] showed a significant decreasing trend in the number of fires, size of fires and burnt area in Africa in the period 2003‒2015 using MODIS fire data. Declining fire activity supports climate mitigation efforts in the region.
Our study has also showed that the preforest zone was the most impacted in terms of number of wildfires and burned area. This could be explained by the land use and fire-based hunting practices adopted in this area. These observations have been observed by Etienne [61] and Bruzon [62], who observed the use of wildfires for hunting at the beginning or at the end of the dry season. Also, the vegetation composition in this area may have importance in fire dynamics. The vegetation type is a factor that greatly influences the spread of fire by affecting the fuel load and combustion [63]. Fire occurrence analysis showed that fire frequency and intensity were thus related mainly to the herbaceous layer continuity and phytomass. Fire density peaks in December‒January; however, fire seasonality depends on vegetation hygrophily: late and very late wildfires burn more intensively (because the vegetative has low moisture content) and tend to be more damaging compared to early wildfires, in accordance with previous observations of Nielsen and Rasmussen [64] and Govender et al. [65]. The low number of wildfires after March was due to the fact that vegetation is regenerating with the first rains and evapotranspiration at this time is low [66].
Due to the high impact of agriculture in the south of the area studied (forest zone), the area burnt annually is relatively limited compared to the other ecoregions. In this area, several cash crops including cocoa and coffee are grown, and peasants are aware of the impact of fire in the dry season.
The number of wildfires increased from 2002 to 2008 in the study area. These observations could be explained by the fact that the sociopolitical crisis experienced by Côte d’Ivoire from 2002 to 2010 has weakened the forest administration, which has led to a relaxation of awareness and policy to combat wildfires at the local level. These observations are close to those of Kull [67], who noted that political instability led to unusual practices in the use of wildfires (protests, land disputes, etc.) that may contribute to increasing fire damage in Madagascar. Also, this situation may be explained by increasing population pressure, which may have led to more wildfires being laid for poaching, converting savannas into agricultural lands and clearing fields [65].
Concerning the analysis of the relationships between climate and fire occurrence, we showed that both the number of wildfires and the burned area were inversely correlated with relative humidity and thermal amplitude, and positively correlated with Lowveld FDI and maximal temperature. This could be explained by the fact that the high variability in temperature may increase fuel load, as suggested by Govender et al. [65]. Also, with a lower relative humidity, fires will start and burn more vigorously due to the lower moisture of the fuel. Similar results have been shown by Guiguindibaye et al. [66], who observed that wildfire intensity is inversely correlated to relative humidity in Tanzania. Holsten et al. [68] also revealed that relative humidity was the best proxy for fire occurrence in Germany. Relative humidity has an important impact on wildfires. Long days of low humidity in a month tend to dry out all forest fuels to a dangerous level. Even a few days of low humidity can increase the risks of wildfires [69]. While the Lowveld FDI is not a proxy for fire activity, it does indicate the potential for uncontrollable fires should ignition occur and thus may provide insight into how changes in the microclimate may influence fire activity [25]. Archibald et al. [70] examined the drivers of burnt area in Southern Africa and indicated that the tree cover percentage, rainfall, dry season length, and grazing density are the most important determinants of burned areas in this region.
In this study, we used GAMs to evaluate wildfire activity and explore the effects of climatic factors at ecoregion level. The effects of climate variables including weather and drought and fire danger indices on wildfire activity (number of wildfires and burned areas) in this study showed nonlinear relationships with the number of wildfires and burned areas, even changing from negative to positive relationships in some cases. The nonlinear effects of climate variables in this study indicate that their influences on wildfire activity are not constant but, rather, vary significantly in terms of the direction and degree of their influences. For example, the influences on the number of wildfires in the whole watershed differed from those at different locations at the same fire site. Therefore, the influences of climate variables on the number of wildfires should not be over-generalized to different studies performed at different geographic locations and other fire sites. The non-linear impacts of climate variables have been reported in several other studies (e.g., [71,72,73]).
However, we were unable to find many studies on the nonlinear effects of susceptible climate variables on fire activity in Africa. Krawchuk et al. [74] examined world fire occurrence in relation to climate variables, and showed that mean temperature of warmest month, annual precipitation, and mean temperature of wettest month are the most important explanatory variables [72].
In this study, we showed that in the whole watershed DEWP (edf = 6.459), WDSP (edf = 5.587), SPI6 (edf = 4.044) and SPI (edf = 3.889) showed stronger nonlinear patterns, while SPI3 (edf = 2.018) and AT (edf = 1.780) exhibited a weaker nonlinear pattern, which explained about 80.1% of the number of wildfires. Comparatively, we observed that DEWP (edf = 7.175) exhibited stronger nonlinear patterns, whereas AT (edf = 2.098) and VISIB (edf = 1.208) showed a weaker nonlinear pattern that explained 81.3% of burned areas. These results were consistent with the findings of Ríos-Pena et al. [73,75], who reported nonlinear distributions. The relatively high deviance could be improved for wildfire activity prediction. The inclusion of different environmental and biophysical covariates might improve the GAM results. For instance, fire activity is most strongly influenced by climate, topography [76], vegetation type and population density [59]. It is therefore important to collect data on potentially influential covariates.
5. Conclusions
The current study investigated the relationship between fire occurrence (number of wildfires and burned area) and weather conditions during the last two decades (2001–2016).
The first main conclusion of this study was that fire occurrence in the N’Zi River Watershed had a downward trend, and the dynamic was different in the ecoregions. The preforest zone was the most impacted by fire in this area. The second conclusion was that weather conditions, coupled with drought and fire danger indices, strongly influence the fire occurrence in the area. The Lowveld fire danger index is the most significant variable to be monitored in fire management. As a powerful and scientific predictive modelling tool to discover the hidden pattern of predictors and improve predictive performance, the generalized additive model (GAM) was used to investigate quantitative relationships between climatic variables and fire activity. Our models have explained up to 80% of the deviance of fire occurrence in the studied area.
In subsequent studies, the current work will serve as baseline information for preparing an appropriate fire danger index for the region, predicting the magnitude of fire occurrence in the NRW under future climatic scenarios, and evaluating its potential impacts on forest fire emissions.
Author Contributions
Data curation, J.-L.K.K; Methodology, J.-L.K.K; Supervision, N.E.W. and C.M.; Writing—original draft, J.-L.K.K; Writing—review & editing, J.-L.K.K, N.E.W. and C.M.
Acknowledgments
We acknowledge the use of data and imagery from LANCE FIRMS operated by the NASA/GSFC/Earth Science Data and Information System (ESDIS) with funding provided by NASA/HQ. Also, we acknowledge with gratitude the useful contributions of the two anonymous reviewers and the Assistant Editor of this review paper.
Conflicts of Interest
The authors declare no conflict of interest.
References
- Goldammer, J.G.; De Ronde, C. Wildland Fire Management Handbook for Sub-Saharan Africa; Goldammer, J.G., de Ronde, C., Eds.; Global Fire Monitoring Center: Freiburg, Germany, 2004. [Google Scholar]
- Food Agriculture Organization (FAO). Fire Management Global Assessment 2006; FAO: Rome, Italy, 2007. [Google Scholar]
- Bakirci, M. Negative impacts of forest fires on ecological balance and environmental sustainability: Case of Turkey. J. Geogr. 2010, 5, 15–32. [Google Scholar]
- Dennis, R.A.; Mayer, J.; Applegate, G.; Chokkalingam, U.; Colfer, C.J.P.; Kurniawan, I.; Lachowski, H.; Maus, P.; Permana, R.P.; Ruchiat, Y.; et al. Fire, people and pixels: linking social science and remote sensing to understand underlying causes and impacts of fires in Indonesia. Hum. Ecol. 2005, 33, 465–504. [Google Scholar] [CrossRef]
- Hirschberger, P. Forests Ablaze: Causes and Effects of Global Forest Fires; Winter, S., von Laer, Y., Köberich, T., Eds.; WWF Deutschland: Berlin, Germany, 2016. [Google Scholar]
- Jolly, W.M.; Cochrane, M.A.; Freeborn, P.H.; Holden, Z.A.; Brown, T.J.; Williamson, G.J.; Bowman, D.M.J.S. Climate-induced variations in global wildfire danger from 1979 to 2013. Nat. Commun. 2015, 6, 7537. [Google Scholar] [CrossRef] [PubMed] [Green Version]
- Laris, P. Integrating Land Change Science and Savanna Fire Models in West Africa. Land 2013, 2, 609–636. [Google Scholar] [CrossRef] [Green Version]
- GIEC. Changements Climatiques 2014: Rapport de Synthèse; Contribution des Groupes de Travail I, II et III au cinquième Rapport D’évaluation du Groupe D’experts Intergouvernemental sur L’évolution du Climat; Pachauri, R.K., Meyer, L.A., Eds.; GIEC: Genève, Switzerland, 2014. [Google Scholar]
- Paudel, B.; Acharya, B.S.; Ghimire, R.; Dahal, K.R.; Bista, P. Adapting agriculture to climate change and variability in Chitwan: Long-term trends and farmers’ perceptions. Agric. Res. 2014, 3, 165–174. [Google Scholar] [CrossRef]
- Mertz, O.; Halsnæs, K.; Olesen, J.E.; Rasmussen, K. Adaptation to climate change in developing countries. Environ. Manag. 2009, 43, 743–752. [Google Scholar] [CrossRef] [PubMed] [Green Version]
- Tanner, T.; Mitchell, T. Entrenchment or enhancement: Could climate change adaptation help reduce poverty? Development 2008, 39, 6–15. [Google Scholar] [CrossRef] [Green Version]
- Kull, C.A.; Laris, P. Fire ecology and fire politics in Mali and Madagascar. In Tropical Fire Ecology: Climate Change, Land Use and Ecosystem Dynamics; Springer: Berlin/Heidelberg, Germany, 2009; pp. 171–226. [Google Scholar] [CrossRef]
- Shlisky, A.; Alencar, A.; Nolasco, M.M.; Curran, L. Overview: Global fire regime conditions, threats, and opportunities for fire management in the tropics. In Tropical Fire Ecology; Springer: Berlin/Heidelberg, Germany, 2009; pp. 65–83. [Google Scholar]
- Mbow, C.; Nielsen, T.T.; Rasmussen, K. Savanna fires in east-central Senegal: Distribution patterns, resource management and perceptions. Hum. Ecol. 2000, 28, 561–583. [Google Scholar] [CrossRef]
- Levine, J.S. Biomass Burning and the Production of Greenhouse Gases. In Climate Biosphere Interaction: Biogenic Emissions and Environmental Effects of Climate Change; Zepp, R.G., Ed.; John Wiley and Sons: New York, NY, USA, 1994; pp. 139–160. [Google Scholar]
- Loehman, R.A.; Reinhardt, E.; Riley, K.L. Wildland fire emissions, carbon, and climate: Seeing the forest and the trees—A cross-scale assessment of wildfire and carbon dynamics in fire-prone, forested ecosystems. For. Ecol. Manag. 2014, 317, 9–19. [Google Scholar] [CrossRef]
- Etc Terra; RONGEAD; BNETD. Analyse Qualitative des Facteurs de Déforestation et de Dégradation des Forêts en Côte d’Ivoire; MINEDD: Abidjan, Côte d’Ivoire, 2016. [Google Scholar]
- Bigot, S. Variabilité Climatique, Interactions et Modifications Environnementales: L’exemple de la Côte d’Ivoire; Université des Sciences et Technologies de Lille: Lille, France, 2005. [Google Scholar]
- MINEF. Campagne Nationale de Lutte Contre les fEux de Brousse Edition 2016–2017. Available online: http://www.eauxetforets.gouv.ci/index.php/le-minef/actualites/a-la-une/514-campagne-nationale-de-lutte-contre-les-feux-de-brousse-edition-2016-2017 (accessed on 14 June 2017).
- N’Guessan, J.A.; Yoboue, K.B.; N’Daoule, R. La variabilité pluviométrique et ses impacts sur l’alimentation en eau des milieux ruraux du département de Dimbokro (Centre-Est de la Côte d’Ivoire). Eur. Sci. J. 2015, 11, 36–57. [Google Scholar]
- Brou, Y.T. Impacts des modifications bioclimatiques et de l’amenuisement des terres forestières dans les paysanneries ivoiriennes: Quelles solutions pour une agriculture durable en Côte d’Ivoire. Cuad. Geogr. 2009, 45, 13–29. [Google Scholar]
- Bigot, S.; Brou, T.Y.; Oszwald, J.; Diedhiou, A. Facteurs de la variabilité pluviométrique en Côte d’Ivoire et relations avec certaines modifications environnementales. Sécheresse 2005, 16, 5–13. [Google Scholar]
- Kouassi, A.M.; Kouamé, K.F.; Koffi, Y.B.; Dje, K.B.; Paturel, J.E.; Oulare, S. Analyse de la Variabilité Climatique et de ses Influences sur les Régimes Pluviométriques Saisonniers en Afrique de L’ouest: Cas du Bassin Versant du N’zi (Bandama) en Côte d’Ivoire. Available online: http://cybergeo.revues.org/23388 (accessed on 1 April 2017).
- Yao, T.B.; Akindès, F.; Bigot, S. La variabilité climatique en Côte d’Ivoire: Entre perceptions sociales et réponses agricoles. Cah. Agric. 2005, 14, 533–540. [Google Scholar] [CrossRef]
- Strydom, S.; Savage, M.J. Potential impacts of climate change on wildfire dynamics in the midlands of KwaZulu-Natal, South Africa. Clim. Chang. 2017, 143, 385–397. [Google Scholar] [CrossRef]
- Eldin, M. Le climat. In Le Milieu Naturel de la Côte d’Ivoire; Avenard, J.-M., Eldin, M., Girard, G., Touchebeuf, P., Guillaumet, J.-L., Adjanohoun, E., Perraud, A., Eds.; ORSTOM: Paris, France, 1971; pp. 73–108. [Google Scholar]
- Goula, B.T.A.; Savané, I.; Fadika, V.; Konan, B.; Kouadio, G.B. Impact de la variabilité climatique sur les ressources hydriques des bassins du N’Zo et N’Zi en Côte d’Ivoire (Afrique Tropicale Humide). VertigO 2006, 7, 1–12. [Google Scholar] [CrossRef]
- National Centers for Environmental Information. Global Surface Summary of the Day—GSOD. Available online: https://data.noaa.gov/dataset/dataset/global-surface-summary-of-the-day-gsod (accessed on 4 January 2017).
- Ångström, A. Swedish meteorological research 1939–1948. Tellus 1949, 1, 60–64. [Google Scholar] [CrossRef]
- Harrison, D.C. Improving Integrated Wildfire Management in the Fynbos Biome of South Africa Using Information on Synoptic-Scale Atmospheric Features That Promote Wildfires. Ph.D. Thesis, University of Cape Town, Cape Town, South Africa, 2015. [Google Scholar]
- McKee, T.B.; Doesken, N.J.; Kleist, J. The relationship of drought frequency and duration to time scales. In Proceedings of the 8th Conference on Applied Climatology, Anaheim, CA, USA, 17–22 January 1993. [Google Scholar]
- Giglio, L.; Schroeder, W.; Justice, C.O. The collection 6 MODIS active fire detection algorithm and fire products. Remote Sens. Environ. 2016, 178, 31–41. [Google Scholar] [CrossRef] [PubMed]
- Schroeder, W.; Oliva, P.; Giglio, L.; Csiszar, I.A. The New VIIRS 375m active fire detection data product: Algorithm description and initial assessment. Remote Sens. Environ. 2014, 143, 85–96. [Google Scholar] [CrossRef]
- Giglio, L.; Boschetti, L.; Roy, D.; Hoffmann, A.A.; Humber, M. Collection 6 MODIS Burned Area Product User’s Guide—Version 1.0; NASA EOSDIS Land Processes DAAC: Sioux Falls, SD, USA, 2016.
- Kaufman, Y.J.; Justice, C.O.; Flynn, L.P.; Kendall, J.D.; Prins, E.M.; Giglio, L.; Ward, D.E.; Menzel, W.P.; Setzer, A.W. Potential global fire monitoring from EOS-MODIS. J. Geophys. Res. Atmos. 1998, 103, 32215–32238. [Google Scholar] [CrossRef] [Green Version]
- LANCE FIRMS. Collection 6 NRT Hotspot/Active Fire Detections MCD14DL. Available online: https://earthdata.nasa.gov/firms (accessed on 21 June 2017).
- LANCE FIRMS. NRT VIIRS 375 m Active Fire product VNP14IMGT. Available online: https://earthdata.nasa.gov/firms (accessed on 21 June 2017).
- Giglio, L.; Justice, C.; Boschetti, L.; Roy, D. MCD64A1 MODIS/Terra + Aqua Burned Area Monthly L3 Global 500m SIN Grid V006; NASA EOSDIS Land Processes DAAC: Sioux Falls, SD, USA, 2015.
- Pohlert, T. Non-Parametric Trend Tests and Change-Point Detection. Available online: https://cran.r-project.org/web/packages/trend/vignettes/trend.pdf (accessed on 30 July 2018).
- Mann, H.B. Nonparametric tests against trend. Econometrica 1945, 13, 245. [Google Scholar] [CrossRef]
- Kendall, M. Rank Correlation Methods, 4th ed.; Charles Griffin: London, UK, 1970. [Google Scholar]
- Hirsch, R.M.; Slack, J.R. A Nonparametric Trend test for seasonal data with serial dependence. Water Resour. Res. 1984, 20, 727–732. [Google Scholar] [CrossRef]
- Roy, D.P.; Boschetti, L.; Justice, C.O.; Ju, J. The collection 5 MODIS burned area product—Global evaluation by comparison with the MODIS active fire product. Remote Sens. Environ. 2008, 112, 3690–3707. [Google Scholar] [CrossRef]
- Millard, S.P. EnvStats: An R Package for Environmental Statistics; Springer: New York, NY, USA, 2013. [Google Scholar]
- R Core Team. R: A Language and Environment for Statistical Computing; R: The R Foundation: Vienna, Austria, 2017. [Google Scholar]
- Wood, S.N. Mgcv: GAMs and generalized ridge regression for R. R News 2001, 1, 20–25. [Google Scholar]
- Wood, S.N. Fast stable restricted maximum likelihood and marginal likelihood estimation of semiparametric generalized linear models. J. R. Stat. Soc. Ser. B Stat. Methodol. 2011, 73, 3–36. [Google Scholar] [CrossRef] [Green Version]
- Wood, S.N. Generalized Additive Models: An Introduction with R, 2nd ed.; Chapman & Hall/CRC: Boca Raton, FL, USA, 2017. [Google Scholar]
- Hastie, T.; Tibshirani, R. Generalized Additive Models. Stat. Sci. 1986, 1, 297–310. [Google Scholar] [CrossRef] [Green Version]
- James, G.; Witten, D.; Hastie, T. An Introduction to Statistical Learning: With Applications in R; Springer Science + Business Media: New York, NY, USA, 2014. [Google Scholar]
- Lukacs, P.M.; Burnham, K.P.; Anderson, D.R. Model selection bias and Freedman’s paradox. Ann. Inst. Stat. Math. 2010, 62, 117–125. [Google Scholar] [CrossRef]
- Maindonald, J. Gamclass: Functions and Data for a Course on Modern Regression and Classification. 2018. Available online: https://cran.r-project.org/package=gamclass (accessed on 10 August 2018).
- Yao, N. Mapping Bushfire Distribution and Burn Severity in West Africa Using Remote Sensing Observations. Ph.D. Thesis, University of Würzburg, Würzburg, Germany, 2010. [Google Scholar]
- Giglio, L.; Loboda, T.; Roy, D.P.; Quayle, B.; Justice, C.O. An active-fire based burned area mapping algorithm for the MODIS sensor. Remote Sens. Environ. 2009, 113, 408–420. [Google Scholar] [CrossRef]
- Oliveras, I.; Anderson, L.O.; Malhi, Y. Application of remote sensing to understanding fire regimes and biomass burning emissions of the tropical Andes. Glob. Biogeochem. Cycles 2014, 28, 480–496. [Google Scholar] [CrossRef] [Green Version]
- Roy, D.P.; Jin, Y.; Lewis, P.E.; Justice, C.O. Prototyping a global algorithm for systematic fire-affected area mapping using MODIS time series data. Remote Sens. Environ. 2005, 97, 137–162. [Google Scholar] [CrossRef]
- Kone, Z. Analyse de la Dynamique Spatio-Temporelle des Feux de Brousse et Leur Relation avec les Facteurs Climatiques dans la Zone Préforestière de la Côte d’Ivoire: Apport de l’Imagerie Satellitaire et des Systèmes d’Informations Géographiques; Mémoire de fin d’Études; Institut National Polytechnique Félix Houphouët-Boigny: Yamoussoukro, Côte d’Ivoire, 2014. [Google Scholar]
- N’Datchoh, E.T.; Konaré, A.; Diedhiou, A.; Diawara, A.; Quansah, E.; Assamoi, P. Effects of climate variability on savannah fire regimes in West Africa. Earth Syst. Dyn. 2015, 6, 161–174. [Google Scholar] [CrossRef]
- Dwomoh, F.; Wimberly, M. Fire Regimes and Their Drivers in the Upper Guinean Region of West Africa. Remote Sens. 2017, 9, 1117. [Google Scholar] [CrossRef]
- Andela, N.; Morton, D.C.; Giglio, L.; Chen, Y.; van der Werf, G.R.; Kasibhatla, P.S.; DeFries, R.S.; Collatz, G.J.; Hantson, S.; Kloster, S.; et al. A human-driven decline in global burned area. Science 2017, 356, 1356–1362. [Google Scholar] [CrossRef] [PubMed] [Green Version]
- Etienne, P. Le Fait Villageois Baoulé; ORSTOM: Abidjan, Côte d’Ivoire, 1971. [Google Scholar]
- Bruzon, Y. Les pratiques du feu en Afrique subhumide: exemples des milieux savanicoles de la Centrafrique et de la Côte d’Ivoire In Dynamique des Systèmes Agraires, France; Blanc-Pamard, C., Boutrais, J., Eds.; ORSTOM: Paris, France, 1994; pp. 147–162. [Google Scholar]
- Trollope, W.S.W.; de Ronde, C.; Geldenhuys, C.J. Fire behaviour In Wildland fire management: Handbook for Sub-Sahara Africa; Goldammer, J.G., de Ronde, C., Eds.; Global Fire Monitoring Center: Freiburg, Germany, 2004; pp. 27–59. [Google Scholar]
- Nielsen, T.T.; Rasmussen, K. Utilization of NOAA AVHRR for assessing the determinants of savanna fire distribution in Burkina Faso. Int. J. Wildl. Fire 2001, 10, 129–135. [Google Scholar] [CrossRef]
- Govender, N.; Trollope, W.S.W.; Van Wilgen, B.W. The effect of fire season, fire frequency, rainfall and management on fire intensity in savanna vegetation in South Africa. J. Appl. Ecol. 2006, 43, 748–758. [Google Scholar] [CrossRef] [Green Version]
- Guiguindibaye, M.; Belem, M.; Boussim, J. Caractéristiques des feux dans un incendie en savane soudanienne au Tchad. Int. J. Biol. Chem. Sci. 2013, 7, 1147. [Google Scholar] [CrossRef]
- Kull, C.A. Madagascar aflame: landscape burning as peasant protest, resistance, or a resource management tool? Polit. Geogr. 2002, 21, 927. [Google Scholar] [CrossRef]
- Holsten, A.; Dominik, A.R.; Costa, L.; Kropp, J.P. How well do meteorological indices explain forest fire ocurrence in Germany? In Proceedings of the EGU General Assembly, Vienna, Austria, 7–12 April 2013. [Google Scholar]
- Xiao, Y.; Zhang, X.; Ji, P. Modeling forest fire occurrences using count-data mixed models in qiannan autonomous prefecture of Guizhou province in China. PLoS. ONE 2015, 10, e0120621. [Google Scholar] [CrossRef] [PubMed]
- Archibald, S.; Roy, D.P.; Van Wilgen, B.W.; Scholes, R.J. What limits fire? An examination of drivers of burnt area in Southern Africa. Glob. Chang. Biol. 2009, 15, 613–630. [Google Scholar] [CrossRef] [Green Version]
- Sá, A.C.L.; Turkman, M.A.A.; Pereira, J.M.C. Exploring fire incidence in Portugal using generalized additive models for location, scale and shape (GAMLSS). Model. Earth Syst. Environ. 2018, 4, 199–220. [Google Scholar] [CrossRef]
- Pausas, J.G.; Ribeiro, E. The global fire-productivity relationship. Glob. Ecol. Biogeogr. 2013, 22, 728–736. [Google Scholar] [CrossRef] [Green Version]
- Ríos-Pena, L.; Kneib, T.; Cadarso-Suárez, C.; Klein, N.; Marey-Pérez, M. Studying the occurrence and burnt area of wildfires using zero-one-inflated structured additive beta regression. Environ. Model. Softw. 2018, 1–12. [Google Scholar] [CrossRef]
- Krawchuk, M.A.; Moritz, M.A.; Parisien, M.-A.; Van Dorn, J.; Hayhoe, K. Global Pyrogeography: the Current and Future Distribution of Wildfire. PLoS ONE 2009, 4, e5102. [Google Scholar] [CrossRef] [PubMed]
- Ríos-Pena, L.; Cadarso-Suárez, C.; Kneib, T.; Marey-Pérez, M. Applying binary structured additive regression (STAR) for predicting wildfire in Galicia, Spain. Procedia Environ. Sci. 2015, 27, 123–126. [Google Scholar] [CrossRef]
- Lee, H.-J.; Choi, Y.; Lee, S.-W. Complex Relationships of the Effects of Topographic Characteristics and Susceptible Tree Cover on Burn Severity. Sustainability 2018, 10, 295. [Google Scholar] [CrossRef]
Figure 1.
Map of N’Zi River Watershed, showing synoptic stations along with elevation.

Figure 2.
Monthly series of the total annual burned area (SB) and number of wildfires (NF) in the (a) forest zone, (b) preforest zone, (c) Sudanian zone and (d) the whole N’Zi River Watershed.
Figure 2.
Monthly series of the total annual burned area (SB) and number of wildfires (NF) in the (a) forest zone, (b) preforest zone, (c) Sudanian zone and (d) the whole N’Zi River Watershed.

Figure 3.
Annual series of the total annual burned area (SB) and number of wildfires (NF) in the (a) forest zone, (b) preforest zone, (c) Sudanian zone and (d) the whole N’Zi River Watershed.
Figure 3.
Annual series of the total annual burned area (SB) and number of wildfires (NF) in the (a) forest zone, (b) preforest zone, (c) Sudanian zone and (d) the whole N’Zi River Watershed.

Figure 4.
Spearman correlation matrix between wildfire variables and climatic variables in the (a) forest zone; (b) preforest zone; (c) Sudanian zone and (d) the whole N’Zi River Watershed. Significant positive correlations are displayed in blue, significant negative correlations in red and non-significant correlations are in blank (p > 0.05). The intensity of the colour is proportional to the correlation coefficients.


Figure 5.
Smoothed fits of covariates modelling (a) the number of wildfires and (b) the burned area in the Forest zone of the N’Zi River Watershed. Central (bold) line show the best fit and the shaded areas show the 95% confidence intervals of the model. Tick marks on the x-axis represent observations. The y-axis represents the spline function.


Figure 6.
Smoothed fits of covariates modelling (a) the number of wildfires and (b) the burned area in the Preforest zone of the N’Zi River Watershed. Central (bold) line show the best fit and the shaded areas show the 95% confidence intervals of the model. Tick marks on the x-axis represent observations. The y-axis represents the spline function.


Figure 7.
Smoothed fits of covariates modelling (a) the number of wildfires and (b) the burned area in the Sudanian zone of the N’Zi River Watershed. Central (bold) line show the best fit and the shaded areas show the 95% confidence intervals of the model. Tick marks on the x-axis represent observations. The y-axis represents the spline function.

Figure 8.
Smoothed fits of covariates modelling (a) the number of wildfires and (b) the burned area in the whole N’Zi River Watershed. Central (bold) line show the best fit and the shaded areas show the 95% confidence intervals of the model. Tick marks on the x-axis represent observations. The y-axis represents the spline function.


Table 1.
Selected meteorological variables, drought and fire danger indices.
| Type | Code | Signification | Unit |
|---|---|---|---|
| Meteorological variables | PRCP | Total precipitation | mm |
| TMOY | Mean temperature | °C | |
| MAX | Maximum temperature | °C | |
| MIN | Minimum temperature | °C | |
| AT | Thermal amplitude | °C | |
| ET0 | Reference evapotranspiration | mm | |
| WDSP | Wind speed | m/s | |
| MXSPD | Maximum wind speed | m/s | |
| RH | Relative humidity | % | |
| VDP | Vapour-pressure deficit | mbar | |
| SLP | Sea level pressure | mbar | |
| DEWP | Dewpoint | °C | |
| VISIB | Visibility | km | |
| Drought and fire danger indices | SPI1 | 1-month Standardized Precipitation Index | |
| SPI3 | 3-month Standardized Precipitation Index | ||
| SPI6 | 6-month Standardized Precipitation Index | ||
| SPI9 | 9-month Standardized Precipitation Index | ||
| SPI12 | 12-month Standardized Precipitation Index | ||
| AI | Angstrom Index | ||
| FDI | Lowveld Fire Danger Index |
Table 2.
Trend analysis of number of wildfires (NF) and burned areas (SB).
| Localization | Number of Wildfires | Burned Areas | ||||||
|---|---|---|---|---|---|---|---|---|
| Sen’s Slope | Test Z | p-Value | Sign. | Sen’s Slope | Test Z | p-Value | Sign. | |
| Forest zone | −0.3401 | −7.52 | 5.50 × 10⁻¹⁴ | *** | −0.1326 | −3.016 | 0.002564 | ** |
| Preforest zone | −0.2523 | −5.567 | 2.60 × 10⁻⁸ | *** | −0.0482 | −1.106 | 0.268964 | ns |
| Sudanian zone | −0.1639 | −3.697 | 0.000218 | *** | −0.0086 | −0.199 | 0.842119 | ns |
| N’Zi Watershed | −0.2631 | −5.611 | 2.01 × 10⁻⁸ | *** | −0.0807 | −1.796 | 0.0725 | ns |
Sign.: Significance; ns.: non-significant; **: p < 0.01; ***: p < 0.001.
Table 3.
Selected GAM-based models for the number of active wildfires (NF) per ecoregion.
| Parameter | Location | |||||||
|---|---|---|---|---|---|---|---|---|
| Forest Zone | Preforest Zone | Sudanian Zone | N’Zi River Watershed | |||||
| Family | Gaussian | Gaussian | Gaussian | Gaussian | ||||
| Link function | Identity | Identity | Identity | Identity | ||||
| Adjusted R2 | 0.814 | 0.874 | 0.995 | 0.772 | ||||
| Deviance explained (%) | 84.7 | 89.7 | 99.8 | 80.1 | ||||
| GCV score | 315.64 | 2181.7 | 10.249 | 9491.8 | ||||
| AIC | 1336.409 | 2004.422 | 201.9355 | 2277.71 | ||||
| Covariates | edf | p-Value | edf | p-Value | edf | p-Value | edf | p-Value |
| PRCP | - | - | - | - | - | - | - | - |
| TMOY | - | - | 3.936 | 4.66 × 10⁻⁵ | - | - | - | - |
| MAX | - | - | - | - | - | - | - | - |
| MIN | - | - | 4.894 | 0.040997 | 9.000 | 4.29 × 10⁻⁹ | - | - |
| AT | - | - | 4.394 | 0.000145 | - | - | 1.780 | 5.44 × 10⁻¹⁴ |
| ET0 | - | - | - | - | - | - | - | - |
| WDSP | - | - | - | - | - | - | 5.587 | 0.0028282 |
| MXSPD | - | - | - | - | - | - | - | - |
| RH | - | - | - | - | - | - | - | - |
| VDP | 7.771 | 2.24 × 10⁻⁷ | - | - | - | - | - | |
| SLP | - | - | - | - | - | - | - | |
| DEWP | - | - | 8.740 | <2 × 10⁻¹⁶ | - | - | 6.459 | 1.71 × 10⁻¹¹ |
| VISIB | - | - | 8.464 | 1.05 × 10⁻⁷ | 7.913 | 8.68 × 10⁻¹² | - | - |
| SPI1 | - | - | - | - | 5.087 | 0.0127 | 3.889 | 0.02521 |
| SPI3 | - | - | - | - | - | - | 2.018 | 8.81 × 10⁻⁶ |
| SPI6 | 4.124 | 0.002021 | - | - | - | - | 4.044 | 5.37 × 10⁻⁸ |
| SPI9 | 5.048 | 0.005825 | - | - | - | - | - | - |
| SPI12 | 2.710 | 0.012842 | - | - | - | - | - | - |
| AI | - | - | - | - | - | - | - | - |
| FDI | 8.015 | 0.000266 | 4.018 | 0.003571 | 8.873 | 4.55 × 10⁻¹⁴ | - | - |
edf: effective degrees of freedom.
Table 4.
Selected GAM-based models for the burned area (SB) per ecoregion.
| Location | ||||||||
|---|---|---|---|---|---|---|---|---|
| Parameter | Forest Zone | Preforest Zone | Sudanian Zone | N’Zi River Watershed | ||||
| Family | Gaussian | Gaussian | Gaussian | Gaussian | ||||
| Link function | Identity | Identity | Identity | Identity | ||||
| Adjusted R2 | 0.771 | 0.869 | 0.981 | 0.784 | ||||
| Deviance explained (%) | 84.2 | 89.3 | 99.7 | 81.3 | ||||
| GCV score | 4.73 × 10⁷ | 2261.7 | 4.5052 × 10⁷ | 9088 | ||||
| AIC | 3344.81 | 2011.501 | 782.5832 | 2268.917 | ||||
| Covariates | edf | p-Value | edf | p-Value | edf | p-Value | edf | p-Value |
| PRCP | - | - | - | - | - | - | - | - |
| TMOY | 7.236 | 0.00129 | 3.719 | 0.000873 | - | - | - | - |
| MAX | - | - | - | - | - | - | - | - |
| MIN | 2.112 | 0.00133 | 5.447 | 0.001879 | - | - | - | - |
| AT | - | - | 4.335 | 0.001950 | 8.851 | 0.00293 | 2.098 | 0.00772 |
| ET0 | 2.101 | 0.00396 | - | - | - | - | - | - |
| WDSP | - | - | - | - | - | - | - | - |
| MXSPD | - | - | - | - | 3.932 | 0.00140 | ||
| RH | - | - | - | - | - | - | - | - |
| VDP | - | - | - | - | - | - | - | - |
| SLP | - | - | - | - | - | - | - | - |
| DEWP | 7.517 | 0.01403 | 8.883 | <2 × 10⁻¹⁶ | - | - | 7.175 | 5.48 × 10⁻¹³ |
| VISIB | 8.678 | 8.26 × 10⁻⁷ | 8.500 | 8.25 × 10⁻⁹ | 9.000 | 1.59 × 10⁻⁵ | 1.208 | 3.99 × 10⁻¹⁰ |
| SPI1 | - | - | - | - | - | - | - | - |
| SPI3 | 8.945 | 3.48 × 10⁻¹² | - | - | - | - | - | - |
| SPI6 | - | - | - | - | - | - | - | - |
| SPI9 | 7.289 | 0.00149 | - | - | - | - | - | - |
| SPI12 | - | - | - | - | - | - | - | - |
| AI | - | - | - | - | - | - | - | - |
| FDI | 6.692 | 0.01818 | 4.139 | 0.039573 | 7.043 | 0.01027 | - | - |
edf: effective degrees of freedom.
© 2018 by the authors. Licensee MDPI, Basel, Switzerland. This article is an open access article distributed under the terms and conditions of the Creative Commons Attribution (CC BY) license (http://creativecommons.org/licenses/by/4.0/).
Share and Cite
MDPI and ACS Style
Kouassi, J.-L.K.; Wandan, N.E.; Mbow, C. Assessing the Impact of Climate Variability on Wildfires in the N’Zi River Watershed in Central Côte d’Ivoire. Fire 2018, 1, 36. https://0-doi-org.brum.beds.ac.uk/10.3390/fire1030036
AMA Style
Kouassi J-LK, Wandan NE, Mbow C. Assessing the Impact of Climate Variability on Wildfires in the N’Zi River Watershed in Central Côte d’Ivoire. Fire. 2018; 1(3):36. https://0-doi-org.brum.beds.ac.uk/10.3390/fire1030036
Chicago/Turabian StyleKouassi, Jean-Luc Kouakou, Narcisse Eboua Wandan, and Cheikh Mbow. 2018. "Assessing the Impact of Climate Variability on Wildfires in the N’Zi River Watershed in Central Côte d’Ivoire" Fire 1, no. 3: 36. https://0-doi-org.brum.beds.ac.uk/10.3390/fire1030036