1. Introduction
Wildfires pose an increasing threat to communities and built infrastructure throughout the Western United States. Over the last four decades in the Western U.S., the total annual area burned has increased considerably with wildfires occurring at higher frequency [
1,
2]. Since the mid-1980s, warmer temperatures and increased aridity have increased the fire season by ca. 78 days in this region [
1,
3]. Previous research on broad regional fire trends has primarily focused on the entire Western U.S. However, the Intermountain West (IMW)—defined in this paper as consisting of Arizona, Colorado, Idaho, Montana, Nevada, New Mexico, Utah and Wyoming—differs from the coastal parts of California, Oregon and Washington in that the IMW states overall are largely characterized by relatively dry conditions and arid vegetation communities that make it especially vulnerable to large, high-severity fires [
4,
5,
6,
7]. This susceptibility to fire is expected to increase under warmer and more arid future climate scenarios [
8]. While extensive work on fire has been conducted within this region [
2,
4], a better interdisciplinary understanding of fire trends at multiple scales within this expansive, ecologically-distinct portion of the West is needed if we are to adapt human behavior for more effective fire management in the face of a changing climate.
In addition to climatic factors driving increases in wildfire, widespread development along the wildland-urban interface (WUI)—the transition zone where housing meets or is intermixed with undeveloped vegetated areas—has increased populations and values at risk [
9,
10,
11,
12]. Population in the Western U.S. has grown rapidly in recent decades [
13], with substantial development and housing growth concentrated in the WUI [
11,
12,
14]. With greater expansion into the WUI and increased fire frequency, more people are exposed to property loss, especially in high density urban regions. Research also shows that closer proximity to the WUI leads to higher suppression costs [
15,
16]. However, the distribution of wildfire risks and the capacity to mitigate them varies between urban and rural communities [
17,
18]. Rural communities, which are more prevalent in the IMW, may be differentially affected by wildfire due to fundamental differences in socioeconomic characteristics, including a greater dependence on natural resource and recreation-based industries [
17,
19,
20]. Furthermore, rural communities have limited financial resources compared to urban areas [
17], although residents have been more willing to participate in suppression tactics to protect their livelihoods [
20,
21].
While wildfire can physically threaten urban and rural communities, it can also have immediate and long-term consequences for local economies. The majority of short-term economic impacts of wildfire tend to be negative, such as the costs associated with firefighting, property damage and loss of timber resources, in addition to the evacuation of local residents, impaired water and air quality and loss of tourism, business and recreation revenue [
22]. In the long-term, wildfire may increase economic volatility or lead to unstable economic growth in the year following a fire [
23]. However, wildfire may also have positive impacts in some employment sectors from increased construction of infrastructure and rebuilding of homes, restoration of forest and aquatic ecosystems and greater opportunities for resource extraction, like salvage logging [
24]. These economic costs of fire are expected to increase with changing climate conditions and greater development in wildland areas. While studies have investigated a variety of economic impacts of fire, there is still a need for a greater understanding of how managers utilize information on these impacts to make decisions and fire mitigation policy [
25]. As increased risk of fire exacerbates socioeconomic effects on communities, it is critical to understand how wildfire impacts manager perspectives and adaptive management strategies to better mitigate those risks in an uncertain future [
26].
With greater development in the more fire-prone wildland and WUI areas, fire managers have been tasked with greater responsibility for the protection of private citizens in increasingly vulnerable areas. Various factors influence fire managers’ decisions, including fire characteristics (e.g., fire size and frequency), expectations of affected communities and government officials and federal fire management policy [
27]. Challenges to these decisions include natural accumulation of biofuels over time, projected (if uncertain) increases in aridity in those accumulating fuels, conflicting management objectives by different resource agencies, social and political pressures to immediately suppress fire and managing the short- and long-term cumulative impacts of fire [
27,
28,
29,
30]. Overall, the complex decision-making process for fire managers is not well understood [
25]. Improving our understanding of the various influences, needs and challenges for management decisions answers the need for increased integration of fire management into the decision-making and risk management literature [
28,
31].
An interdisciplinary approach is needed to more fully understand the complex systems and consequences of wildfire in changing socio-demographic and resource management contexts [
18,
32]. Responding to changes in the wildfire regime in an adaptive way requires managers to understand broader trends in wildfire characteristics over a variety of scales, understand the condition of the forest and fuels within their management domain and also discern highly contextual information from affected communities such as economic impacts and expectations of officials and community members. Integrating quantitative and qualitative data and analytical methods on physical and social aspects of fire advances our understanding of wildfire trends and impacts.
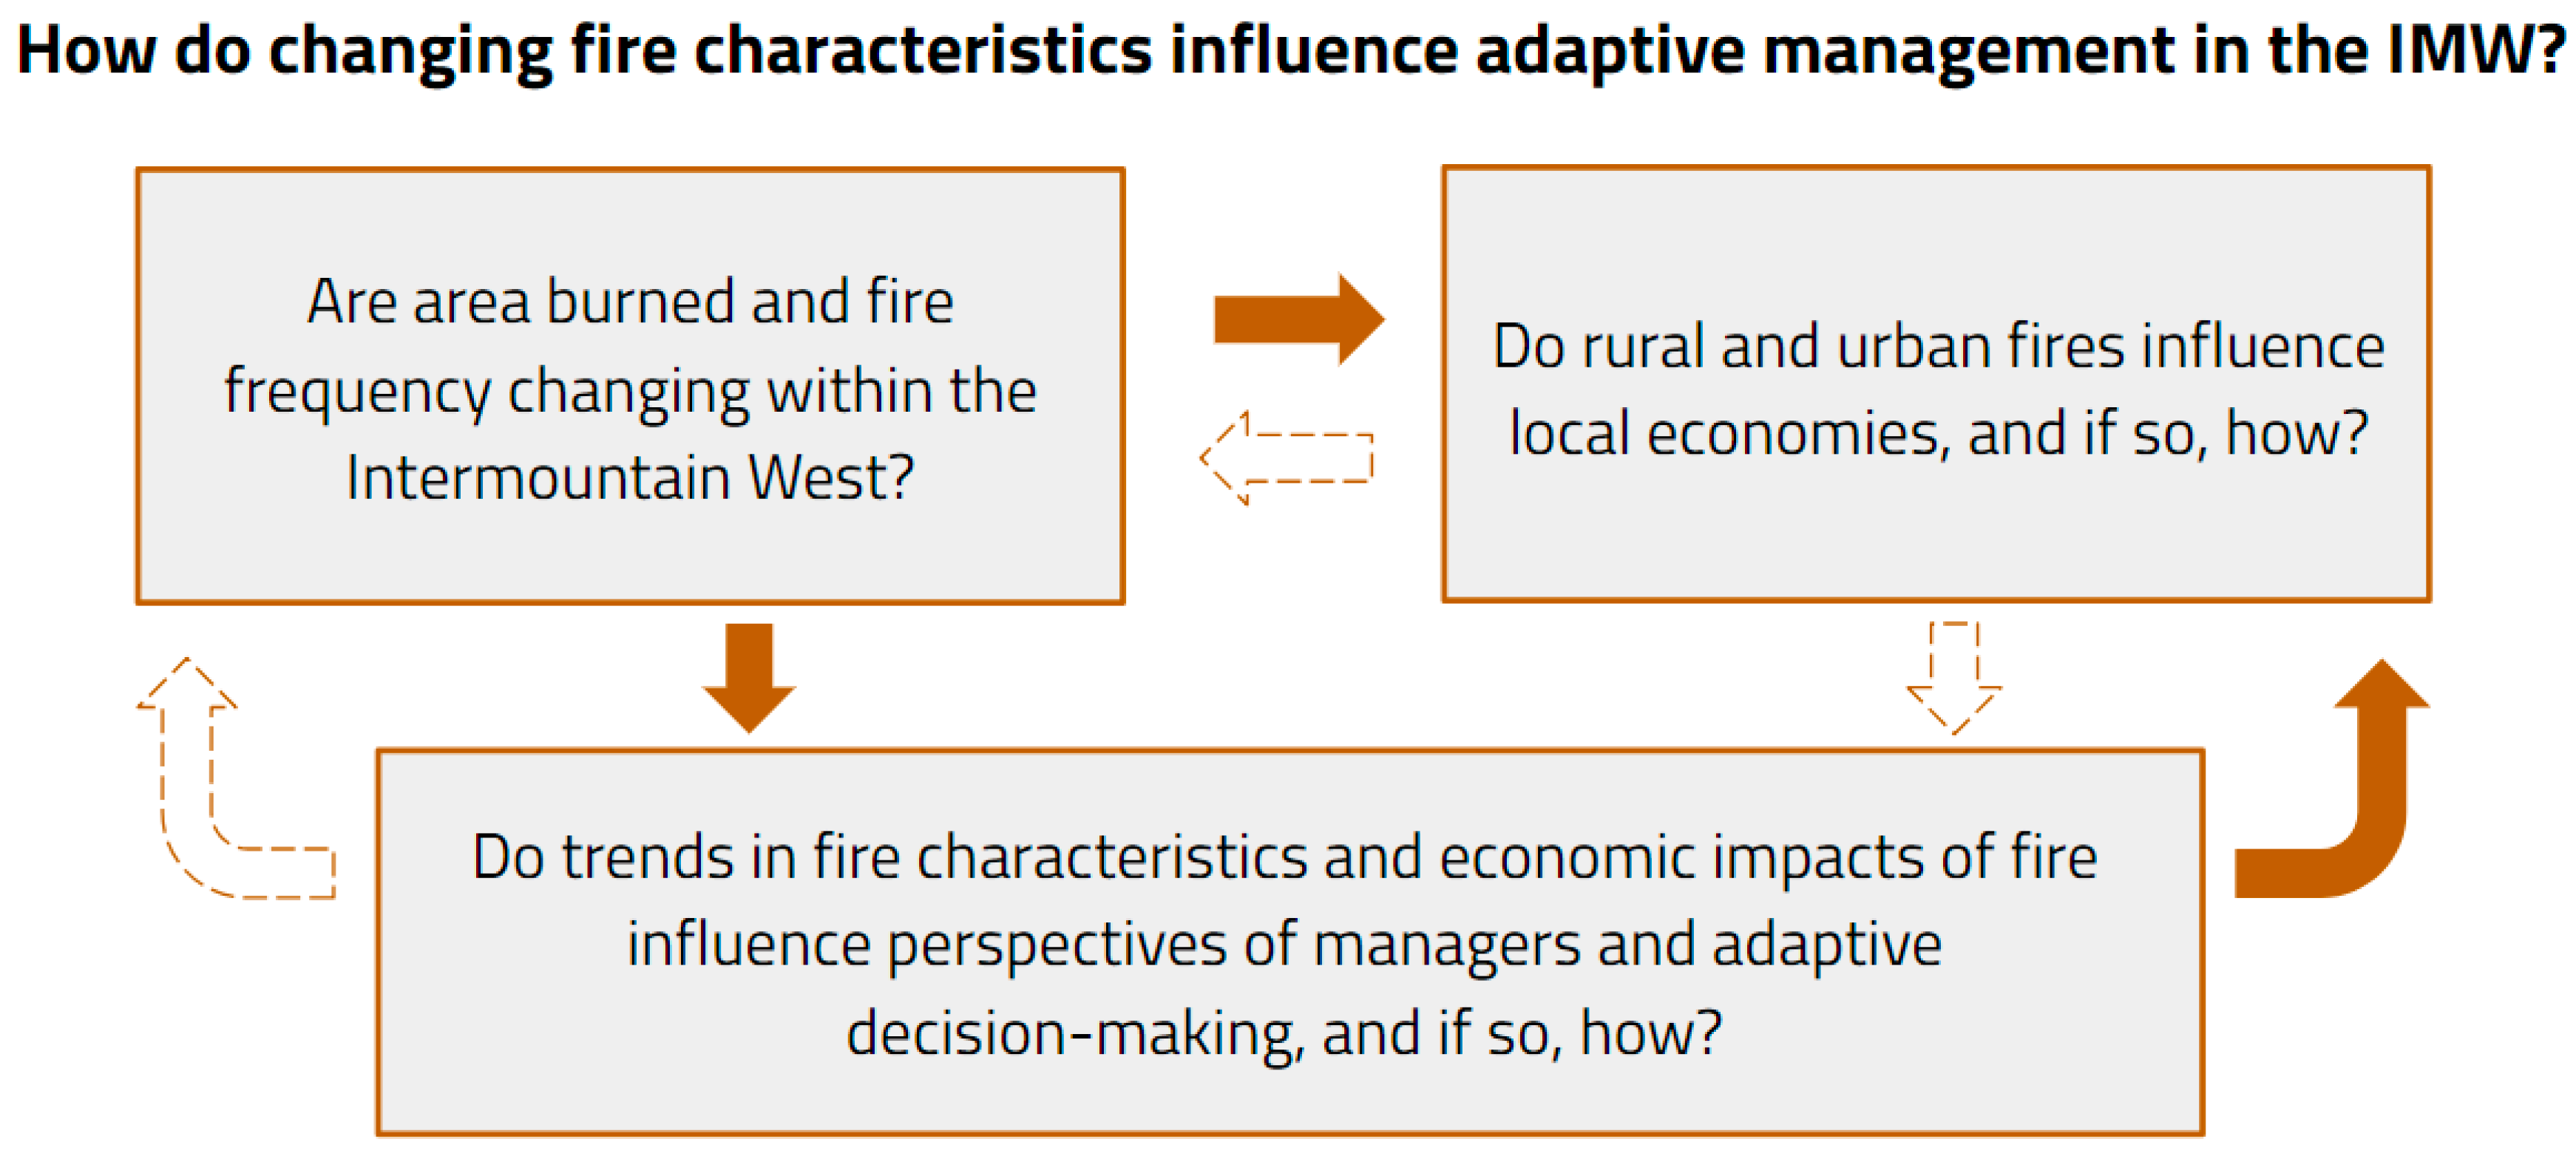
We applied an interdisciplinary approach to investigate how recent trends in fire characteristics influence regional adaptive management in the rural and urban areas of the IMW, exploring three interrelated questions: (1) Are area burned and fire frequency increasing within the IMW?; (2) Do fires in urban or rural settings influence employment trends in local economies and if so, how?; and (3) Do trends in fire characteristics and economic impacts of fire influence perspectives of managers and adaptive decision-making and if so, how? We addressed these questions by quantifying fire characteristics and economic impacts and connecting them with qualitative interviews of fire managers from three regions within the IMW. Our study identifies key challenges to implementing adaptive fire and forest management strategies for both short- and long-term fire risk mitigation (
Figure 1).
2. Materials and Methods
We evaluated area burned and fire frequency for large fires across all eight IMW states. Using the 2011 National Land Cover Database and boundaries from the U.S. Census Bureau, we first quantified the amount of “burnable area” of each county (n = 281) within each state as the sum of all land cover types excluding open water, salt flats and barren land (
www.mrlc.gov) [
33,
34]. We downloaded spatial data depicting the perimeters of individual fires greater than ~400 ha that burned within the region over a 32-year period (1984–2015) from the Monitoring Trends in Fire Severity (MTBS) database (
www.mtbs.gov) [
35]. We obtained spatial data that delineates the WUI based on housing density and wildland vegetation cover at the census block scale from the SILVIS Lab (
http://silvis.forest.wisc.edu/maps/wui) [
9]. Fires that occurred within 2.4 km [
14,
36] of areas defined as “high housing density” (>741.3 housing units km
−2) were classified as “urban fires,” while those that occurred outside of the buffer were designated as “rural fires” (
Figure 2). In other words, “urban fires” refer to high-density WUI fires and “rural fires” refer to low-density WUI fires. The buffer we implemented is intended to represent the distance at which urban structures are likely to become a primary concern, which may influence the vigor or strategy employed by fire suppression efforts [
36].
To assess trends in area burned and fire frequency over the 32-year period at regional, state and county levels, we calculated linear regressions in the R statistical computing environment [
37]. Linear regression was used as the most conservative approach to finding increasing or decreasing trends in the fire data shown in the
supplementary information (Figures S1–S5). Researchers have compared various approaches when modeling big data trends and have found linear fit to be appropriate for general overall trends [
38]. For analyses of area burned, we summed the burned areas within each spatial unit (region, state, or county) by year and then normalized these values by dividing by burnable area within that unit, assessing trends in the percentage of each unit burned. For regional and state-level trends in fire frequency, we based annual fire counts on the number of fire perimeter centroids (i.e., centers) falling within each state to avoid double-counting fires that crossed state lines. For county-level frequency trends, fire counts were represented by the total number of fire perimeters intersecting each county boundary. We tested for the significance of linear trends separately for rural and urban fires at both the regional and state-level, for both area burned and fire frequency.
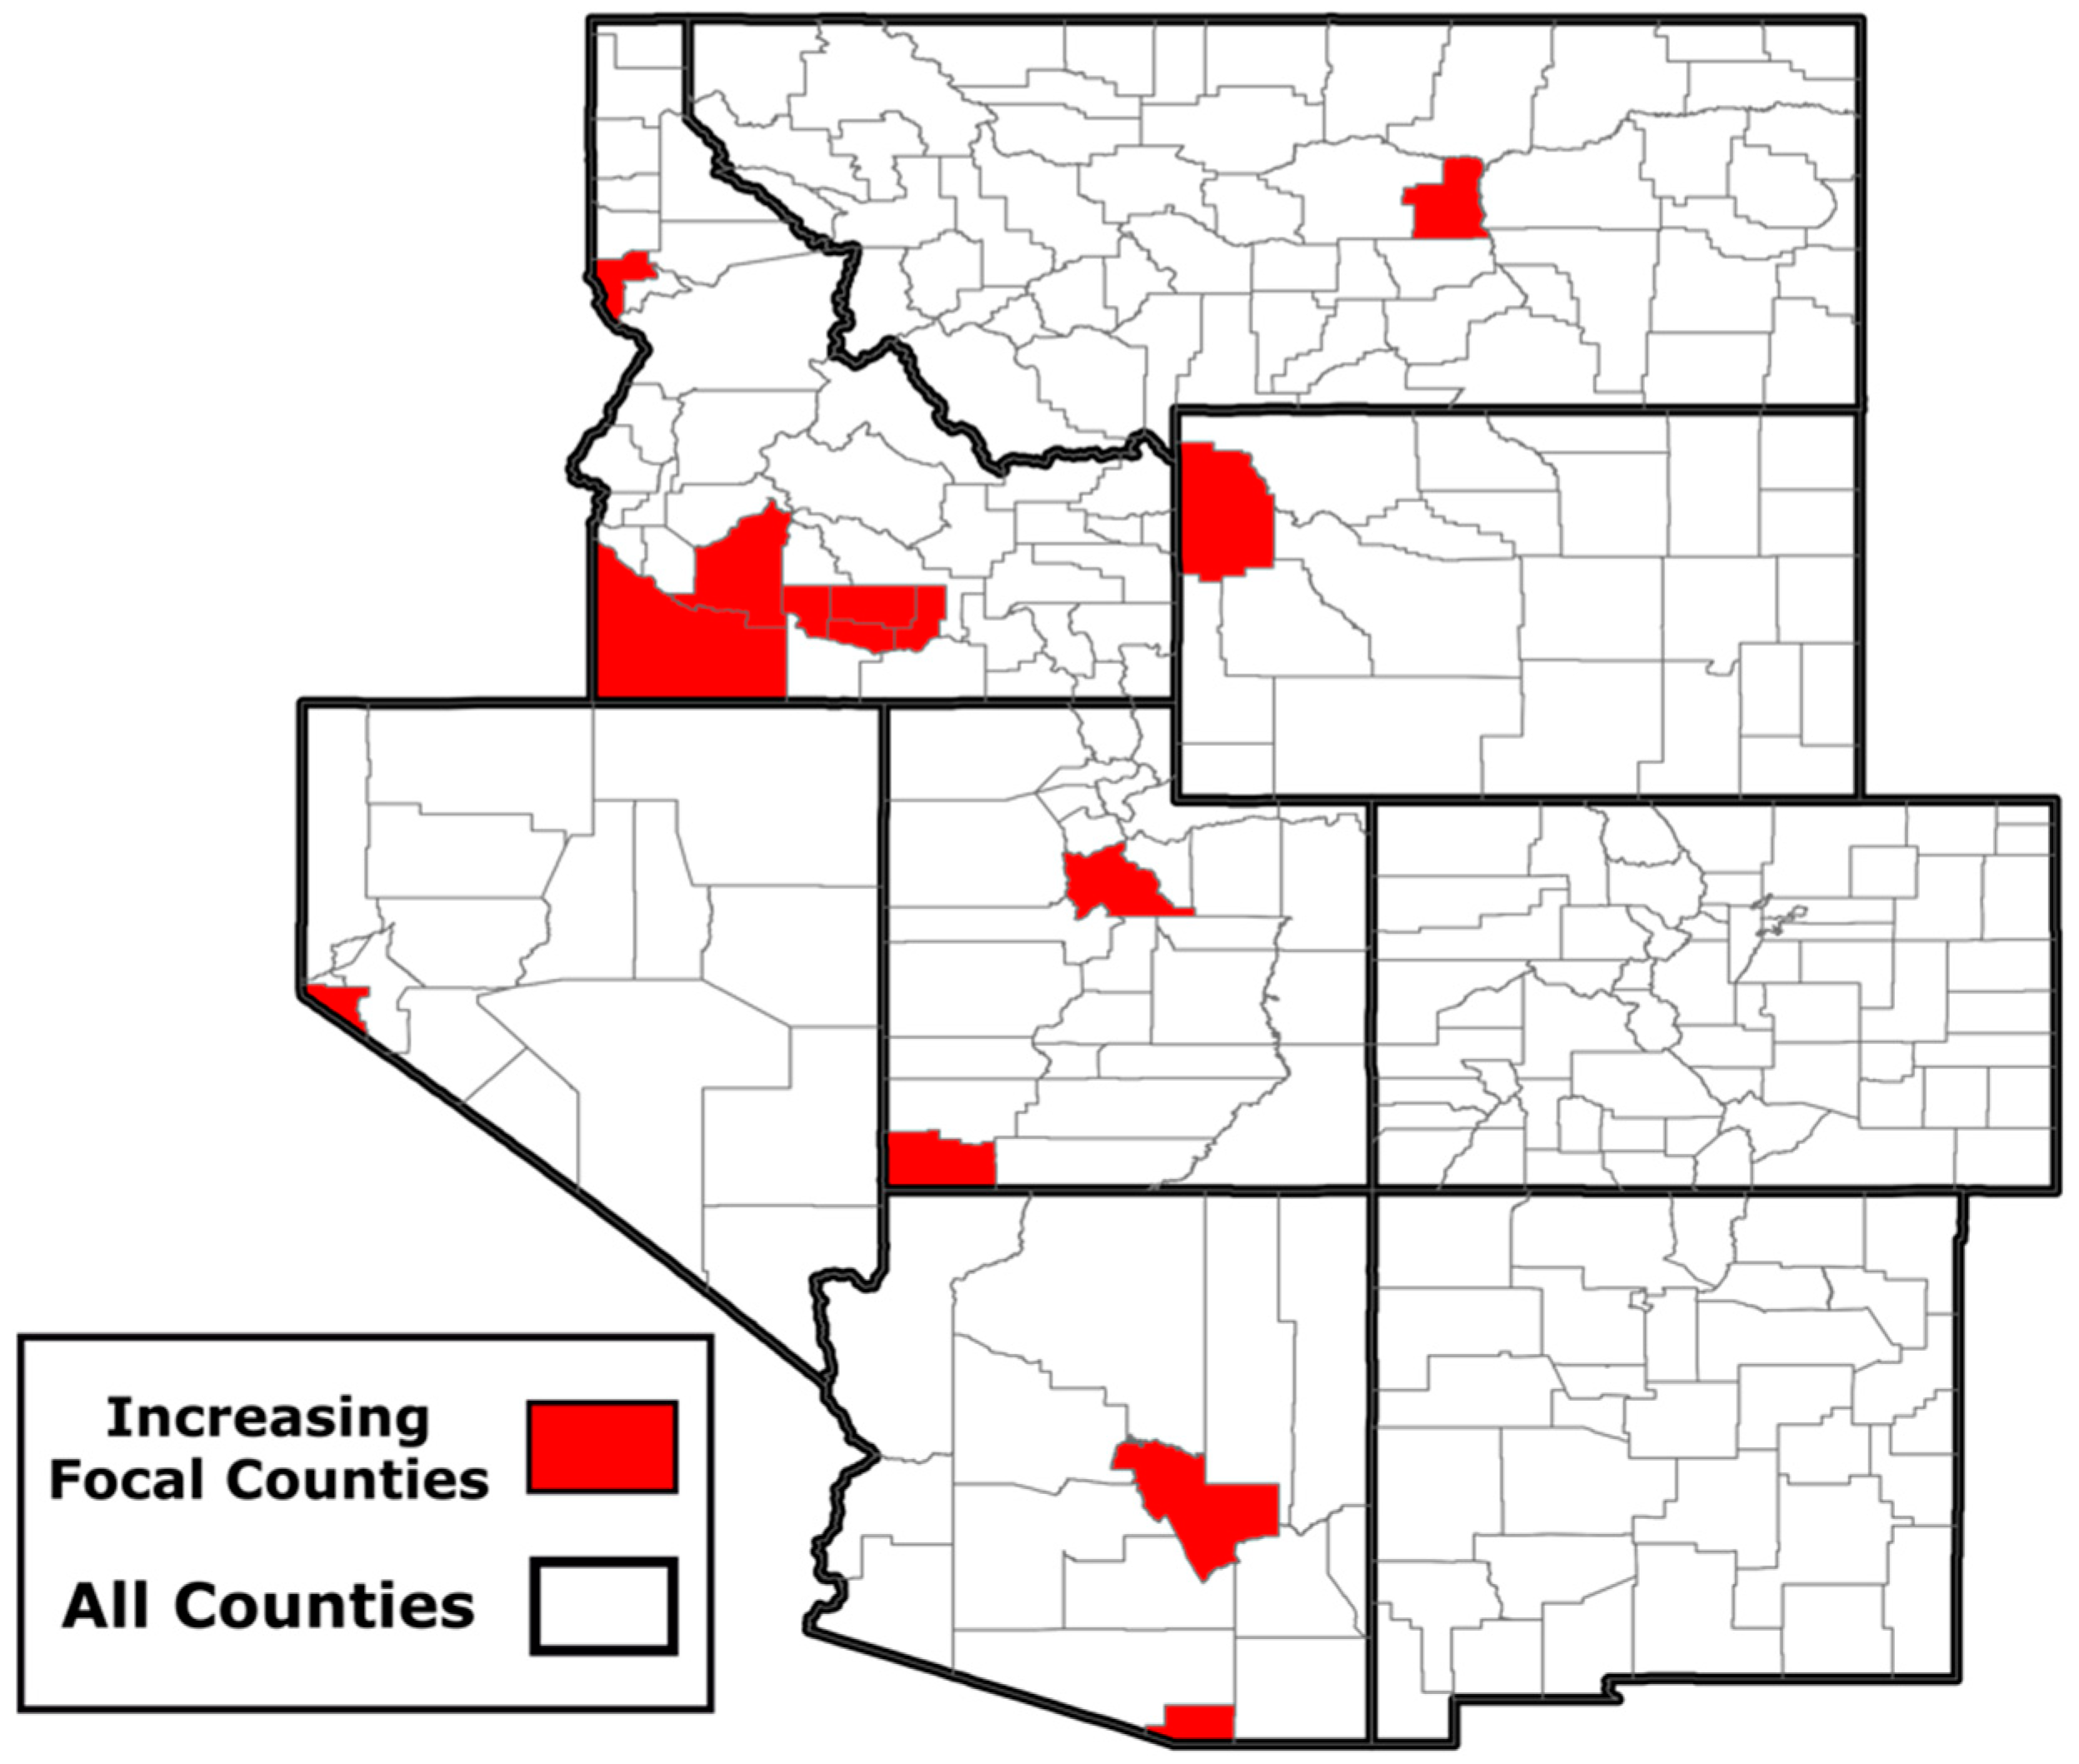
To focus a portion of our economic analysis and our qualitative interviews with managers in areas that have experienced increasing trends in burned area and/or fire frequency, we identified focal counties by considering the steepness of the linear regression slopes for area burned and fire frequency in each county. Focusing on the top 5% of all regression slopes for all counties and excluding counties with increasing trends driven by outliers using a visual test, we identified 14 counties (
Figure 3). We refer to these 14 counties as the “Increasing Focal Counties” throughout the rest of this paper. For more context on these “Increasing Focal Counties,” six counties had increasing trends for burned area and twelve had increasing trends for fire frequency. This equated to a linear trend line slope greater than 7% for counties identified as our Increasing Focal Counties.
We estimated the impacts of urban and rural wildfires on local economies by analyzing changes in the employment rate in affected counties after each wildfire event. Our economic analysis looks at employment and fire data from 2001-2015, due to the employment data only being available from these years. We utilized monthly data from on local employment rates from the Bureau of Labor Statistics (BLS) [
39], retrieved online using the R package ‘blsAPI’ (
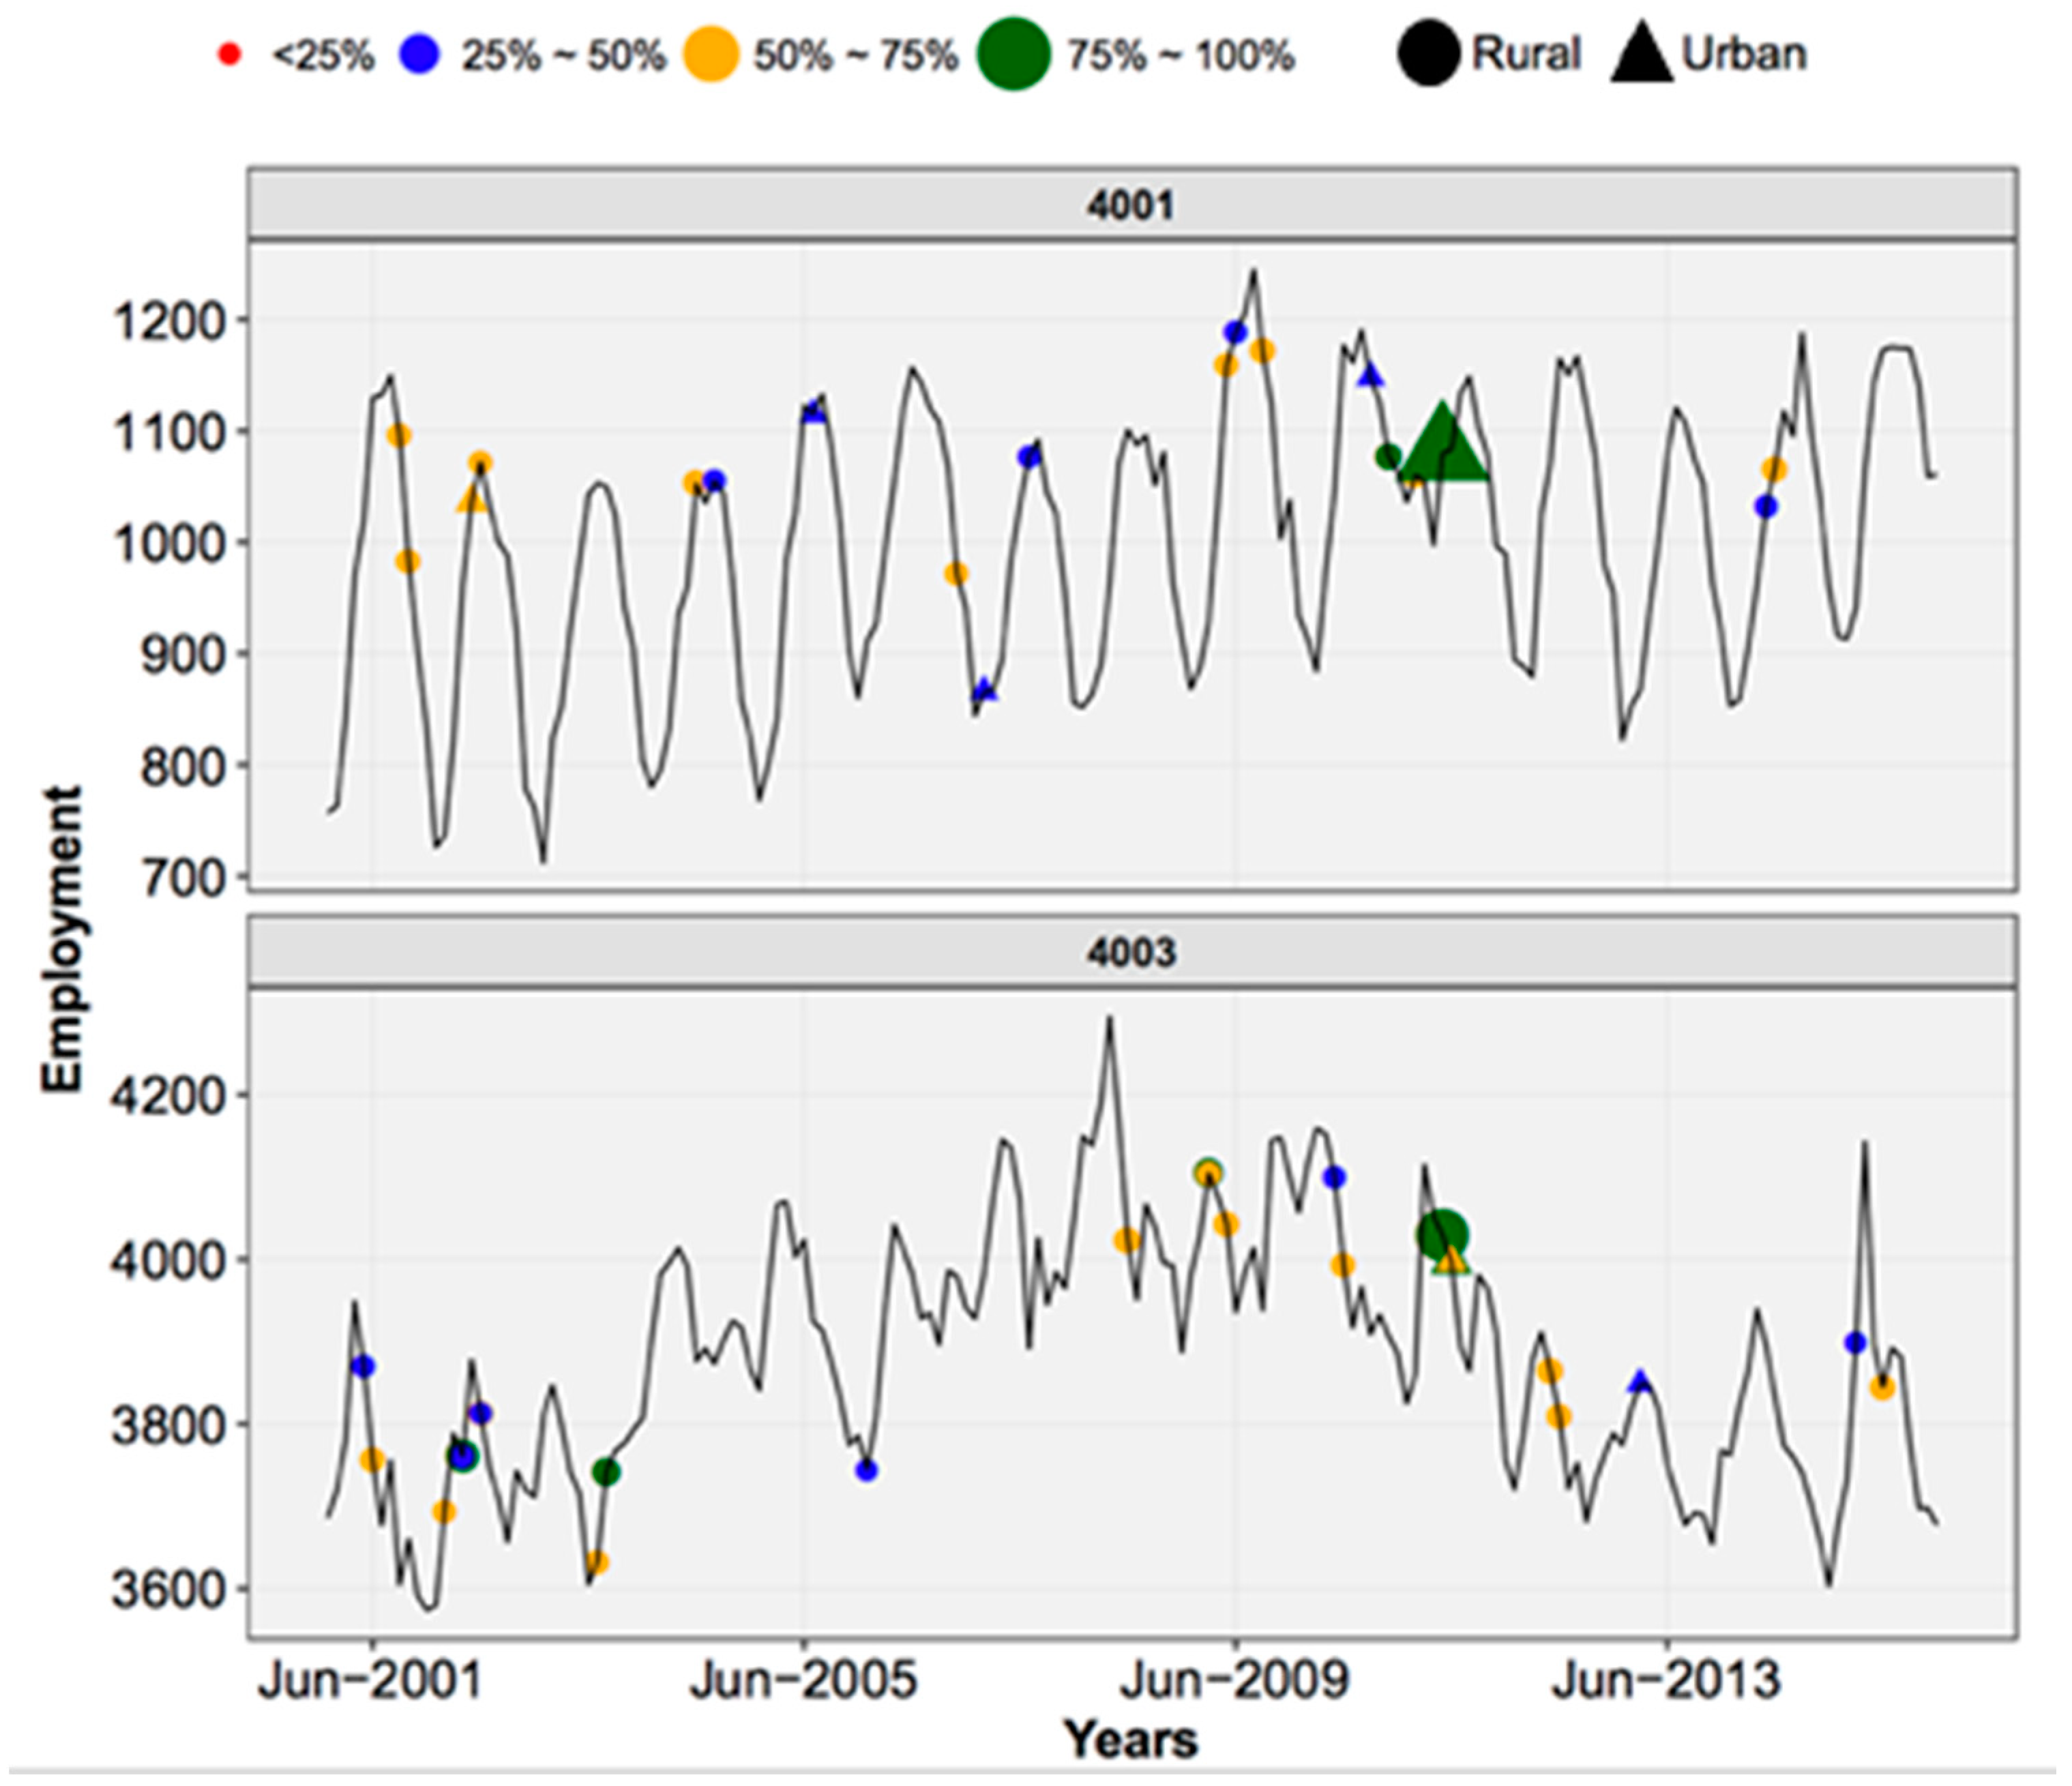
https://CRAN.R-project.org/package=blsAPI). We then analyzed employment in relation to MTBS data on fire ignition date, fire size and location and to our rural and urban fire classifications. We focused on five BLS employment datasets broken into three hierarchical tiers of employment specificity that range from broad to more specific sectors. The broadest category included (I) Total Employment for all IMW states (n = 281 counties). The BLS divided Total Employment into two sub-categories: (1) Goods Producing and (2) Service Providing sectors. Within each of the (1) Goods Producing and (2) Service Providing sub-categories, we further evaluated the (1a) Natural Resource and Mining and (2a) Leisure and Hospitality sub-sectors, respectively. Each category contains monthly employment data from 2001–2015 at the county level (for a sub-sector employment example, see
Figure 4). Graphs of employment data with the fire data used in our economic analyses can be found in the
supplementary materials (Figures S1–S5).
We acknowledge that wildfires can have a wide range of economic impacts, including permanent loss of property or infrastructure, temporary loss of use or degradation, impacts on water, soil and forest resources, positive and negative impacts on terrestrial and aquatic wildlife, as well as costs of fire suppression and post-fire restoration. While data were not available to quantify those factors at the scale of our analysis, we suggest that future efforts seek to compile or estimate such data for a more comprehensive analysis of economic impacts of wildfire.
A central innovation of our study is the development of a new data set linking labor statistics data with MTBS fire data and the WUI classification. Nielsen-Pincus et al. (2013) studied the different impacts of urban and rural wildfire on local economies using the United States Department of Agriculture (USDA) Economic Research Service county typology to identify the rural and urban counties [
23]. However, the majority of IMW fires from the MTBS database did not cover the entire county and often crossed county and/or state lines. This creates false classifications in cases where fires occur in the urban parts of counties labeled ‘rural’ and vice versa. Therefore, the USDA county classifications did not have sufficient resolution for our purposes. Thus, we utilized our much higher resolution WUI urban and rural fire classification to obtain a finer spatial resolution of fire types and used fire ignition date, location and size from MTBS database to identify each wildfire that happened in IMW from 2001 to 2015. Our classified fire database is available as
supplementary information associated with this paper.
We used an event study framework to analyze the different impacts of rural and urban fires on the employment of affected communities. Taking total employment rate for all industry as an example, the event study model gives us the change in employment rate within a county after a wildfire event,
where
is the dependent variable, representing the percent changes in total employment rate for county
c at time
t. The variable
is the fire indicator, equal to 1 if the county is reported to have experienced wildfire in month
t, according to the MTBS dataset. The month of wildfire ignition corresponds to (
j=0). We normalized the effect in the month before the fire (
j = 1) to zero.
represents the area burned (acres) in each event, to address how the size of fires can affect the local labor market.
represents the overall trend of the regional total employment, to help account for broader economic trends of the region that may impact employment. County fixed effects, represented by
, standardize the comparison by only comparing within the same county. Variable
represents the year fixed effects, thus we are only comparing impacts within the same year. Variable
is the month fixed effects, while
shows the error term. Employment numbers can vary due to various factors, including differences in industries between counties, economic trends during different years and changes across employment across months and seasons. These county, year and month fixed effects help control for these changes in employment across different counties, across different years and across different months of the year.
The model assumes that the occurrence of a fire is a random event, conditional to fire location and monthly time of year and is uncorrelated with unknown confounding variables. We chose a 6-month event window to observe the impact of fire over time to be consistent with the seasonal trend of the BLS and fire data (
Figure 4), both of which occur on a 6-month interval. Previous research has found longer-term lagged effects to be important when studying labor markets after fire [
40,
41]. Therefore, we ran our model with a 12-month event window as well, which is also discussed briefly in the results section below. We ran the model for the five different employment sectors, defined above and four regressions: All Fires (including all rural and urban fires within all counties), Rural Fires (including rural fires within all counties), Urban Fires (including all urban fires within all counties) and Increasing Focal Counties (rural and urban fires within the 14 counties that were classified above as experiencing increasing fire trends).
From our 14 Increasing Focal Counties (
Figure 3), we focused our interviews in three geographic regions with clustered counties: two in Arizona, two in Utah and six counties clustered in southwestern Idaho. We used the three regions as focused case studies that helped qualitatively illustrate fire manager challenges. We recognize that these findings are not necessarily representative of the entire IMW region but offer in-depth insight into regional perspectives. We used criterion and snowball sampling to conduct key informant interviews in March and April of 2018 (Utah State University Institutional Review Board Exempt Protocol #9130). We took a qualitative approach to collecting thematic interview data. While we had a small sample size of total interviews, others have utilized a similar thematic analysis [
42] that identified social characteristics at the community level. Thematic analysis is an effective coding strategy that identifies common elements among participants around a specific topic and summarizes coded statements into broader themes [
43].
To identify potential participants, we contacted agencies whose fire management jurisdictions were within or overlapping the specified counties in Arizona, Idaho and Utah and sought participants whose job responsibilities included managing wildland fire through response, planning, mitigation and prevention. To increase our sample pool, we asked potential participants for references of other key informants in their area. Using these techniques, we conducted 20 semi-structured interviews of managers from different state, tribal and federal agencies. We primarily interviewed District Rangers, Fire Management Officers and Fuels Specialists, all with a wide array of work history and experience. Interviews lasted between 16 and 86 min (mean = 39 min). Nineteen interviews were audio recorded with consent of the participant. One participant opted to have notes taken instead of an audio recording. This interview was fully transcribed from the notes within 24 hours. All audio recorded interviews were transcribed and then checked for accuracy by the interviewer.
While the interviews were structured, in that each participant was asked the same set of questions in the same order, they were conducted in a manner to encourage free expression and explanation of participants’ perspectives on: (1) local fire history and fire trends; (2) economic effects of wildfire; (3) influences on their local fire management and adaptation practices; and (4) challenges to wildfire risk mitigation (for the full interview protocol, see
Table 1). Interviewers avoided prompting with cues to prevent priming participants responses. A thematic analysis approach was implemented, emphasizing semantic coding of explicit words used by participants to answer each question [
43,
44]. Interview content was analyzed for emergent themes by the following four-step process to ensure reliable interpretations: (1) interviewers read through corresponding transcripts for accuracy; (2) interviewers read assigned transcripts and summarized the content for each interview according to key research questions; (3) a second interviewer read the transcripts and corresponding summaries to check for accuracy; and (4) interviewers and transcribers reviewed and coded summaries for major themes together while referring back to original transcripts as needed to resolve coding questions or disagreements. By this process, all transcripts were analyzed qualitatively for major themes by at least two people to increase the reliability of interpretations. During coding, the number of participants who mentioned different topics were noted for reporting major themes and corresponding responses. Managers’ responses were also analyzed for possible geographic patterns as part of the thematic analysis. While participants were selected to collectively represent fire manager perspectives within the three focus areas in Idaho, Utah and Arizona, we do not suggest they are necessarily representative of the larger Intermountain West region as a whole.
3. Results
3.1. Changes in Area Burned and Fire Frequency within the IMW
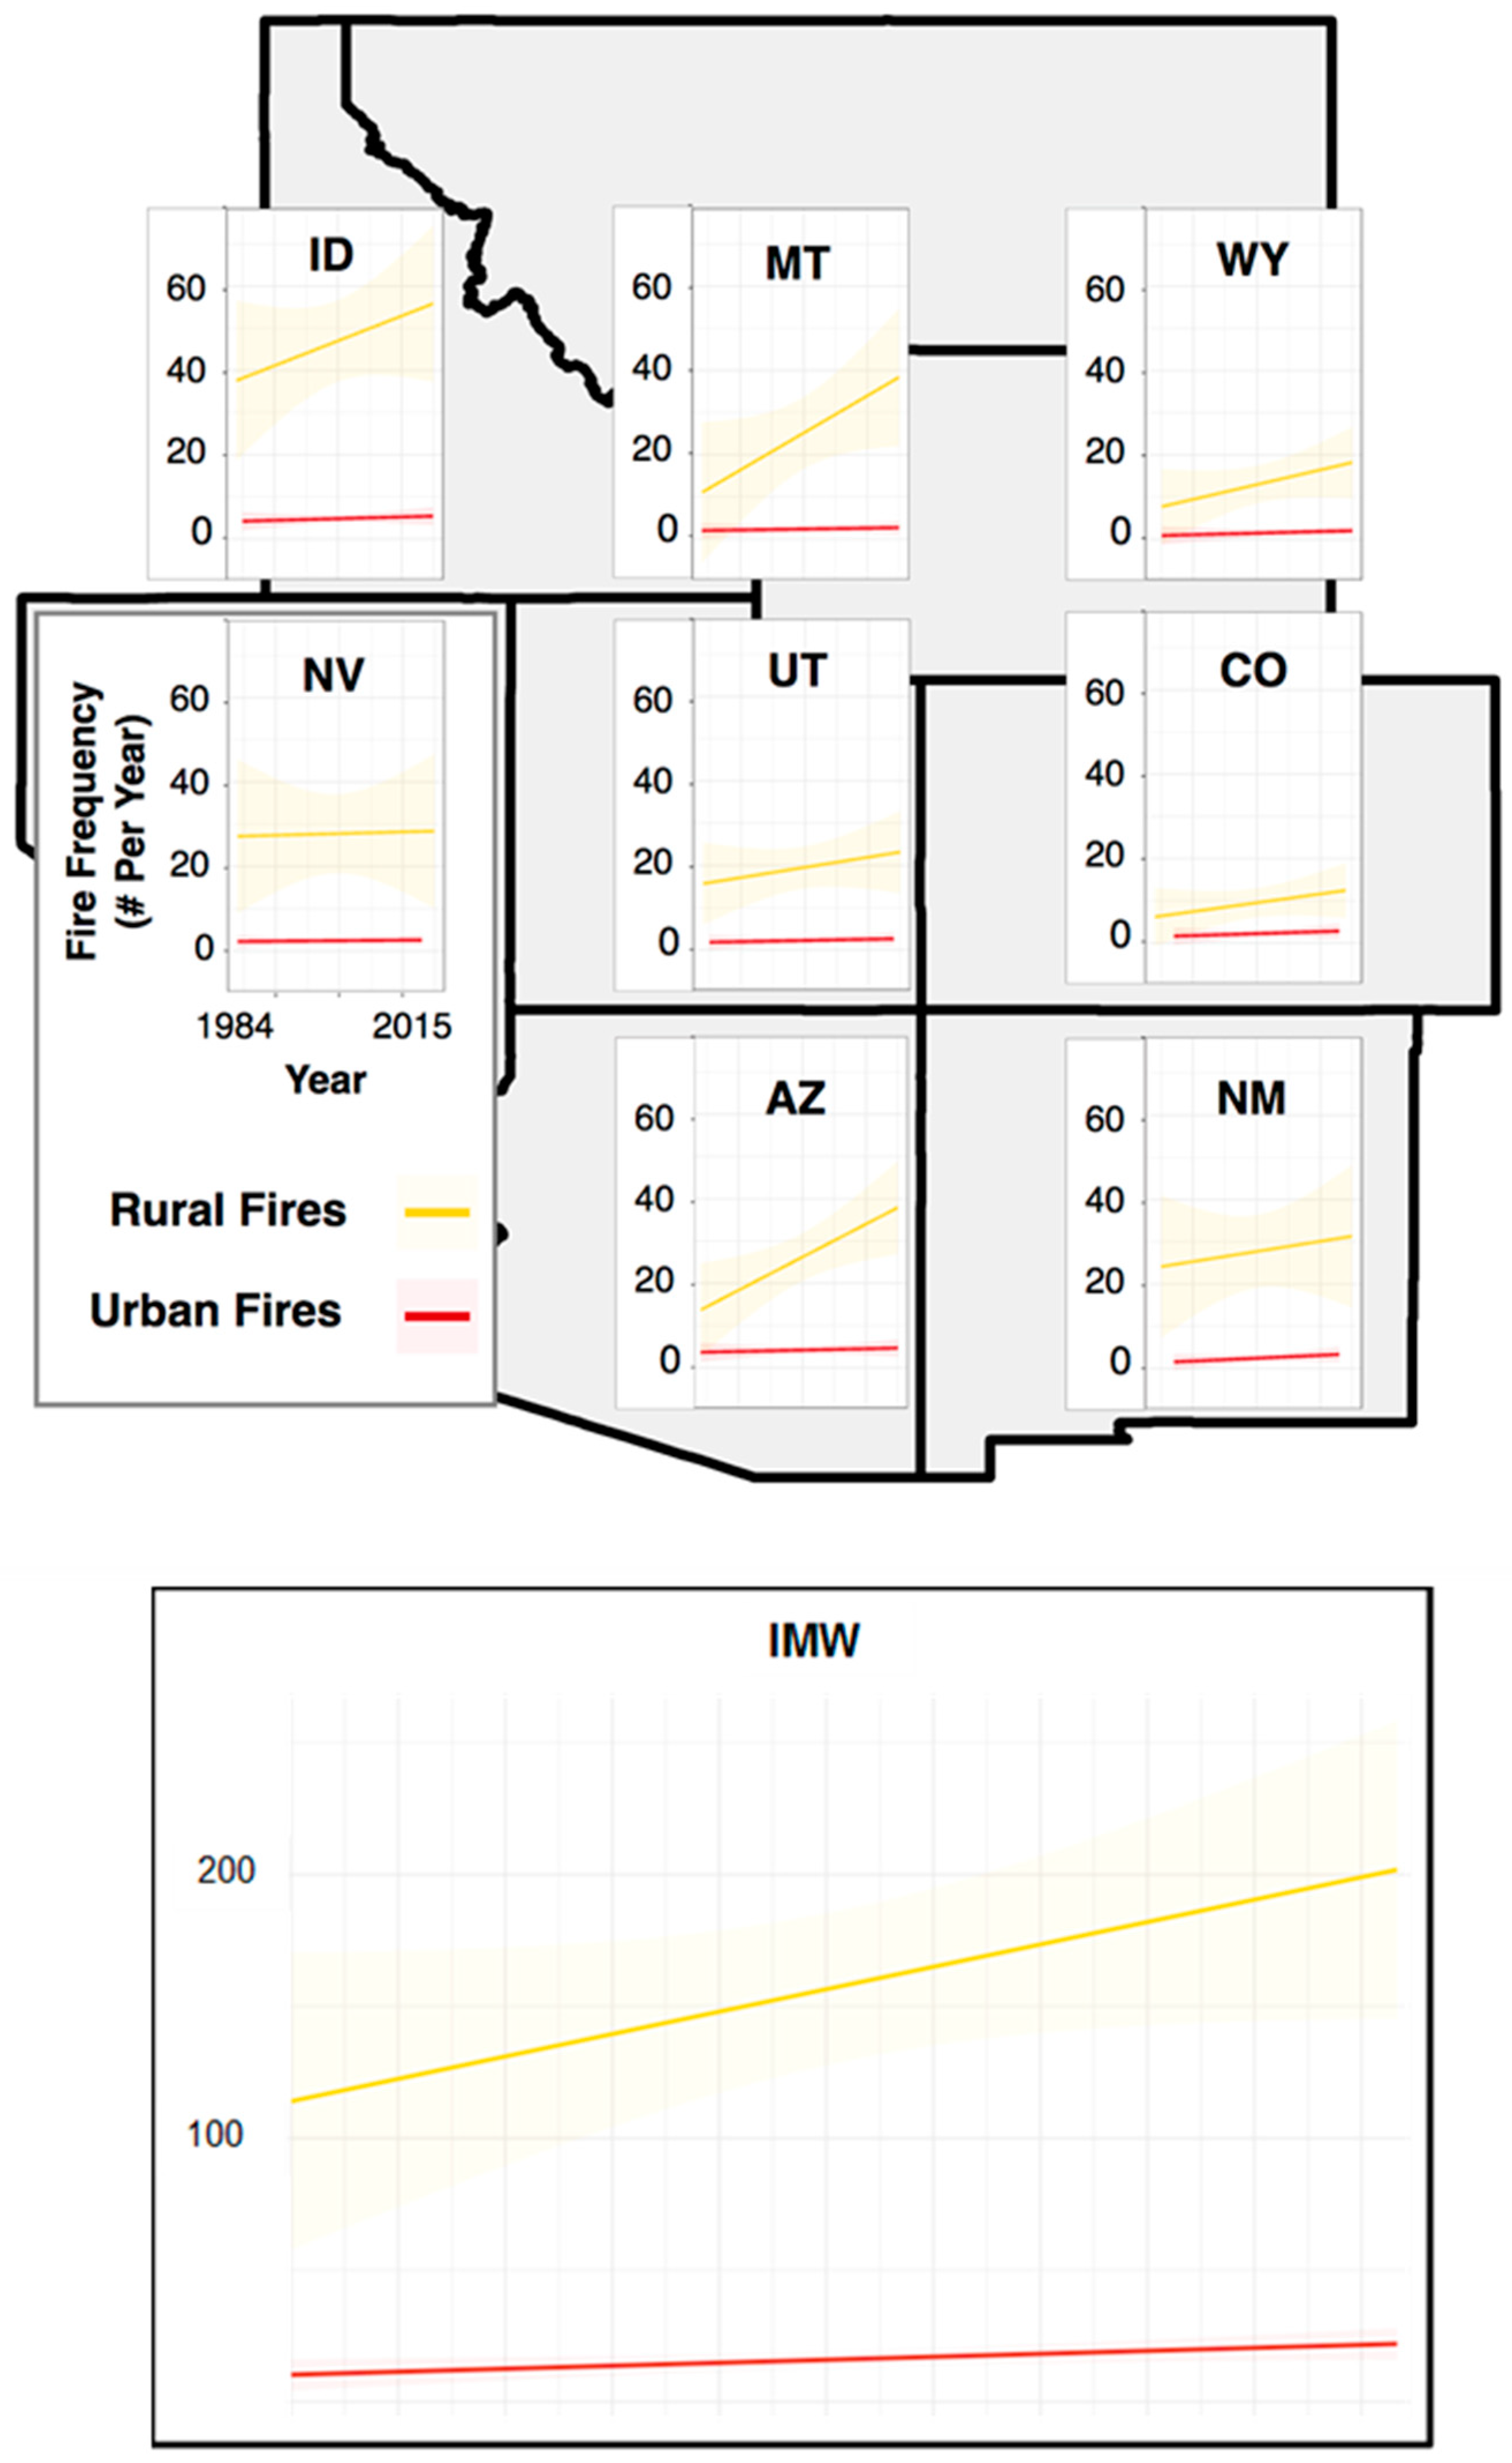
Our analysis of MTBS historical fire data shows that fire characteristics have changed heterogeneously throughout the IMW. From 1984 to 2015, there were 5569 large wildfires in the IMW, 515 of which we classified as urban and 5054 as rural. At the regional scale, there is a significant increase in area burned by rural fires (
p < 0.1) (
Table 2), while focusing at the state level shows important variations in trends associated with area burned and fire frequency and are often driven by significant burn events or fire-prone areas. Fire frequency has also increased in both rural (
p < 0.1) and urban fires (
p < 0.05) (
Table 2). Area burned increased significantly within 28/281 counties and fire frequency increased within 22/281 counties (
p < 0.05). When we relaxed the p-value to
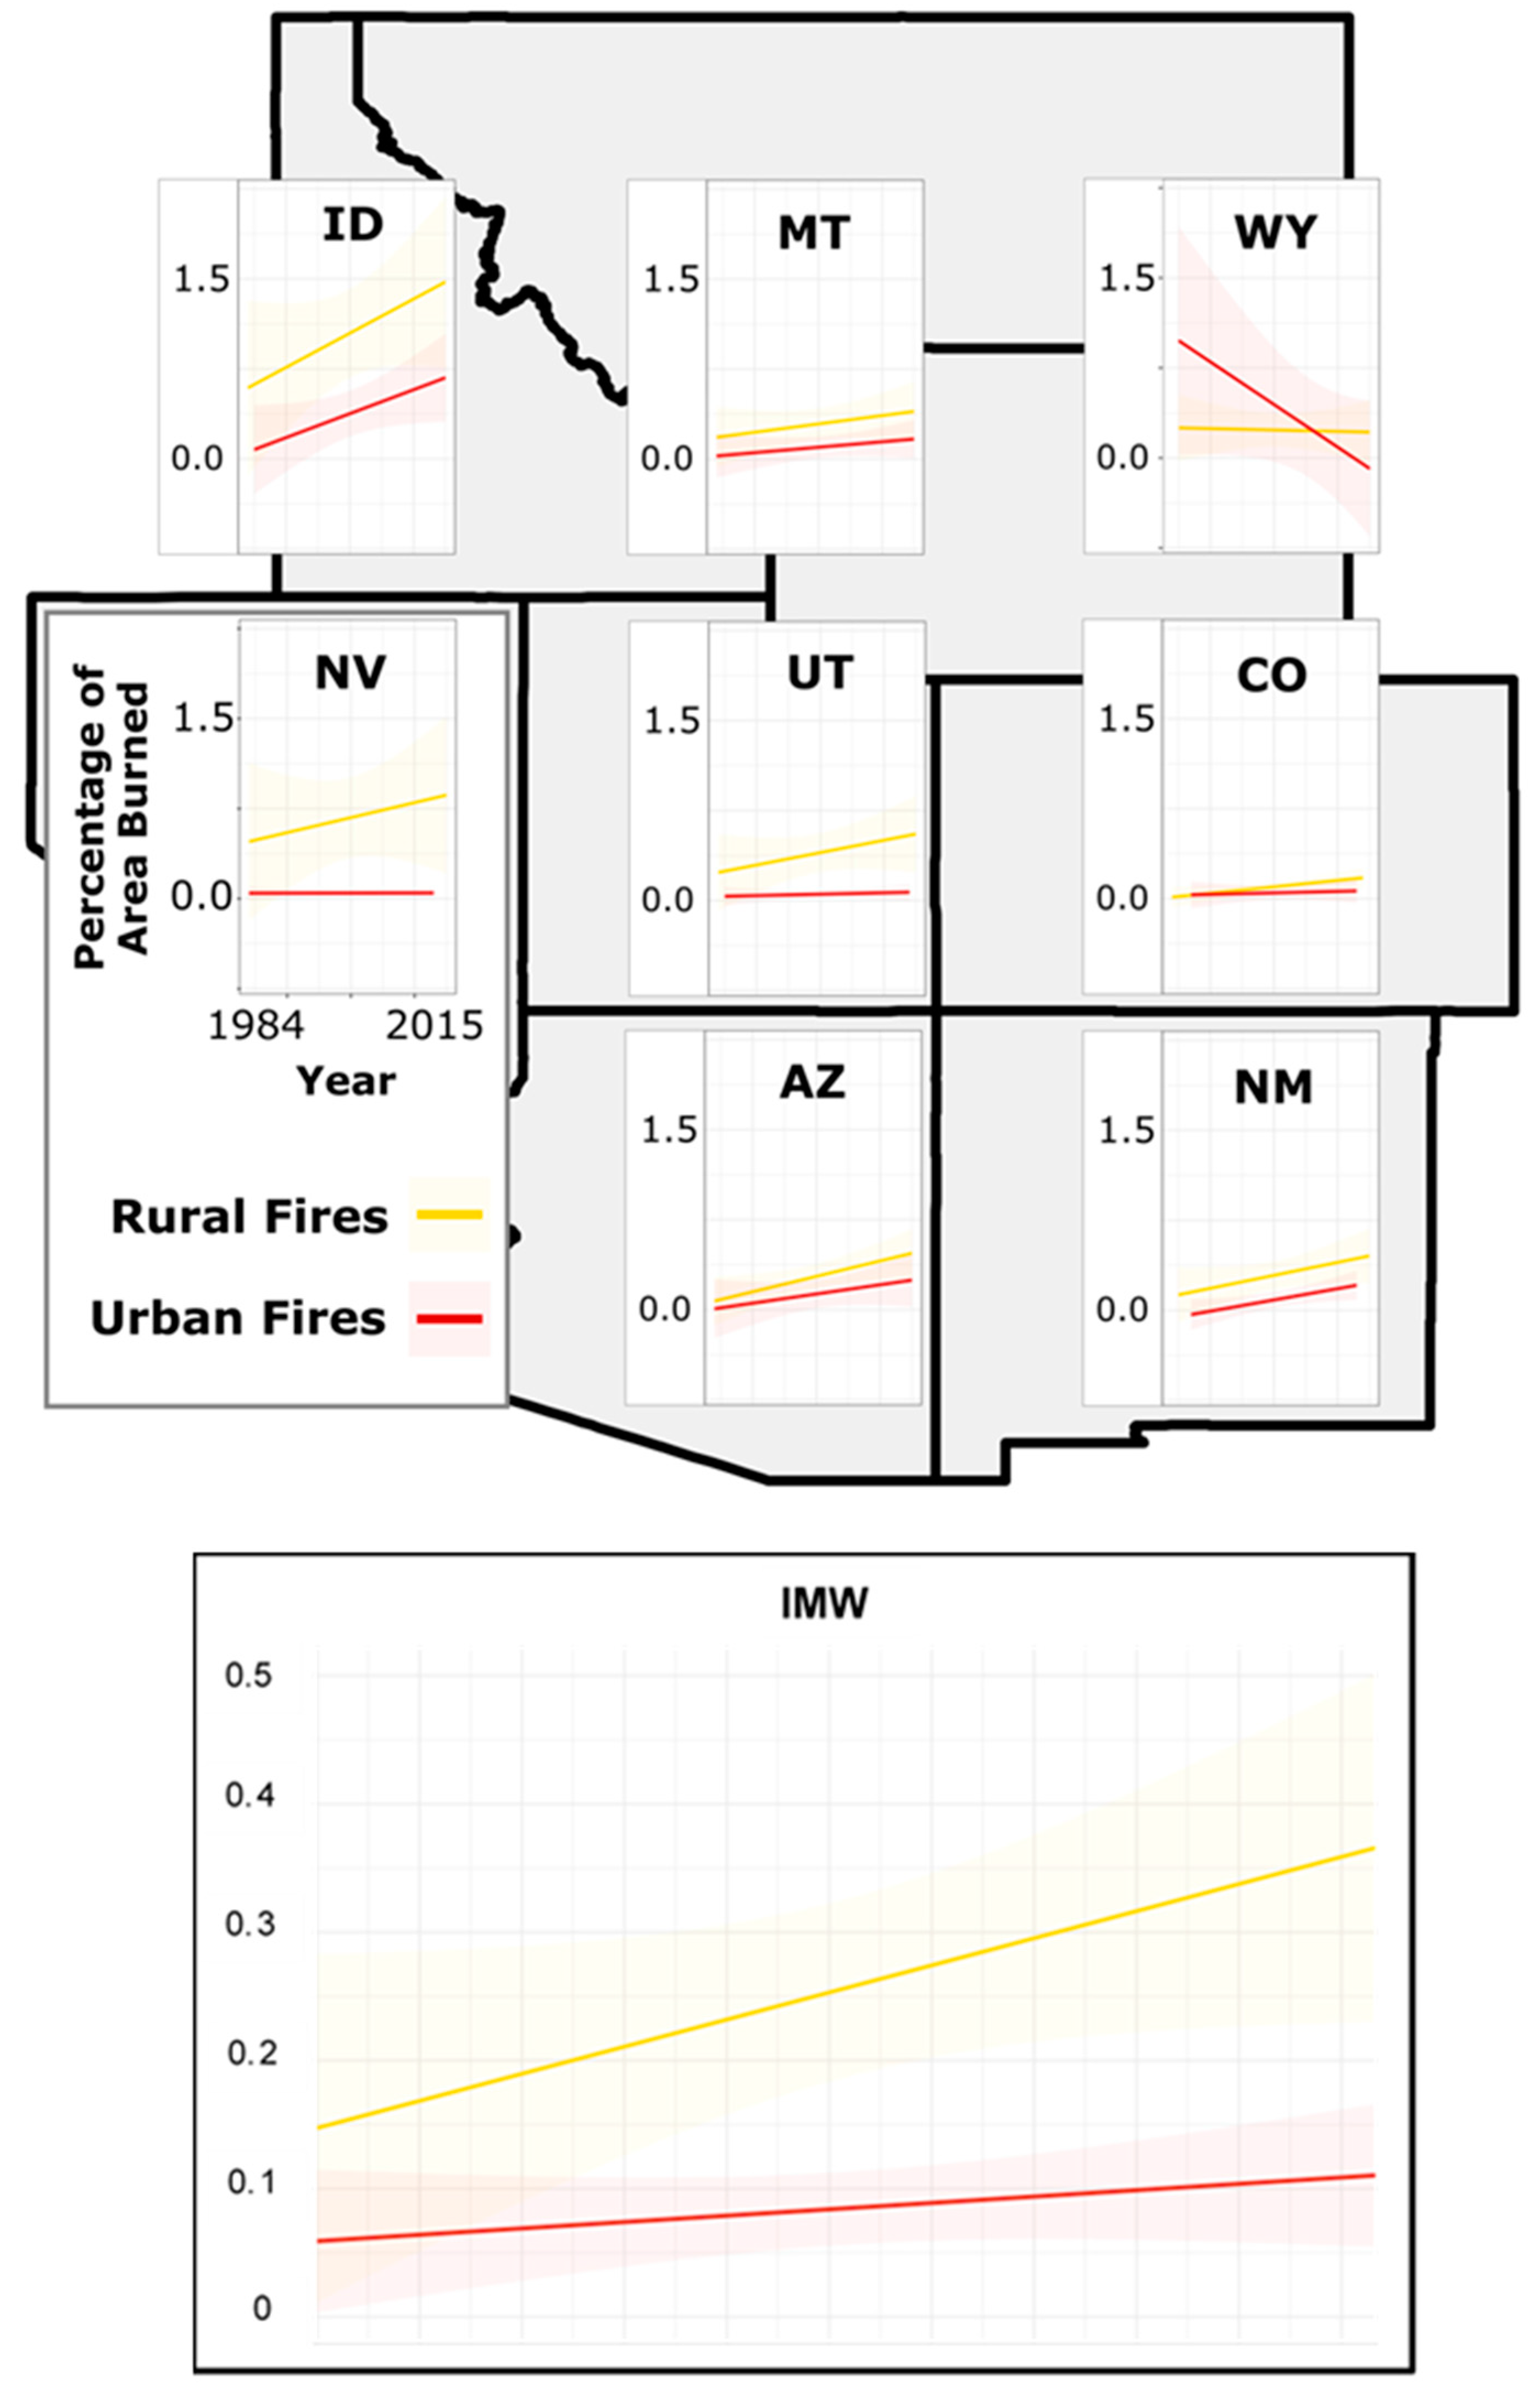
p < 0.10, 44/281 counties increased in area burned and 42/281 counties increased in fire frequency. At the state scale, Arizona and Colorado have significantly increased in burned area for rural fires (
p < 0.05) (
Table 2;
Figure 5). New Mexico (
p < 0.05) and Idaho (
p < 0.1) show significant increasing trends for area burned by urban fires (
Table 2;
Figure 5). Wyoming depicts a slight significant decreasing trend (
p < 0.1) in area burned by urban fires (
Table 2;
Figure 5). In contrast, fire frequency has significantly increased for rural fires in Arizona (
p < 0.05) and Montana (
p < 0.1) (
Table 2;
Figure 6). The apparent decreasing trend in area burned in Wyoming may be due to a historically large fire in Yellowstone National Park in 1988, which occurred at the beginning of our fire record and skewed the overall result. The same data, fit with the LOESS curve, are available in
supplementary information (Figures S6 and S7).
3.2. Economic Impacts of Fire
Fire can have a wide array of influences on local economies, including impacts on employment, property and infrastructure, air, water and soil quality, human health, costs associated with fire suppression or post-fire restoration, timber harvest and tourism [
22,
23,
24]. In this paper, we focus on employment as data are not available to quantify other impacts at the broad scale of our study. Employment data are readily available at a county scale in our time period and are evaluated monthly. As mentioned in the methods section above, we focused on a 6-month window after fires, because our employment and fire data indicated a 6-month cycle (
Figure 4). However, since other studies also find other significant effects after 6 months, we ran a 12-month model as well and included the results as
supplementary materials (Tables S1–S5). The results between the 6-month model and the 12-month model are similar, with most significant effects showing within the first 6 months. There are a few positive significant effects at the end of the 12-month model, which indicates potential longer-lagged effects on employment.
Total Employment (I) results generally yielded positive effects of fires for all four sets of regressions: All Fires, Rural Fires, Urban Fires and Increasing Focal Counties (
Table 3). Rural Fires and Urban Fires had differing impacts on affected county labor markets. Rural Fires had greater positive short-term impacts on affected county employment rate and were all statistically significant at the 90% level. In contrast, Urban Fires did not have a statistically significant impact on employment at the county level. We observed statistically significant increases for 4 months after a fire event when considering both All Fires and Rural Fires. For Increasing Focal Counties that we identified as having increasing area burned and/or fire frequency, we found statistically significant positive impacts up to 2 months after fire occurrence (
Table 3). Overall, the impacts were lower for total employment than the sub-sectors, which are discussed in depth below. However, the duration of these impacts was longer for total employment.
3.2.1. Fire Impacts on (1) Goods Producing & (2) Service Providing Sectors
We observed significant positive impacts for All Fires and Rural Fires for both (1) Goods Producing and (2) Service Providing sectors (
Table 4) but the impact decreases with each subsequent month post-fire. When we compared impacts between the (1) Goods Producing and (2) Service Providing sectors, the positive impacts were greater in the Goods Producing sector immediately during and one month after a fire (
Table 4 and
Table 5). The Increasing Focal Counties with increasing fire trends had the greatest total positive impact for the (1) Goods Producing sector during the month of fire ignition. However, when these results were compared to the (I) Total Employment regression results, these positive impacts were observed for a shorter period, less than one month post-fire.
3.2.2. Fire Impacts on (1a) Natural Resource and Mining & (2a) Leisure and Hospitality Sectors
Employment in the (1a) Natural Resource and Mining sector for All Fires, Rural Fires and Increasing Focal Counties all had statistically significant positive labor impacts for the month when a fire was ignited (
Table 6). The (2a) Leisure and Hospitality sector only had positive impacts two months after fire ignition for Rural Fires but these impacts are not large, had a low significance level and declined over time (
Table 7). Negative impacts for employment in the (2a) Leisure and Hospitality sector were observed in Urban Fires one month after ignition. For Increasing Focal Counties, negative impacts were observed for (2a) Leisure and Hospitality sector during the month of fire ignition and five months post-fire.
3.3. Qualitative Interview Results
Overall, 15 participants from the three areas chosen for further investigation recognized that area burned or fire frequency increased in their jurisdictions over the last 30 years. Within the positive responses, two managers said fire frequency is increasing, five managers said area burned is increasing and eight managers said both are increasing. Four managers responded with “It Depends” and cited the nuances of time period and specific area, which may span different jurisdictions and counties. When managers’ responses were compared with the calculated fire trends for their respective counties, seven responses matched with trends we observed in the MTBS database and seven responses had a partial match (stating either increased frequency or burned area when we identified a trend for both). Only two participant responses mismatched observed trends, either citing opposite trends from our analysis or no stated observed changes in fire trends (despite being selected for interviews because of an increasing fire trend) when a significant trend is actually observed in the data. These mismatches may be due to differences in jurisdictional boundaries from our county-level unit analysis or the fact that MTBS data includes only fires larger than 400 ha.
In general, most managers (14 participants) in the focused study areas said that changes in area burned and fire frequency influence decisions and adaptive practices in their jurisdictions, while four responded with ‘No’ and two with ‘It Depends.’
“Repeated large fires, in general, drives where to focus our mitigation and treatments as well as threatened communities.”
Adaptive strategies mentioned in response to changing fire trends are summarized in
Table 8. Many managers mentioned increased efforts to reduce fuels and treat the landscape.
“I think how we mitigate those fuels, where we do it and how we do it has changed quite a bit throughout the years. We’re putting more emphasis on mitigation work to try to get ahead of that, so that we’re not spending as much money and suppression to protect [values at risk].”
For decades, the predominant fire management paradigm in the U.S. prioritized fire suppression, with a more recent shift to longer-term planning on an ecosystem scale [
25,
45]. Fire managers also mentioned repeatedly that large fires have driven policies that encourage them to more creatively minimize the size and frequency of fires. Some mentioned the need to shift firefighting tactics, including the assumption that fires will grow larger sooner. One manager highlighted the agency-wide, growing efforts to treat more acres annually.
“There’s more of an emphasis right now in treating the landscape to make it more resilient and to make it so we have less catastrophic wildfires…[We] try to use natural ignitions to accomplish some of that, along with prescribed fire and mechanical treatment, to reduce fuel loads.”
Managers who said fire trends did not influence their management decisions cited the limitations of overarching fire suppression protocols that superseded the ability to enact local adaptation strategies. Overall, 18 of the participants are implementing some sort of adaptation practice regardless of fire trends. These practices include prescribed burns, mechanical fuel treatments, habitat restoration, fuel treatment experimentation, interagency cooperation and implementation of education and outreach programs. Managers emphasized the need for adaptation and mitigation work in order to control fuels, enhance suppression efforts and restore habitat.
“We’re trying to solve the fire problem by or at the landscape health level, not just by the fire itself but with restoration because of all the invasives like cheat grass, et cetera. Because if you restore the landscape, then our fire frequency would go down.”
While the majority of participants recognized changes in recent fire history, not everyone explicitly attributed these observed trends in fire to climate change. This result may be limited by the fact that they were not asked directly about this relationship during the interview—interviewers did not ask managers specifically if climate change influences fire frequency or area burned. Hence, opinions of climate change’s influence on these trends is not known for all participants. Regardless, whether or not managers perceived increasing trends being caused by climate change, the efforts of most managers to implement adaptation practices is helpful for climate resiliency.
When asked if wildfire influenced economies in their area, 17 of the managers said ‘Yes’ while three were unsure. Some managers recognized the short-term positive impact that fires had on local economies, including the boost in goods and services when fire management teams patronized businesses near the fire. The influx of money and resources necessary to support a vast number of fire employees for days, weeks, or even months at a time was noticeable, especially in smaller, more rural communities. However, participants more commonly cited the negative and often longer-term impacts that fire has on communities, including the effects of smoke on health and tourism, closures to recreation areas and grazing allotments, loss of structures and property, the evacuation of residents and the halt of commerce and e-commerce transportation with major road and highway shut-downs. While fire did increase the immediate opportunities for activities like salvage logging after the fire subsides, more often the negative long-term economic impacts for industries, such as sustainable timber harvesting, outweighed the short-term benefits. Managers spoke primarily about localized economic effects but our economic analysis shows that some of these effects can be generalized to a broader region, even as broadly as the entire IMW. These generalizations are discussed later in this article.
Most managers (16 participants) said that the economic impacts of fire influenced their management decisions, while four were unsure.
“As fire managers, [the economic impacts of fire] definitely does [influence decision-making]. And from the political aspect of it, the more you impact that economy, the more political pressure I think you’re going to get to resolve that situation quicker.”
Most managers claimed that they tried to minimize damages to life, property and resources on the landscape as mandated by national policy. Managers that were unsure either could not elaborate or said it “depends on values at risk.”
In light of the growing rural-urban divide in the IMW, the majority of managers (14 participants) cited differences in how they managed rural versus urban fires. Urban areas received the highest fire-fighting priority. Fires in rural areas allowed for more flexibility in management strategies but were overall more complex in their approach due to a greater number of partnered agencies and public community involvement. A Fire Management Officer interviewed said:
“[T]he difference between rural and urban definitely comes down to where the people are, the values at risk and what resources you have to work with … and what makes it a higher priority is—it’s a numbers game. More people, more structures, so it gains more [investment of resources].”
Participants who said they do not manage rural versus urban fires differently explained that the full suppression policy for their jurisdiction compels them to be aggressive in both settings, or that they base decisions on environmental factors or values at risk regardless of whether they occur in a rural or urban setting. Most managers spoke about the urgency and constraints of fighting fire according to mandated priorities of protecting life, property and values at risk in populated areas and the WUI, while addressing the greater flexibility to allow fires to burn in rural areas.
When asked about the primary challenges to effectively mitigate wildfire risk, the top three categories participants mentioned were limited funding and resources, bureaucracy and human behavior and education (
Table 9). These three challenges were all sociological-based limitations, compared to the physically-based limitations, such as changing fuel loads and future climate, which ranked fourth and sixth most mentioned, respectively. Managers said that budget cuts, limited resources and lack of personnel made it difficult to carry out mitigation projects or accomplish restoration goals. The U.S. Forest Service spends approximately 50% of its annual budget on fire suppression and estimates an increase to 67% of its annual budget (an increase to more than
$1.8 billion) by 2025 [
3]; however, the need for more funding to manage increasing fire on the landscape is stressing the already limited federal budgets. Bureaucratic challenges such as project delays, paperwork, conflicting conservation management goals and pushback from constituents, created serious limitations when working with multiple agencies or stakeholders. Some managers call for change “where the policy that’s being handed down and the budgets that are being handed down are coherent and they work together so that [fire managers] can do the work that [they] need to be doing.” Other participants said that educating and changing public perceptions about resource benefits from fires and altering human behaviors, specifically reducing human ignitions, increasing awareness and “getting private land owners to accept the responsibility of the risk” while helping mitigate along the ever-growing urban growth boundary, were the greatest challenges for fire management. One manager said:
“Communities are encroaching on the National Forest. There’s a lot of responsibilities that the landowners and the private landowners, private property owners, there’s a lot of responsibilities that they have to accept on fire because of the location of their homes…that’s the biggest thing that I’ve seen in the last 30 years is the occurrence of, the broadening of the Wildland Urban Interface, linear miles of it. It’s increasing and that adds complexity along with the fuels that you have and the weather that you have, the topography that you have and adding the Urban Interface and those structures, that adds a lot of complexity.”
Furthermore, while fuels mitigation was mentioned less than these socio-political challenges to adaptation, it was the most mentioned strategy impacted by fire trends (
Table 8). This suggests that while managers acknowledge adapting fuels work to observed fire trends is an ongoing effort, such proactive measures can be constrained by the social and political challenges they face.
Participants in the three different geographic regions had different responses for some of the top cited categories. The majority of managers in Idaho had different responses compared to those in Utah and Arizona when it came to bureaucracy (ID = 10 participants; UT = 0 participants; AZ = 1 participants) and shifts in federal administration and policy (ID = 4 participants; UT = 0 participants; AZ = 0 participants). While noting that the National Environmental Policy Act (NEPA) process is necessary for bureaucratic consent of all involved agencies, several Idaho participants mentioned it is difficult to accomplish projects in a timely manner. They further mentioned the difficulty and complexity of managing fire while also managing critical habitat and breeding area for the endangered Greater Sage Grouse (Centrocercus urophasianus). The conflicting management priorities of NEPA, Clean Air & Water Acts and special threatened and endangered species regulations restrict the window and flexibility for managers to allow fires to burn on the landscape. It creates “a big, big task getting caught up on those acres” for treatment and mitigation. While managers in Idaho cited the greatest challenges with bureaucracy and shifts in federal administration and policy for their work, there may be geographic differences in the challenges that managers face elsewhere.
4. Discussion
We have three primary findings regarding fire and management strategies in the IMW. First, wildfire trends are increasing in area burned and fire frequency across the IMW at the regional scale and for some counties and states. In the past 32 years, the IMW has experienced more frequent and larger rural fires and more frequent urban fires (
Table 2). However, this is not to say that all parts of the IMW are experiencing increasing fire trends. While we found significant trends at the regional level and for some states, there are clearly hotspots when looking at the county level. These hotspots are also not set over time, as counties that have not burned in our data time period may now have higher fuel loads. There are many potential reasons for increasing fire trends, including changing climate, changes in fire mitigation strategies and changes in management priorities. Across the entire Western US, recent increases in wildfire are closely associated with increases in fuel aridity and is largely driven by anthropogenic climate change [
46]. Our findings align with the argument that the predominantly dry IMW region is going to continue to be vulnerable due to high soil aridity [
6,
7]. Increasing burned area could be further affected by shifts in management practices away from the immediate suppression of fire, particularly in rural areas. Alternative strategies include fuels reduction (e.g., prescribed fires, mechanical treatment) and use of fires for resource benefit (e.g., allowing fires to burn where values are not at risk).
Secondly, fires have had both positive and negative effects on employment rates at the county scale over the last 15 years. The timing and magnitude of these effects varied depending on economic sector. Generally, we observed short-term positive impacts of All Fires and Rural Fires across the IMW at the county level (See
Table 3, Columns 1 & 2: All Fire & Rural Fire) immediately during and after a fire. These trends become weaker over time but do not become negative. Participants referred to this as the short-term boom and long-term bust to local businesses and livelihoods, which is consistent with other research findings [
23]. While we did see mostly short-term effects within the first 6 months after a fire, our study provides evidence of both short-term and long-term lagged effects with a few significant effects close to a year post-fire. When separating into the employment subsectors, fire had immediate positive impacts on the (1) Goods Producing category. Fires can increase local investment through the construction of new buildings and the rebuilding of destroyed structures, roads and utility infrastructure [
24]. These positive impacts are still present at the sub-sector level of (1a) Natural Resources and Mining. We are unable to fully account for this disconnect between immediate positive effects of fire and employment in the (1a) Natural Resources and Mining sub-sector. We expect that the full impacts of fires on this sector may be better quantified by more direct data, such as suppression costs, timber sale loss and finer scale data, such as the census block level employment data. Unfortunately, such data were not available for this study. In the (2a) Leisure and Hospitality sector, there is a negative effect on employment during the month of the fire, which is consistent with previous studies [
40]. Additionally, there are delayed positive impacts of all fires and rural fires across the IMW at the county level. The BLS defined the (2a) Leisure and Hospitality category as encompassing Arts, Entertainment & Recreation and Accommodation & Food Services and these delayed positive impacts, especially in rural areas, could be driven by the return of tourism to an area after a one- to two-month period of official restrictions or visitation avoidance after a fire [
22]. However, further analysis is needed to make this case, such as evaluating number of visitors to recreation areas. It should also be noted that there are other subsectors that may experience changes due to fire. Other studies were able to include additional subsectors of employment, such as construction and transportation and found significant effects [
41]. While we were able to find significance for the natural resource and leisure subsectors, we were unable to test effects for additional subsectors because there was insufficient data available for enough counties in other subsectors.
Third, most fire managers in the three areas in Idaho, Utah and Arizona acknowledged changing fire trends in their regions and are utilizing adaptive management strategies to mitigate changing fire patterns. They recognized some form of economic impact of fires and that these economic effects influence their management decisions. While we listed the number of participants who mentioned different topics to discuss the results of the interviews, we would like to emphasize that the more qualitative insights from the participants should be the focus when analyzing the interviews. This third component contributes to the limited literature on understanding the decision-making process of fire managers and policy-makers [
25]. The majority of managers interviewed feel the greatest challenges to fire adaptation are human factors, such as budget limitations, bureaucratic inefficiencies and human decision-making, rather than environmental factors, such as climate change and accumulation of excessive fuel loads (
Table 9). These human-related challenges are consistent with some of the wildfire risk literature, which calls for more landowner engagement in mitigation and adaptation [
47]. Through these interviews, we also found connections to our fire trend analyses. Implementation of new fire mitigation techniques and improved firefighting efficiency, both of which are discussed in the interviews, may serve to counteract increases in area burned and/or fire frequency. For example, thinning, prescribed burning and the creation of fire breaks have been implemented into many management plans to help reduce the size and severity of wildfires. There was some variance in the interviews, in terms of the adaptation strategies used by managers. This could be due to the differences in local context and the lack of larger-scale policies and alternatives for climate adaptation. While there was some variation, overall, there was general consensus in what influences managers’ decisions and the challenges they face. These interviews provide in-depth insight to managers’ perspectives in areas that have experienced increasing fire trends. However, they are limited in generalizability to the IMW. Future research on fire management, decision-making and policy could contribute to the literature with studies with larger sample sizes across varying fire trend contexts.
The findings for the three sub-research questions of this study inform and support one another (
Figure 1). Our study is the first to document a positive trend in area burned and fire frequency at multiple scales for the IMW region and furthermore, to parse those trends into urban and rural settings and explore the effects of those wildfire trends on local economies and adaptive management practices. Notably, we find that wildfire characteristics are increasing significantly but are spatially variable throughout the IMW. While fire managers in places experiencing increasing trends are generally aware of and adapting to those trends, many are experiencing limitations in adaptive capacity, which may become increasingly problematic in the predicted warmer and drier future in the IMW. Our qualitative interviews augmented our economic analysis as participants provided information regarding costs and risks for which quantitative economic data do not exist, including impacts on recreation and tourism. At the same time, the positive economic benefits observed several months after fires in our economic analysis (
Table 4) were also captured in our qualitative interviews with managers who mentioned that burned areas can be logged for salvage timber. The economic analyses for the Increasing Focal Counties are in line with what managers said in interviews as well. For these focal counties, we find much larger negative impacts for (2a) Leisure and Hospitality than the other counties, indicating that more frequent or larger fires subsequently decrease tourism and recreation activity.
This study has been conducted based on available secondary data on fires and employment and the primary interview data we collected. Each dimension of the research had limitations that should be acknowledged. The fire trend analysis based on the MTBS dataset is limited to fires over 400 ha, thus overlooking smaller fires, which may be important, especially in urban settings. Economic data on fire suppression costs is not publicly available across the IMW study area, thus precluding a more direct analysis of fire-related economic impacts. Furthermore, our economic analysis of employment impacts of fire is limited to the last 15 years. Time and resource constraints limited the number of interviews with fire managers that could be conducted as well as the number of counties or areas that could be selected for this part of the investigation. Collectively, these data limitations inhibit generalization of findings across the study area and time period. Nevertheless, the insights provided here suggest trends and impacts related to fire are worthy of further investigation.
Our findings demonstrate that fires have significant economic impacts on affected communities and that changing fire trends and economic effects influence the decision-making and planning of fire managers. The interdisciplinary nature of this research highlights the interconnectedness of the physical, economic and social aspects of fire and answers the call to utilize interdisciplinary approaches to address these complex social-environmental issues [
48]. Our approach provides a novel and more holistic view of fire management that is often lacking. Lastly, our research contributes valuable insights into changing fire trends, the economic impacts of fire and perspectives of fire managers in a rapidly changing landscape.

 ,
, 


