
Bushfire-Resistant Lightweight Masonry Blocks with Expanded Perlite Aggregate


Centre for Materials Science, Faculty of Engineering, Queensland University of Technology (QUT), Brisbane 4000, Australia
*
Author to whom correspondence should be addressed.
Fire 2022, 5(5), 132; https://0-doi-org.brum.beds.ac.uk/10.3390/fire5050132
Submission received: 12 August 2022
/
Revised: 25 August 2022
/
Accepted: 26 August 2022
/
Published: 30 August 2022
(This article belongs to the Special Issue Performance-Based Design in Structural Fire Engineering, Volume II)
Abstract
:During bushfires, one of the building elements that is directly exposed to embers, radiant heat and direct flames is the “wall” element. This study investigated the feasibility of using expanded perlite aggregate in masonry (i.e., cement) blocks to enhance their bushfire resistant characteristics. The chemical, physical, and thermal properties of expanded perlite aggregate were determined first and then masonry block cement mixes were developed by replacing sand in the conventional mix with expanded perlite aggregate by volume at different percentages (100, 80, 60, and 40%). The properties of fresh and hardened cement mixes (slump, density, compressive strength, and water absorption) were measured. The developed masonry blocks were exposed to Bushfire Flame Zone conditions (i.e., 20–842 °C) and the standard fire curve for three hours (i.e., 20–1110 °C) to assess their resistance to bushfires and building fires, respectively. The properties of Cement–Expanded Perlite mixes were compared with those of the standard Cement–Sand mix. The test results showed that the use of perlite aggregate reduced the workability, density, and compressive strength of the cement mix while increasing the water absorption and fire resistance level. All the developed perlite blocks were lightweight and had three hours of fire resistance level (-/180/180). When exposed to bushfire flame zone conditions, the blocks made with 100, 80, and 60% perlite satisfied the maximum ambient surface temperature limit. Of these, masonry blocks made with 60% perlite aggregate are the most suitable for use in external walls of bushfire shelters and residential and commercial buildings in bushfire-prone areas.
1. Introduction
During warmer months of the year, bushfires (“wildfires” in North America and “forest fires” in Europe) are a frequent natural hazard in many parts of Australia, New Zealand, Canada, Spain, Greece, and the USA due to climate change, improper vegetation and land management practices, and increased human settlements in or adjacent to bushland areas [1]. Bushfires adversely affect living entities, properties, livelihoods, and the environment. They are ignited naturally through lightning or artificially through deliberate lighting (e.g., arsons or fire authority planned burnings) or human activities (e.g., campfires and risk reduction controlled burns) [2]. The severity level of a fire becomes high under extreme conditions such as high temperature and fuel loads, low humidity, strong winds, and limited firefighting resources [3].
One of the critical elements of a building that is exposed to embers, radiant heat, and direct flames of bushfires is the ‘wall’. According to damage assessment reports, conventional wall systems such as masonry and steel and timber framed wall systems have not always performed well against bushfire attacks. At extreme temperatures, steel frames deform, timber frames and wall claddings burn, and masonry cracks.
In recent years, many research studies have focused on developing lightweight building materials such as concrete, masonry blocks, and mortar to reduce energy consumption in buildings. Lightweight building materials can be developed either by adding lightweight aggregates that have bulk densities less than 1120 kg/m3 or that form pores by aeration with little or no addition of fine aggregates [4,5]. Natural and artificial lightweight aggregates such as pumice, scoria, vermiculite, expanded perlite, expanded clay, and construction, agricultural, and industrial wastes can be incorporated in clay and cement mixes to achieve optimum thermal and strength properties compared to conventional building materials. Although these lightweight building materials are thermally efficient at ambient temperatures, their fire resistance is not well understood.
Among the lightweight aggregates, perlite is a glassy volcanic material which expands to 5 to 20 times compared to its original volume when heated to 900–1200 °C. This new material is called expanded perlite. Its bulk density and heat conductivity are within the range of 30–190 kg/m3 and 0.04–0.05 W/mK, respectively, while its specific heat is around 837 J/kg°C. Thanks to its porous, lightweight, high heat resistance and sound and thermal insulation properties, it is used as an insulation material and cement/aggregate substitution/addition in the construction industry, as a soil conditioner and an artificial fertilizer in the agricultural industry, as a filter and absorbent in the chemical industry, and more [6,7].
Several past studies have developed lightweight cement mixtures with expanded perlite either by replacing cement or normal weight aggregates [7]. The most commonly tested properties in those studies were compressive and flexural strengths, unit weight, water absorption, and thermal conductivity. It was observed that compressive strength, unit weight, and thermal conductivity decreased with the addition of expanded perlite, while water absorption increased. For example, a unit weight of 435 kg/m3 and thermal conductivity of 0.1472 W/mK were recorded for a mix of cement and expanded perlite in [8]. Al-Tamimi et al. [9] developed a hollow concrete block with optimum geometry design made with perlite aggregate which showed a 70% lower thermal conductivity value (0.309 W/mK) than those of conventional blocks (0.72 W/mK). Studies have been conducted with a combination of two lightweight aggregates together (i.e., pumice and perlite) in conventional cement mixtures by replacing conventional aggregates [8,10]. Both the cement mixtures and the thermal properties of clay bricks have been improved by the use of expanded perlite. Topcu and Isikdag [6] produced a high heat resistance clay brick by mixing perlite with clay; its thermal conductivity was 0.22 W/mK compared to 0.47 W/mK for a standard brick. Zokowski and Haese [11] developed a thermally resistant brick by filling the holes in a hollow brick unit with perlite. The above studies mostly focused on the physical, mechanical, and thermal properties of new mixes/units at ambient temperature.
On the other hand, only a few studies have been conducted to investigate the effect of incorporating perlite on the mechanical properties of cement mixes/elements after exposure to elevated temperatures for specific periods of time [12,13,14]. For example, Hodhod et al. [14] observed that concrete columns with perlite–cement plaster coating showed improved resistance in terms of residual load capacity after elevated temperature exposure compared to specimens coated with traditional cement plaster. Although these new mixes/specimens have shown improved mechanical properties at elevated temperatures, no studies are available to aid in understanding and predicting their behavior during real fire events such as bushfires, building fires, and hydrocarbon fires [15].
Hence, this study aims to develop lightweight masonry (i.e., cement) blocks with expanded perlite aggregate and assesses their physical properties, compressive strength, and bushfire and building fire resistance, then propose a suitable masonry block composition for bushfire resistance using expanded perlite aggregate for applications in the external walls of shelters and residential and commercial buildings in bushfire-prone areas as an alternative to standard cement–sand blocks. In this paper, the properties of cement, sand, and expanded perlite aggregate are presented first, followed by Cement–Sand (C-S) and Cement–Expanded Perlite (C-PE) mix designs and details of mixing. Then, the test parameters, specimen details, and procedures are discussed. In the last section, the physical properties, compressive strengths, and fire test results of C-S and C-PE mixes are presented and discussed.
2. Experimental Program
2.1. Materials
The materials used in this study were cement, sand, expanded perlite, and tap water (Figure 1). The properties of cement and aggregates were determined as per the relevant standards; details are provided below.
2.1.1. Cement
General purpose cement with more than 92.5% Portland cement was used as the basic cementitious component for all the mixes; its chemical composition is shown in Table 1. The measured specific gravity of the cement was 3.06 and the 7th, 14th, and 28th day compressive strengths of the cement mortar cubes were 35, 43, and 49 N/mm2, respectively [16,17].
2.1.2. Sand
Locally available natural sand (particle size less than 4.75 mm) was used in this study; the fineness modulus was 3.2. The measured average values of the specific gravity and water absorption in saturated surface dry (SSD) conditions were 2.57 and 0.1%, respectively [18]. The average uncompacted bulk density of the sand was 1532 kg/m3 [19].
2.1.3. Expanded Perlite
Expanded perlite aggregate purchased from Ausperl Pty Ltd., Australia was used as the lightweight aggregate; its chemical composition is shown in Table 1. Figure 2 shows microscope images of expanded perlite particles. As shown in these images, expanded perlite has a thin-wall porous structure in which different sizes of pores are interconnected, making it more lightweight and water absorbent, as well as good for sound and thermal insulation. The measured physical properties of the expanded perlite included an uncompacted bulk density of 111 kg/m3, specific gravity (SSD) of 0.73, and water absorption (SSD) of 188.1%. The average particle size distributions of sand and expanded perlite aggregate are shown in Figure 3; more than 80% of the perlite aggregate was in the range of 1.18 and 4.75, mm and the fineness modulus of the expanded perlite aggregate was 4.5.
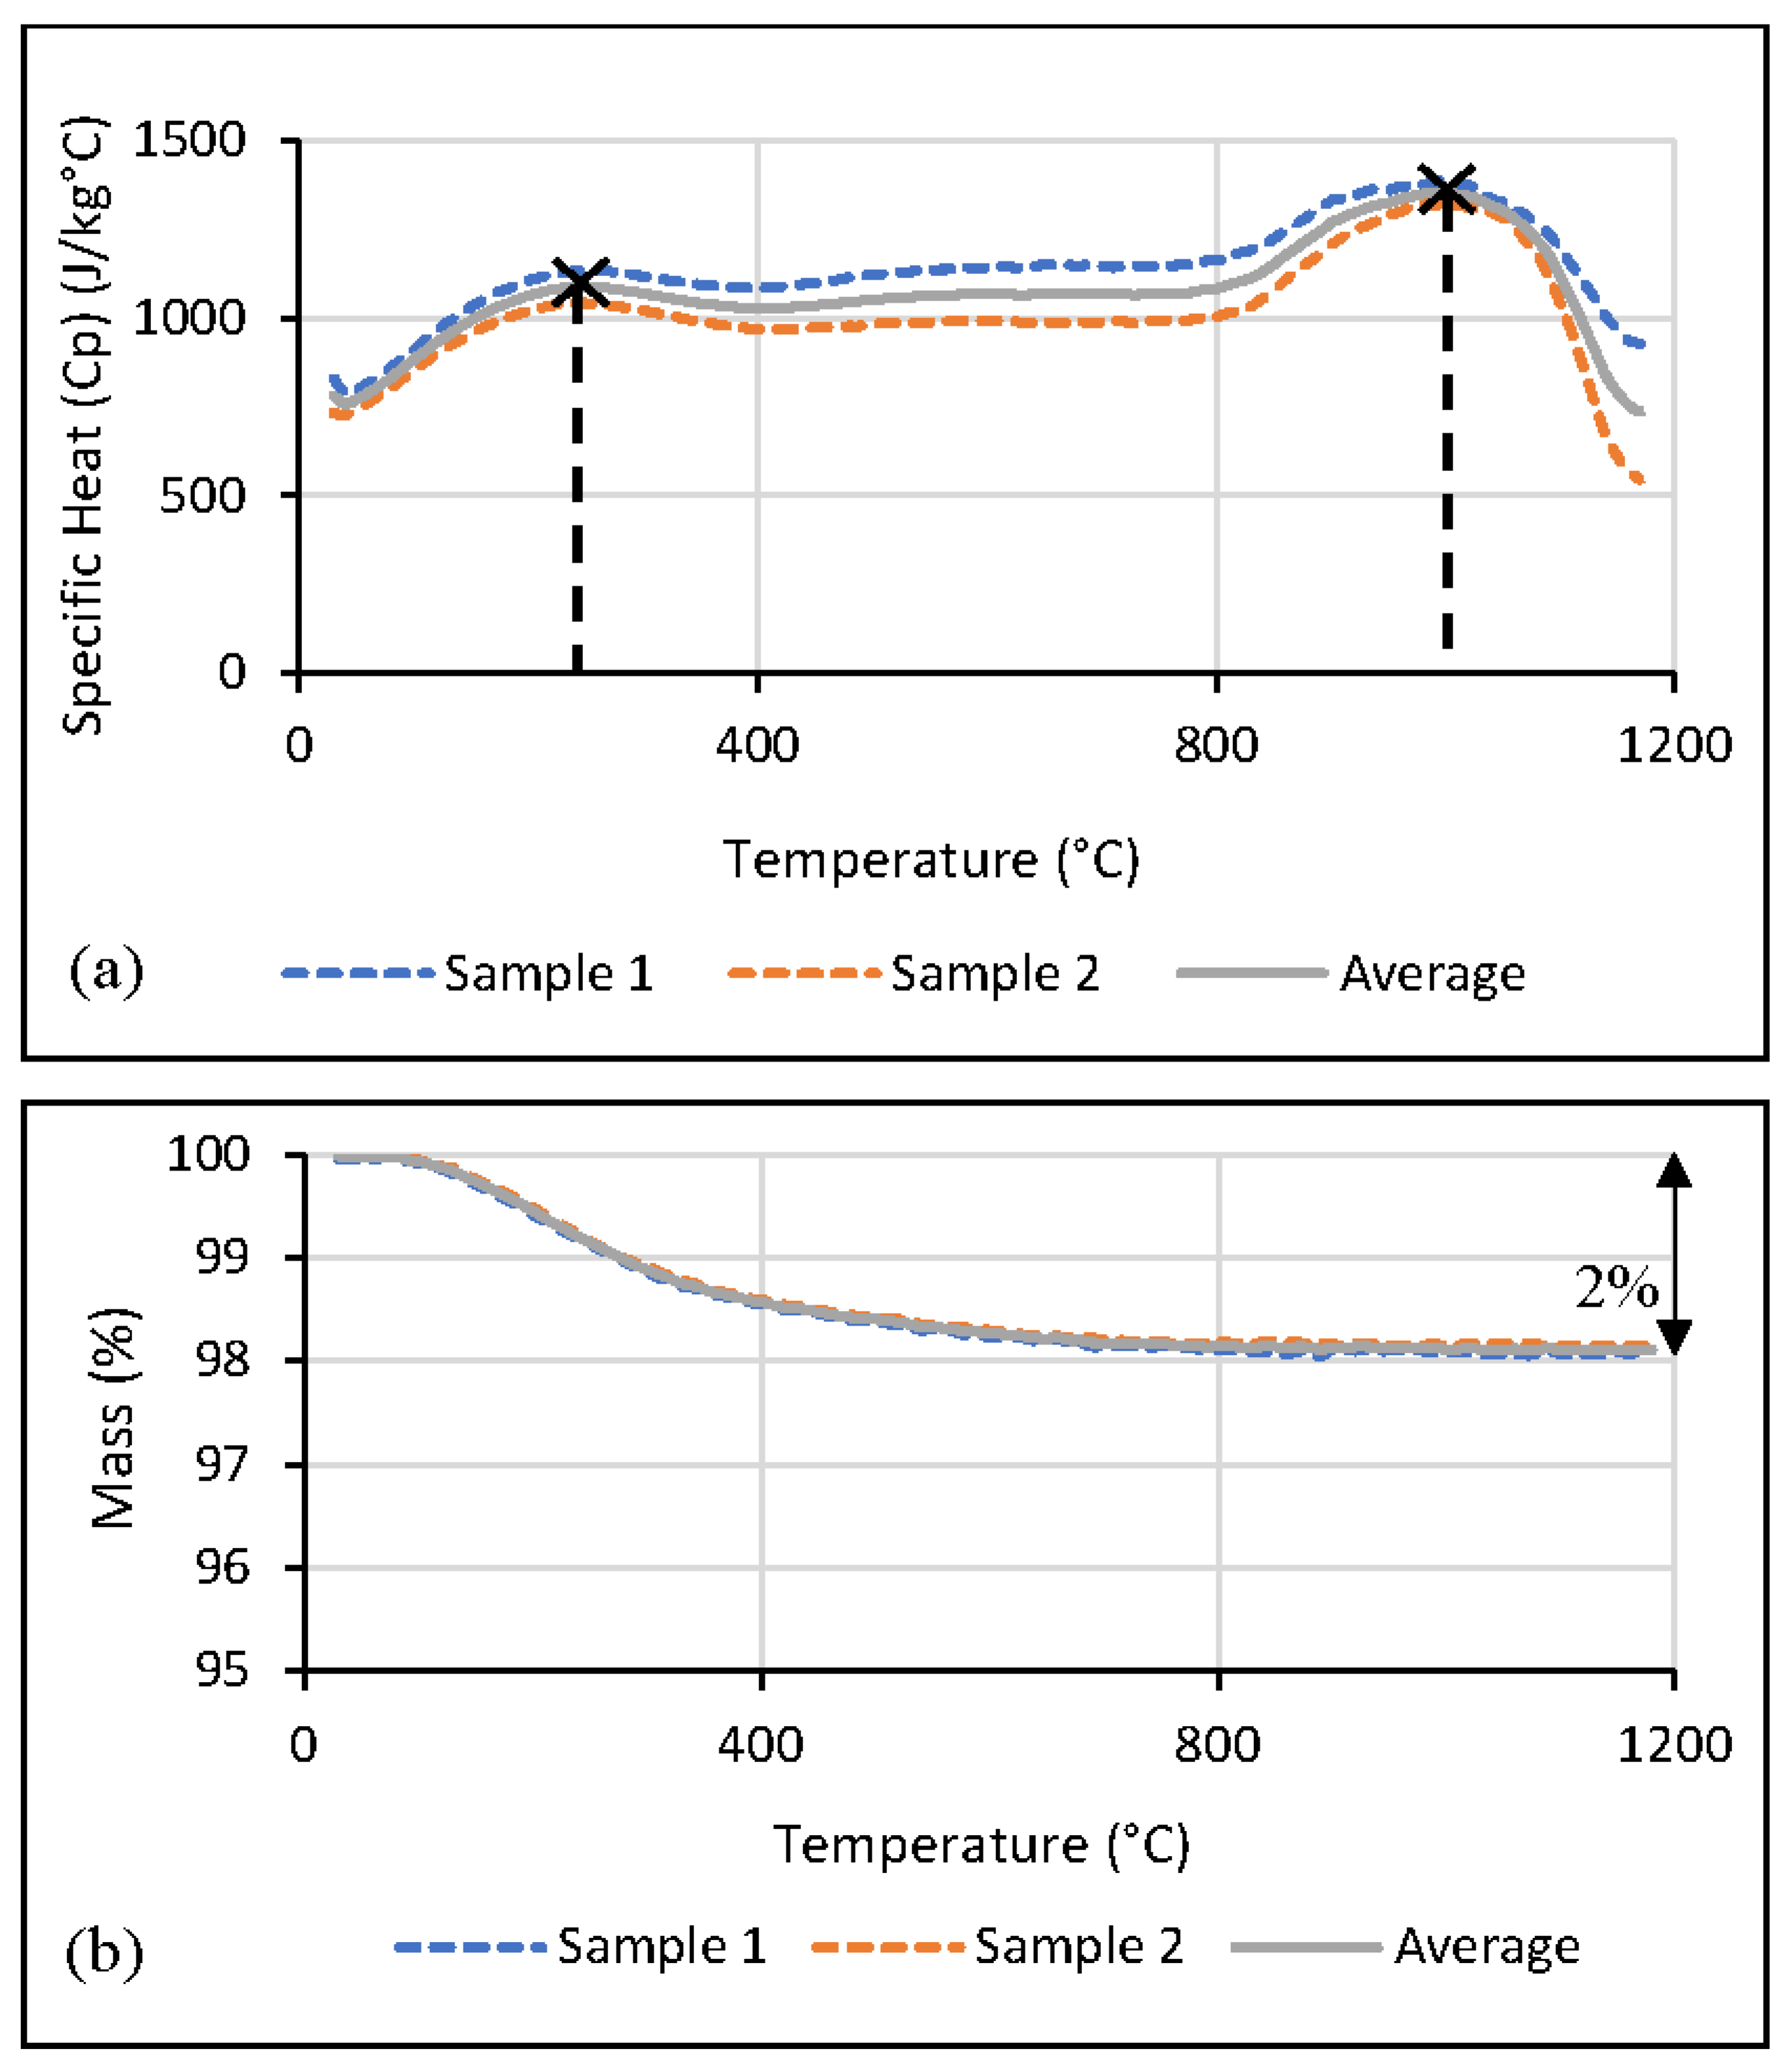
In addition to the chemical and physical properties of perlite aggregate, thermal properties such as specific heat, mass loss, and thermal diffusivity at elevated temperatures (Figure 4 and Figure 5) were determined using simultaneous thermal and laser flash analyzers.
The initial specific heat capacity of the expanded perlite was around 780 J/kg°C. The specific heat graph shows two peaks at around 250 and 1000 °C, which correspond to dehydration and melting of the material, respectively. The total mass loss at 1200 °C was only about 2%. Based on the thermal diffusivity results, the initial value of 0.37 mm2/s was increased to 0.49 mm2/s at 500 °C. Hence, the thermal conductivity of expanded perlite at 30 and 500 °C can be approximately calculated as 0.03 and 0.04 W/mK, respectively.
2.2. Mix Design
In the experimental study, both standard Cement–Sand (C-S) and Cement–Expanded Perlite (C-PE) mixes were proposed. In the C-S mix, the cement to sand ratio at the mixing stage was 1:3 and the effective water to cement ratio was 0.6:1. Then, the sand in the standard mix was replaced by expanded perlite based on the equal volume basis and the replacement ratio was increased from 40% to 100% with steps of 20%. The mixes with less than 40% of perlite did not satisfy the density requirement of lightweight concrete masonry units in ASTM C90-16a [20]. The mixes were proportioned by the absolute volume method, in which the saturated surface dry (SSD) volume of each ingredient (m3) results in one cubic meter of cement mix. For all the mixes, the entrapped air content was assumed to be 2% of the total cement mix volume.
Table 2 shows the proportions and cement mixes. The mixes were designated as C-S and C-PE, which denote the standard Cement–Sand and Cement–Expanded Perlite mixes, respectively. The numbers (100, 80, 60, and 40) following C-PE indicate the percentage of sand replacement by perlite.
As seen in Table 2, the effective water occupies the space outside the aggregate particles; to maintain the effective water/cement ratio constant considering the high absorption of water by lightweight aggregate, the lightweight aggregate was pre-soaked with water to ensure the SSD condition by conducting an aggregate cone test before mixing with other components (Figure 6).
2.3. Details of Mixing
All the cement mixes were prepared in a pan mixer as per AS 1012.2-2014 [21], AS 1012.8.1-2014 [22], and ASTM C192/C192M-18 [23]. In order to produce a homogeneous mix, the materials were mixed in the following sequence:
- (a)
- Fine aggregates were added to the mixer and mixed for ½ min;
- (b)
- Cement was added and covered with aggregates to minimize the loss of cement powder during mixing;
- (c)
- After 1 min of mixing, the effective water quantity was added and mixing was continued for another 1 min;
- (d)
- The mix was kept at rest for 2 min, then mixing was started again for another 2 min.
After the mixing procedure, the test specimens (see Table 3 and Figure 7) were cast within the next 20 min. All the specimens were covered to prevent loss of moisture and kept on a rigid horizontal surface for a period of 18–36 h at a temperature of 23 ± 2 °C. After the initial curing, they were de-moulded and kept under the standard moist curing conditions by storing them in lime saturated water at a temperature of 23 ± 2 °C until 28 days.
2.4. Details of Tests
2.4.1. Workability of Fresh Cement Mix
2.4.2. Fresh Density
Mass per unit volume of the fresh cement mix was determined as per AS 1012.5-2014 [26] and ASTM C138/C138M-17a [27]. If compaction was carried out by hand (for slumps greater than 40 mm), the measure was filled in three equal layers and each layer was rodded 25 times. If the compaction was carried out by external vibrators (for slumps less than 40 mm), the measure was filled in two equal layers and each layer was vibrated until the surface became relatively smooth. The density was calculated by dividing the mass of fully compacted mix in the measure by the volume of the measure determined in accordance with AS 1141.4-2000 [19].
2.4.3. Compressive Strength
Compressive strength tests of 100 mm diameter cylinders were conducted according to AS 1012.9-2014 [28], ASTM C39/C39M-18 [29], and ASTM C617/C617M-15 [30]. After 28 days of curing, the compressive strength was determined using the universal testing machine by applying a force at a rate of 0.3 N/mm2/s until failure (Figure 8). The compressive strength of moist cured specimens was measured soon after their removal from the moist storage. The compressive strength of the specimens was calculated by dividing the maximum force applied to the specimen by the cross-sectional area. Further, the unconfined compressive strength was calculated by multiplying the experimental compressive strength from the aspect ratio of 0.78 in AS/NZS 4456.4-2003 [31].
2.4.4. Hardened Density
2.4.5. Water Absorption
2.4.6. Fire Resistance of Masonry Blocks
Both bushfire and building fire resistance tests were conducted for C-S and C-PE blocks. The bushfire resistance of blocks was measured by exposing a block to the standard fire curve for 30 min and then allowing it to cool down naturally for the next 60 min, simulating the bushfire attack level flame zone (BAL-FZ) test condition in AS 1530.8.2-2018 [36]. Building fire resistance levels of blocks were obtained based on AS 1530.4-2014 [37] by exposing them to the standard fire curve for three hours under non-load-bearing conditions.
The block specimens were air dried for at least one week after moist curing prior to any fire resistance tests. Among the air dried blocks, the block specimens for the BAL-FZ test were conditioned again inside a controlled environment (i.e., at a temperature of 25 ± 2 °C and relative humidity of 45 ± 5%) for at least one week prior to the fire test. Prior to the fire test, the moisture content was within the range of 10–20% for the C-PE blocks and around 5% for the C-S blocks.
Three K-type wired thermocouples were attached to the blocks at mid-height on fire-exposed and ambient surfaces. A rod-type thermocouple was kept inside the furnace to measure the furnace temperature. A typical fire test setup and thermocouple arrangements on the masonry block is shown in Figure 9 and Figure 10.
3. Results
3.1. Standard Cement–Sand (C-S) mix
The fresh and hardened properties of the standard mix are provided in Table 4. As shown in Figure 11, slump testing (35 mm) confirmed the better workability of the mix from the gradual movement of the cement slump cone with tapping of the side. Therefore, the cast specimens had smooth surfaces without any aggregate bulges, and cracks and sand particles were distributed uniformly across the section (Figure 12 and Figure 13).
The 28th day average compressive strength and hardened density of SSD samples were 33.6 N/mm2 and 2150 kg/m3, respectively (Table 4). Side fracture at the top of the cylinders was the common compression failure pattern (Figure 14). The average water absorption of the C-S mix was 9.0% (178 kg/m3).
3.1.1. Bushfire Test of C-S Block
Figure 15 shows the surface of a block during and after fire exposure. After 15 min of heating, moisture patches appeared on the ambient side surface and then disappeared at the end of the heating phase. After 90 min of testing, cracks were observed on all sides of the block except on the ambient surface. Most of the cracks were generated from the fire-exposed surface to the ambient side, and crack intensity was higher on the fire-exposed surface. Discoloration of the block was noticed on the top, bottom, and side surfaces. However, no gaps or openings to the ambient side of the block were formed from fire, with no flaming observed on either side of the block during the test.
Figure 16 and Table 5 show the time–temperature curves of the fire and ambient side surfaces of C-S blocks from the bushfire test and a summary of the bushfire test results, respectively. The initial ambient surface temperature was 20 °C. At the end of the heating phase (i.e., after 30 min), the average temperature on the fire and ambient side surfaces were 773 and 71 °C, respectively. Then, the temperature on the fire side surface started to decrease while the temperature on the ambient side surface started to increase. A maximum ambient surface temperature of 89 °C was recorded during the cooling phase at 55 min, after which the ambient surface temperature started to decrease as well. At the end of 90 min of testing, the average ambient side surface temperature was 76 °C.
3.1.2. Building Fire Test of C-S Block
Building fire testing was conducted on an air-dried C-S block using the standard fire curve. At 20 min after starting the test moisture began to be released from the ambient side of the block, as shown in Figure 17, which continued until about 8 min and then disappeared. The test was continued for three hours, and no significant observations were noticed. Figure 17 shows the surface of the block during and after three hours of fire exposure. Major spalling was observed on the fire side, and cracks can be observed on all sides of the block. Crack intensity was higher on the fire side. Discoloration of the block was observed on both the top and bottom. A whitish color was commonly observed in the concrete when exposed to more than 700 °C [38]. However, the same discoloration was not observed on the fire side, even though it was exposed to more than 700 °C.
Figure 18 shows the time–temperature curves of the fire and ambient side surfaces of the C-S block from the building fire test. The fire side surface temperature profile closely followed the standard fire curve after 50 min. The reduction in initial temperatures could be due to the malfunctioning of the thermocouples and/or the release of moisture from the block. The average ambient surface temperature remained constant at about 20 °C for 10 min and then started to increase until it reached around 242 °C at the end of three hours. Because the initial ambient surface temperature was 20 °C, insulation failure occurred when the average ambient side surface temperature reached 160 °C (i.e., 140 + 20 °C). Hence, as shown in Figure 18, insulation failure of the C-S block occurred at approximately 115 min. However, no integrity failure was observed throughout the experiment. All the test results are summarized in Table 6.
3.2. Cement–Expanded Perlite (C-PE) Mixes
The fresh and hardened properties of the perlite mixes are provided in Table 4. The workability of the C-PE 100 mix was 20 mm and increased significantly to 100, 180, and 210 mm when the sand content was increased by 20, 40, and 60%, respectively, as shown in Figure 19. The fresh density varied from 1138 to 1755 kg/m3 as the sand content was varied from 0–60%. The difference between the experimental and theoretical fresh densities (Table 2) was only about 5% because of the mixing of components and ensuring of the SSD condition of the perlite aggregate prior to mixing. Figure 20 shows the cross-section of a cured perlite sample containing angular perlite aggregate. Further, Figure 21 demonstrates the surface texture of the cast cylinders and solid masonry blocks, showing the improved surface finish with the addition of sand.
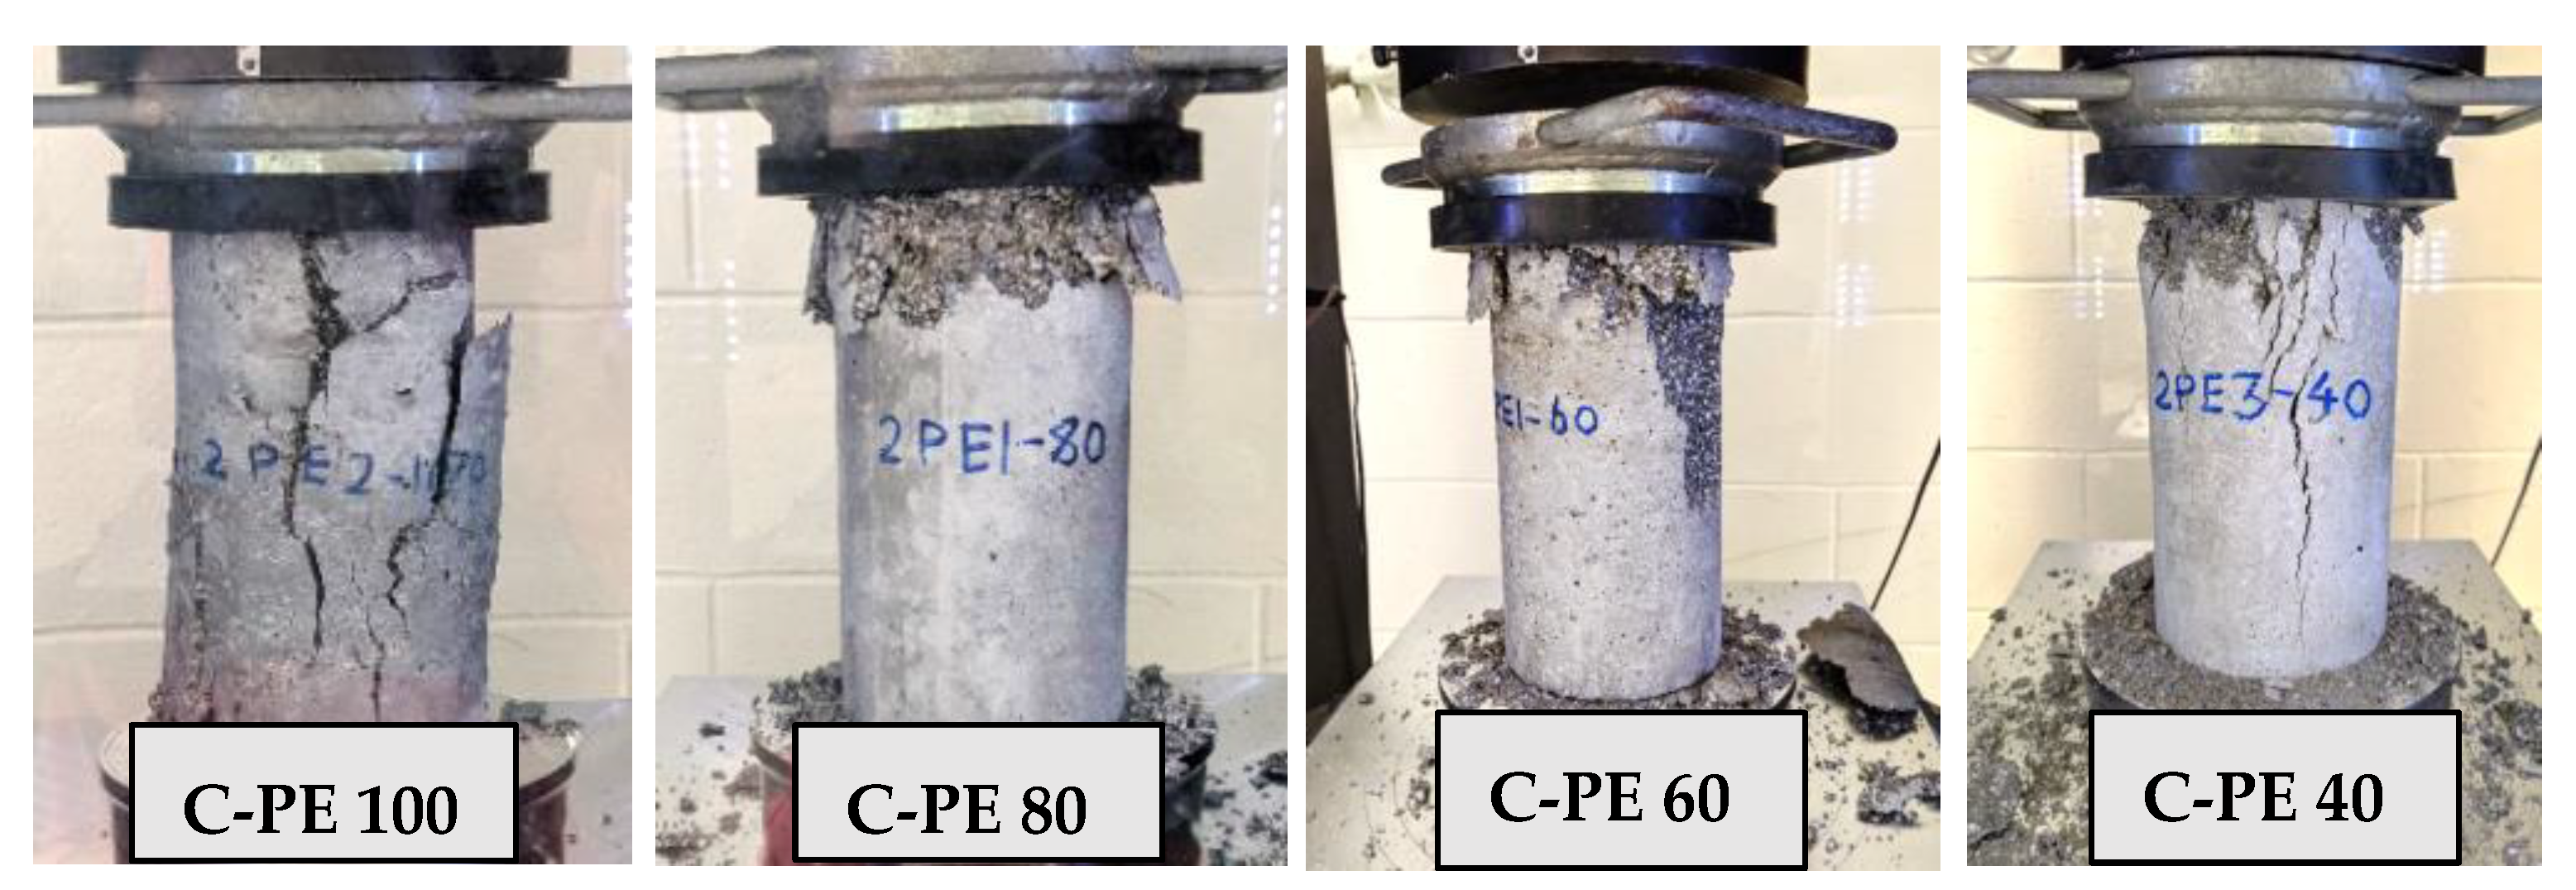
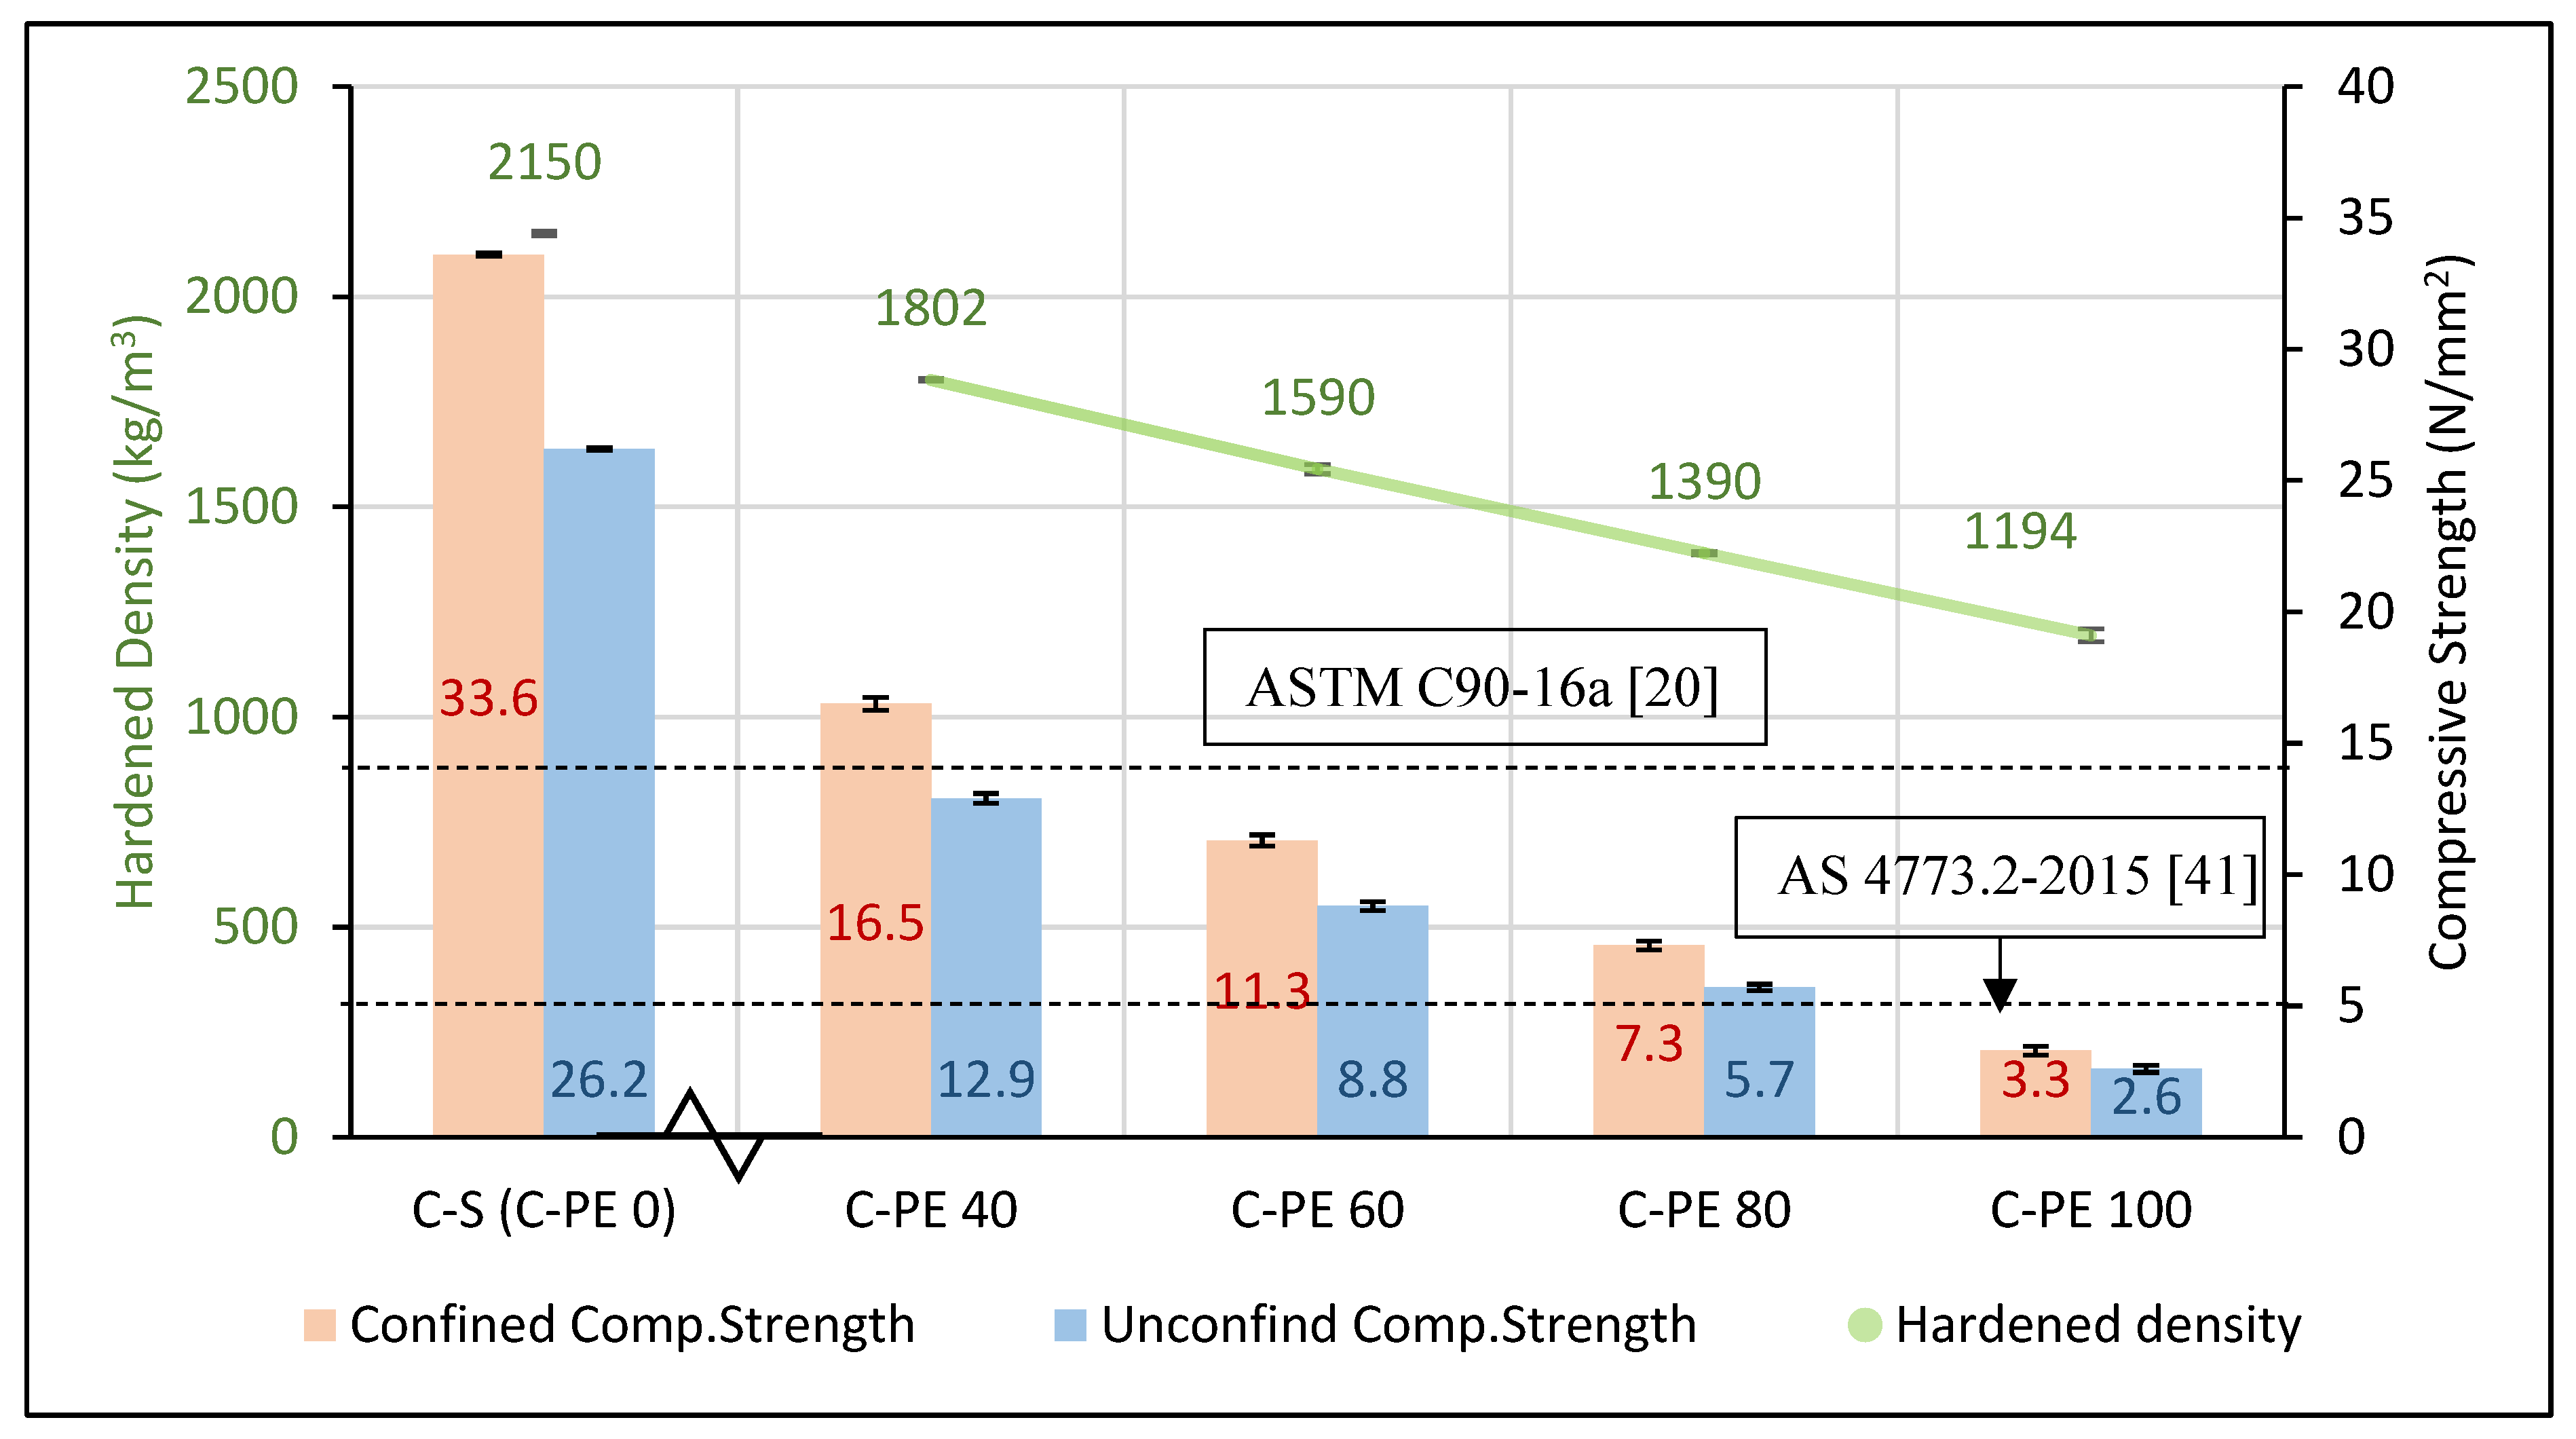
The average compressive strengths (unconfined strength) and SSD densities were 3.3 (2.6), 7.3 (5.7), 11.3 (8.8), and 16.5 (12.9) MPa and 1194, 1390, 1590, and 1802 kg/m3, respectively. The compression failure patterns of the C-PE 100 to C-PE 40 cylinders are presented in Figure 22. Columnar vertical cracking and side fractures were the most common failure patterns. The highest strength and density were recorded by the C-PE 40 mix, as it had the highest sand content. Hence, the oven dry density of C-PE 40 mix was only measured as 1458 kg/m3, as the oven dry densities of all the other perlite mixes were less than the C-PE 40 mix (Table 4). Furthermore, the water absorption of the C-PE 100, 80, 60, and 40% mixes were around 50.9% (406 kg/m3), 33.2% (350 kg/m3), 22.8% (294 kg/m3), and 16.5% (253 kg/m3), respectively.
3.2.1. Bushfire Test of C-PE Blocks
Figure 23, Figure 24, Figure 25, Figure 26 and Figure 27 show the time–temperature curves of the fire-exposed and ambient side surfaces of C-PE blocks from the bushfire tests. At the end of the heating phase, the ambient side surface temperature of the perlite blocks was within 29–56 °C. Then, all the perlite blocks showed an increment of ambient surface temperature and then a decrement during their cooling phase. The C-PE 100, 80, 60, and 40% blocks recorded successively higher average ambient surface temperatures, and all of them except for the C-PE 40 block had a maximum average ambient surface temperature less than 70 °C during the test period. No cracks were visible on the ambient surfaces of the C-PE 100, 60, and 40% blocks. Figure 28 shows the perlite block surfaces after the bushfire test, and Table 5 summarizes the bushfire test results of all the perlite blocks.
3.2.2. Building Fire Test of C-PE Blocks
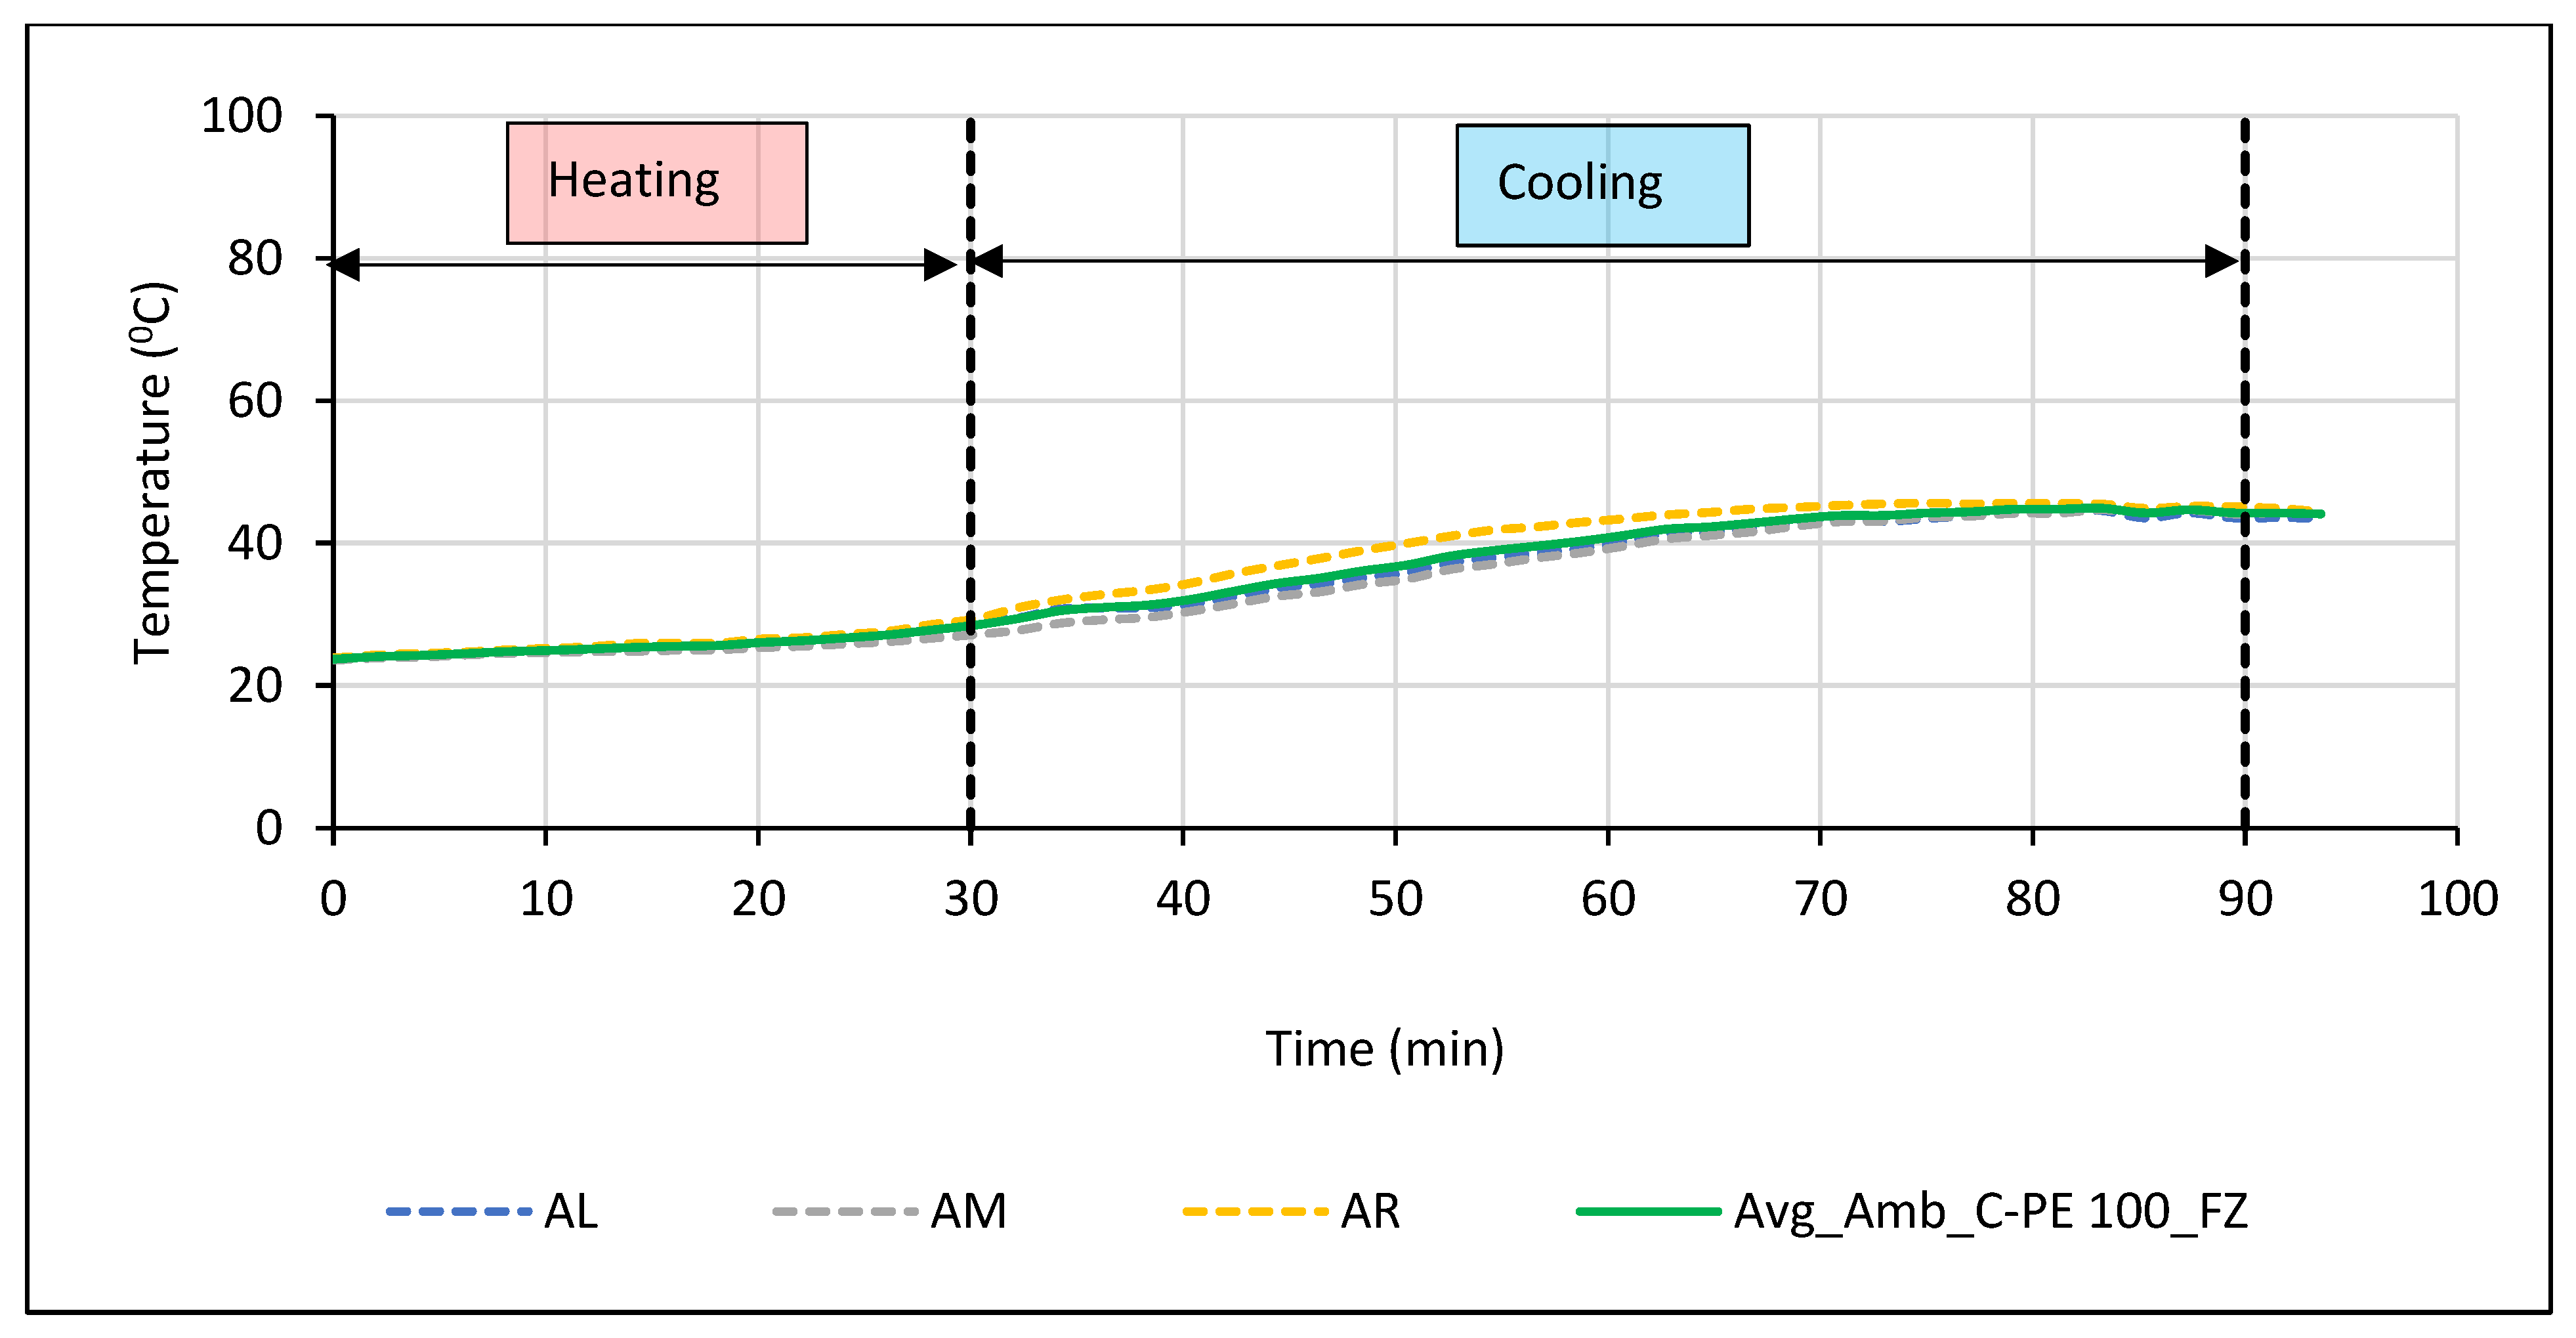
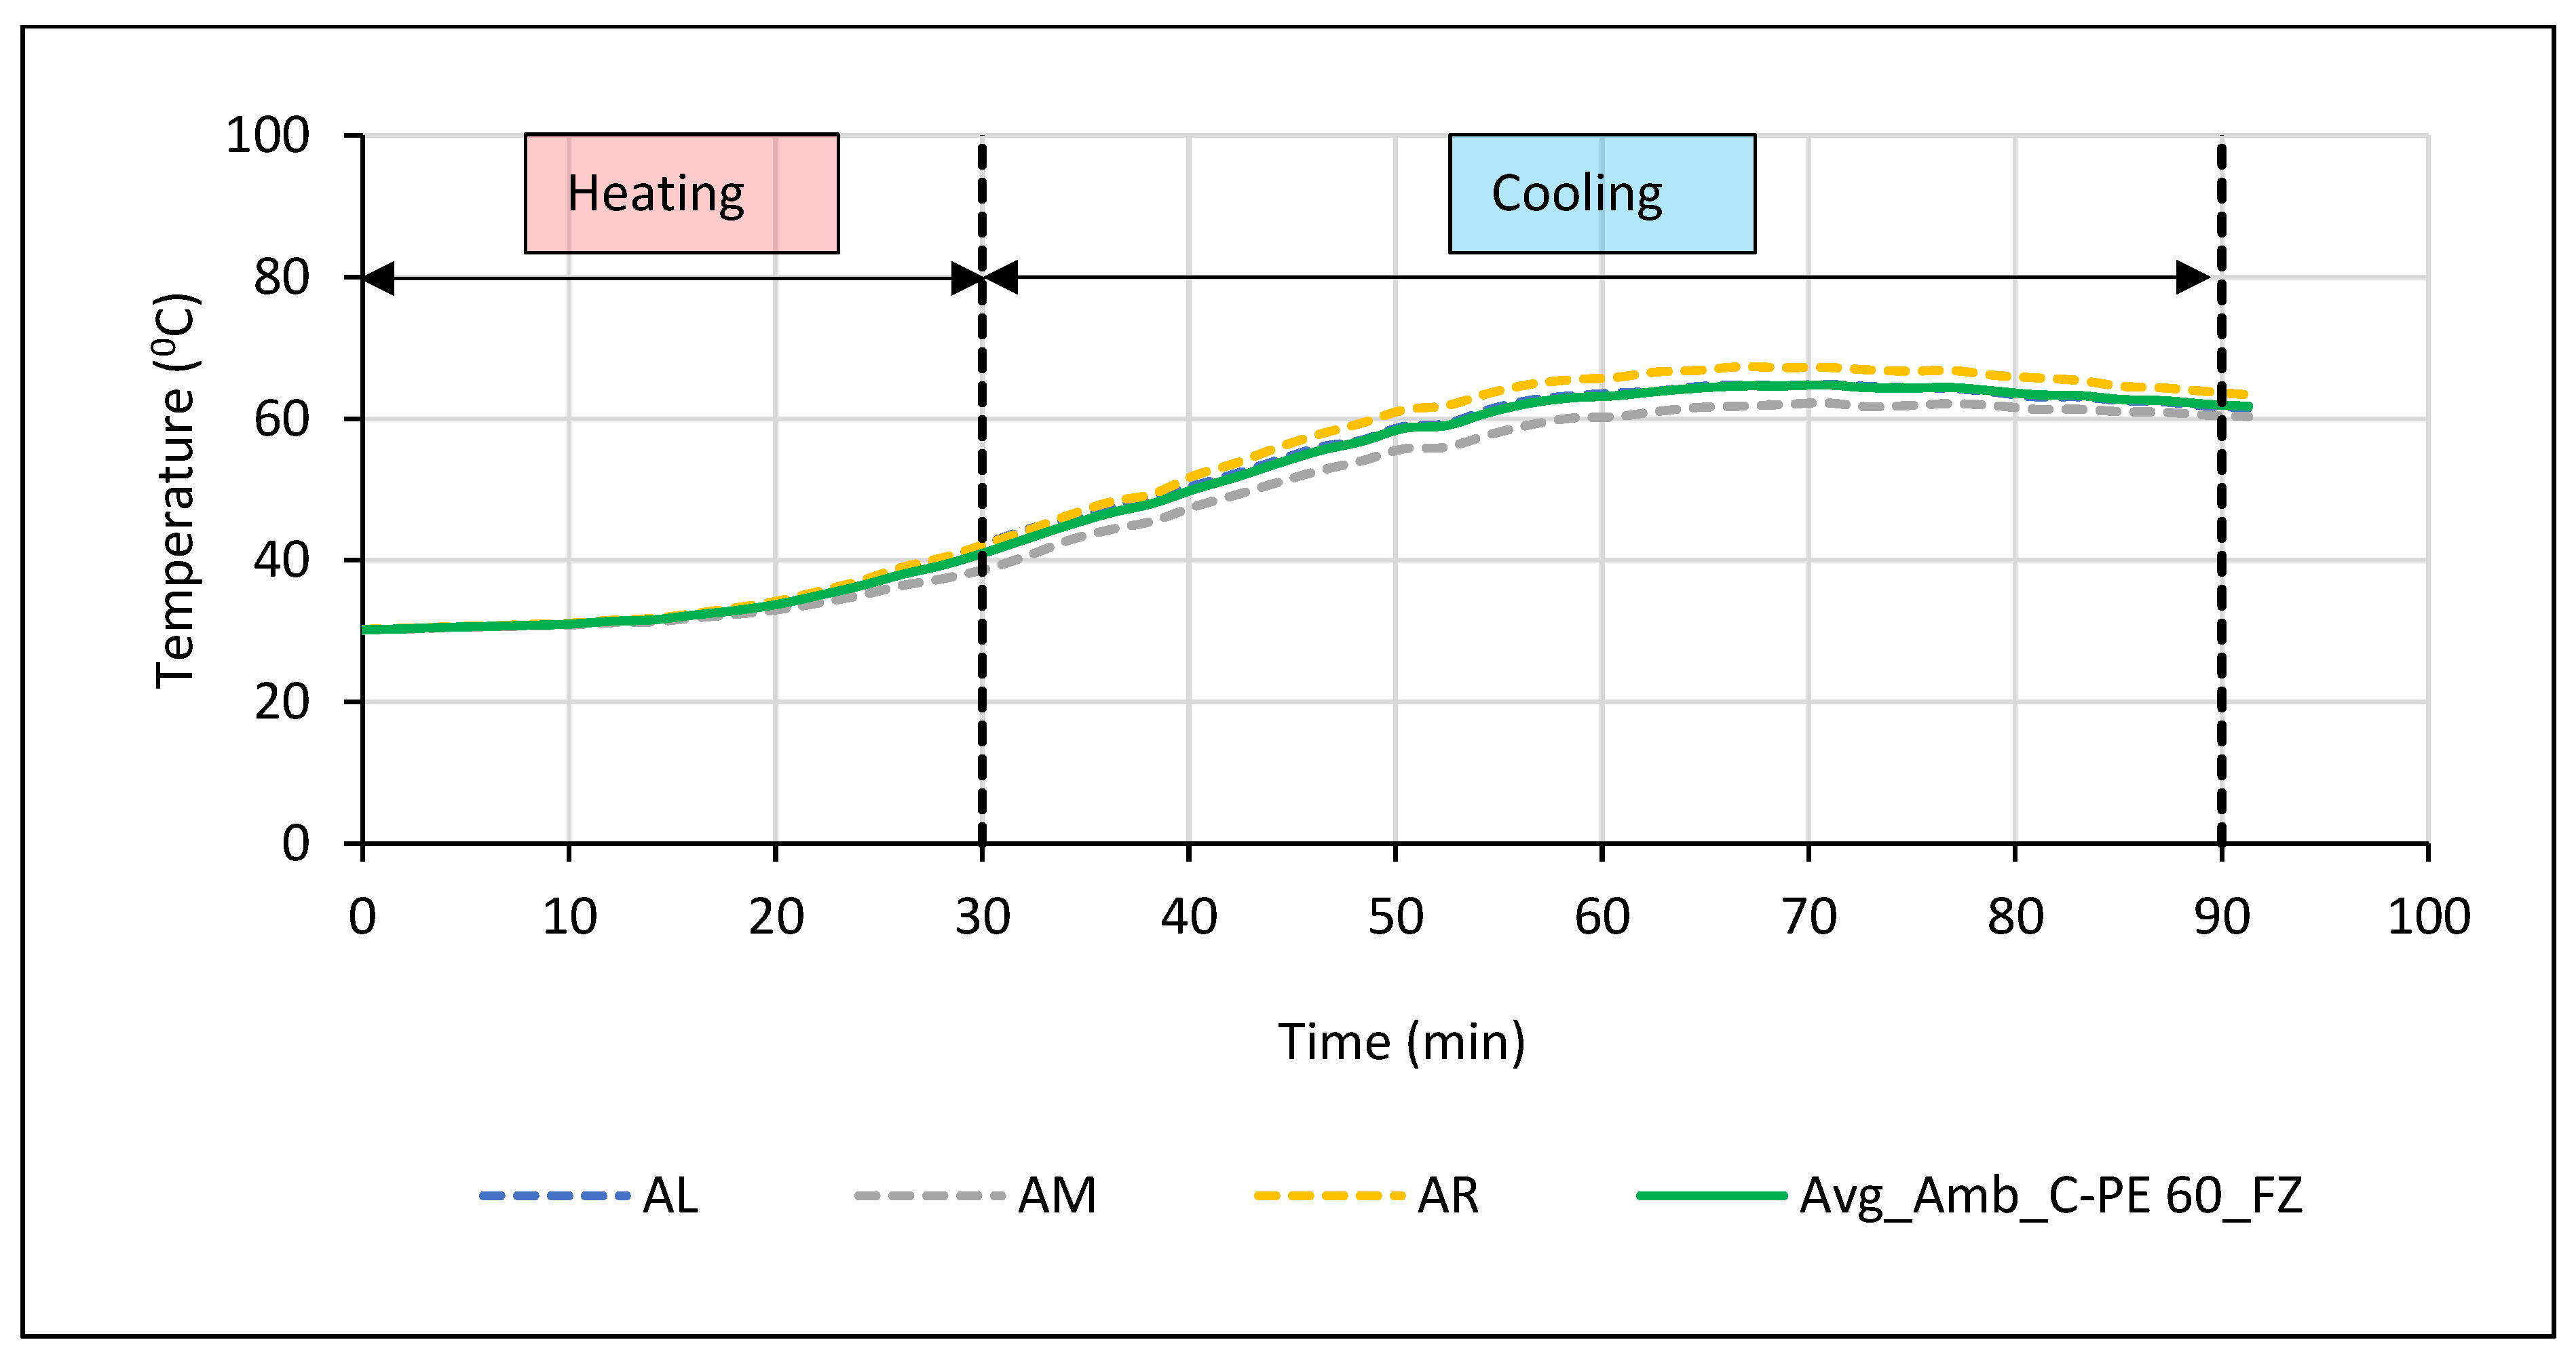
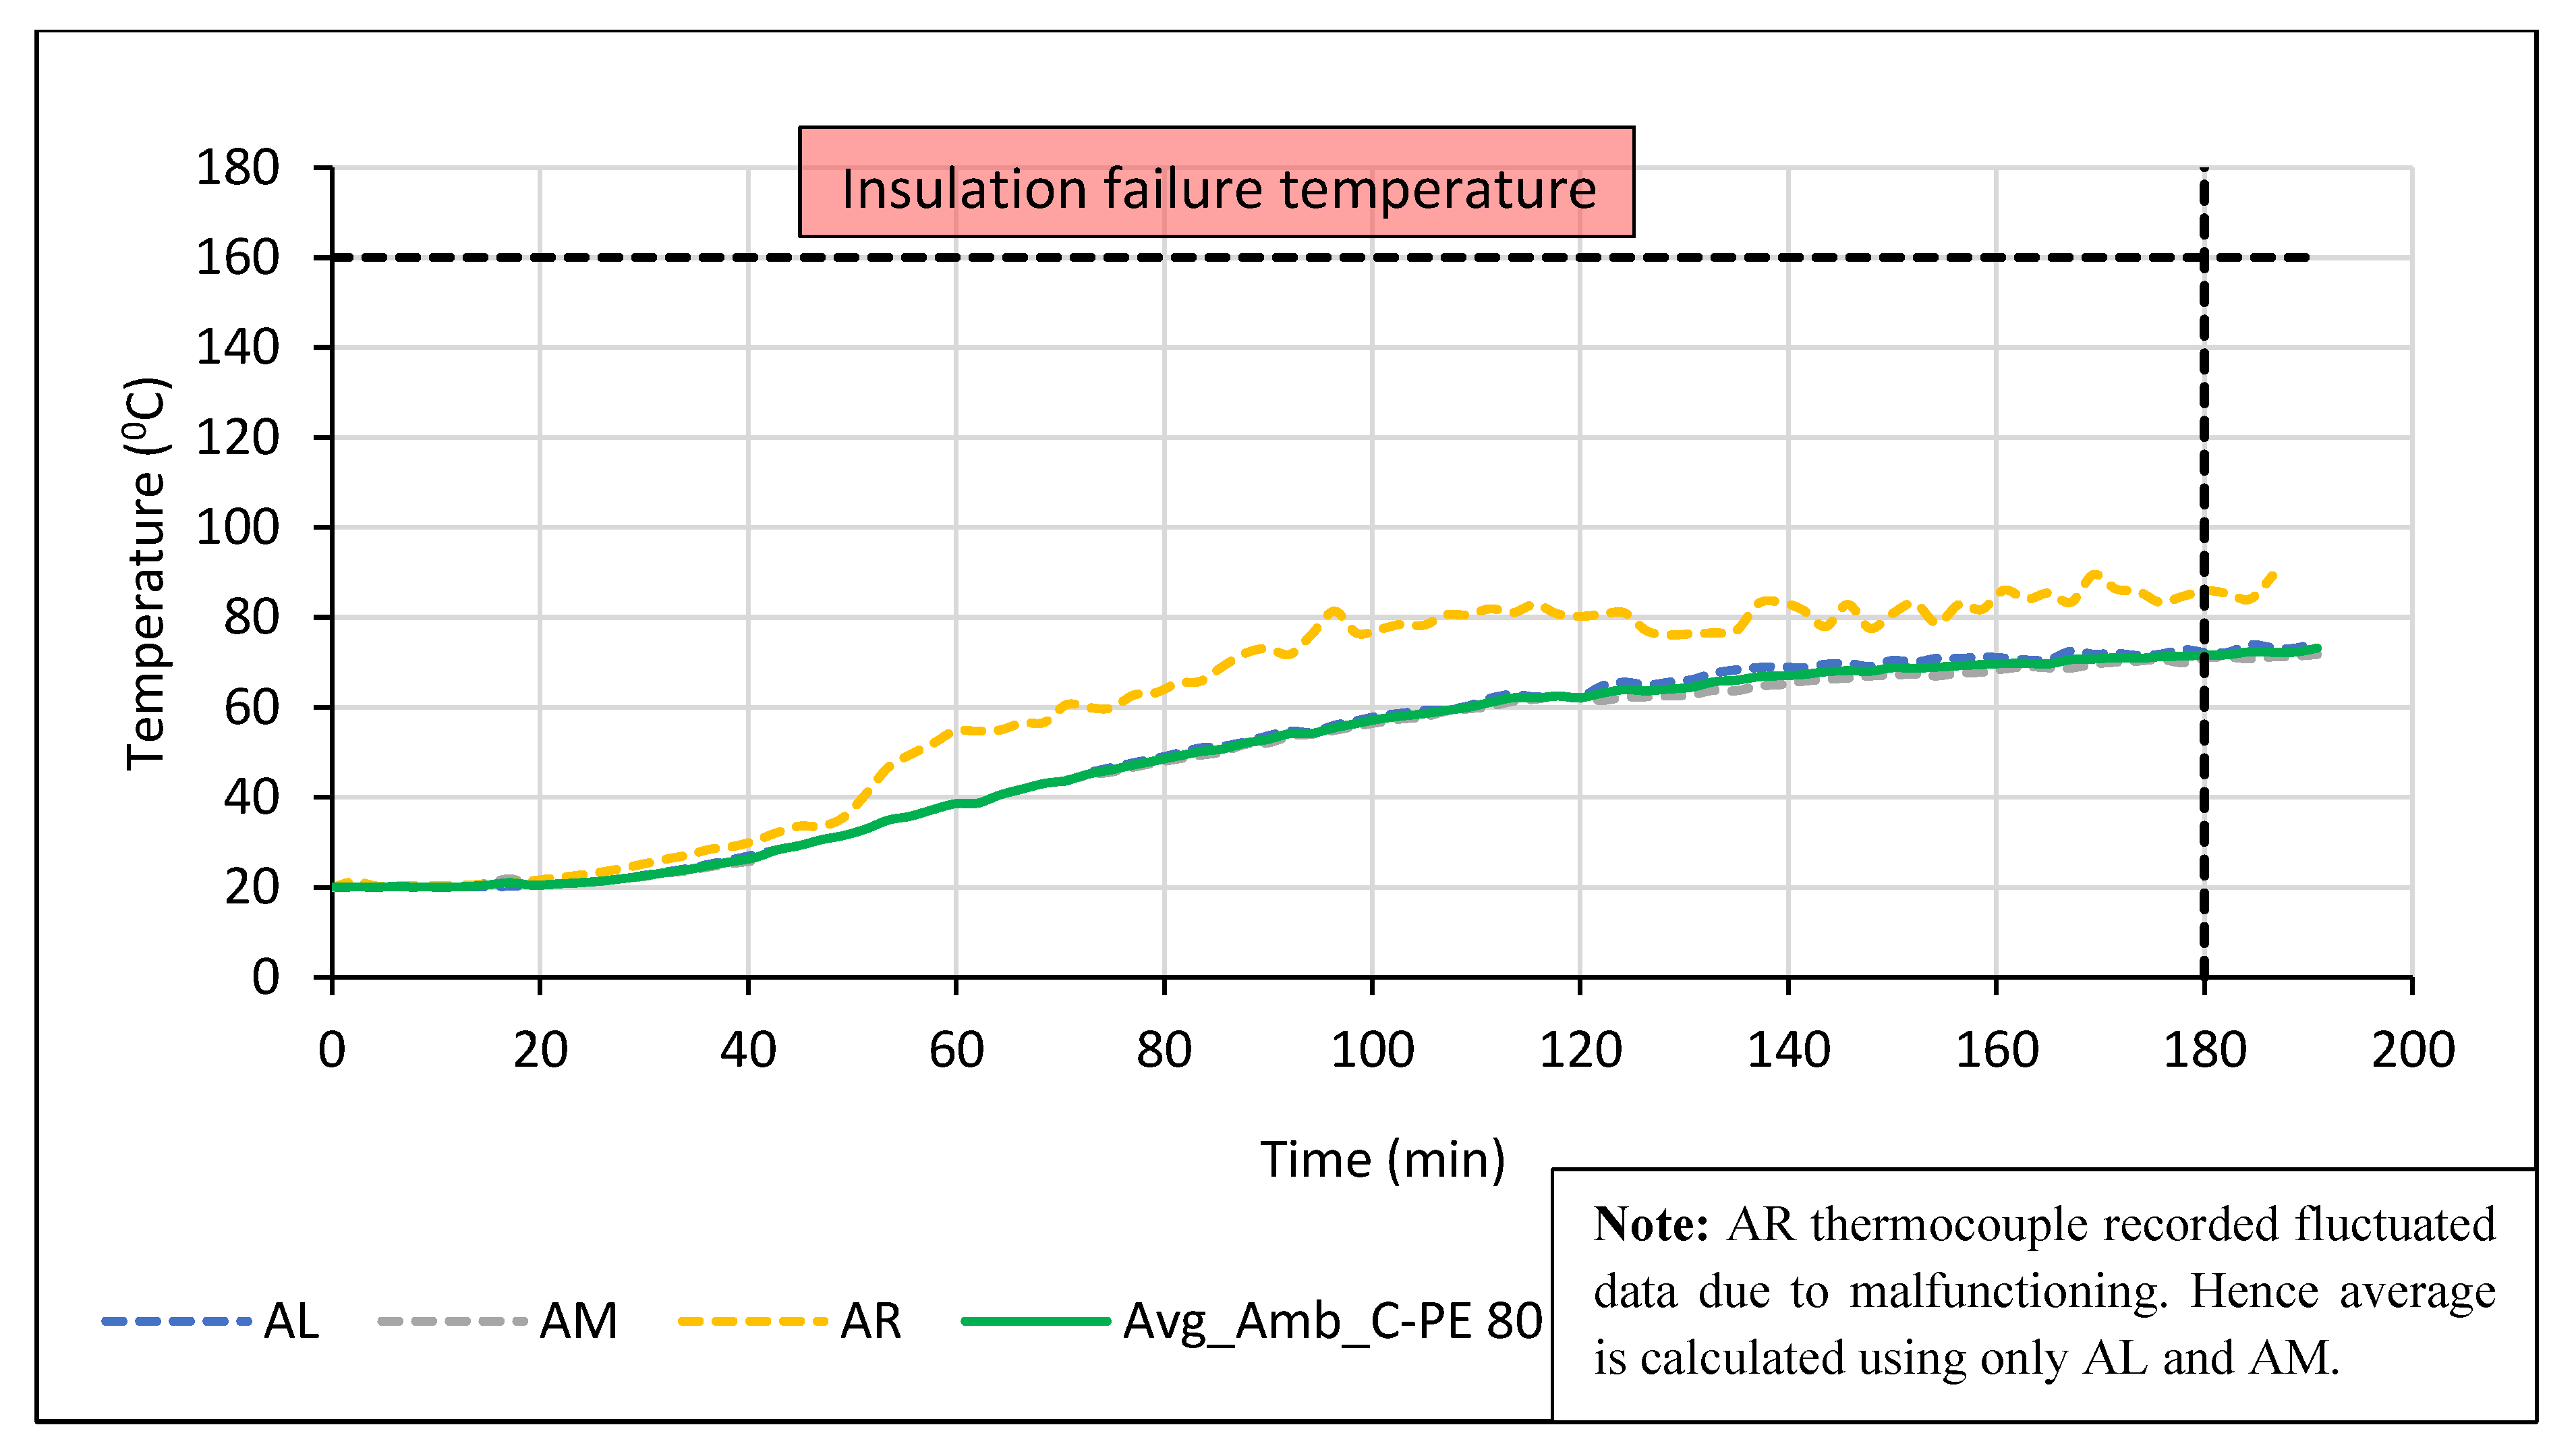
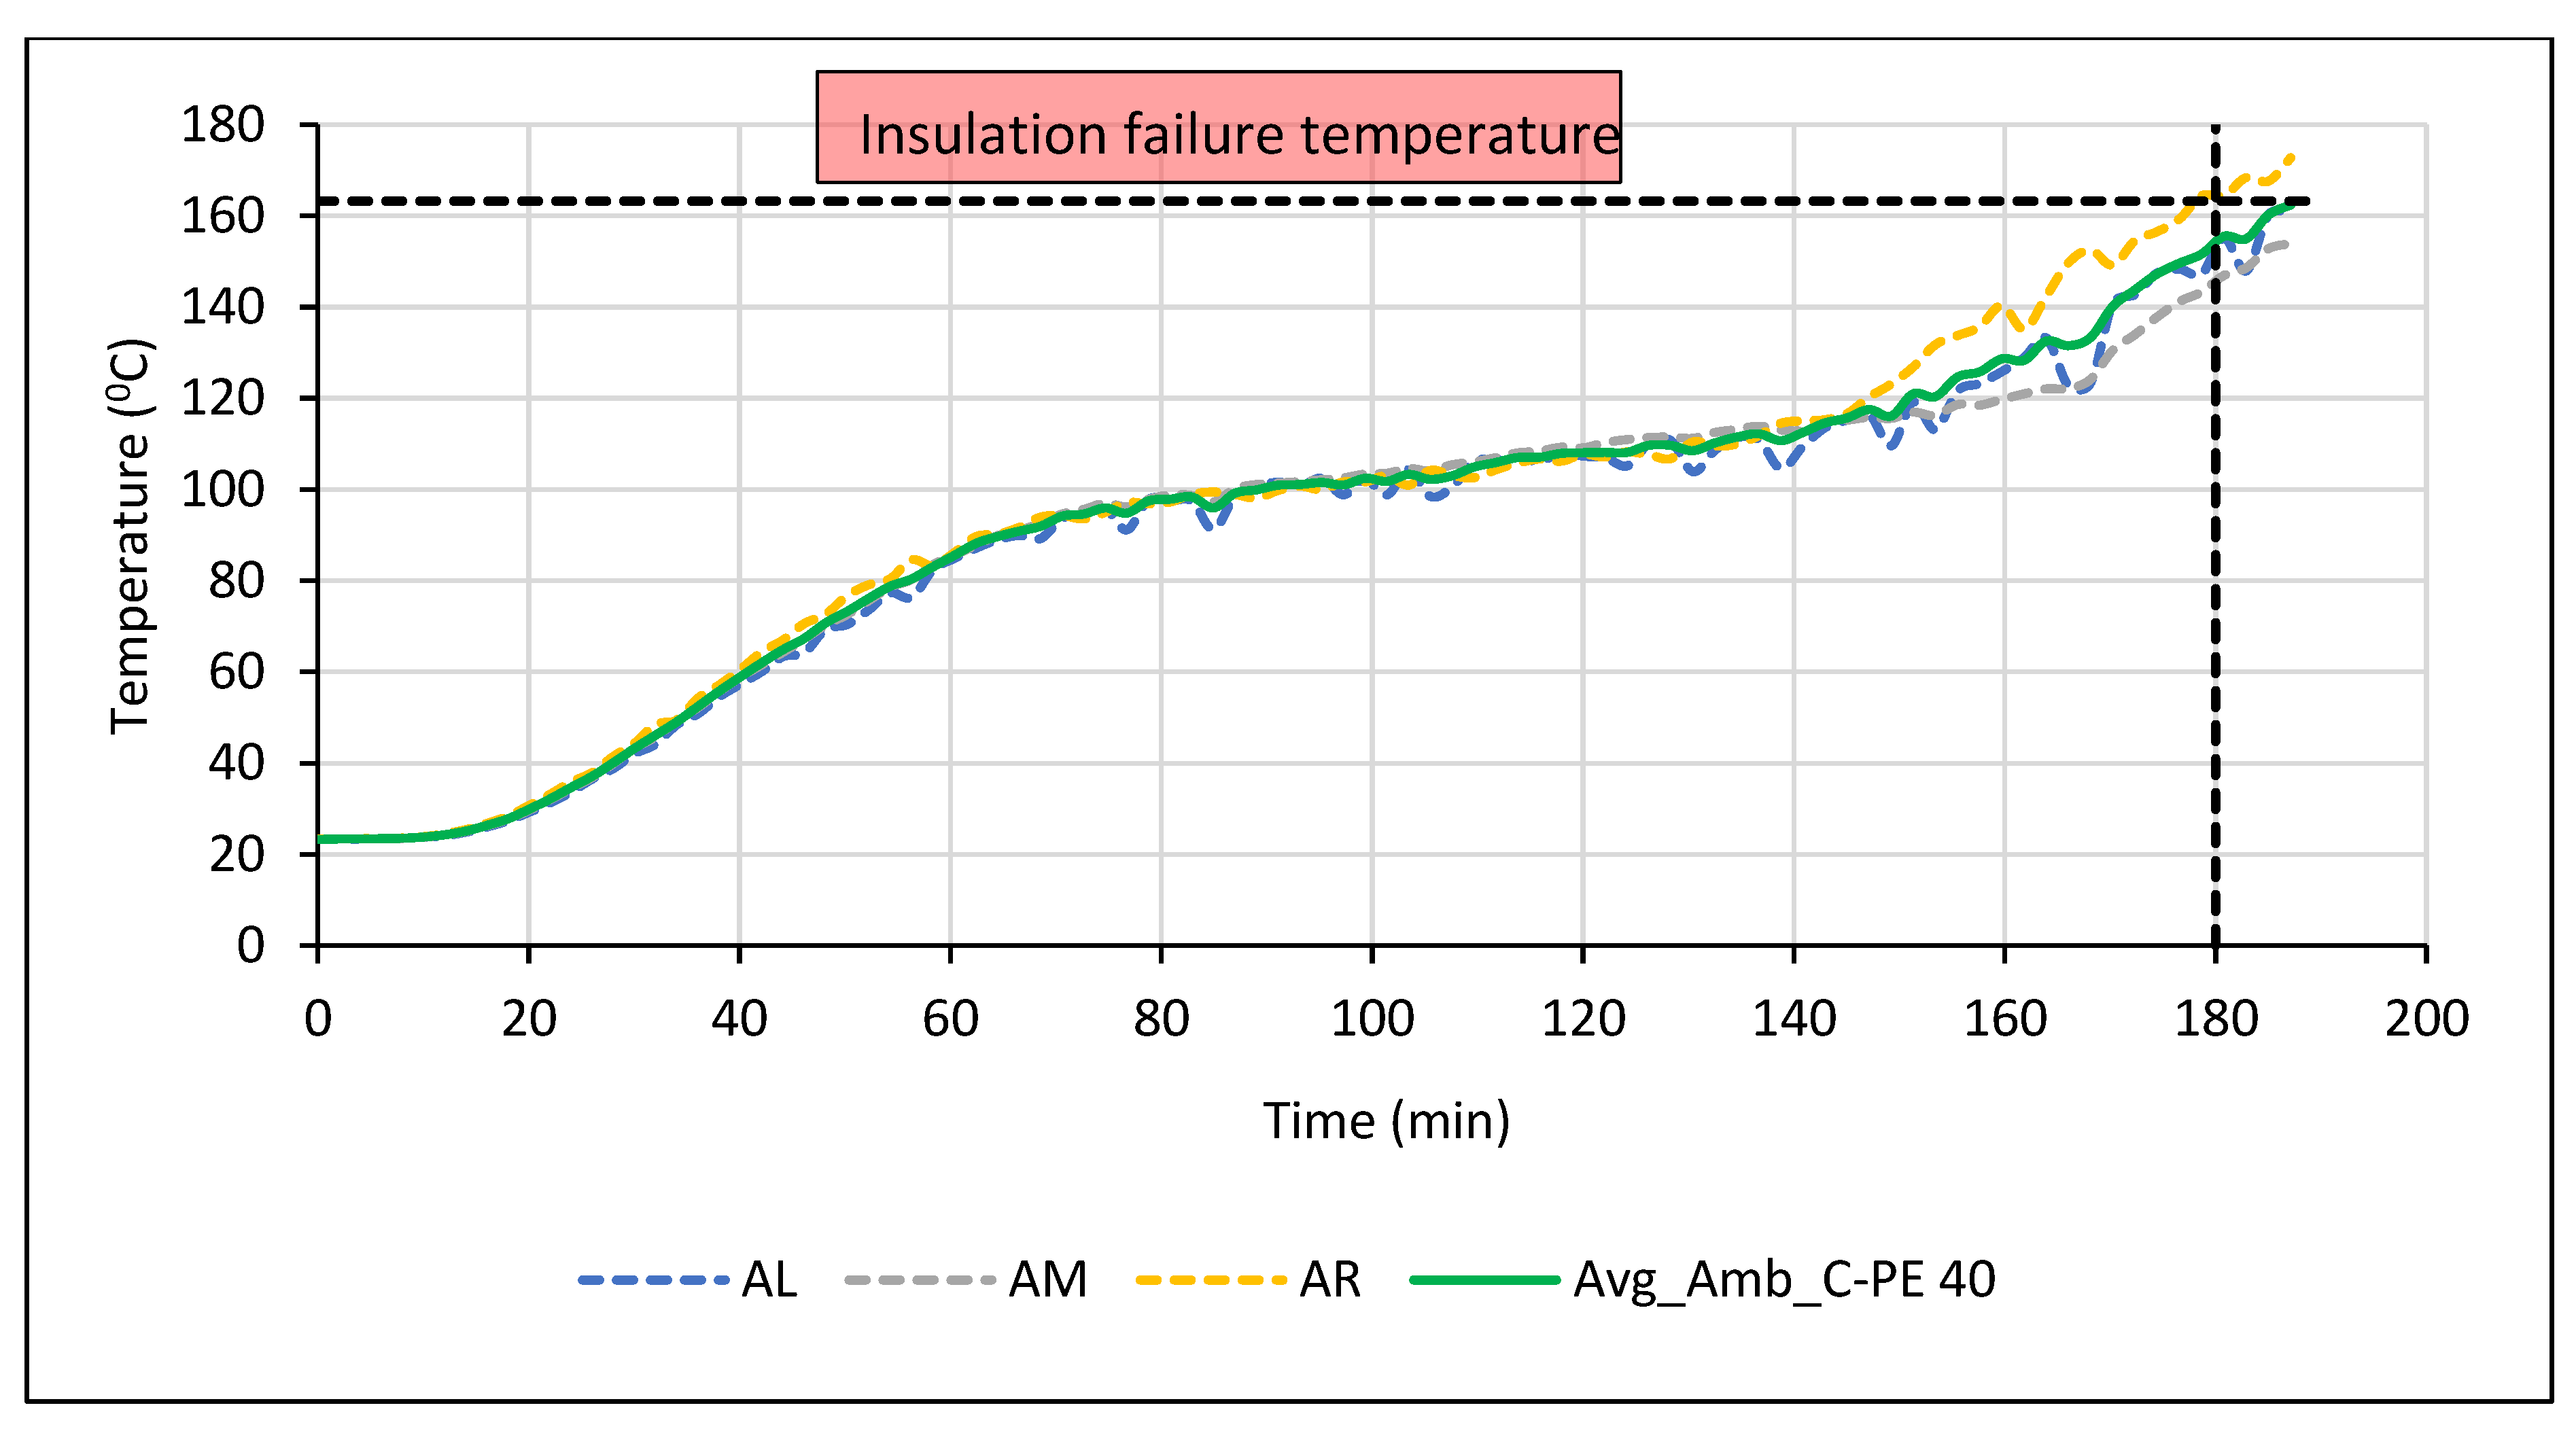
Similar to the C-S block, the fire resistance of the C-PE 100, 80, 60, and 40% blocks were investigated. Figure 29, Figure 30, Figure 31, Figure 32 and Figure 33 show the time–temperature curves of the perlite blocks from the building fire tests. None of the perlite blocks experienced insulation or integrity failure criteria after three hours of fire exposure. The lowest and highest ambient side surface temperatures were recorded by the C-PE 100 and C-PE 40 block, respectively. Although the C-PE 100 block had the lowest ambient temperature, its crack intensity on the fire side was much more severe than the others (Figure 34). The crack intensity on the fire side decreased with increasing sand content. No cracks were noticed on the ambient side surface of the perlite blocks except for the C-PE 80 block, on which only minor hairline cracks were observed. A summary of the building fire test results of all the C-PE blocks is shown in Table 6.
4. Discussion
4.1. Properties of Fresh Cement Mixes
4.1.1. Workability
The results of the slump testing of all the cement mixes are shown in Figure 35. Among the lightweight cement mixes, the lowest slump was recorded by the C-PE 100 mix and the highest slump was recorded by the C-PE 40 mix. Therefore, a higher quantity of lightweight aggregate in lightweight mixes means that the work done by gravity, or the slump, is less. Hence, the slump of lightweight expanded perlite mixes shows a negative correlation (Figure 35) with the quantity of lightweight aggregate in the mix. However, the C-PE 40 mix had a higher slump compared to the C-S (C-PE 0) mix. Even though the C-PE 40 mix had a higher amount of perlite aggregate than the C-S mix, variations in aggregate shape, size, and gradation might have attributed to the lower slump of the C-S mix.
4.1.2. Fresh Density
The results of the fresh density of cement mixes are shown in Figure 35. The density of the perlite mixes was within the range of 1138–1755 kg/m3. The highest and lowest densities were recorded by the C-S and C-PE 100 mixes, respectively. This is because of the density/specific gravity difference of each aggregate. Expanded perlite has considerably lower specific gravity (0.73) than sand (2.57). Similar to the slump variation, a higher the quantity of lightweight aggregate results in less density. Hence, the fresh density of lightweight perlite mixes shows a negative correlation with the quantity of lightweight aggregate (Figure 35).
Considering both the slump and fresh density values of all the mixes, low density mixes can be obtained by adding more lightweight aggregate into the mix. However, adding more lightweight aggregate reduces the slump as well. Generally, lower slump results lead to difficulties in compaction and loss of homogeneity of the mix, and consequently lower strength. Hence, an ideal lightweight mix can be obtained with a combination of both normal and lightweight aggregate.
4.2. Properties of Hardened Cement Mixes
4.2.1. Density
Figure 36 shows the average hardened SSD density of all the cement mixes. Similar to the fresh density variation, the highest density of 2150 kg/m3 was recorded by the C-S mix, in which the sand content was the highest. The density of all perlite cement mixes was less than 1802 kg/m3. This means that the density of normal standard cement mixes can be reduced by at least 16% by replacing sand with lightweight perlite aggregate. There is a negative correlation (Figure 36) between perlite aggregate content and the hardened density of the perlite cement mixes.
In ASTM C90-16a [20], loadbearing concrete masonry units are categorized as lightweight, medium weight, and normal weight based on their oven dry density, water absorption, and compressive strength. For lightweight concrete masonry units, the maximum oven dry density is 1680 kg/m3. Because the oven dry density of the perlite cement mixes was less than 1458 kg/m3 (Table 4), all the developed C-PE blocks can be categorized as lightweight concrete masonry units in terms of their oven dry density. Light weight contributes positively to construction requirements by reducing the self-weight of structures and thereby the structural member sizes and reinforcement requirements, i.e., increasing the strength to weight ratio. Overall, lighter weight improves construction speed while reducing the costs of both structures and transportation [39,40].
4.2.2. Compressive Strength
The confined and unconfined compressive strengths of all the cement mixes are summarized in Figure 36. The highest compressive strength was recorded by the C-S mix. The lowest strength was recorded by the C-PE 100 mix, in which the sand in the C-S mix was fully replaced with weaker lightweight aggregate. As mentioned previously, the low slump value of 20 mm may have been a reason for this low compressive strength. As shown in the Figure 36, replacement of sand with lightweight expanded perlite aggregate reduces compressive strength, i.e., there is a negative relationship between the quantity of lightweight aggregate and the compressive strength.
As mentioned in the previous section, ASTM C90-16a [20] specifies the compressive strength requirement for lightweight load-bearing concrete masonry units as 13.8 N/mm2. Therefore, only the C-PE 40 blocks can be categorized as lightweight load-bearing concrete masonry units. However, AS 4773.2-2015 [41] specifies that the minimum unconfined compressive strength for solid load-bearing and non-load-bearing units as 5 and 3 N/mm2, respectively. According to this requirement, all the developed lightweight cement mixes satisfy the load-bearing strength requirement, while the C-PE 100 mix only marginally satisfies the non-load-bearing strength requirement.
Considering the density and compressive strength values of all the mixes, the C-PE 80, 60, and 40 mixes can be utilized to produce lightweight masonry blocks while satisfying the load-bearing strength requirement of solid masonry units. As the C- PE 100 mix has a lower density, it can only be used as a non-load-bearing masonry block.
4.2.3. Water Absorption
Generally, water absorption is high when the content of lightweight aggregate is high [42]. The water absorption values of the C-S, C-PE 100, 80, 60, and 40 mixes are around 9.0%, 50.9%, 33.2%, 22.8%, and 16.5%, respectively, in other words, the absorption rate is 178, 406, 350, 294, and 253 kg/m3 respectively. Because the water absorption of perlite (188.1%) is comparatively much higher than that of sand (0.1%), high water absorption values are recorded by perlite mixes. Furthermore, higher perlite aggregate content leads to higher water absorption (i.e., a positive correlation). For lightweight concrete masonry units, ASTM C90-16a [20] specifies a maximum water absorption value of 288 kg/m3. As all of the perlite mixes have higher values except for the C-PE 40 mix, their vulnerability to penetration by external agents is high. Therefore, special attention should be paid to cases involving external wall applications.
4.2.4. Fire Resistance
Bushfire Resistance
The ambient side surface time–temperature curves from the bushfire tests conducted on all the C-S and C-PE blocks are summarized in Figure 37. At the end of the heating phase (i.e., after 30 min of fire exposure) the C-S and C-PE 100, 80, 60, and 40 blocks recorded temperatures of 71, 29, 23, 41, and 56 °C, respectively (Table 5). During the subsequent 60 min cooling phase, the ambient surface temperatures of all the blocks continued to increase and achieved a peak temperature followed by a decline. During the 90 min total testing period, the C-S and C-PE 100, 80, 60, and 40 blocks recorded a maximum temperature of 89, 45, 48, 65, and 79 °C, respectively (Table 5), i.e., the bushfire resistance improved with increasing percentage of lightweight aggregate. None of the blocks were found to be combustible during the test period, and no gaps from the fire exposed to the ambient side were visible.
According to the Australian Building Codes Board (ABCB) performance standard, the maximum temperature limit for the interior surfaces of bushfire shelters is 70 °C [43]. As the maximum ambient surface temperatures of the C-S and C-PE 40 blocks were 89 and 79 °C, respectively, only the C-PE 100, 80, and 60 blocks are suitable for use in the external walls of bushfire shelters. Although the C-PE 100 block had the lowest temperature, the crack intensity level on the fire side of the C-PE 100 block was much higher than that of the C-PE 80 and 60 blocks (Figure 28). Although the C-PE 80 block recorded lower ambient surface temperatures compared to the C-PE 60 block, few ambient surface hairline cracks were observed on the C-PE 80 block after fire exposure (Figure 28), which might be due to improper bonding of materials due to less sand. Hence, considering both the bushfire shelters’ interior surface temperature limit and the crack intensity on the fire and ambient sides of the blocks, the C-PE 60 block appears to be the most suitable for the external walls of bushfire shelters.
Building Fire Resistance
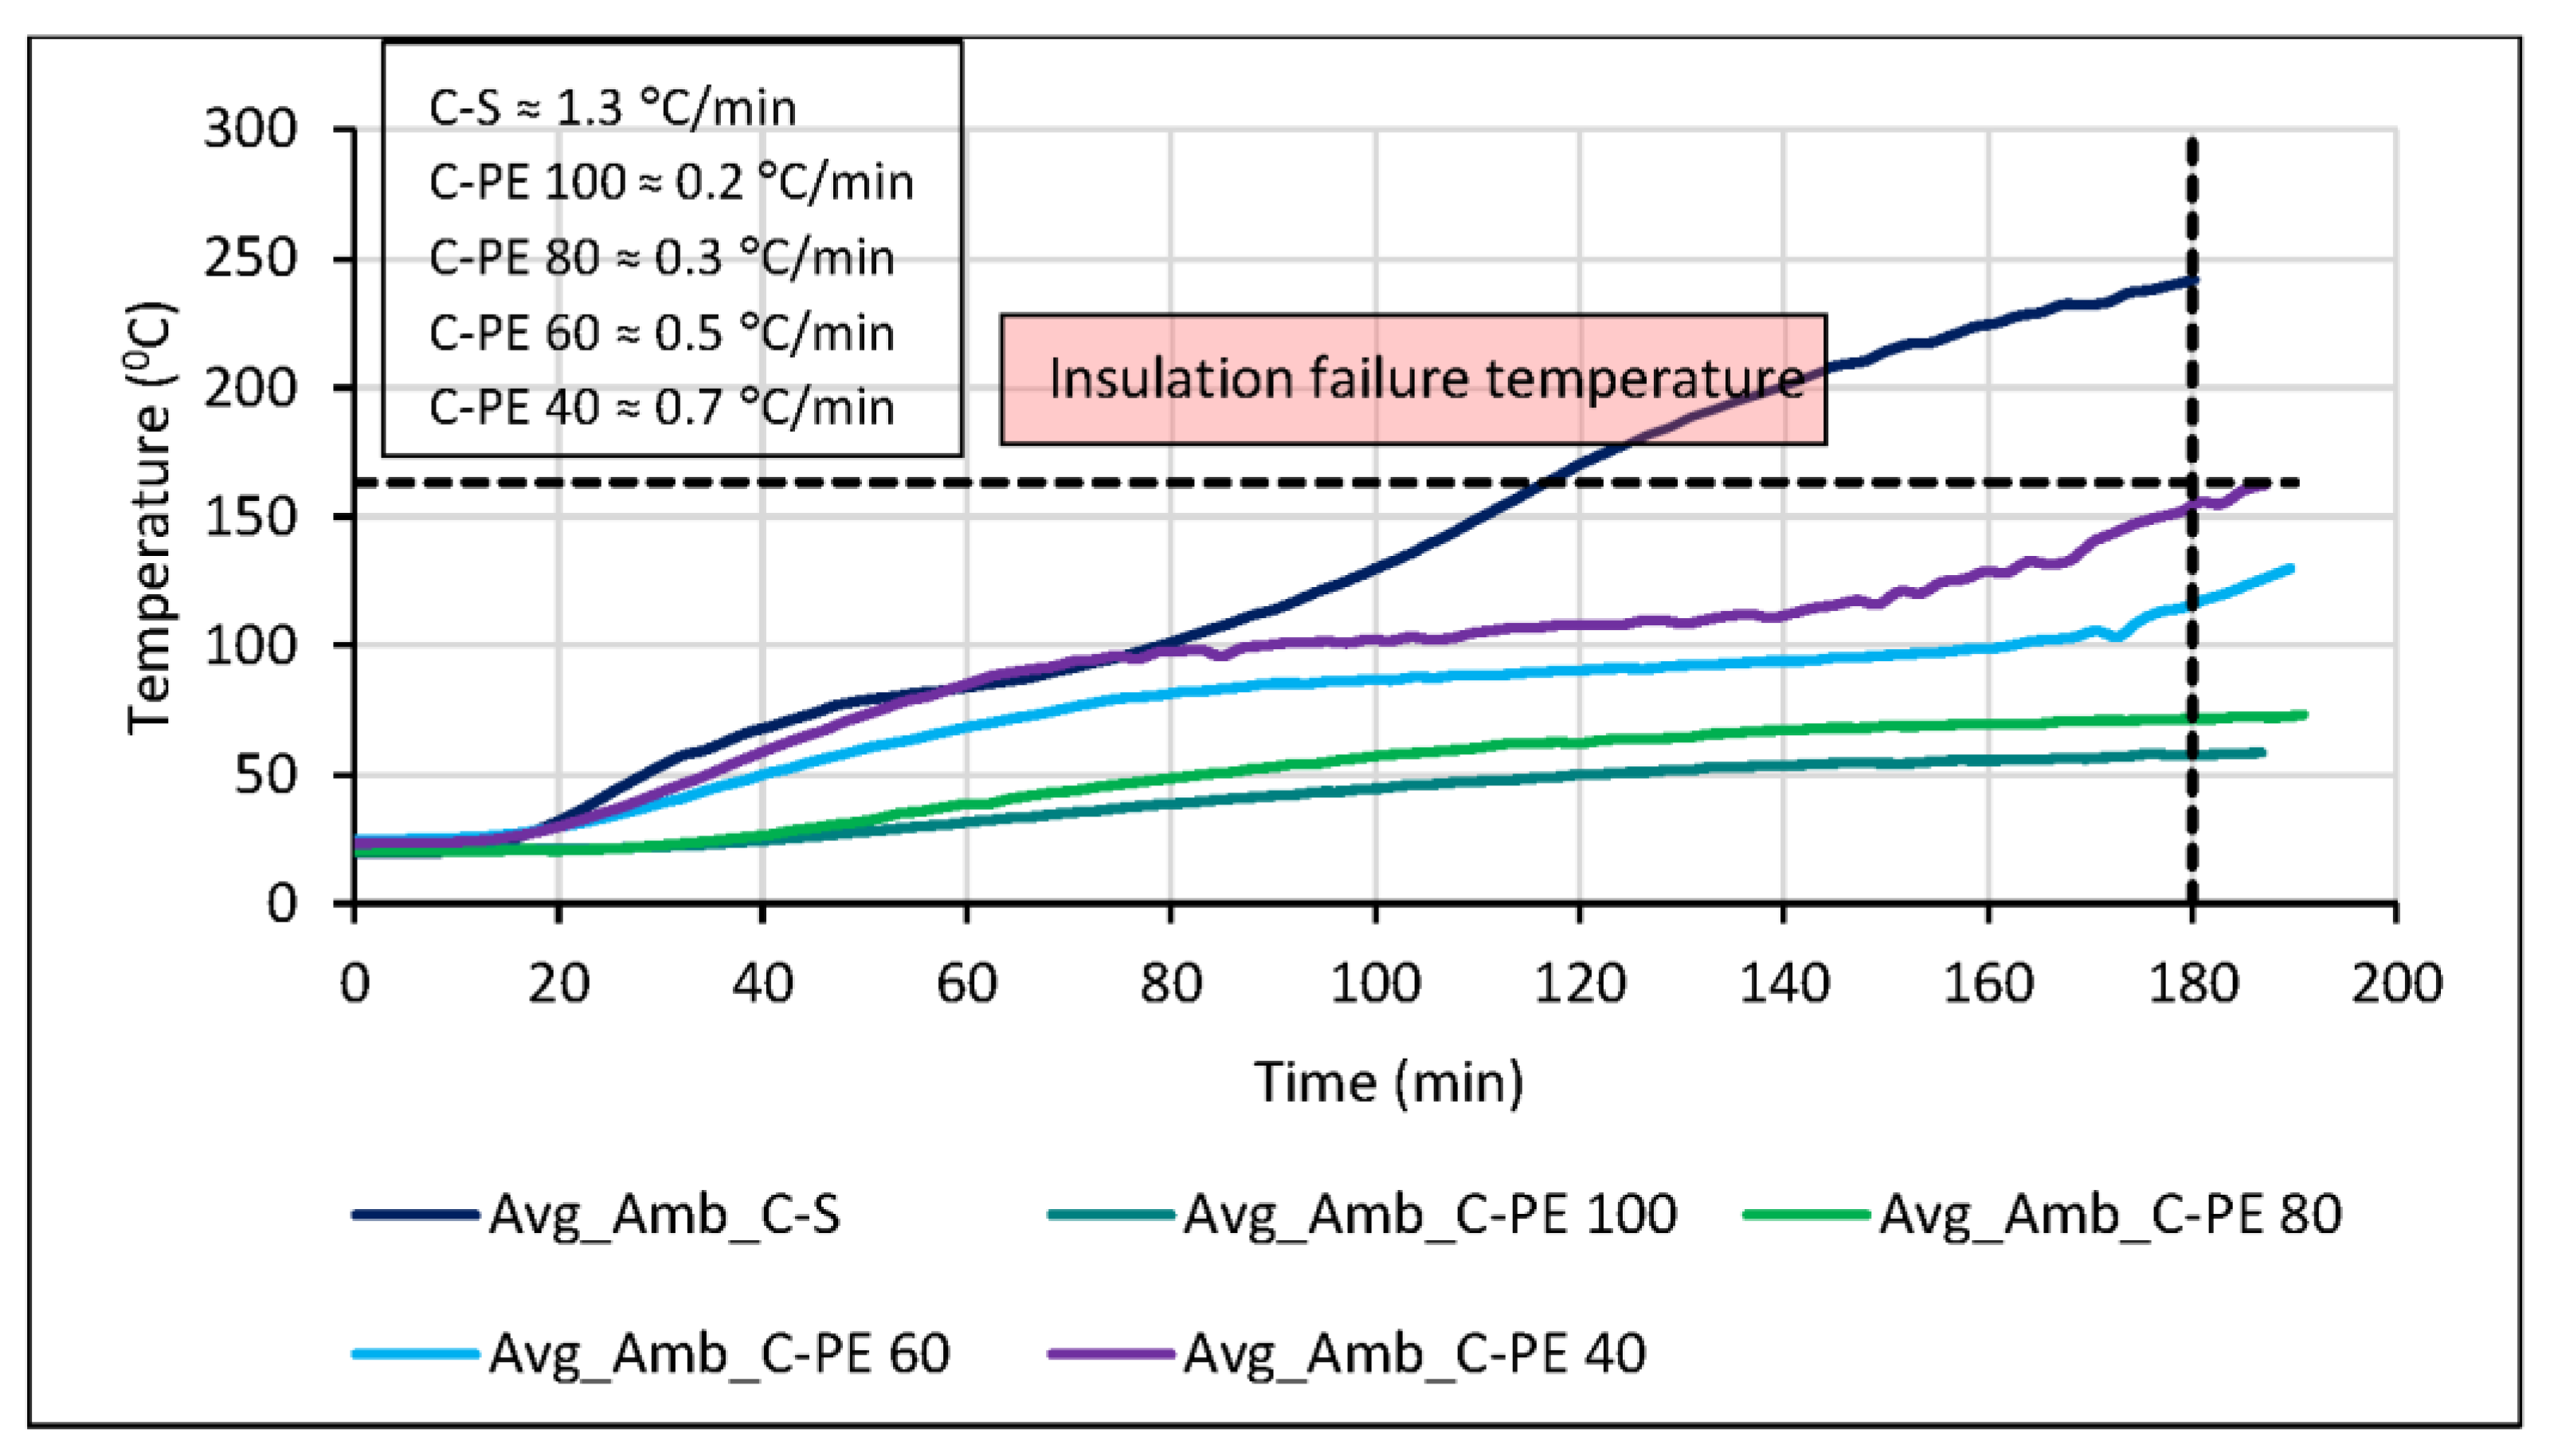
Figure 38 shows the ambient side block surface time–temperature curves from the building fire tests of all the block units. According to Figure 38, the highest temperature was recorded by the C-S block, and consequent insulation failure was experienced after 115 min of fire exposure. However, none of the perlite blocks failed under the insulation and integrity criteria during three hours of fire exposure. Among the lightweight masonry blocks, the lowest ambient side surface temperature was recorded by the C-PE 100 block. The average temperatures recorded by C-PE 100, 80, 60, and 40 blocks after three hours of fire exposure were 57, 72, 118, and 156 °C, respectively (Table 6). Hence, similar to the bushfire resistance test, building fire resistance improved with increasing perlite aggregate content in the mix. The C-PE 40 block recorded the highest ambient surface temperature at the end of three hours (156 °C), and hence was closer to insulation failure (around 160 °C). In addition, the rate of the ambient surface temperature increment of the C-S block can be approximately calculated as 1.3 °C/min based on the trend line drawn between the initial and final temperature points at the end of three hours. Similarly, the C-PE 100, 80, 60, and 40 blocks recorded 0.2, 0.3, 0.5, and 0.7 °C/min, respectively. The rate of the ambient surface temperature increment was considerably higher in the standard cement–sand block than in the lightweight blocks, with the C-PE 100 block having a rate 85% lower than the standard block.
Although the C-PE 100 block performed well in terms of fire resistance, considering the compressive strength and the crack intensity level after three hours of fire exposure (Figure 34) the C-PE 100 and 80 blocks cannot be recommended as suitable for bushfire resistance. In addition, they are comparatively more vulnerable to penetrating external agents because of their higher water absorption levels. Furthermore, the C-PE 40 block was the weakest in terms of the insulation criterion. Therefore, considering its lightweight density, load-bearing strength, low water absorption level, low temperatures on the ambient surface, and low crack intensity after both bushfire and building fire exposure, the C-PE 60 block can be considered the most suitable perlite masonry block for utilization in the external walls of bushfire shelters and buildings in bushfire-prone areas compared to the standard cement–sand block and the other perlite blocks. However, further studies on other mechanical properties (flexural strength, elastic modulus, and residual strength) and durability properties (erosion, permeability, freezing and, thawing) need to be conducted on the C-PE 60 mix to confirm it as a standard building material.
5. Conclusions
This paper has presented an experimental study on the use of expanded perlite fine aggregate to develop lightweight masonry blocks with enhanced bushfire resistance characteristics. The properties of cement, sand, and perlite aggregate were measured and four mixes of Cement–Expanded Perlite (C-PE) were developed by replacing sand aggregates in the Cement–Sand (C-S) mix. Experimental studies were conducted to determine their physical properties, compressive strength, and bushfire and building fire resistances. The results were compared with those obtained for specimens made with standard Cement–Sand (C-S) mix. The following specific conclusions can be made based on the experimental studies:
- -
- The Cement–Sand (C-S) mix achieved the highest density and compressive strength and the lowest water absorption.
- -
- C-S masonry blocks reached the bushfire shelter interior surface temperature limit of 70 °C in 30 min and achieved only 90 min (-/90/90) of building fire resistance level.
- -
- All the Cement–Expanded Perlite (C-PE) mixes satisfied the oven dry density requirement for lightweight concrete masonry units, and all except the C-PE 100 mix can be used to produce load-bearing solid masonry units.
- -
- The workability, density, and compressive strength of all the expanded perlite mixes showed a negative correlation with the quantity of expanded perlite aggregate, while water absorption showed a positive correlation.
- -
- The bushfire and building fire resistance of masonry blocks made of cement mixes showed a positive correlation with the quantity of expanded perlite aggregate.
- -
- Considering the bushfire shelter interior surface temperature limit of 70 °C and the crack intensity on the fire and ambient side surfaces of the blocks after the bushfire test, the C-PE 60 block appears to be the most suitable for use in the external walls of bushfire shelters.
- -
- None of the expanded perlite blocks failed the insulation and integrity criteria during three hours of standard fire exposure, i.e., all the expanded perlite blocks had a minimum fire resistance level of three hours (-/180/180).
- -
- Considering its lightweight density, load-bearing strength requirements for solid masonry units, low water absorption level, low ambient side surface temperatures, and low crack intensity after bushfire and building fire exposure, the C-PE 60 block is recommended as the most suitable expanded perlite masonry unit for use in the external walls of bushfire shelters and other buildings in bushfire-prone areas.
Author Contributions
Conceptualization, A.A. and M.M.; methodology, I.E.A. and A.A.; validation, I.E.A. and A.A.; formal analysis, I.E.A. and A.A.; investigation, I.E.A.; resources, A.A. and M.M.; data curation, I.E.A. and A.A.; writing—original draft preparation, I.E.A.; writing—review and editing, A.A. and M.M.; visualization, I.E.A. and A.A.; supervision, A.A. and M.M.; project administration, A.A. and M.M.; funding acquisition, A.A. All authors have read and agreed to the published version of the manuscript.
Funding
This research was funded by Australian Research Council, grant number DE180101598.
Institutional Review Board Statement
Not applicable.
Informed Consent Statement
Not applicable.
Data Availability Statement
Some or all data, models, or code that support the findings of this study are available from the corresponding author upon reasonable request.
Acknowledgments
The authors wish to thank the Australian Research Council for financial support to this project (ARC Grant DE180101598, 2018) and QUT for providing access and support to conduct studies in the Faculty of Engineering laboratory and the Banyo Pilot Plant Precinct. They also wish to thank the senior technical officers in the Faculty of Engineering and final year engineering students Thomas Heaney and Charles Kila Pat for their support with the laboratory tests.
Conflicts of Interest
The authors declare no conflict of interest.
Abbreviations
| (C-S) | Cement–Sand |
| (C-PE) | Cement–Expanded Perlite |
| (SSD) | Saturated Surface Dry |
| (SEM) | Scanning Electron Microscope |
| (BAL-FZ) | Bushfire Attack Level Flame Zone |
| (FRL) | Fire Resistance Level |
| FL | Fire Left |
| FM | Fire Middle |
| FR | Fire Right |
| AL | Ambient Left |
| AM | Ambient Middle |
| AR | Ambient Right |
| (ABCB) | Australian Building Codes Board |
References
- McLennan, J.; Elliott, G.; Omodei, M.; Whittaker, J. Householders’ safety-related decisions, plans, actions and outcomes during the 7 February 2009 Victorian (Australia) wildfires. Fire Saf. J. 2013, 61, 175–184. [Google Scholar] [CrossRef]
- Stephenson, C. A Literature Review on the Economic, Social and Environmental Impacts of Severe Bushfires in South-Eastern Australia. 2010. Available online: https://www.ffm.vic.gov.au/__data/assets/pdf_file/0009/21114/Report-87-A-Lit.Rvw-On-The-Economic,-Social-and-Envtal-Impacts-of-Severe-Bushfires-In-SE-Aust.pdf (accessed on 22 April 2019).
- McLennan, J.; Paton, D.; Wright, L. At-risk householders’ responses to potential and actual bushfire threat: An analysis of findings from seven Australian post-bushfire interview studies 2009–2014. Int. J. Disaster Risk Reduct. 2015, 12, 319–327. [Google Scholar] [CrossRef]
- Posi, P.; Lertnimoolchai, S.; Sata, V.; Chindaprasirt, P. Pressed lightweight concrete containing calcined diatomite aggregate. Constr. Build. Mater. 2013, 47, 896–901. [Google Scholar] [CrossRef]
- ASTM C332-17; Standard Specification for Lightweight Aggregates for Insulating Concrete. ASTM International: West Conshohocken, PA, USA, 2017.
- Topçu, I.B.; Işikdağ, B. Manufacture of high heat conductivity resistant clay bricks containing perlite. Build. Environ. 2007, 42, 3540–3546. [Google Scholar] [CrossRef]
- Rashad, A.M. A synopsis about perlite as building material—A best practice guide for Civil Engineer. Constr. Build. Mater. 2016, 121, 338–353. [Google Scholar] [CrossRef]
- Demirboğa, R.; Gül, R. The effects of expanded perlite aggregate, silica fume and fly ash on the thermal conductivity of lightweight concrete. Cem. Concr. Res. 2003, 33, 723–727. [Google Scholar] [CrossRef]
- Al-Tamimi, A.S.; Al-Amoudi, O.S.B.; Al-Osta, M.A.; Ali, M.R.; Ahmad, A. Effect of insulation materials and cavity layout on heat transfer of concrete masonry hollow blocks. Constr. Build. Mater. 2020, 254, 119300. [Google Scholar] [CrossRef]
- Sharma, B. Properties of Light Weight Concrete Made with Expanded Perlite and Pumice. Master’s Thesis, Thapar Institute of Engineering & Technology, Punjab, Pakistan, 2019. [Google Scholar]
- Zukowski, M.; Haese, G. Experimental and numerical investigation of a hollow brick filled with perlite insulation. Energy Build. 2010, 42, 1402–1408. [Google Scholar] [CrossRef]
- Bakhtiyari, S.; Allahverdi, A.; Rais-Ghasemi, A.M. A case study on modifying the fire resistance of self-compacting concrete with expanded perlite aggregate and zeolite powder additives. Asian J. Civ. Eng. (BHRC) 2014, 15, 339–349. [Google Scholar]
- Rashad, A.M. Mitigating the Elevated Temperature Effects and Predicting the Residual Strength of Loaded RC Short Columns. Ph.D. Thesis, Structural Engineering, Faculty of Engineering, Cairo University, Cairo, Egypt, 2005. [Google Scholar]
- Hodhod, O.; Rashad, A.; Abdel-Razek, M.; Ragab, A. Coating protection of loaded RC columns to resist elevated temperature. Fire Saf. J. 2009, 44, 241–249. [Google Scholar] [CrossRef]
- Ariyaratne, I.E.; Ariyanayagam, A.D.; Mahendran, M. Lightweight Masonry Blocks with Expanded Perlite Aggregate for Bushfire Resistance. In Proceedings of the Australasian Structural Engineering Conference, Online, 11–13 November 2020. [Google Scholar]
- ASTM C188-17; Standard Test Method for Density of Hydraulic Cement. ASTM International: West Conshohocken, PA, USA, 2017.
- ASTM C109/C109M-16a; Standard Test Method for Compressive Strength of Hydraulic Cement Mortars (Using 2-in. or [50-mm] Cube Specimens). ASTM International: West Conshohocken, PA, USA, 2016.
- AS 1141.5-2000; Method for Sampling and Testing Aggregates—Particle Density and Water Absorption of Fine Aggregate. Standards Australia Limited: Sydney, Australia, 2000.
- AS 1141.4-2000; Methods for Sampling and Testing Aggregates—Bulk Density of Aggregate. Standards Australia Limited: Sydney, Australia, 2000.
- ASTM C90-16a; Standard Specification for Loadbearing Concrete Masonry Units. ASTM International: West Conshohocken, PA, USA, 2016.
- AS 1012.2-2014; Methods of Testing Concrete—Preparing Concrete Mixes in the Laboratory. Standards Australia Limited: Sydney, Australia, 2014.
- AS 1012.8.1-2014; Methods of Testing Concrete—Method for Making and Curing Concrete—Compression and Indirect Tensile Test Specimens. Standards Australia Limited: Sydney, Australia, 2014.
- ASTM C192/C192M-18; Standard Practice for Making and Curing Concrete Test Specimens in the Laboratory. ASTM International: West Conshohocken, PA, USA, 2018.
- AS 1012.3.1-2014; Methods of Testing Concrete—Determination of Properties Related to the Consistency of Concrete—Slump Test. Standards Australia Limited: Sydney, Australia, 2014.
- ASTM C143/C143M-15a; Standard Test Method for Slump of Hydraulic-Cement Concrete. ASTM International: West Conshohocken, PA, USA, 2015.
- AS 1012.5-2014; Methods of Testing Concrete—Determination of Mass per Unit Volume of Freshly Mixed Concrete. Standards Australia Limited: Sydney, Australia, 2014.
- ASTM C138/C138M-17a; Standard Test Method for Density (Unit Weight), Yield, and Air Content (Gravimetric) of Concrete. ASTM International: West Conshohocken, PA, USA, 2017.
- AS 1012.9-2014; Methods of Testing Concrete—Compressive Strength Tests—Concrete, Mortar and Grout Specimens. Standards Australia Limited: Sydney, Australia, 2014.
- ASTM C39/C39M-18; Standard Test Method for Compressive Strength of Cylindrical Concrete Specimens. ASTM International: West Conshohocken, PA, USA, 2018.
- ASTM C617/C617M-15; Standard Practice for Capping Cylindrical Concrete Specimens. ASTM International: West Conshohocken, PA, USA, 2015.
- AS/NZS 4456.4-2003; Masonry Units, Segmental Pavers and Flags—Methods of Test—Determining Compressive Strength of Masonry Units. Standards Australia Limited: Sydney, Australia, 2003.
- ASTM C567/C567M-14; Standard Test Method for Determining Density of Structural Lightweight Concrete. ASTM International: West Conshohocken, PA, USA, 2014.
- AS 1012.12.1-1998; Methods of Testing Concrete—Determination of Mass per Unit Volume of Hardened Concrete—Rapid Measuring Method. Standards Australia Limited: Sydney, Australia, 1998.
- AS/NZS 4456.14-2003; Masonry Units, Segmental Pavers and Flags—Methods of Test—Determining Water Absorption Properties. Standards Australia Limited: Sydney, Australia, 2003.
- ASTM C140/C140M-18a; Standard Test Methods for Sampling and Testing Concrete Masonry Units and Related Units. ASTM International: West Conshohocken, PA, USA, 2018.
- AS 1530.8.2-2018; Methods for Fire Tests on Building Materials, Components and Structures: Tests on Elements of Construction for Buildings Exposed to Simulated Bushfire Attack—Large Flaming Sources. Standards Australia Limited: Sydney, Australia, 2018.
- AS 1530.4-2014; Methods for Fire Tests on Building Materials, Components and Structures: Fire Resistance Tests for Elements of Construction. Standards Australia Limited: Sydney, Australia, 2014.
- Hager, I. Colour Change in Heated Concrete. Fire Technol. 2014, 50, 945–958. [Google Scholar] [CrossRef] [Green Version]
- Ali, M.; Maslehuddin, M.; Shameem, M.; Barry, M. Thermal-resistant lightweight concrete with polyethylene beads as coarse aggregates. Constr. Build. Mater. 2018, 164, 739–749. [Google Scholar] [CrossRef]
- Yao, X.; Wang, W.; Liu, M.; Yao, Y.; Wu, S. Synergistic use of industrial solid waste mixtures to prepare ready-to-use lightweight porous concrete. J. Clean. Prod. 2018, 211, 1034–1043. [Google Scholar] [CrossRef]
- AS 4773.2-2015; Masonry in Small Buildings—Construction. Standards Australia Limited: Sydney, Australia, 2015.
- Bastos, A.M.; Sousa, H.; Melo, A.F. Methodology for the Design of Lightweight Concrete with Expanded Clay Aggregates. TMS J. 2005, 73–84. [Google Scholar]
- Canberra ACT 2601; The Design and Construction of Private Bushfire Shelters. Australian Building Codes Board: Canberra, Australia, 2014.
Figure 1.
Materials: (a) cement; (b) sand; (c) expanded perlite.

Figure 2.
Scanning Electron Microscope (SEM) images of expanded perlite.

Figure 3.
Average particle size distribution of sand and expanded perlite.

Figure 4.
(a) Specific heat and (b) mass loss of expanded perlite.

Figure 5.
Thermal diffusivity of expanded perlite.

Figure 6.
Achieving SSD condition of expanded perlite.

Figure 7.
Test specimens.

Figure 8.
Compressive strength test setup of cylinder specimens.

Figure 9.
Fire test setup of masonry block.

Figure 10.
Thermocouple arrangement of masonry block.

Figure 11.
Slump test of the C-S mix: (a) shape of the slump and (b) gradual movement of the mix.

Figure 12.
Cylinder and block specimens of C-S mix.

Figure 13.
Cross-section of the C-S mix cylinder specimen.

Figure 14.
Compression failure patterns of C-S cylinders.

Figure 15.
C-S block surfaces (a) during and (b–f) after the bushfire test.

Figure 16.
Time–temperature curves of C-S block from the bushfire test.

Figure 17.
C-S block surfaces (a) during and (b–f) after the building fire test.

Figure 18.
Time–temperature curves of C-S block from the building fire test.

Figure 19.
Slump tests of C-PE mixes.

Figure 20.
Cross-section of a C-PE mix cylinder specimen.

Figure 21.
Cylinder and block specimens of C-PE mixes.

Figure 22.
Compression failure patterns of C-PE cylinders.

Figure 23.
Furnace and fire side surface time–temperature curves of C-PE blocks from the bushfire test.
Figure 23.
Furnace and fire side surface time–temperature curves of C-PE blocks from the bushfire test.

Figure 24.
Ambient side surface time–temperature curves of C-PE 100 block from the bushfire test.

Figure 25.
Ambient side surface time–temperature curves of C-PE 80 block from the bushfire test.

Figure 26.
Ambient side surface time–temperature curves of C-PE 60 block from the bushfire test.

Figure 27.
Ambient side surface time–temperature curves of C-PE 40 block from the bushfire test.

Figure 28.
Fire-exposed and ambient side surfaces of C-PE blocks after the bushfire test.

Figure 29.
Time–temperature curves of C-PE blocks from the building fire test.

Figure 30.
Ambient side surface time–temperature curves of C-PE 100 block from the building fire test.
Figure 30.
Ambient side surface time–temperature curves of C-PE 100 block from the building fire test.

Figure 31.
Ambient side surface time–temperature curves of C-PE 80 block from the building fire test.
Figure 31.
Ambient side surface time–temperature curves of C-PE 80 block from the building fire test.

Figure 32.
Ambient side surface time–temperature curves of C-PE 60 block from the building fire test.
Figure 32.
Ambient side surface time–temperature curves of C-PE 60 block from the building fire test.

Figure 33.
Ambient side surface time–temperature curves of C-PE 40 block from the building fire test.
Figure 33.
Ambient side surface time–temperature curves of C-PE 40 block from the building fire test.

Figure 34.
Fire-exposed and ambient side surfaces of C-PE blocks after the building fire test.

Figure 35.
Slump and fresh density of C-S and C-PE mixes.

Figure 36.
Hardened density and compressive strength of C-S and C-PE mixes with error bars.

Figure 37.
Comparison of the ambient side block surface temperatures from the bushfire tests.

Figure 38.
Comparison of the ambient side block surface temperatures from the building fire tests.


Table 1.
Chemical composition of cement and expanded perlite (wt%).
| Fe2O3 | Mn3O4 | TiO2 | CaO | K2O | SO3 | SiO2 | Al2O3 | MgO | Na2O | LOI | Others | |
|---|---|---|---|---|---|---|---|---|---|---|---|---|
| Cement | 3.294 | 0.146 | 0.251 | 62.792 | 0.657 | 2.32 | 19.401 | 4.329 | 3.108 | 0.108 | 3.08 | 0.514 |
| Expanded perlite | 0.918 | 0.061 | 0.119 | 0.899 | 3.443 | 0.011 | 73.497 | 12.059 | 0.133 | 3.902 | 3.22 | 1.738 |
Table 2.
Mix proportions of cement mixes in SSD condition.
| Material | C-S (C-PE 0) | C-PE 100 | C-PE 80 | C-PE 60 | C-PE 40 |
|---|---|---|---|---|---|
| Cement (kg/m3) | 478.0 | 480.2 | 480.2 | 467.7 | 467.7 |
| Sand (kg/m3) | 1380.1 | 0 | 275.0 | 561.8 | 842.7 |
| Expanded Perlite (kg/m3) | 0 | 390.5 | 312.4 | 239.4 | 159.6 |
| Effective Water (kg/m3) | 286.8 | 288.1 | 288.1 | 280.6 | 280.6 |
| Fresh Density (kg/m3) | 2145 | 1159 | 1356 | 1550 | 1751 |
(Note: Aggregates’ moisture content was considered in mix design calculations).
Table 3.
Details of test specimens.
| Test | Specimen Dimensions |
|---|---|
| L: Length, W: Width, H: Height, Ø: Diameter | |
| Compressive strength | Cylinder (100 mm Ø × 200 mm H) |
| Hardened density | Cylinder (100 mm Ø × 200 mm H) |
| Oven dry density | Cylinder (150 mm Ø × 300 mm H) |
| Water absorption | Cylinder slices (100 mm Ø × 50 mm H) |
| Fire resistance | Solid block (390 mm L × 90 mm W × 190 mm H) |
Table 4.
Fresh and hardened properties of C-S and C-PE mixes.
| Mix | Slump (mm) | Fresh Density (kg/m3) | Compressive Strength (N/mm2) | Hardened Density (kg/m3) | Oven Dry Density (kg/m3) | Water Absorption % (kg/m3) | Insulation Failure Time (min) |
|---|---|---|---|---|---|---|---|
| C-S | 35 | 2114 Average | 33.5 33.7 33.7 33.6 | 2143 2161 2147 2150 | - | 9.3 (181) 8.6 (172) 9.1 (181) 9.0 (178) 9.0 (178) | 115 |
| C-PE 100 | 20 | 1138 | 3.3 3.0 3.6 | 1224 1187 1171 | Less than 1458 | 49.6 (403) 51.6 (414) 50.2 (400) 52.2 (407) | >180 |
| Average | 3.3 | 1194 | 50.9 (406) | ||||
| C-PE 80 | 100 | 1287 | 7.1 7.2 7.6 | 1384 1395 1392 | Less than 1458 | 34.4 (356) 32.4 (348) 30.3 (337) 35.5 (358) | >180 |
| Average | 7.3 | 1390 | 33.2 (350) | ||||
| C-PE 60 | 180 | 1524 | 11.2 11.0 11.7 | 1571 1591 1609 | Less than 1458 | 20.9 (280) 22.9 (295) 23.9 (301) 23.4 (298) | >180 |
| Average | 11.3 | 1590 | 22.8 (294) | ||||
| C-PE 40 | 210 | 1755 | 16.1 16.7 16.9 | 1802 1797 1808 | 1458 | 15.1 (236) 16.8 (256) 16.8 (257) 17.3 (262) | >180 |
| Average | 16.5 | 1802 | 16.5 (253) |
Table 5.
Bushfire test results for C-S and C-PE blocks.
| Performance Criteria | C-S | C-PE 100 | C-PE 80 | C-PE 60 | C-PE 40 | |
|---|---|---|---|---|---|---|
| A crack from the fire side face to the ambient side face greater than 3 mm | No | No | No | No | No | |
| Combustibility | No | No | No | No | No | |
| Initial avg. ambient side temperature (°C) | 20 | 24 | 15 | 30 | 18 | |
| Initial avg. ambient side temperature at the end of heating phase (°C) [Rise in avg. ambient side temperature during the heating phase * (°C)] | 71 [51 *] | 29 [5 *] | 23 [8 *] | 41 [11 *] | 56 [38 *] | |
| Maximum of the avg. ambient side temperature for the duration of 90 min (°C) [Maximum rise of the avg. ambient side temperature for the duration of 90 min *(°C)] | 89 [69 *] | 45 [21 *] | 48 [33 *] | 65 [35 *] | 79 [61 *] | |
| Avg. ambient side temperature at the end of cooling phase (°C) | 76 | 44 | 47 | 62 | 67 | |
| Surface cracks on | Fire side | Yes | Yes | Yes | Yes | Yes |
| Ambient side | No | No | Yes | No | No | |
| Top | Yes | No | Yes | Yes | Yes | |
| Bottom | Yes | Yes | Yes | Yes | Yes | |
| Sides | Yes | Yes | Yes | Yes | Yes | |
| Surface discoloration | Yes | Yes | Yes | Yes | Yes | |
Table 6.
Building fire test results for C-S and C-PE blocks.
| Performance Criteria | C-S | C-PE 100 | C-PE 80 | C-PE 60 | C-PE 40 | |
|---|---|---|---|---|---|---|
| Any specific observations during the fire test | Spalling & moisture | No | No | No | No | |
| Avg. fire side temperature at the end of three hours of fire exposure (°C) [Rise in avg. fire side temperature * (°C)] | 1094 [1074 *] | 1061 [1038 *] | 1105 [1085 *] | 1098 [1074 *] | 1080 [1057 *] | |
| Avg. ambient side temperature at the end of three hours of fire exposure (°C) [Rise in avg. ambient side temperature * (°C)] | 242 [222 *] | 57 [34 *] | 72 [52 *] | 118 [93 *] | 156 [133 *] | |
| A crack from the fire side face to the ambient side face greater than 3 mm | No | No | No | No | No | |
| Insulation failure (min) | 115 | >180 | >180 | >180 | >180 | |
| Fire resistance level (FRL) | -/90/90 | -/180/180 | -/180/180 | -/180/180 | -/180/180 | |
| Surface cracks on | Fire side | Yes | Yes | Yes | Yes | Yes |
| Ambient side | Yes | No | Yes | No | No | |
| Top | Yes | Yes | Yes | Yes | Yes | |
| Bottom | Yes | Yes | Yes | Yes | Yes | |
| Sides | Yes | Yes | Yes | Yes | Yes | |
| Surface discolouration | Yes (whitish colour) | Yes (whitish colour) | Yes (whitish colour) | Yes (whitish colour) | Yes (whitish colour) | |
Publisher’s Note: MDPI stays neutral with regard to jurisdictional claims in published maps and institutional affiliations. |
© 2022 by the authors. Licensee MDPI, Basel, Switzerland. This article is an open access article distributed under the terms and conditions of the Creative Commons Attribution (CC BY) license (https://creativecommons.org/licenses/by/4.0/).
Share and Cite
MDPI and ACS Style
Ariyaratne, I.E.; Ariyanayagam, A.; Mahendran, M. Bushfire-Resistant Lightweight Masonry Blocks with Expanded Perlite Aggregate. Fire 2022, 5, 132. https://0-doi-org.brum.beds.ac.uk/10.3390/fire5050132
AMA Style
Ariyaratne IE, Ariyanayagam A, Mahendran M. Bushfire-Resistant Lightweight Masonry Blocks with Expanded Perlite Aggregate. Fire. 2022; 5(5):132. https://0-doi-org.brum.beds.ac.uk/10.3390/fire5050132
Chicago/Turabian StyleAriyaratne, Indunil Erandi, Anthony Ariyanayagam, and Mahen Mahendran. 2022. "Bushfire-Resistant Lightweight Masonry Blocks with Expanded Perlite Aggregate" Fire 5, no. 5: 132. https://0-doi-org.brum.beds.ac.uk/10.3390/fire5050132