

Topographic Factors Drive Short-Term Understory Revegetation in Burned Areas
by
 ,
,
Zhixue He
1,
Lei Wang
2,3,4,
Jun Luo
2,3,4,*,
Bin Zhang
2,3,4,
Qingchun Deng
2,3,4 and
Hui Liu
2,3,4 1
College of Life Science, China West Normal University, Nanchong 637009, China
2
School of Geographical Sciences, China West Normal University, Nanchong 637009, China
3
Sichuan Provincial Engineering Laboratory of Monitoring and Control for Soil Erosion on Dry Valleys, China West Normal University, Nanchong 637009, China
4
Liangshan Soil Erosion and Ecological Restoration in Dry Valleys Observation and Research Station, China West Normal University, Nanchong 637009, China
*
Author to whom correspondence should be addressed.
Fire 2022, 5(5), 171; https://0-doi-org.brum.beds.ac.uk/10.3390/fire5050171
Submission received: 25 August 2022
/
Revised: 25 September 2022
/
Accepted: 13 October 2022
/
Published: 20 October 2022
(This article belongs to the Special Issue Effects of Wildfire on Biodiversity)
Abstract
:Fire is a disturbance factor in forest ecosystems which has an important influence on vegetation succession. In order to reveal the natural recovery characteristics of the understory vegetation and its response to topographic factors (elevation, slope position, aspect and slope) after fire in subtropical forests, a typical subtropical forest (Xide County, China) was selected as the study area. Based on quadrat surveys and correlation analyses, the main results of this study were as follows. (1) Within four months after a fire, a total of 71 species, 52 genera and 20 families of understory vegetation species were increased, representing a rapid recovery after a fire. The total number of genera and species of understory vegetation increased by 157% and 209%, respectively. (2) Different burning intensities had different effects on the recovery of vegetation species diversity. The change in Margalef richness index was the most significant, increasing by 5.44 and 5.16 in lightly and severely burned areas, respectively. (3) The vegetation community could be divided into six types after restoration. (4) Elevation and slope were significantly correlated with the diversity and distribution characteristics of understory vegetation in the burned area. This study is useful to understand the characteristics of the short-term natural recovery of understory vegetation in subtropical forests after fire, to identify the relationship between vegetation and topographic factors in burned areas, and to provide a scientific basis for vegetation recovery.
1. Introduction
Forests are the most widespread terrestrial ecosystems, comprising an important part of the biosphere, and helping to maintain the earth’s ecological balance [1]. Forests are subject to frequent disturbances by natural and man-made factors, and fire is one of the most direct factors [2].
In highly fire-prone ecosystems, loss of biodiversity, ecosystem function or services after wildfire events occurring with unnaturally high frequency, the magnitude of extent or intensity can result in land degradation or even complete transformation of the ecosystem [2]. In the aftermath of wildfire, accelerated erosion [3] and flash flood phenomena occur [4]. Moreover, the footprint of wildfire on ecosystem services has raised the concern of the scientific community during the last decades. The characteristics of natural succession and artificial recovery of vegetation in burned areas are commonly explored with two approaches, i.e., spatial zonation and time sequences. The severity of forest fires and subsequent recovery time have profound impacts on the richness and dominance of species in burned areas, and revegetation succession in burned areas is a complex process involving both positive and negative feedback [5]. The composition of understory communities can differ following fires, and species diversity and alien species often increase [6,7,8]. Therefore, numerous studies explore the advantages of geospatial technology to assess their effects [9,10].
The topographical and soil factors of burned areas strongly impact succession and revegetation after fires [11,12,13]. As for topography, the regeneration probability of seedlings at low elevations in burned areas decreases with climate warming [12,13]. Topographic factors are particularly important for the recovery of forest vegetation in burned areas because slope, aspect and other microtopography factors indirectly affect the regeneration and recovery of vegetation after fire by influencing the microclimate (the distribution of light, heat, and water) [14,15]. Canopy height, breast height, and maximum diameter after fires vary with the slope aspect, terrain, elevation, and stand age [14]. The higher the elevation, the poorer the soil and the more exposed vegetation is to wind, perhaps resulting in a decrease in the height of vegetation [16], as well as differences in community structures and species diversity [17]. Plant growth is also closely related to soil characteristics. Carbon loss occurs mainly in the upper soil layers [18]. Repeated burning of biomass on the ground of burned areas reduces the input of organic matter into the topsoil and forms a water-repellent soil layer, resulting in significant changes in soil structure and nutrient balance [18]. As a result of fire, the soil microbial population and soil respiration decreased with increasing soil temperature, and vegetation growth was limited [19,20].
The study of burned areas mainly focuses on the Greater Khingan Mountains in China [21,22], and the southwest is also a fire-prone area, which needs further study. Investigations are also required for different fire severity and areas burned at different times or by different modalities (surface fire, crown fire, and underground fire). Burned areas in mountainous regions with subtropical climates were selected for this study. Quadrat surveys were used to collect the data of vegetation morphology and quantity, and the relationship between vegetation properties and environmental factors was quantified using correlation methods [23]. The objectives of this study were as follows: (1) to explore patterns of succession and revegetation after burning, and (2) to identify the direct and indirect effects of fire severity and topographical factors (elevation, slope and aspect, etc.) on understory vegetation recovery in burned areas. This study has the potential to shed light on the response patterns of understory vegetation in burned areas following a forest fire disturbance, and to provide support for vegetation recovery in burned areas.
2. Methods
2.1. Study Area
The study area was located at the burned areas in southwest of China (Xide County, Liangshan Prefecture, Sichuan Province) (102°12′–102°16′ N, 28°12′–28°14′ E), which is characterized by a subtropical climate [24]. The study area is highly diverse in terms of topography, slope and forest coverage. Climatic conditions are characterized by concentrated rainfall and large evaporation in the area. Both natural and human factors lead to the frequent occurrence of fires in this area, thus impacting forest production and resident well-being [7,8]. Compared with the other fire-prone areas (Greater Khingan Mountains, etc.), the terrain is more undulating and the climate is drier [24]. The forest fire occurred in this area on 7 May 2020 and lasted two days (the fire area was 200 hm2). After the fire, soil and vegetation structures were damaged, and mudslides were caused by the persistent rain. After fieldwork, all the above-ground part of shrubs and grasses died, with only the trees (Pinus yunnanensis Franch. is the main forest in the area) remaining, while the soil structure and underground part of vegetation inventory suffered less damage. The mountains are steep with many gullies and cliffs; the average slope is over 40°, and the soil (mainly torrid red soils and brown earths) moisture content is low in the burned areas (Figure 1).
2.2. Classification of Forest Fire Disturbance Severity
Fire severity was quantified by calculating burnt marks/tree height and the damage rate of tree canopy (Table 1). For the forest in the burned area, the living branches and leaves in the canopy are less than 1/3 of the whole canopy, it is regarded as burn grade I. If the living branches and leaves in the canopy are more than 1/3 of the whole canopy and less than 2/3 of the whole canopy, it is considered burn grade II. If the living branches and leaves in the canopy are more than 2/3 of the whole canopy, it is considered burn grade III. If the forest canopy is all retained, and there is no trace of fire, it is considered burn grade IV [23,25].
DR = (N1 + 2/3N2 + 1/2N3 + 1/3N4)/N
DR: canopy damage rate, Ni: I–IV the number of trees of each burn grade, N: the total number of trees.
2.3. Data Sources
Understory vegetation is rare in winter and spring due to the environmental characteristics of the burned area described above. There was no significant difference in vegetation between winter and spring for the different fire severity; two surveys were conducted in the burned areas during the growing season. The first investigation was conducted 51 days after the fire, and the second was conducted 171 days after the fire. We selected shrub quadrats (5 m × 5 m) systematically based on different elevation gradients, different aspect and different fire severity. Then, the center and four corners of each shrub quadrats were provided with herb quadrats, respectively (1 m × 1 m). A total of 45 shrub quadrats and 225 grass quadrats were set. Of these, three unburned shrub quadrats were used as controls. The type, quantity, plant height, and coverage of herb and shrub vegetation (vertical projection area of vegetation/quadrat area × 100%) in the quadrat were recorded.
2.4. Importance Value and Biodiversity Index
The importance value (Iv) is a composite measure representing the relative importance of plant species in a community. The dominant shrub and herbaceous plant species in a quadrat were obtained through calculating and comparing the importance value (Iv) [23,25,26]:
where Dr is relative abundance, Fr is relative frequency, and Pr is relative coverage.
Iv = (Dr + Fr + Pr)/3
Biodiversity index is a simple numerical value indicating the degree of species diversity in a community, which indicates the stability of communities or ecosystems [23,25,27].
The Shannon-Weiner index (H′) is one way to reflect the diversity of communities:
H′ = −∑ (Pilog2Pi)
The Pielou index (E) reflects the evenness of communities:
E = H′/lnS
The Simpson index (D) represents dominance: the larger the index value, the lower the species dominance:
D = 1 − ∑Pi2
The Margalef richness index (Ma) refers to the number of species in a community or environment:
Ma = (S − 1)/lnN
For these indices, Pi is the proportion of individuals of i species in the community, S is the total number of species, n is the number of individuals of the i species, and N is the number of individuals of all species.
2.5. M. Godron Stability
The M. Godron stability was discovered by ecologists from industrial production and introduced into plant ecology research [28]. It is calculated from the number of all species in a plant community and the frequency of these species. According to Zheng’s improvement of the M. Godron stability model [29], the analysis steps are as follows:
- Convert the frequency of all plants into the quadrat to relative frequency.
- Sort relative frequency from largest to smallest, then cumulate them.
- Calculate the reciprocal of the total number of plant species in each quadrat and gradually cumsum according to the order of plant species to correspond the cumulative value of relative frequency. A plot based on cumulative relative frequency then fits a curve (y = ax2 + bx + c). The corresponding results reflect how many percentages of species occupy how much cumulative relative frequency.
- The intersection point of the straight line y = 100 − x is the intersection point coordinate.
- The closer the distance of the intersection coordinates (x, y) to the stable point (20, 80), the more stable the quadrat.
- The close distance of the intersection coordinates to the stable points represents that the composing proportion of species in the equilibrium community is close to the counterparts in the present situation, indicating that the community is in a stable state.
2.6. Correlation Analysis
Based on the data from two surveys after fire, we analyzed the correlation between the recovery of vegetation diversity and environmental factors (elevation, slope, fire severity, and soil information) using the SPSS 22.0 software [30].
2.7. TWINSPAN Quantitative Classification
TWINSPAN quantitative classification is a typical hierarchical classification method, which has been widely used in vegetation community studies. In this study, we used WinTWINS 2.3 software to perform TWINSPAN quantitative classification based on the importance value matrix and environmental factor matrix of vegetation species in typical quadrats [31].
2.8. Detrended Canonical Correspondence Analysis (DCCA)
DCCA is a multivariate analysis technique analyzing the relationships between various topographic factors and vegetation [5,30]. The topographic factors here included elevation, slope, aspect, and slope position. The slope position was quantified by assigning 1, 2, 3, 4, and 5 to the bottom, downhill, mid-slope, uphill, and top of the slope, respectively; the larger the number, the higher the slope position. The slope aspect was based on due west as the starting point (0°). The original value of the aspect could not directly represent the degree of sun exposure, so each aspect was represented by the assignment of a categorical number. Zero represented north slope (67.15–112.15°), 1 represented the northeast slope (112.15–157.15°) and the northwest slope (22.15–67.15°), 2 represented the west slope (317.15–22.15°) and the east slope (157.15–202.15°), 3 represented the southwest slope (292. 15–317.15°) and the southeast slope (202.15–247.15°), 4 represented the south slope (247.15–292.15°). The larger the number, the drier and hotter the conditions [32].
3. Results
3.1. Vegetation during the Growing Season
3.1.1. The Composition of Vegetation
The survey in June showed that there were 24 families, 33 genera, and 34 species of herbs and shrubs; the ratio of families, genera, and species was 1:1.37:1.41. The survey in October revealed that there were 44 families, 85 genera, and 105 species of herbs and shrubs; the ratio of families, genera, and species was 1:1.9:2.4, and the ratio of genera and species was 1:1.23. The herb layer was dominated by Asteraceae and Gramineae, accounting for 21% and 12% of the herb species. There were an additional 71 species, 52 genera, and 20 families of herbs and shrubs in October than in June. The total genera and species of herbs and shrubs increased significantly by 157% and 209%, respectively.
Important values were greater than 0.1 and 0.05 for the dominant shrub and herb species, respectively. In the October survey, there were four dominant shrubs and five dominant herbs. The importance value of Quercus guyavaefolia H. Leveille (Qg) in the shrub layer was 0.49, accounting for 31% of the total number of individuals—it was the primary dominant shrub species. Leptodermis potanini Batalin (Lp), Machilus pingii Cheng ex Yang (Mp), and Vaccinium fragile Franch. (Vf) had the values of 0.11, 0.11, and 0.1, respectively, and functioned as secondary dominant species. The important values of Rabdosia adenantha (Diels) Hara (Ra), Elsholtzia rugulosa Hemsl. (Er), and Monogramma trichoidea J. Sm. (Mt) were 0.08, 0.07, and 0.07, respectively, so they were primary dominant herb species. Artemisia argyi H. Lév. and Vaniot (Aa) and Cymbopogon goeringii (Steud.) A. Camus. (Cg) had the importance value of 0.05, suggesting they were secondary dominant herb species (Figure 2).
Four months after the fire, the importance value of the main dominant species of Qg increased from 0.49 to 0.69, and the importance value of Lyonia ovalifolia (Wall.) Drude var. elliptica Hand.-Ma (Lo) decreased and became a subdominant species. The emergence of four additional secondary dominant species indicated that the dominant shrub species had undergone obvious changes. A similar phenomenon also appeared at the herb layer, leading to obvious changes in the dominant species. The importance value of the dominant species Mt decreased from 0.22 to 0.07, and the importance value of Paspalum distichum Linnaeus (Pd), Tripogon chinensis (Franch.) Hack. (Tc), and Potentilla leuconota D. Don (Pl) decreased and broke away from the ranks of the dominant species (Figure 2).
3.1.2. Species Diversity Indices
The results of the first survey showed that the Margalef index decreased with increasing fire severity. The Simpson index was highest in the moderately burned areas (0.91), followed by the lightly burned areas and the severely burned areas. The Pielou index was highest in the severely burned areas (0.13), followed by lightly burned areas and severely burned areas. The Shannon-Weiner index was the lowest in moderately burned areas (0.31), followed by lightly burned areas and severely burned areas. Except for the Simpson index of moderately and severely burned areas (p < 0.05), there was no significant difference among biodiversity indices of different fire severity areas (p > 0.05) (Figure 3).
According to the second survey results, the Shannon-Weiner index and the Pielou index increased with increasing fire severity. For the Shannon-Wiener index, there was a significant (p < 0.05) difference between lightly burned areas and severely or moderately burned areas. The Simpson index was highest in the lightly burned areas, followed by the severely burned areas and the moderately burned areas. The Margalef index was highest in lightly burned areas (10.08), followed by severely burned areas and moderately burned areas (8.09 and 6.41, respectively), and there was a significant difference between lightly and moderately burned areas (p < 0.05). The maximum values of the Shannon-Wiener index and Pielou index appeared in quadrat S5, which belonged to a severely burned area. After the fire, due to fewer competing species, the herbaceous vegetation quickly recovered, and the total number of individual plants was as high as 405. The maximum values of the Simpson index and Margalef index were in lightly burned quadrats L7 and L6 (0.92 and 4.67, respectively). Since these areas were burned with low severity, most of the vegetation was not burned, and the damage to the community structure was low. As a result, the dominant species of vegetation did not obviously change. The minimum value of the Margalef index was 2, which appeared in quadrat S5, a severely burned area. This quadrat was dominated by fast-growing herbs and shrubs. Although the total number of individual plants was high, there were only 13 species (Figure 3).
The comparison of data between the two survey periods showed that after a period of natural recovery after fire, the Margalef index of different fire severity plots was higher than that of the unburned land. Among them, the increases in lightly burned areas and severely burned areas were the most obvious (p < 0.05), increasing by 4.48 and 5.16, respectively. Accordingly, the numbers of species and individuals recovered and increased quickly after a forest fire. The increase in vegetation was accompanied by the decrease in dominant species dominance, significantly decreasing the Shannon-Wiener index and Pielou index (p < 0.05), and increasing the Simpson index.
3.1.3. Stability Analysis
The stability fitting curve of the lightly burned areas was y = −0.0015x2 + 1.0647x + 7.5858 (R2 = 0.99), the coordinate of the intersection point was (46.2, 53.8), and the distance to the stable point (20, 80) was 37.05. The stability fitting curve of the moderately burned areas was y = −0.0059x2 + 1.5729x + 1.3283 (R2 = 0.99), the coordinate of the intersection was (42.4, 57.6), and the distance to the stable point (20, 80) was 31.68. The stability fitting curve of the severely burned areas was y = −0.0021x2 + 1.1234x + 7.6974 (R2 = 0.99), the coordinate of the intersection was (45.6, 54.3), and the distance to the stable point (20, 80) was 36.27. The stability of moderately burned areas was highest and that of lightly burned areas was lowest (Figure 4a).
The stability fitting curve of the lightly burned area was y = −0.0092x2 + 1.7693x + 10.087 (R2 = 0.99), the coordinate of the intersection (37.2, 63.1), and the distance to the stable point (20, 80) was 24.11. The stability fitting curve of the moderately burned area was y = −0.0105x2 + 1.9195x + 7.2274 (R2 = 0.98), the coordinate of the intersection (36.5, 63.7), and the distance to the stable point (20, 80) was 23.19. The stability fitting curve of the severely burned areas was y = −0.0116x2 + 2.0278x + 8.579 (R2 = 0.99), the coordinate of the intersection was (35.1, 65.2), and the distance to the stable point (20, 80) was 21.14. The overall community stability in descending order was severely burned areas, moderately burned areas, and lightly burned areas (Figure 4b).
Two surveys showed that the vegetation of the severely burned areas and the moderately burned areas quickly recovered within a short period after the fire. However, the intersection of the stability curve for each burned area and the standard line was far from the stable point (20, 80) so that the community stability at the early stage of vegetation recovery was relatively low in this research area.
3.2. Correlation between Vegetation Diversity and Environmental Factors
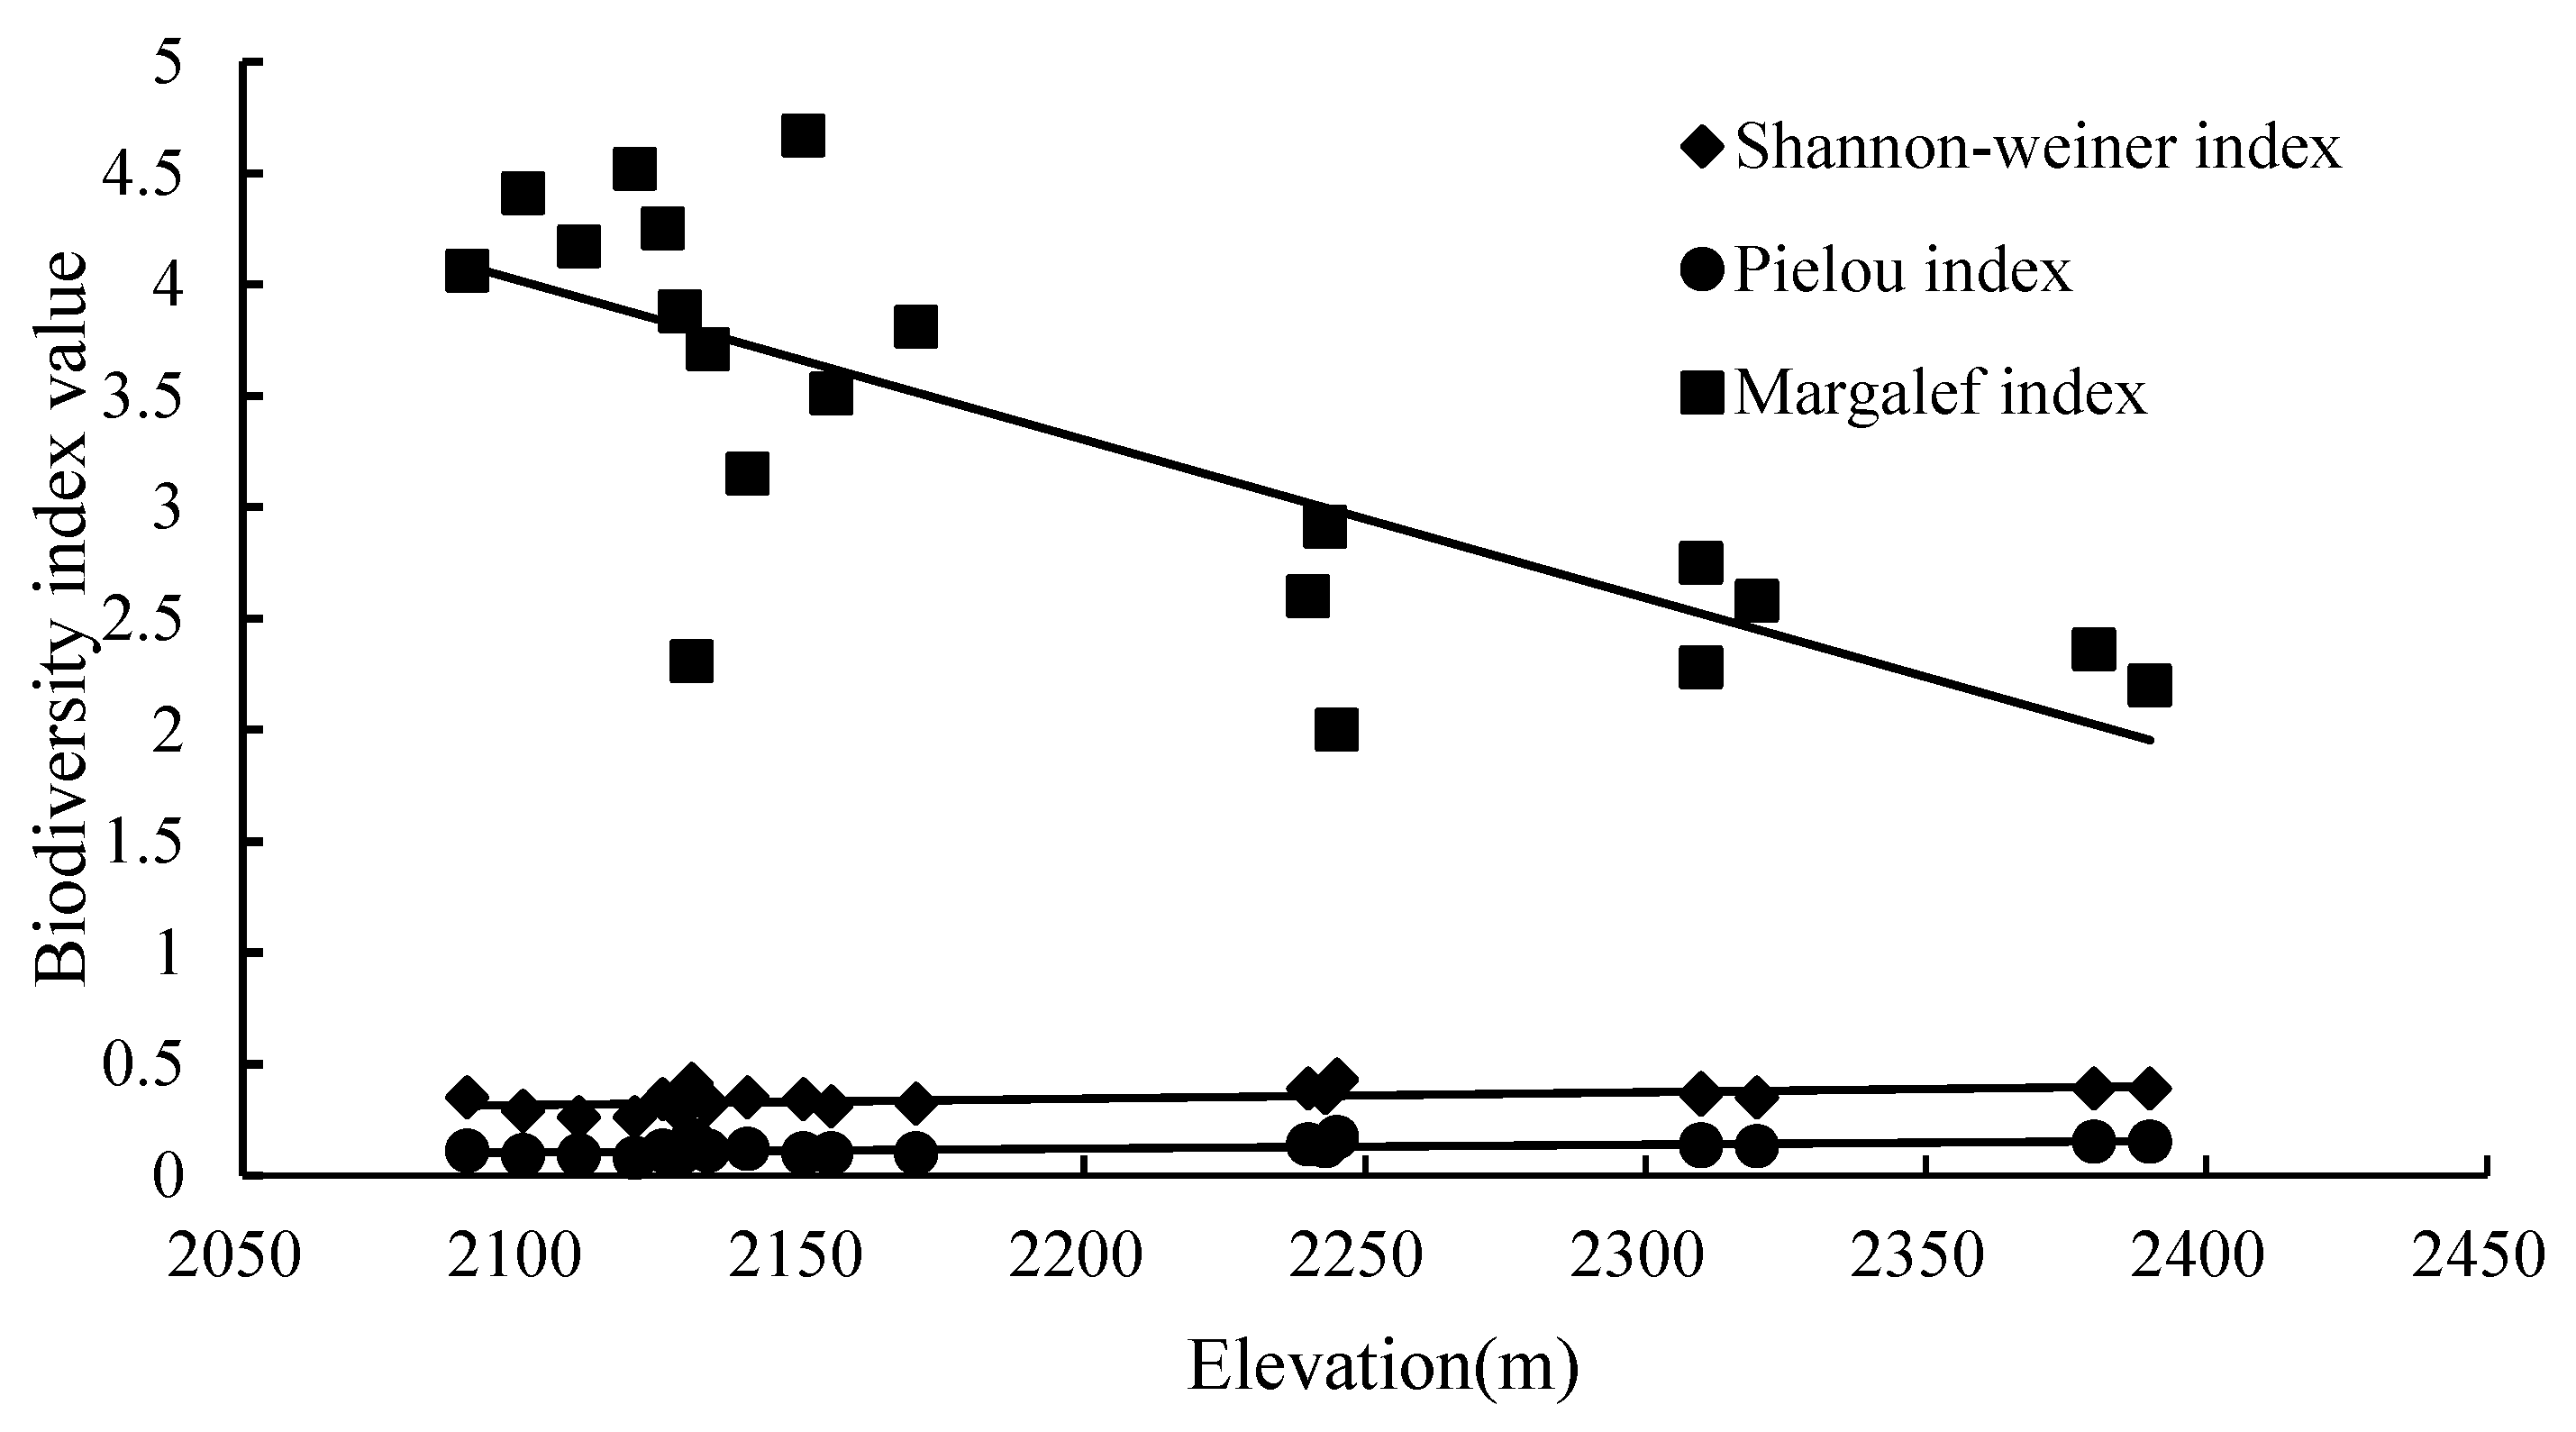
Elevation was positively correlated with the Shannon-Wiener index (0.621, p < 0.001) and Pielou index (0.624, p < 0.001), whereas elevation was negatively correlated with the Margalef index (−0.628, p < 0.001) and the number of species (−0.616, p < 0.001) (Table S1). With the increase in elevation, only the species with strong tolerance to harsh environment and fast growth rates survived in the process of succession; as such, species uniformity in these higher elevation quadrats increased. As the elevation increased, the Shannon-Wiener index and Pielou index of herbs and shrubs gradually increased, while the Margalef index gradually decreased. The fitted straight lines were y = 0.0003x − 0.2902 (R2 = 0.3529), y = 0.0002x − 0.2697 (R2 = 0.4566), and y = −0.0071x + 18.921 (R2 = 0.6021), respectively (Figure 5). Fitting straight lines were successful. The results showed that there was a significant correlation between elevation and understory vegetation diversity, and vegetation diversity showed regular changes with elevation.
The slope had a negative correlation with the Shannon-Wiener index (−0.482, p < 0.05) and the total number of individuals (−0.435, p < 0.05), and the slope showed a positive correlation with the Simpson index (0.48, p < 0.05). Fire severity was positively correlated with the Shannon-Wiener index (0.58, p < 0.001) and Pielou index (0.35, p < 0.05). Fire severity had a negative correlation with the number of species (−0.42, p < 0.05). Soil moisture showed a significantly positive correlation with the Simpson index (0.39, p < 0.05); the soil temperature showed a positive correlation with the total number of individuals (0.392, p < 0.05), and a negative correlation with the Simpson index (−0.43, p < 0.05) (Table S1). The wetter the soil was, the lower the dominance of certain species was.
3.3. Vegetation Classification
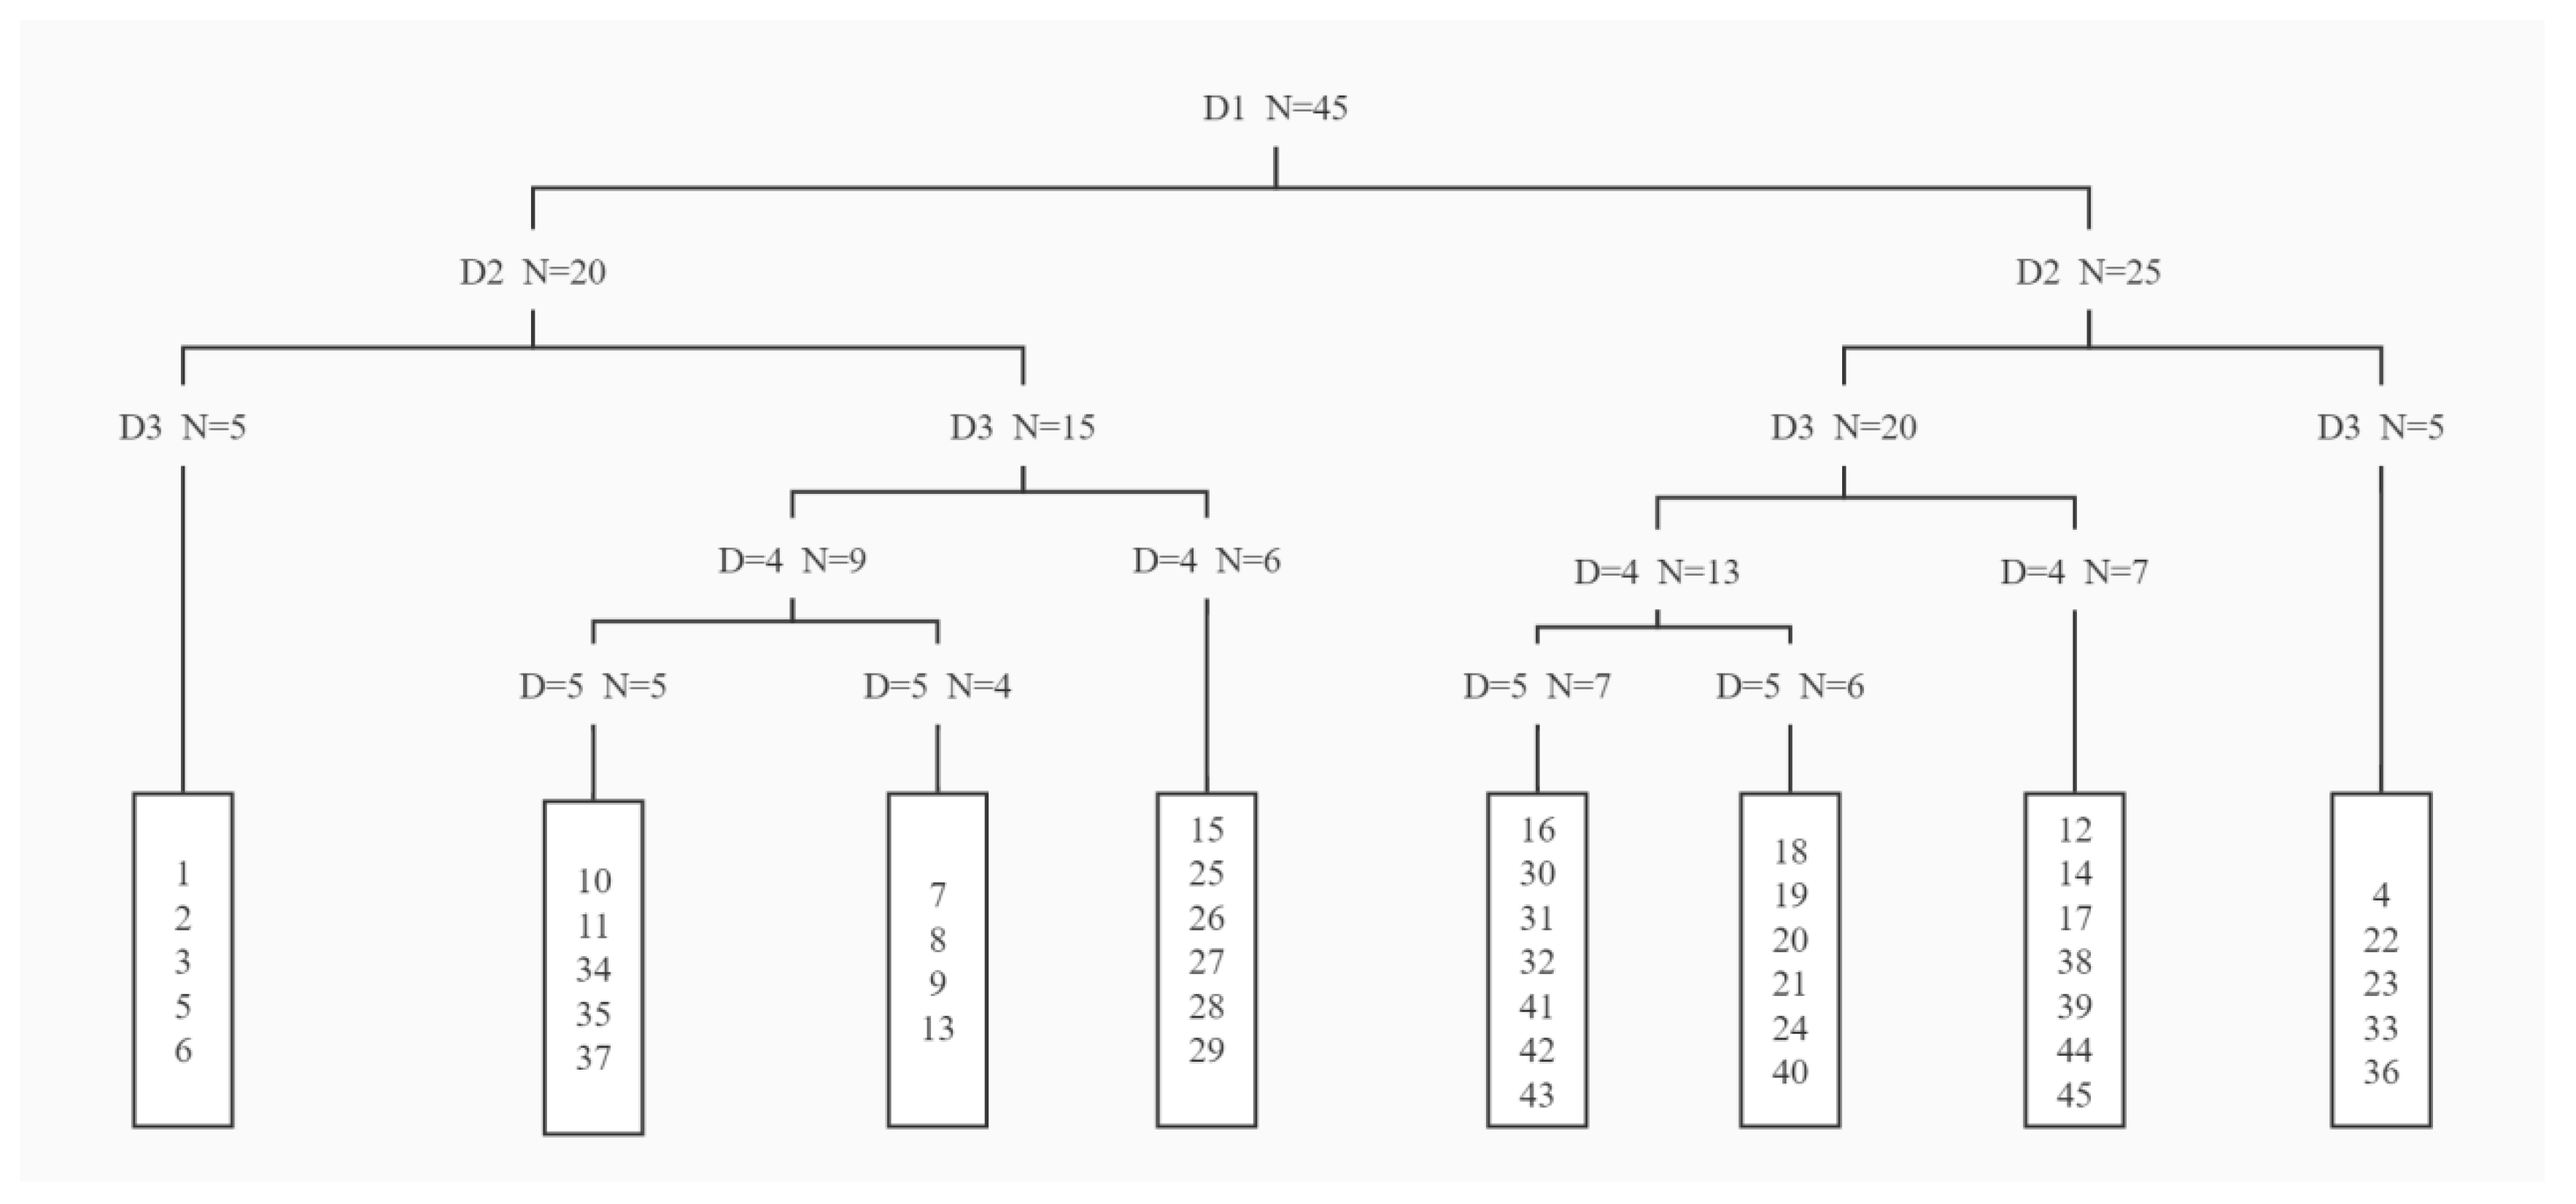
In this study, TWINSPAN classification method was used to classify vegetation into six vegetation community types (Figure 6 and Table 2):
Community A: Qg-Ra community. The community was composed of quadrats 1, 2, 3, 5 and 6. It was mainly distributed on the sunny slope with higher elevation and slower slope. The main vegetation also included Campylotropis hirtella (Franch.) Schindl. (Ch), Vf, Lp, Er, Cyperus cyperoides (L.) Kuntze (Cc), Imperata cylindrica (Ic), etc.
Community B: Lp-Ra community. The community was composed of quadrats 7–11, 13, 34, 35 and 37. It was mainly distributed on the shady slope with higher elevation and steeper slope. In addition to the dominant species, shrubs included Ch, Machilus nanm (Mn), etc.; herbs included Echinochloa crusgalli, Cc, Aa, Uraria lagopodoides, etc.
Community C: Qg-Mt community. The community was composed of quadrats 15 and 25–29. It was mainly distributed on the semi-shady slope with steeper slope. In addition to the dominant species, shrubs included Vf, Mn, etc.; herbs included Polygonatum verticillatum, Cc, Aa, Er, Cg, etc.
Community D: Qg-Cg community. The community was composed of quadrats 16, 18–21, 24, 31, 32 and 40–43. The community was mainly distributed on the shady slope. In addition to the dominant species, shrubs included Ch, Mn, Hypericum patulum Thunb.ex Murray (Hp), etc.; herbs include Mt, Er, Cg, etc.
Community E: Duhaldea cappa (Buchanan-Hamilton ex D. Don) Pruski and Anderberg (Dc)-Lp community. The community was composed of quadrats 12, 14, 17, 38, 39, 44 and 45. The community was mainly distributed on the semi-shady slope with steep slope. In addition to the dominant species, shrubs included Qg, Vf, Mn, etc.; herbs include Mt, Er, Aa, Pd, etc.
Community F: Qg-Leontopodium leontopodioides (Willd.) Beauv. (Ll) community. The community was composed of quadrats 4, 22, 23, 33 and 36. It was mainly distributed on the semi-shady slope with steep slope and large elevation span. The main vegetation also included Dc, Vf, Mn, Cc, Heteropogon contortus (L.) P. Beauv. ex Roem. et Schult. (Hc), Aa, Pd, etc.
3.4. The DCCA Analysis of Vegetation Community and Topographical Factors
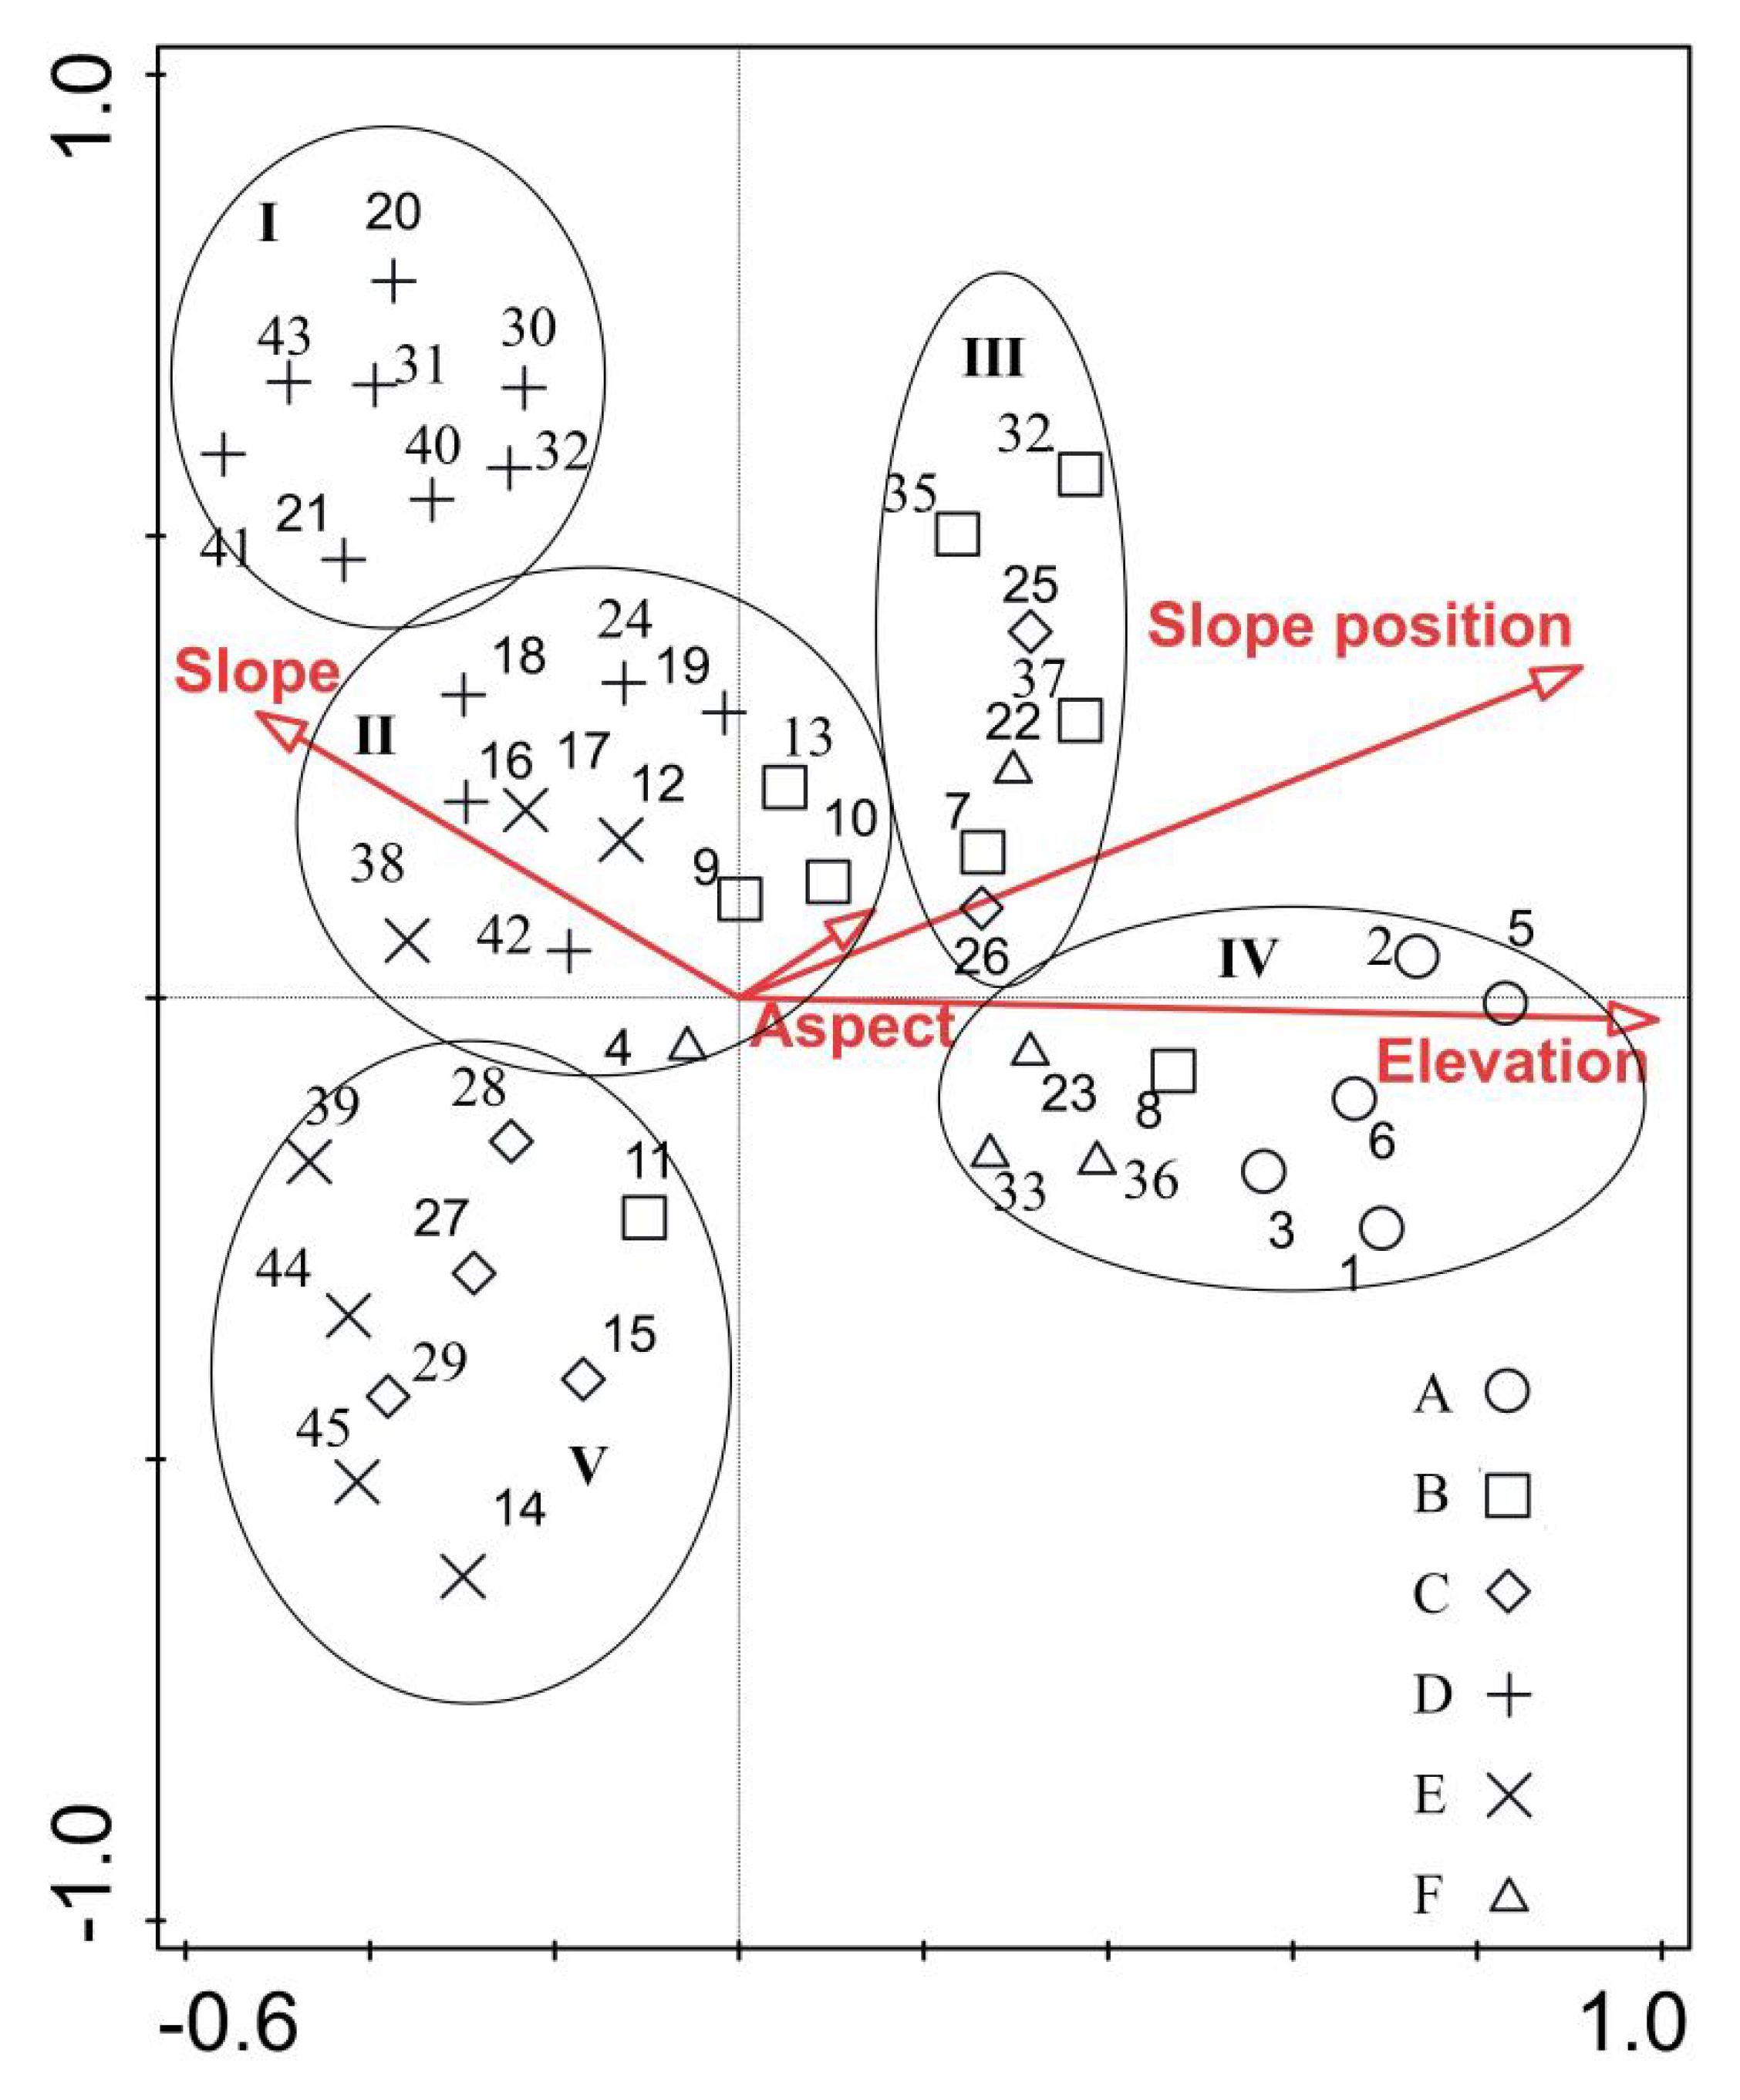
Based on TWINSPAN classification, understory vegetation community (shrub and herb community) was divided into five categories according to the environment. The sum of the eigenvalues of the first two axes of DCCA accounted for 61.09% (>50%) of the total eigenvalues. The characteristic value of the first axis was 0.36 and showed a significantly positive correlation with slope position and elevation, a positive correlation with slope direction, and a negative correlation with slope. Along the direction of the first ordination axis, the vegetation survival presented a gradient that shifted to high elevation and warm and dry directions, which mainly reflected the changing trend of elevation. The characteristic value of the second ordination axis was 0.21 and showed a positive correlation with slope, slope position, and aspect, and a weak negative correlation with elevation. Along the second ordination axis, the vegetation survival presented a trend of water and heat conditions that changed to steep (dry), sunny (warm), and uphill (dry) directions. Based on the angle between each environmental factor and the ordination axis, there is a significant correlation between elevation and vegetation distribution in burned areas (Figure 7).
The ecotope I, II, and V were in the second and third quadrants of the ordination graph, and ecotope III and IV were in the first and fourth quadrants of the ordination graph. The ecotope I appeared on the downslope of steep and shady slopes at low elevations, and its environment was characterized as being shady and dry. The ecotope II and V appeared on the gentle and half sunny slope at low elevations, and their environment was warm and wet. The ecotope III occurred on the downhill parts of gentle, sunny slopes at low elevations, and its environment was warm and wet. The ecotope IV occurred on the upper parts of gentle, sunny slopes at high elevations, and its environment was warm and dry.
4. Discussion
4.1. The Influence of Fire on Vegetation Communities
It could be discerned from the comparison of the survey results before and after the vegetation growing season: the relationship between species diversity and stability was not a simple linear relationship [33,34]. After the fire, a large amount of vegetation was burned, and gaps were created for new plant growth. The nutrient resources and space resources available for the new vegetation greatly increased, which prompted the species diversity of burned land to become greater than that of unburned land. However, in cases where the damage to the severely burned areas is too severe, the vegetation was dominated by fast-growing and highly tolerant vegetation which colonized rapidly; this caused the stability of severely burned areas to be quickly restored, but the species richness was lowered. Therefore, although severely burned areas had the highest stability, their species diversity was lower than lightly burned areas [35]. Our results were not consistent with previous findings, that greater species diversity and more complex community structures lead to higher community stability [36,37]. The reason is that the climate in the study area is dry and the terrain is undulating, which is very different from other areas [24]. Future research should further elucidate mechanisms linking plant community shifts to fire severity through studies of functional traits and quantitative community phylogenetic patterns.
We found that the intersection of the community stability curve and the standard line in each burned area was distant from the stable point (20, 80). The species of the quadrats did not form stable interspecific relationships, the species composition and quantity were variable and the community structure was still unstable. With the extension of post-fire time, the competition between species intensified, and the community structure changed correspondingly, which prompted recovery of the stability of vegetation communities [34]. Due to the short investigation time of our study, we only studied the changes of vegetation community stability in a short time. Follow-up work will require a long and ongoing investigation to reflect the long-term dynamic characteristics of vegetation community stability.
4.2. The Impacts of Other Factors on Short-Term Vegetation Recovery in Burned Areas
The speed and duration of the secondary succession of vegetation in the burned areas depends on the timing and severity of the fire. More severe fire led to longer succession duration and slower revegetation [25,35,38]. Environmental factors (topographic factors, soil factors, etc.) had a significant impact on the rate and distribution of natural vegetation regrowth. Previous studies have shown that elevation and slope are the main influencing factors [38,39,40]. With the increase in elevation and slope, the drainage conditions of the soil become better, the ground water level tends to be lower, the soil layers become thinner, vegetation is affected by stronger wind and the root fixation ability of vegetation is weaker, which cause water and soil erosion to occur easily [40]. These conditions are not suitable for vegetation growth, declining vegetation diversity, and only those species with strong tolerance to harsh environment can thrive. Topographic factors such as elevation and slope affect soil nutrients essential for vegetation indirectly by affect soil moisture, temperature, and pH, which in turn affects species diversity and distribution [41]. After fire, lower canopy cover causes the understory to receive more light [42]. Understory vegetation can grow faster and develop better because more nutrients and space resources can be utilized [42]. Additionally, changes in nitrogen, phosphorus, and potassium in the soil after fire have an important impact on the growth and development of understory vegetation [43]. In the process of ecosystem recovery, the succession of vegetation and soil occur simultaneously [20,43]. The succession of community not only reflects the changes in the species compositions and community structures of vegetation itself, but also the changes in habitats, especially in the soil environment [44]. Therefore, the synergistic coupling between vegetation succession and soil succession after wildfire should be further considered in future studies, which has important implications for revealing the ecological cascading effects of wildfires.
4.3. The Artificial Intervention of Vegetation Recovery in Burned Areas
Due to the death of trees following the fire, various nutrient resources and spaces increase, and more light is available for seed germination, resulting in the rapid emergence of herbs and shrubs [45]. The dominant species at the initial stages following the fire were largely herbs, among which Asteraceae and Gramineae were common. There were fewer shrub seedlings, and the species diversity of the herb layer was significantly higher than that of the shrub layer [33]. The rapid growth of herb vegetation usually leads to intensified interspecific competition. The succession of vegetation to climax community was limited by the dominance of single or few herb species [33]. Manual intervention may be needed to facilitate regrowth in the burned areas. In the process of artificially intervening vegetation recovery, more attention is needed regarding soil and water conservation and vegetation diversity. The recovery of natural vegetation can be accelerated through artificial measures such as seed reproduction and vegetative reproduction. The recovery of shrubs may be particularly important to break the competitive advantage of herbs and to achieve ecological balance [46]. It is necessary to consider the influence of environmental factors, such as elevation and slope. For example, it may be optimal to carry out regeneration projects on gentle and half sunny slope at low elevations. According to the different degrees of fire damage, corresponding measures should be adopted to save costs while recovering vegetation communities reestablish their structure and function [47].
Supplementary Materials
The following supporting information can be downloaded at: https://0-www-mdpi-com.brum.beds.ac.uk/article/10.3390/fire5050171/s1, Table S1: Correlation between environmental factors and vegetation biodiversity index (**: p < 0.01, *: p < 0.05; EL: elevation; TEMP: temperature; H′: Shannon-Wiener index; E: Pielou index; D: Simpson index; Ma: Margalef index).
Author Contributions
Conceptualization, B.Z. and J.L.; methodology, Z.H. and J.L.; validation, J.L. and Q.D.; analysis, Z.H. and J.L.; writing—original draft preparation, Z.H. and J.L.; investigation, H.L.; supervision, L.W.; project administration, B.Z., J.L. and L.W. All authors have read and agreed to the published version of the manuscript.
Funding
Jun Luo, Research Startup Project of China West Normal University, (412732, 412745). Bin Zhang, National Natural Science Foundation of China, (41971015).
Informed Consent Statement
Informed consent was obtained from all subjects involved in the study.
Data Availability Statement
The data presented in this study are available on request from the corresponding author. The data are not publicly available due to the dataset has not been created.
Conflicts of Interest
The authors declare no conflict of interest.
Abbreviations
| H′ | The Shannon-Weiner index |
| E | The Pielou index |
| D | The Simpson index |
| Ma | The Margalef richness index |
| Qg | Quercus guyavaefolia H. Leveille |
| Lp | Leptodermis potanini Batalin |
| Mp | Machilus pingii Cheng ex Yang |
| Vf | Vaccinium fragile Franch. |
| Ra | Rabdosia adenantha (Diels) Hara |
| Er | Elsholtzia rugulosa Hemsl. |
| Mt | Monogramma trichoidea J. Sm. |
| Aa | Artemisia argyi H. Lév. and Vaniot |
| Cg | Cymbopogon goeringii (Steud.) A. Camus. |
| Lo | Lyonia ovalifolia (Wall.) Drude var. elliptica Hand.-Ma |
| Pd | Paspalum distichum Linnaeus |
| Tc | Tripogon chinensis (Franch.) Hack. |
| Pl | Potentilla leuconota D. Don |
| Dc | Duhaldea cappa (Buchanan-Hamilton ex D. Don) Pruski and Anderberg |
| Ll | Leontopodium leontopodioides (Willd.) Beauv. |
| Ch | Campylotropis hirtella (Franch.) Schindl. |
| Cc | Cyperus cyperoides (L.) Kuntze |
| Hp | Hypericum patulum Thunb.ex Murray |
| Hc | Heteropogon contortus (L.) P. Beauv. ex Roem. et Schult. |
References
- John, P.C.; Stephen, W.P. Successional diversity and forest ecosystem function. Ecol. Res. 2001, 16, 895–903. [Google Scholar]
- Fulé, P.Z.; Allison, E.C.; Thomas, A.H.; Covington, W.W. Effects of an Intense Prescribed Forest Fire: Is It Ecological Restoration? Restor. Ecol. 2004, 12, 220–230. [Google Scholar] [CrossRef]
- Stefanidis, S.; Alexandridis, V.; Spalevic, V.; Mincato, R.L. Wildfire Effects on Soil Erosion Dynamics: The Case of 2021 Megafires in Greece. Agric. For. 2022, 68, 49–63. [Google Scholar]
- Wilder, B.A.; Lancaster, J.T.; Cafferata, P.H.; Coe, D.B.; Swanson, B.J.; Lindsay, D.N.; Kinoshita, A.M. An analytical solution for rapidly predicting post-fire peak streamflow for small watersheds in southern California. Hydrol. Process. 2021, 35, e13976. [Google Scholar] [CrossRef]
- Liu, B.F.; Liu, G.J.; Wang, Z.C. Structure changes and succession dynamic of the natural secondary forest after severe fire interference. J. For. Res. 2009, 20, 123–130. [Google Scholar] [CrossRef]
- Evgeniya, S.; Yves, B.; Suzanne, B. Influence of fire intensity on structure and composition of jack pine stands in the boreal forest of Quebec: Live trees, understory vegetation and dead wood dynamics. For. Ecol. Manag. 2008, 255, 2916–2927. [Google Scholar]
- Keeley, E.J.; Daniel, L.; Fotheringham, C.J. Fire and grazing impacts on plant diversity and alien plant invasions in the southern Sierra Nevada. Ecol. Appl. 2003, 13, 1355–1374. [Google Scholar] [CrossRef]
- Hart, S.A.; Chen, H.Y.H. Fire, logging, and overstory affect understory abundance, diversity, and composition in boreal forest. Ecol. Monogr. 2008, 78, 123–140. [Google Scholar] [CrossRef]
- Stefanidis, S.; Alexandridis, V.; Mallinis, G.A. Cloud-based mapping approach for assessing spatiotemporal changes in erosion dynamics due to biotic and abiotic disturbances in a Mediterranean peri-urban forest. CATENA 2022, 218, 106564. [Google Scholar] [CrossRef]
- Silvestro, R.; Saulino, L.; Cavallo, C.; Allevato, E.; Pindozzi, S.; Cervelli, E.; Saracino, A. The Footprint of Wildfires on Mediterranean Forest Ecosystem Services in Vesuvius National Park. Fire 2021, 4, 95. [Google Scholar] [CrossRef]
- FuentesRamirez, A.; AlmonacidMuñoz, L.; MuñozGómez, N.; Moloney, K.A. Spatio-Temporal Variation in Soil Nutrients and Plant Recovery across a Fire-Severity Gradient in Old-Growth Araucaria-Nothofagus Forests of South-Central Chile. Forests 2022, 13, 448. [Google Scholar] [CrossRef]
- Kemp, K.B.; Higuera, P.E.; Morgan, P.; Abatzoglou, J.T. Climate will increasingly determine post-fire tree regeneration success in low-elevation forests, Northern Rockies, USA. Ecosphere 2019, 10, e02568. [Google Scholar] [CrossRef]
- Meng, R.; Dennison, P.E.; Huang, C.; Moritz, M.A.; D’Antonio, C. Effects of fire severity and post-fire climate on short-term vegetation recovery of mixed-conifer and red fir forests in the Sierra Nevada Mountains of California. Remote Sens. Environ. 2015, 171, 311–325. [Google Scholar] [CrossRef]
- Kong, F.H.; Li, X.Z.; Yin, H.W.; Wang, X.G.; Xie, F.J. Gradient analysis on the influence of terrain on the forest landscape pattern in the burned blanks of the north slope of Mt. Daxing’anling. Acta Ecol. Sin. 2004, 24, 1863–1870. [Google Scholar]
- Kikuchi, T.; Miura, O. Vegetation patterns in relation to micro-scale landforms in hilly land regions. Vegetatio 2004, 106, 147–154. [Google Scholar] [CrossRef]
- Takaoka, S.; Sasa, K. Landform effects on fire behavior and post-fire regeneration in the mixed forests of northern Japan. Ecol. Res. 1996, 11, 339–349. [Google Scholar] [CrossRef]
- Bai, A.; Fu, B.; Qu, L.; Wang, M.; Sun, J. The study of characteristics of soil microbial communities at high severity burned forest sites for the Great Xingan Mountains: An example of slope and aspect. Acta Ecol. Sin. 2013, 33, 5201–5209. [Google Scholar]
- Inbar, A.; Lado, M.; Sternberg, M.; Tenau, H.; Ben-Hur, M. Forest fire effects on soil chemical and physicochemical properties, infiltration, runoff, and erosion in a semiarid Mediterranean region. Geoderma 2014, 221, 131–138. [Google Scholar] [CrossRef]
- Devanshi, S.; Priyanka, S.; Ujjwal, K.; Achlesh, D.; Kusum, A. Effect of forest fire on soil microbial biomass and enzymatic activity in oak and pine forests of Uttarakhand Himalaya, India. Ecol. Process. 2021, 10, 394–407. [Google Scholar]
- Zhang, J.S.; Devyatova, T.A.; Grigorjevskaya, A.Y. Fire Influence on the soil and plant cover of Forests in the Central Chernozem Region of Russia. Arid. Ecosyst. 2014, 4, 285–293. [Google Scholar]
- Liang, D.Z.; Zhao, Y.S.; Xin, Y. Soil greenhouse gases fluxes and the affecting factors of natural secondary forest from seriou-sly burned area in Greater Khingan Mountains, Chin. J. Appl. Ecol. 2019, 30, 777–784. [Google Scholar]
- Guo, X.Y.; Zhang, H.Y.; Wang, Y.Q.; Zhao, J.J.; Zhang, Z.X. The driving factors and their interactions of fire occurrence in Greater Khingan Mountains, China. J. Mt. Sci. 2020, 17, 2674–2690. [Google Scholar] [CrossRef]
- Chen, X.X.; Li, H.L.; Dong, Z.; Wang, Q.; Chen, P.; Li, X.J. Relationship of shrubs and herbs species diversity under different fire intensities with soil factors. Acta Bot. Boreali-Occident. Sin. 2020, 40, 130–140. [Google Scholar]
- Bai, Y.; Wang, B.; Wu, Y.D.; Liu, B. Fire Environment of Forest Fire Formation in Liangshan Prefecture. For. Resour. Manag. 2020, 5, 116. [Google Scholar]
- Chu, Y.Q. The impact on vegetation properties from foret fire in pinus tabulaeformis forest. Beijing For. Univ. 2017, 1, 96–103. [Google Scholar]
- Zhang, J.T. Vegetation Quantitative Ecology Method; China Science and Technology Press: Beijing, China, 1995. [Google Scholar]
- Vajari, K.A.; Jalilvand, H.; Pourmajidian, M.R.; Espahbodi, K. The effect of canopy gaps on biodiversity of herbaceous species in an oriental beech (Fagus orienatlis Lipsky) stand. Res. J. For. 2011, 5, 36–44. [Google Scholar] [CrossRef] [Green Version]
- Godron, M.; Daget, P.; Poissonet, J.; Poissonet, P. Some aspects of heterogeneity in grasslands of Cantal (France). Int. Symp. Stat. Ecol. New Haven 1971, 1969, 397–415. [Google Scholar]
- Zheng, Y. Comparison of methods for studying stability of forest community. Sci. Silvae Sin. 2000, 36, 28–32. [Google Scholar]
- Moradi, G.; Vacik, H. Relationship between vegetation types, soil and topography in southern forests of Iran. J. For. Res. 2018, 29, 1635–1644. [Google Scholar] [CrossRef]
- Wang, Y.J. Factors influencing the distribution and growth of dwarf bamboo, Fargesia nitida, in a subalpine forest in Wolong Nature Reserve, southwest China. Ecol. Res. 2009, 24, 1013–1021. [Google Scholar] [CrossRef]
- Qiu, Y.; Zhang, J.T. The ordination axes clustering based on detrended canonical correspondence analysis ordination and its application to the analysis of the ecological gradients of plant communities. Acta Ecol. Sin. 2000, 20, 199–206. [Google Scholar]
- Poudel, D.R.; Chen, H.Y.H.; Mohan, K.C.; Ge, Z.; Ruan, H. Understory Vegetation Dynamics across a Poplar Plantation Chronosequence in Reclaimed Coastal Saline Soil. Forests 2019, 10, 764. [Google Scholar] [CrossRef] [Green Version]
- Thibaut, L.M.; Connolly, S.R. Understanding diversity-stability relationships: Towards a unified model of portfolio effects. Ecol. Lett. 2013, 16, 140–150. [Google Scholar] [CrossRef] [PubMed] [Green Version]
- Xie, F.; Xiao, D.; Li, X.; Wang, X.; Xia, S.; Zhao, Y. Forest landscape restoration assessment based on NDVI under different burn intensity in the burnedblank of Daxinganling Mountains. Chin. J. Ecol. 2005, 4, 368–372. [Google Scholar]
- Ives, A.R.; Carpenter, S.R. Stability and diversity of ecosystems. Science 2007, 317, 58–62. [Google Scholar] [CrossRef]
- Loreau, M.; Mazancourt, C.; Duffy, E. Biodiversity and ecosystem stability: A synthesis of underlying mechanisms. Ecol. Lett. 2013, 16, 106–115. [Google Scholar] [CrossRef]
- Wonkka, C.L.; Twidwell, D.; Bielski, C.H.; Allen, C.R.; Stambaugh, M.C. Regeneration and invasion of cottonwood riparian forest following wildfire. Restor. Ecol. 2018, 26, 456–465. [Google Scholar] [CrossRef] [Green Version]
- Dolezal, J.; SruKusumek, M. Altitudinal changes in composition and structure of mountain-temperate vegetation: A case study from the Western Carpathians. Plant Ecol. 2002, 158, 201–221. [Google Scholar] [CrossRef]
- Zhao, C.M.; Chen, W.L.; Tian, Z.Q.; Xie, Z.Q. Altitudinal Pattern of Plant Species Diversity in Shennongjia Mountains, Central China. J. Integr. Plant Biol. 2005, 47, 1431–1449. [Google Scholar] [CrossRef]
- Ozkan, K.; Senol, H.; Gulsoy, S.; Mert, A.; Suel, H.; Eser, Y. Vegetation-environment relationships in Mediterranean mountain forests on limeless bedrocks of southern Anatolia, Turkey. J. Environ. Eng. Landsc. Manag. 2009, 17, 154–163. [Google Scholar] [CrossRef] [Green Version]
- Xiao, X.M.; Biradar, C.; Wang, A.; Sheldon, S.; Chen, Y.M. Recovery of Vegetation Canopy After Severe Fire in 2000 at the Black Hills National Forest, South Dakota, USA. J. Resour. Ecol. 2011, 2, 106–116. [Google Scholar]
- Granged, A.J.P.; Zavala, L.M.; Jordan, A.; Moreno, G.B. Post-fire evolution of soil properties and vegetation cover in a Mediterranean heathland after experimental burning: A 3-year study. Geoderma 2011, 164, 85–94. [Google Scholar] [CrossRef]
- Peng, X.H.; Tamura, K.; Asano, M.; Takano, A.; Kawagoe, M.; Kamijo, T. Changes in Soil Physical and Chemical Properties during Vegetation Succession on Miyake-jima Island. Forests 2021, 12, 1435. [Google Scholar] [CrossRef]
- Alejandro, L.; Flavia, A.F.; Andrés, G. Vegetation recovery after fire in mountain grasslands of Argentina. J. Mt. Sci. 2020, 17, 373–383. [Google Scholar]
- Schoennagel, T.; Waller, D.M.; Turner, M.G.; Romme, W.H. The effect of fire interval on post-fire understorey communities in Yellowstone National Park. J. Veg. Sci. 2004, 15, 797–806. [Google Scholar]
- Li, X.Z.; Xie, F.J.; Wang, X.G.; Kong, F.H. Human intervened post-fire forest restoration in the Northern Great Hing’an Mountains: A review. Landsc. Ecol. Eng. 2006, 2, 129–137. [Google Scholar] [CrossRef]
Figure 1.
Study area.

Figure 2.
Importance value of dominant species (the pink arrow refers to the data of June, the blue arrow refers to the data of October, the other colors refer to different vegetation species. Cg: Cymbopogon goeringii (Steud.) A. Camus., Er: Elsholtzia rugulosa Hemsl., Aa: Artemisia argyi H. Lév. and Vaniot; Ra: Rabdosia adenantha (Diels) Hara, Tc: Tripogon chinensis (Franch.) Hack., Pl: Potentilla leuconota D. Don, Pd: Paspalum distichum Linnaeus, Mt: Monogramma trichoidea J. Sm., Lp: Leptodermis potanini Batalin, Mp: Machilus pingii Cheng ex Yang, Vf: Vaccinium fragile Franch., Ll: Leontopodium leontopodioides (Willd.) Beauv., Qg: Quercus guyavaefolia H. Leveille).

Figure 3.
The species diversity indices among different fire severity. L: lightly burned area, M: moderately burned area, S: severely burned area, C: control group. The error bar is the standard deviation. a, b, and c are different and significantly different from each other, but for ab and a or ab and b, there are repeated letters, so there is no significant difference between the two pairs, and there is a significant difference between ab and c.

Figure 4.
The stability of vegetation community with different fire severity.

Figure 5.
Relationship between biodiversity index and elevation.

Figure 6.
TWINSPAN quantitative classification of vegetation samples after fire (D: classification level, N: the total number of quadrats, the numbers in the rectangular boxes are the serial numbers of the samples).
Figure 6.
TWINSPAN quantitative classification of vegetation samples after fire (D: classification level, N: the total number of quadrats, the numbers in the rectangular boxes are the serial numbers of the samples).

Figure 7.
The DCCA analysis of vegetation quadrats and topographic factors (1–45: the serial number of vegetation quadrats; A–E: vegetation community; I–V: ecotope.)
Figure 7.
The DCCA analysis of vegetation quadrats and topographic factors (1–45: the serial number of vegetation quadrats; A–E: vegetation community; I–V: ecotope.)


Table 1.
The classification of fire severity (L: lightly burned areas, M: moderately burned areas, S: severely burned areas, C: control groups).
Table 1.
The classification of fire severity (L: lightly burned areas, M: moderately burned areas, S: severely burned areas, C: control groups).
| Quadrats Serial Number | Burnt Marks/Tree Height (%) | Canopy Damage Rate (%) |
|---|---|---|
| L1, L2, L3, L4, L5, L6, L7, L8, L9, L10, L11, L12, L13, L14, L15 | 29 | 25 |
| M1, M2, M3, M4, M5, M6, M7, M8, M9, M10, M11, M12 | 52 | 52 |
| S1, S2, S3, S4, S5, S6, S7, S8, S9, S10, S11, S12, S13, 14, L15 | 82 | 85 |
| C1, C2, C3 | 0 | 0 |
Table 2.
Different community types and environmental characteristics of burned areas (Aspect: the larger the number, the drier and hotter the conditions; Qg: Quercus guyavaefolia H. Leveille; Lp: Leptodermis potanini Batalin; Ra: Rabdosia adenantha (Diels) Hara; Er: Elsholtzia rugulosa Hemsl.; Mt: Monogramma trichoidea J. Sm.; Aa: Artemisia argyi H. Lév. & Vaniot; Cg: Cymbopogon goeringii (Steud.) A. Camus.; Dc: Duhaldea cappa (Buchanan-Hamilton ex D. Don) Pruski & Anderberg; Ll: Leontopodium leontopodioides (Willd.) Beauv.).
| Community Serial Number | Community Name | Elevation/m | Slope/° | Aspect |
|---|---|---|---|---|
| A | Qg-Ra | 2300~2390 | 10~25 | 4~5 |
| B | Lp-Ra | 2240~2310 | 30~45 | 1~3 |
| C | Qg-Mt | 2100~2150 | 30~35 | 2~3 |
| D | Qg-Cg | 2110~2140 | 25~45 | 1~3 |
| E | Dc-Lp | 2090~2130 | 25~40 | 2~3 |
| F | Qg-Ll | 2120~2380 | 18~33 | 2~3 |
Publisher’s Note: MDPI stays neutral with regard to jurisdictional claims in published maps and institutional affiliations. |
© 2022 by the authors. Licensee MDPI, Basel, Switzerland. This article is an open access article distributed under the terms and conditions of the Creative Commons Attribution (CC BY) license (https://creativecommons.org/licenses/by/4.0/).
Share and Cite
MDPI and ACS Style
He, Z.; Wang, L.; Luo, J.; Zhang, B.; Deng, Q.; Liu, H. Topographic Factors Drive Short-Term Understory Revegetation in Burned Areas. Fire 2022, 5, 171. https://0-doi-org.brum.beds.ac.uk/10.3390/fire5050171
AMA Style
He Z, Wang L, Luo J, Zhang B, Deng Q, Liu H. Topographic Factors Drive Short-Term Understory Revegetation in Burned Areas. Fire. 2022; 5(5):171. https://0-doi-org.brum.beds.ac.uk/10.3390/fire5050171
Chicago/Turabian StyleHe, Zhixue, Lei Wang, Jun Luo, Bin Zhang, Qingchun Deng, and Hui Liu. 2022. "Topographic Factors Drive Short-Term Understory Revegetation in Burned Areas" Fire 5, no. 5: 171. https://0-doi-org.brum.beds.ac.uk/10.3390/fire5050171