


Large-Fire Ignitions Are Higher in Protected Areas than Outside Them in West-Central Spain


Department of Environmental Sciences, University of Castilla-La Mancha, Av. Carlos III, s/n, 45071 Toledo, Spain
*
Authors to whom correspondence should be addressed.
Fire 2023, 6(1), 28; https://0-doi-org.brum.beds.ac.uk/10.3390/fire6010028
Submission received: 17 November 2022
/
Revised: 20 December 2022
/
Accepted: 9 January 2023
/
Published: 11 January 2023
(This article belongs to the Special Issue Effects of Wildfire on Biodiversity)
Abstract
:Managing protected areas requires knowing what factors control fire ignitions and how likely they are compared to non-protected ones. Here, we modelled fire ignition likelihood in west-central Spain as a function of biophysical and anthropogenic variables in 172 protected areas (PA) of the Natura 2000 network, their buffer zones (BZ, 1500 m area surrounding PA), and non-protected areas (NP). Ignition coordinates from fire statistics (2001–2015 period) were overlaid over maps of relevant biophysical and socioeconomic variables. Models were built for four different fire sizes, small (1–5 ha), medium (5–50 ha), large (50–500 ha), and very large (≥500 ha), using Maxent software. Additionally, PA were classified based on their land use and land cover types by cluster analysis. Mean ignition probabilities were compared between PA, BZ and NP, as well as among different types of PA, by generalized linear models. Maxent models’ accuracy increased as fires were of larger size. Ignitions of small fires were associated with anthropogenic variables, while those of larger fires were more associated with biophysical ones. Ignition likelihood for the small and medium fire sizes was highest in BZ, while being the lowest in PA. Conversely, the likelihood of large and, particularly, very large fires was highest in PA. Mean ignition likelihood varied among types of PA, being highest for very large fires in PA, dominated by pine and mixed forests. Our results support the hypothesis that PAs are at the highest risk of large fire ignition, but BZ were also at high risk for the rest of the fire sizes. This largely reflects the more hazardous nature of PA landscapes. This work provides the needed tools to identify critical fire ignition areas within and nearby protected areas, which should be considered in their conservation and management plans.
1. Introduction
A major challenge in conservation is to preserve the integrity of the most representative natural landscapes with their biodiversity and natural disturbance regimes [1]. Fire is a major disturbance of ecosystems across the world [2,3,4]. Fire-driven ecosystems often have species that may have been selected by fire and are resilient to it; their vegetation often requires fire to self-maintain over time [5]. Thus, altering fire regimes (e.g., fire frequency, fire severity, seasonality) can significantly modify the ecosystem and its biodiversity [6,7,8]. While the need to maintain fires to preserve ecosystems has been known for a long time, in human-dominated landscapes, such as in the Mediterranean region, wildfires are mostly seen as a social and economic problem due to the impacts they cause on human assets. In most countries, current policies aim at stopping fires at all costs, without any further consideration for the role of fire. Yet, paleo-historical records indicate that wildfires have been prevalent during the last millennia [9]. Moreover, many plants exhibit regeneration traits that are thought to have evolved under the pressure of fire [10,11]. This means that fire has been a major factor in shaping these ecosystems. Consequently, it has been proposed that a paradigm shift is needed in how fires are managed to allow the ecological role of fire [12]. This affects how wildfires should be considered in the design, conservation and management of protected areas to favor biodiversity preservation [13]. There are many studies that have analyzed fire impacts and vulnerability at particular protected areas (e.g., [14,15,16,17]); however, studies covering wider areas of protected land are still scarce [18,19,20,21], particularly in the Mediterranean region [22,23,24,25].
Extant landscapes in the Mediterranean region are the result of ancestral human pressures, including the use of fire [26,27,28], upon which recent socioeconomic and other global changes, such as climate change, are impacting. Land abandonment in the second half of the last century led to an increase in forest areas, also aided by active efforts to plant tree species, particularly pines [29]. The net result has been an increase in vegetated cover and subsequent landscape hazardousness. This, in the context of abundant human ignitions, resulted in high fire frequencies in many areas, which was followed by an increased capacity to deter them [30]. Yet, wildfires dominate now across the region. Additionally, future climate projections anticipate increased severe fire weather [31,32], which could further increase wildfire frequency and/or severity [33]. Thus, while wildfires might be a necessary component for maintaining ecosystem structure and function in these fire-driven ecosystems, wildfire’s regime now and in the future could be different from what might be required for maintaining protected areas in their desired states. Hence, there is an urgent need to assess how likely wildfires are to occur in these zones and what factors control them [20].
Addressing needed changes in the management of the protected areas affected by wildfires requires assessing fire likelihood and how vegetation or other biophysical and social characteristics affect it [15,24]. Fire occurrence is determined by biophysical factors like climate and weather, topography, and vegetation, among other. Moreover, since wildfires are mostly caused by people, ignitions are highly related to human activities and pressures [34,35]. Indeed, social and economic factors (e.g., population density, distance to towns, distance to roads, land use type, or socioeconomic factors such as unemployment, farm density, etc.) largely determine how likely an area is to ignite [36,37]. Over the years, the tendency of ignitions or burned areas to accumulate near towns and diminish in the more distant hinterland has been documented [38,39]. Therefore, both biophysical and human factors need to be jointly considered to evaluate fire ignition hazards in general and in protected areas.
During the last decades, many of the best-preserved areas in Europe have been declared as protected, forming part of the Natura 2000 network. Most of the damage caused by forest fires in Natura 2000 has occurred in Euro-Mediterranean countries. It has been estimated [40] that approximately 80,000 ha of Natura 2000 sites burned every year between 2000 and 2012, with Portugal and Spain being the most affected countries. Peaks of over 100,000 ha have occurred in some years mainly due to large fires, such as in 2021, in which Italy and Spain accounted for 45% of the total burnt area in protected areas [41]. In Spain, the Natura 2000 network protects a variety of areas, such as forests, other woody vegetation with various values, riparian areas, and wetlands. This study aims at assessing wildfire ignition likelihood in protected areas of the Natura 2000 network, in buffer areas surrounding them, and in non-protected areas in a large area of west-central Spain. We asked whether areas that vary in their protection status also differ in their ignition likelihood in general or for fires of different sizes. We hypothesized that ignitions, in general, would more likely occur in areas where ignition sources would be more abundant (e.g., closer to roads and towns). Furthermore, because ignitions are mostly caused by people, and protected areas are usually at distant locations, away from towns, we expected that ignitions of the smallest fire size would be higher in non-protected areas than in protected ones. However, vegetation would be anticipated to be more abundant and continuous in protected areas, resulting in a higher probability of spreading a fire once it ignites. Consequently, we envisaged that as fire size increased, the probability of ignition would be highest in protected areas. Buffer areas were anticipated to be in the middle due to not having as extensive and hazardous vegetation and fewer human pressures than non-protected ones, where ignitions might be at their highest.
2. Materials and Methods
2.1. Study Area
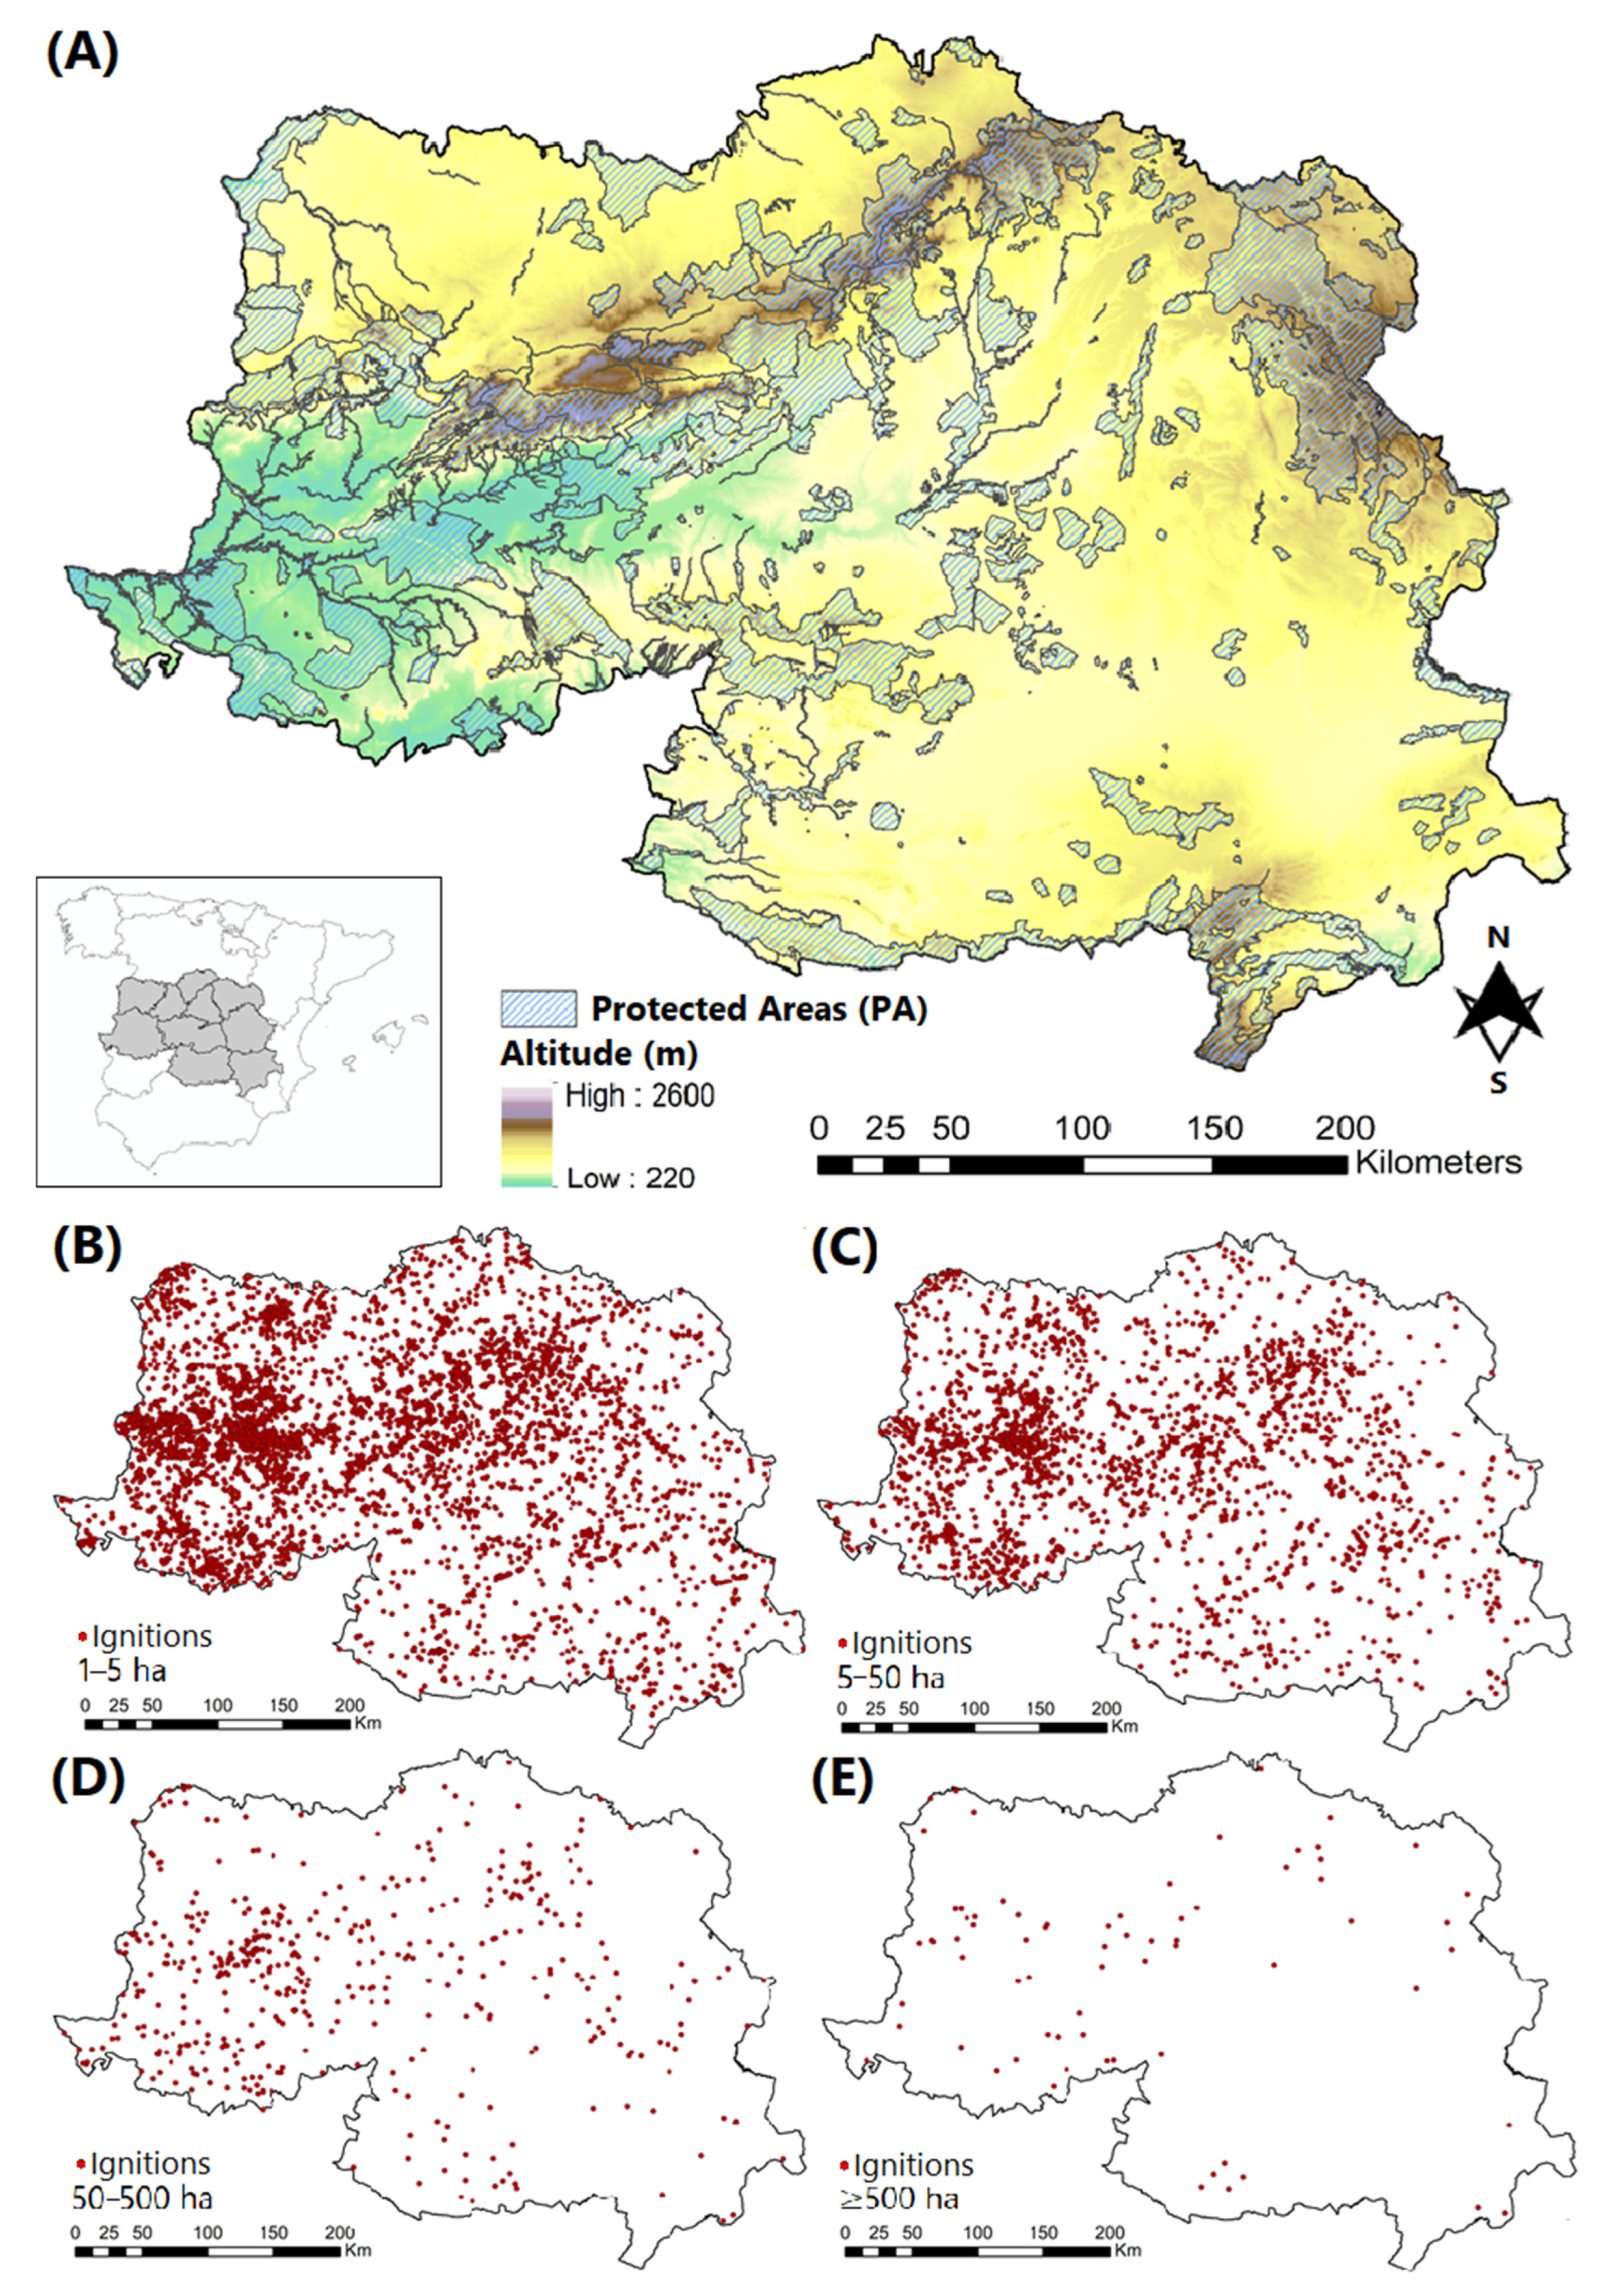
The study area covers west-central Spain (136,629 km2; 27% of peninsular Spain) (Figure 1A). It includes parts of five mountain chains: the Central System (from west to east), the Iberian System (north to east), the Toledo Mountains, Sierra Morena (west to east) and part of the Betic Mountains (southwest to northeast), with elevations as high as 2591 m.a.s.l. Administratively, it covers the five provinces of the Castilla—La Mancha Autonomous region, Madrid, Cáceres, and the three southern provinces of the Castilla y León Autonomous region (Salamanca, Segovia, and Ávila). The climate is Mediterranean, with cool winters and hot summers. Temperature and precipitation present a strong gradient from the lowest to the highest parts. Observed mean annual temperatures vary from about 16.3 °C (Cáceres observatory, 394 m a.s.l) to 6.9 °C (Navacerrada observatory, 1894 a.s.l), and mean annual rainfall varies between 342 mm (Toledo observatory, 515 m a.s.l) and 1223 mm (Navacerrada observatory) [42]. The study area has a long history of fires, including from before human occupation (e.g., [43,44]).
2.2. Fire Data
We used the wildfires that occurred in the study area between 2001 and 2015 based on the fire reports available at the Spanish fire statistics database (EGIF, Spanish General Statistic of Forest Fires, https://www.miteco.gob.es/es/biodiversidad/temas/incendios-forestales/estadisticas-datos.aspx, accessed on 3 October 2022). The fire reports proide, for most fires, the coordinate of the ignition, as determined by the fire services, the area burned, and other ancillary information. Due to inconsistencies in reporting for smaller fires, we selected wildfires ≥1 ha, which resulted in a total of 9089 wildfires, of which geographical coordinates were available for 70% of them (Figure 1B–E). These fires represented 73% of the total area burned during the study period. Based on the area they burned, we divided wildfires into four fire size classes: ≥ 1–5 ha (n = 5895), ≥5–50 ha (n = 2658), ≥50–500 ha (n = 462) and ≥ 500 ha (n = 74).
2.3. Protected Areas
The study area includes 244 protected areas (PA) that are part of the European Union’s (EU) Natura 2000 network, which constitutes the basis of the EU nature protection policy [45]. Some of the PA include within their boundaries national or regional conservation entities (e.g., 4 national parks, 12 natural parks, and other conservation figures, Table S1). Most management plans of Natura 2000 sites were recently approved (c.a. 2015). Other protected areas, particularly national parks, have been managed since their declaration. We excluded 34 PAs from the analysis due to their non-combustible nature (i.e., reservoirs, tunnels, caves, mines, etc.). From the remaining 210 PA, 38 had more than one protection category and overlapped their boundaries with another PA; after filtering for this, we retained a total of 172 PA (Figure 1A, Table S1). In total, PA covered 36,657 km2 (27% of the whole study area). Cartographic limits of PA were obtained from the Spanish Ministry for Ecological Transition and Demographic Challenge (https://www.miteco.gob.es/es/biodiversidad/servicios/banco-datos-naturaleza/informacion-disponible/red_natura_2000_inf_disp.aspx, accessed on 7 October 2022).
Fires can ignite within or outside PA; however, fires ignited outside a PA could later spread into them. To account for this, we further divided the territory by defining a buffer zone (BZ) around each PA. We calculated the distance of fires igniting outside PA that eventually burned into them using fire scar polygons (when available) or the information provided by the fire reports since some indicated if the fire had affected a PA. We established the 95th percentile of such distances as BZ, which resulted in a 1500 m area surrounding PA (27,814 km2; 20.4% of the area). The rest of the territory was classified as non-protected (NP) (72,159 km2; 52.8% of the area).
2.4. Variables Controlling Ignitions
We used several types of variables tested in previous studies as explanatory of fire occurrence in Spain (e.g., [30,38]). They were grouped into seven categories: climate, topography, land use/land cover (LULC), interfaces, remoteness, linear infrastructures, and socioeconomy (Table 1).
Climate. Maps of 200 m resolution of mean annual temperature (°C), mean maximum annual temperature (°C), and mean annual precipitation (mm) were derived for the 2001–2015 period from the Digital Climatic Atlas of Spain [46]. In addition, we used the mean of the Standardized Precipitation-Evapotranspiration Index (SPEI), accumulated over 12 months (SPEI12) for the 2001–2015 period at 1.1 km resolution [47].
Topography. The topographic variables were derived from the National Digital Elevation Model of Spain at 25 m resolution (https://centrodedescargas.cnig.es/CentroDescargas/index.jsp, accessed on 15 October 2022) and included elevation (m), slope (°), aspect (vectors for northness and eastness), summer radiation (kW/m2·h), and summer sunlight (h). Summer radiation and sunlight were calculated as the accumulated values for the summer days (June to September) using r.sun in QGIS 3.0.0. with GRASS 7.4.0. [48].
Land Use Land Cover (LULC). We used the Spanish National Forest Map (SFM) at a 1:50,000 scale to derive 14 LULC types based on a reclassification of the SFM original legend considering forest structure and the dominant species (https://www.miteco.gob.es/es/biodiversidad/servicios/banco-datos-naturaleza/informacion-disponible/mfe50.aspx, accessed on 15 October 2022). SFM included tree-dominated stands wooded forests (>20% tree cover) and some stands with sparse tree cover (10–20% tree cover). Tree-dominated stands were further divided into several groups, depending on the dominant tree species (e.g., pines, oaks, junipers, etc.) (Table 1). Transitional woodlands and shrublands included areas with shrubs/herbs and sparse tree cover (5–10% tree cover). Shrublands included areas with shrubs/herbs with no tree cover. Additionally, SFM included dehesas (savanna-type oak woodlands), grasslands, agricultural lands (crops and pastures), artificial surfaces, water bodies and wetlands.
Interfaces. Interfaces between various LULC types were derived: wildland–agrarian (WAI), wildland–grassland (WGI), and wildland–urban (WUI) [49]. WAI was based on the intersection between a buffer area (400 m) around wooded vegetation (tree-covered and/or shrublands) and agricultural lands defined by the SFM. WGI was based on a 400 m buffer of all wooded vegetation and its intersection with grasslands. For WUI, the 400 m buffer of all wooded vegetation was intersected with a layer of built-up areas (i.e., towns, settlements) of the Spanish National Geographic Institute (IGN) (https://centrodedescargas.cnig.es/CentroDescargas/index.jsp, accessed on 15 October 2022).
Remoteness. Variables of distance (m) to protected areas (PA) and distance to built-up areas were derived.
Linear infrastructures. Based on the Spanish National Geographic Institute, maps of roads (including highways and national and secondary roads), dirt roads, railways, and power lines (https://centrodedescargas.cnig.es/CentroDescargas/index.jsp, accessed on 15 October 2022), we derived layers of the densities (km/km2) of each linear infrastructure. In the case of railways, the density was so low that they were discarded from the analysis.
Socioeconomy. We derived socioeconomic variables at the municipality level from the Spanish Statistics Institute (https://www.ine.es, accessed on 20 Octoberr 2022), including the population density (No./km2) in 2001 and the population change (%) experienced from 2001 to 2015. From the agrarian censuses, we derived the initial (1999 census) and percentual change (for the 1999–2009 period) of agricultural machine density (No./km2), farm density (No./km2), cattle density (No./km2), and agrarian surface (expressed in % of total municipality surface).
2.5. Statistics and Modelling
The aim was to model fire ignition as a function of the 41 original explanatory variables chosen, for which we used Maxent 3.4.0. (https://biodiversityinformatics.amnh.org/open_source/maxent/, accessed on 15 November 2022). Maxent was originally developed for species distribution modeling [50,51] but has recently been used for a range of other ecological processes, including mapping ignition or burn probability (e.g., [20,52,53]). Maxent is a presence-only machine-learning algorithm that iteratively compares the differences in explanatory variables between the locations of the response variable and the locations of a randomly generated sample. The model estimates the best approximation of the response variable distribution as the one with maximum entropy. Models were built for each of the four fire-size categories (≥1–5 ha, ≥5–50 ha, ≥50–500 ha, ≥500 ha). All variables were referred to on a 500 × 500 m scale. To avoid redundancies, highly correlated variables (r > 0.7, p < 0.05) were discarded, whereby the variable within a pair with the lower relevance in the initial exploratory models was excluded. Maximum and mean temperatures were highly correlated among them (r = 0.99) and with elevation (r = −0.92). Slope and summer sunlight hours also showed a significant correlation (r = −0.75).
We proceeded as follows for each fire size: first, a full model was constructed with all the variables (excluding those highly correlated); next, models were built stepwise, starting with the two variables that most contributed to the full model, and then fitting models, adding one by one the rest of variables that showed some contribution to the full model. We used Maxent default settings following [54]: (1) we selected a random seed; (2) we set a random test percentage at 10% to evaluate the model and used 90% of the data for training it; (3) we set replicates to 100 with subsampling; (4) we set the maximum iterations to 5000; (5) individual variables were evaluated using response curves; (6) variable importance was determined using the jackknife method.
The criteria for model selection were based on the most parsimonious model, i.e., the model with the minimum Akaike’s information criterion (AIC) [55]. Maxent outputs of each model were evaluated in ENMTools v.1.3 [56] to calculate sample size-corrected AIC (AICc), since the ratio between observations and model parameters was low (<40) [57,58]. When models had similar AICc (i.e., delta AICc lower than 8), we selected the model with the best area under the curve (AUC) for test data. The AUC is commonly used as an indicator of model performance. An AUC value of 0.5 shows that model predictions are not better than random; <0.5 are worse than random; 0.5–0.7 indicates poor performance; 0.7–0.9 indicates reasonable/moderate performance; and >0.9 indicates high performance [59].
Maps of fire ignition probability for each fire size were calculated with Maxent for the best model for each fire size. Each map was overlayed with PA, BZ and NP areas. In each category, we randomly sampled 30,000 pixels and compared the distributions of ignition probabilities using histograms and box and whisker plots. We tested for differences in ignition probabilities between PA, BZ and NP using generalized linear models with maximum likelihood in SPSS v.21, assuming a gamma distribution and using an identity link function based on AIC. Post hoc pairwise comparisons were made with Bonferroni correction for multiple comparisons. Additionally, we explored ignition probability within the different types of protected areas (PA). We first classified all PA in groups according to their similarity based on LULC types (percentage cover), altitude, and slope. We applied a principal component analysis (PCA) and a cluster analysis. Hierarchical clustering was chosen because of its “bottom-up” approach, where each observation (i.e., each PA) is initially considered as a cluster of its own (leaf), and then the most similar clusters are successively merged until there is just one single big cluster (root). Moreover, unlike partitioning clustering, hierarchical clustering does not require to pre-specify the number of clusters to be produced. Hierarchical clustering was run under Ward’s minimum variance method (Ward.D2) [60,61]. At each step, the pair of clusters with minimum between-cluster distance are merged [62]. Based on the gap statistics (k) method [63], the optimal set of PA clusters was set to six and was represented over the PCA space. We used the “FactoMineR”, “factoextra”, “dplyr”, “cluster”, and “ggplot2” packages implemented in R 4.0.5 [64]. Finally, we explored differences in ignition likelihood distribution (for each fire size) in PA clusters by applying generalized linear models, assuming a gamma distribution and using an identity link function, and post hoc pairwise comparisons with Bonferroni correction.
3. Results
There were 9089 wildfires, most of which were of small size, with larger fires being less frequent; very large fires (≥500 ha) were only 1% of the total yet were sufficient to run the modelling. Wildfires igniting at PA were 27% of all fires (with an average of 161 fires per year), there were 12% at BZ (with 75 fires/year) and 61% (with 370 fires/year) at NP. The percentage of wildfires igniting at PA increased with fire size, and nearly half of the very large fires occurred in them (46%) or in their surrounding BZ (16%) (Table 2).
The spatial distribution of ignitions was unequal. A large portion of them occurred towards the center-west, in the Central System and adjacent uplands, with fewer fires igniting at the lower and flat areas (i.e., at the La Mancha plateau) on the southeast, where agriculture prevails. The spatial distribution of ignitions changed with size; while small fires were distributed nearly throughout the whole territory, as fires increased in size, their distribution became more restricted to the mountains, particularly towards the Central System, with very large fires being practically restricted to such areas (Figure 1B–E).
The best models (i.e., minimum AICc) were less complex (i.e., with fewer explanatory variables) for larger fire sizes than for smaller ones. The accuracy of Maxent models to explain wildfire ignitions increased with fire size (AUC = 0.69, 0.70, 0.73, 0.74, for small, medium, large, and very large fires, respectively). Models for small fires (1–5 ha) used up to 23 variables to minimize AICc, but the contribution of the last variables was very low (<1%). Small fires (1–5 ha) were more likely to be near settlements (40% contribution to the best model), in areas with high annual mean precipitation (19%), high population (9.7%) and road density (7.3%), and in lower elevation areas (6.4%) (Figure 2A). The best medium-size (5–50 ha) fire model included 16 variables, but only some variables showed important contributions (>10%) to the model, including biophysical variables, such as annual mean precipitation (23.7%, positive relationship), altitude (11.3%, negative), and socioeconomic variables, such as distance to built-up areas (19.3%, negative relationship), and road density (18.7%, positive) (Figure 2B). The best large fire (50–500 ha) model included 9 variables; ignition probability increased with annual mean precipitation (34.6% contribution) but decreased with altitude (26%); the rest of the variables in the model contributed less than 10% and were related to the type of fuel (shrublands, grasslands, and deciduous oak forests), and socioeconomic variables (farm density, power line and road density), with all of them showing a positive relationship with ignition probability (Figure 2C). The best model for very large fires (≥500 ha) included only four variables; ignition probability increased with mean annual precipitation (36.6% contribution to the model) and summer sunlight (32.8%); conversely, ignition probability decreased with distance to protected areas (15.8%) and agrarian surfaces (14.9%) (Figure 2D).
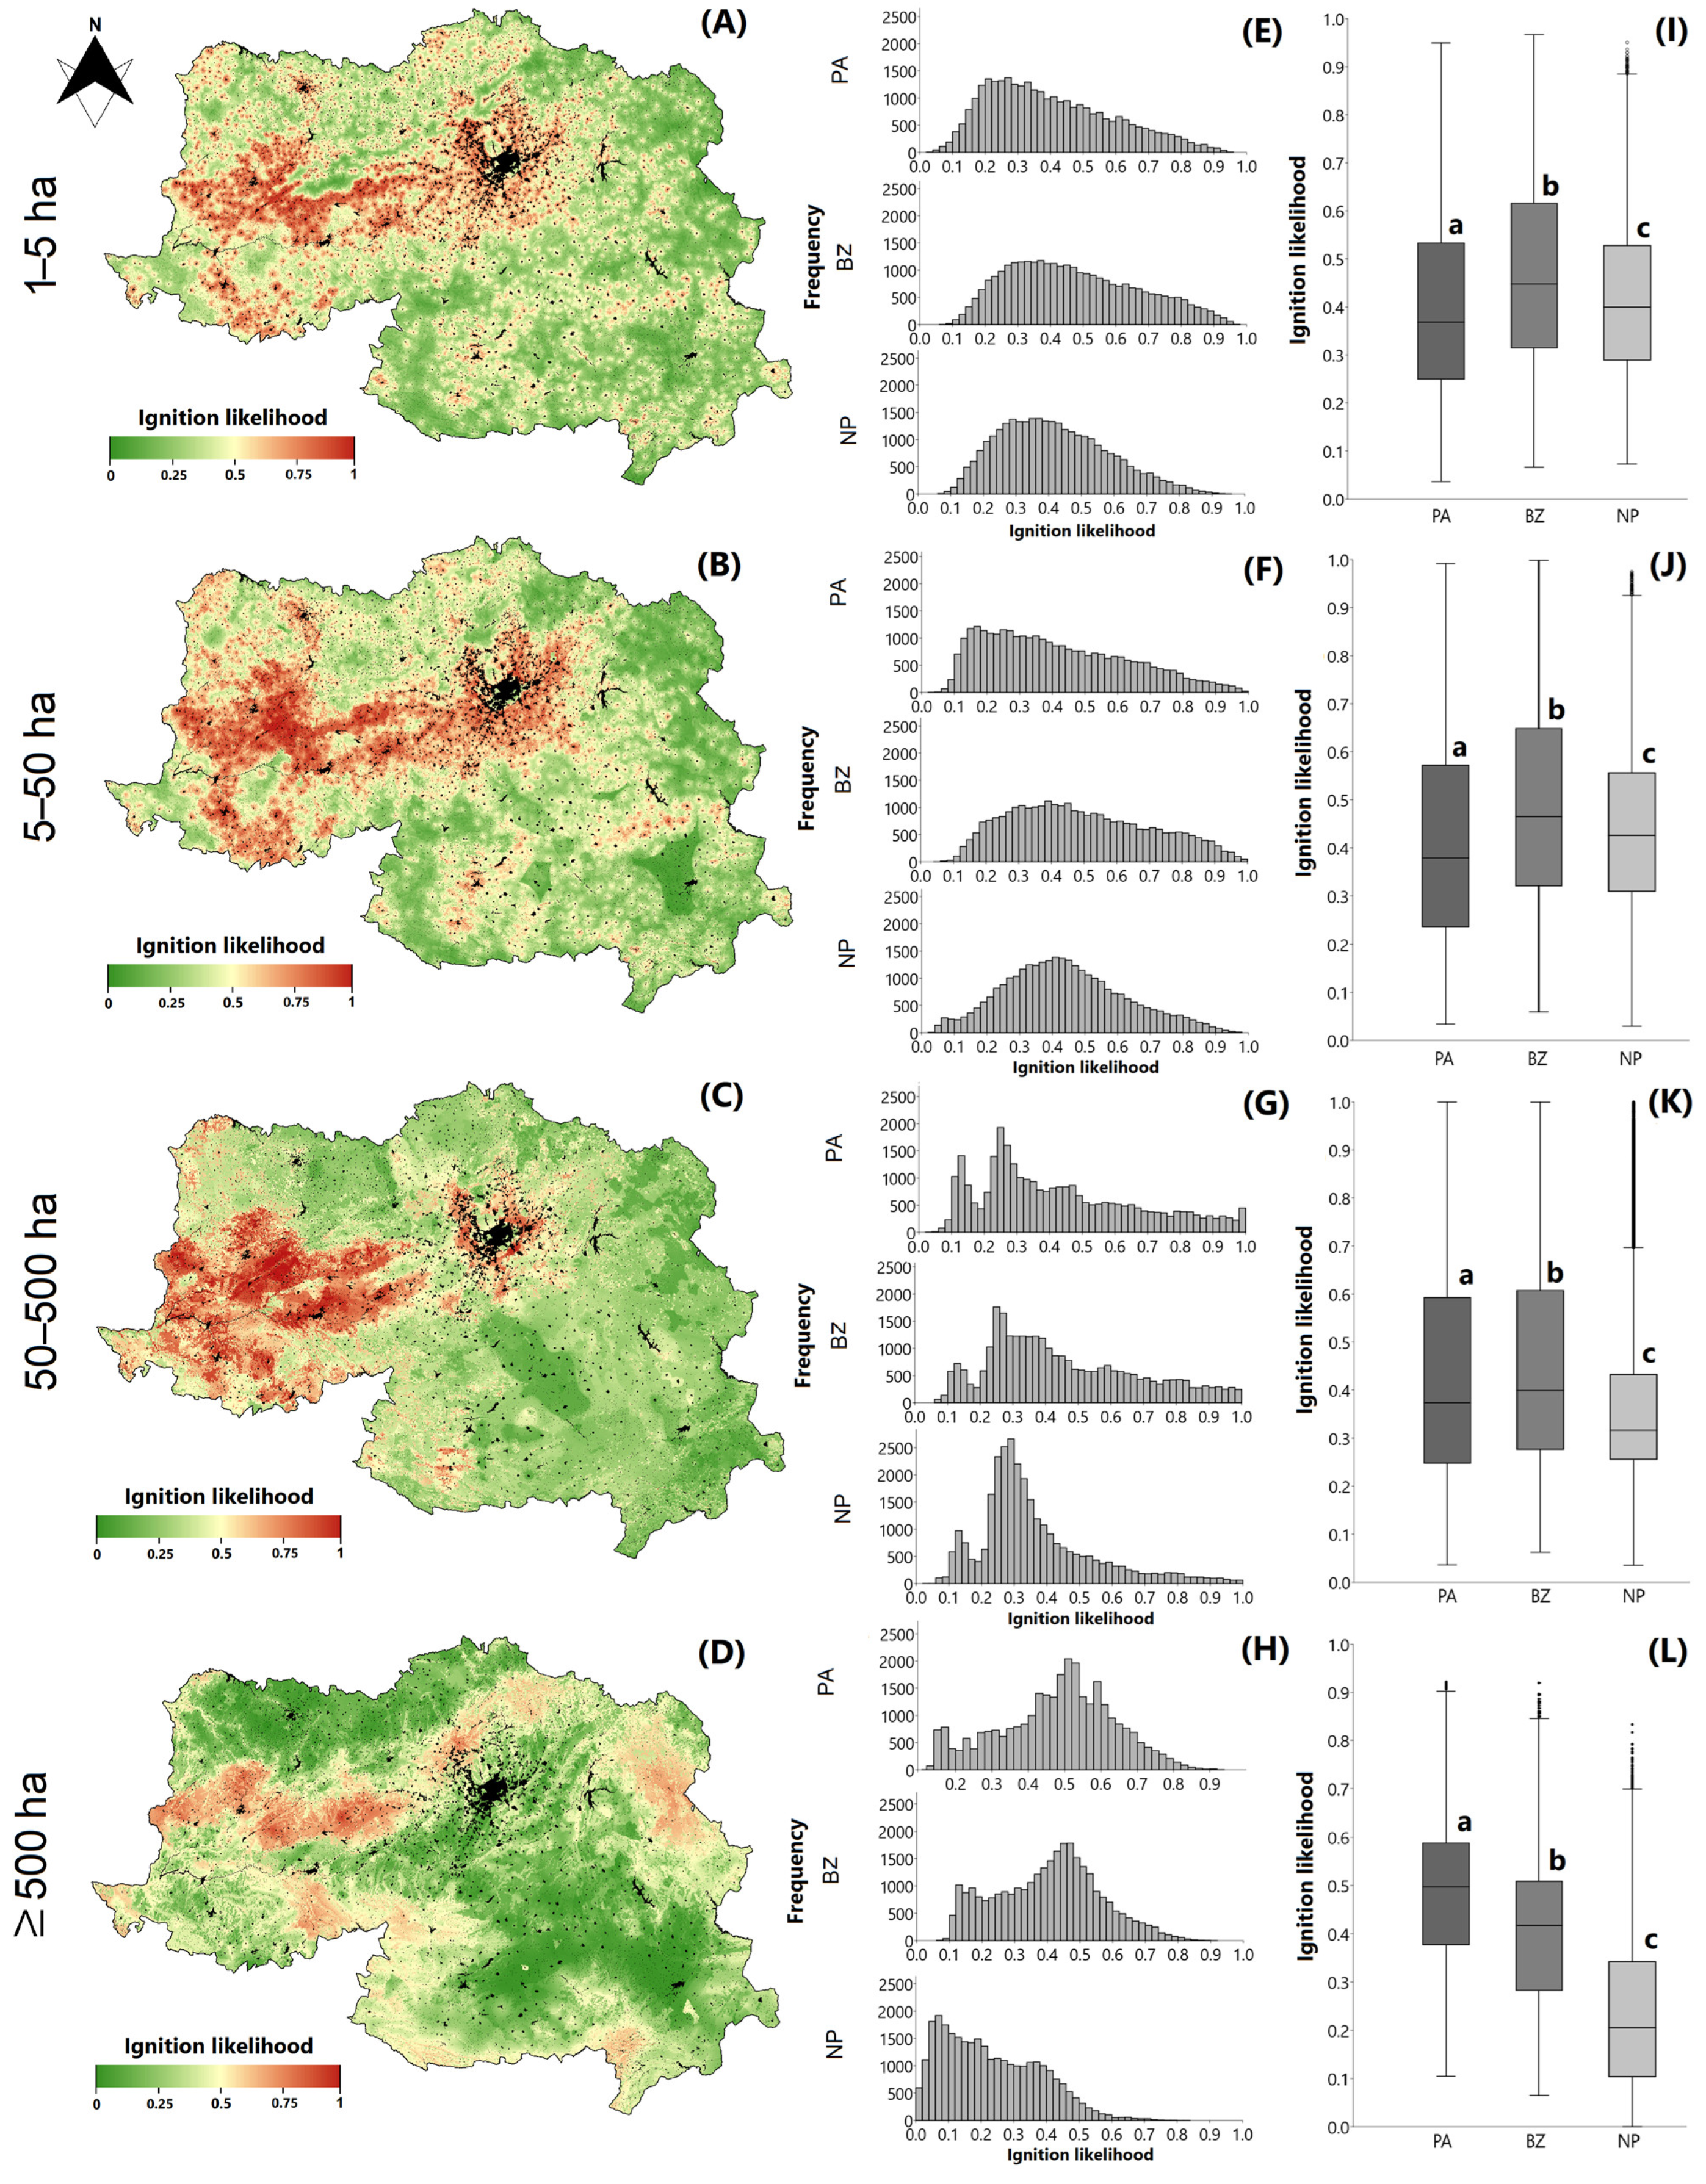
The resulting probability of ignition maps in the study area (Figure 3A–D) reflected well the earlier description of ignitions. The probability of small and medium fire sizes was more widespread over the study area. These ignitions showed higher probability around villages and settlement areas (particularly Madrid) and in lowlands and valleys. Large-size fires were not associated with settlements; instead, they were more likely in areas with high mean precipitation, particularly in the center and west, including Cáceres province, west of Toledo, the medium-altitude areas of the Central System, and to a lesser extent around Madrid. Finally, very large fire ignition likelihood was associated with mountain areas, including the Central System, Iberian System, Toledo Mountains, Sierra Morena, and part of the Baetic System.
The distribution of ignition probabilities in protected areas (PA), buffer areas (BZ), and non-protected areas (NP) varied with fire size (Figure 3E–H). Ignitions for the small and medium fire sizes were highest in BZ, followed by NP, and were lowest in PA. Conversely, ignition probabilities for large fires and, particularly, very large fires were highest in PA, followed by BZ, and lowest in NP (Figure 3I–L).
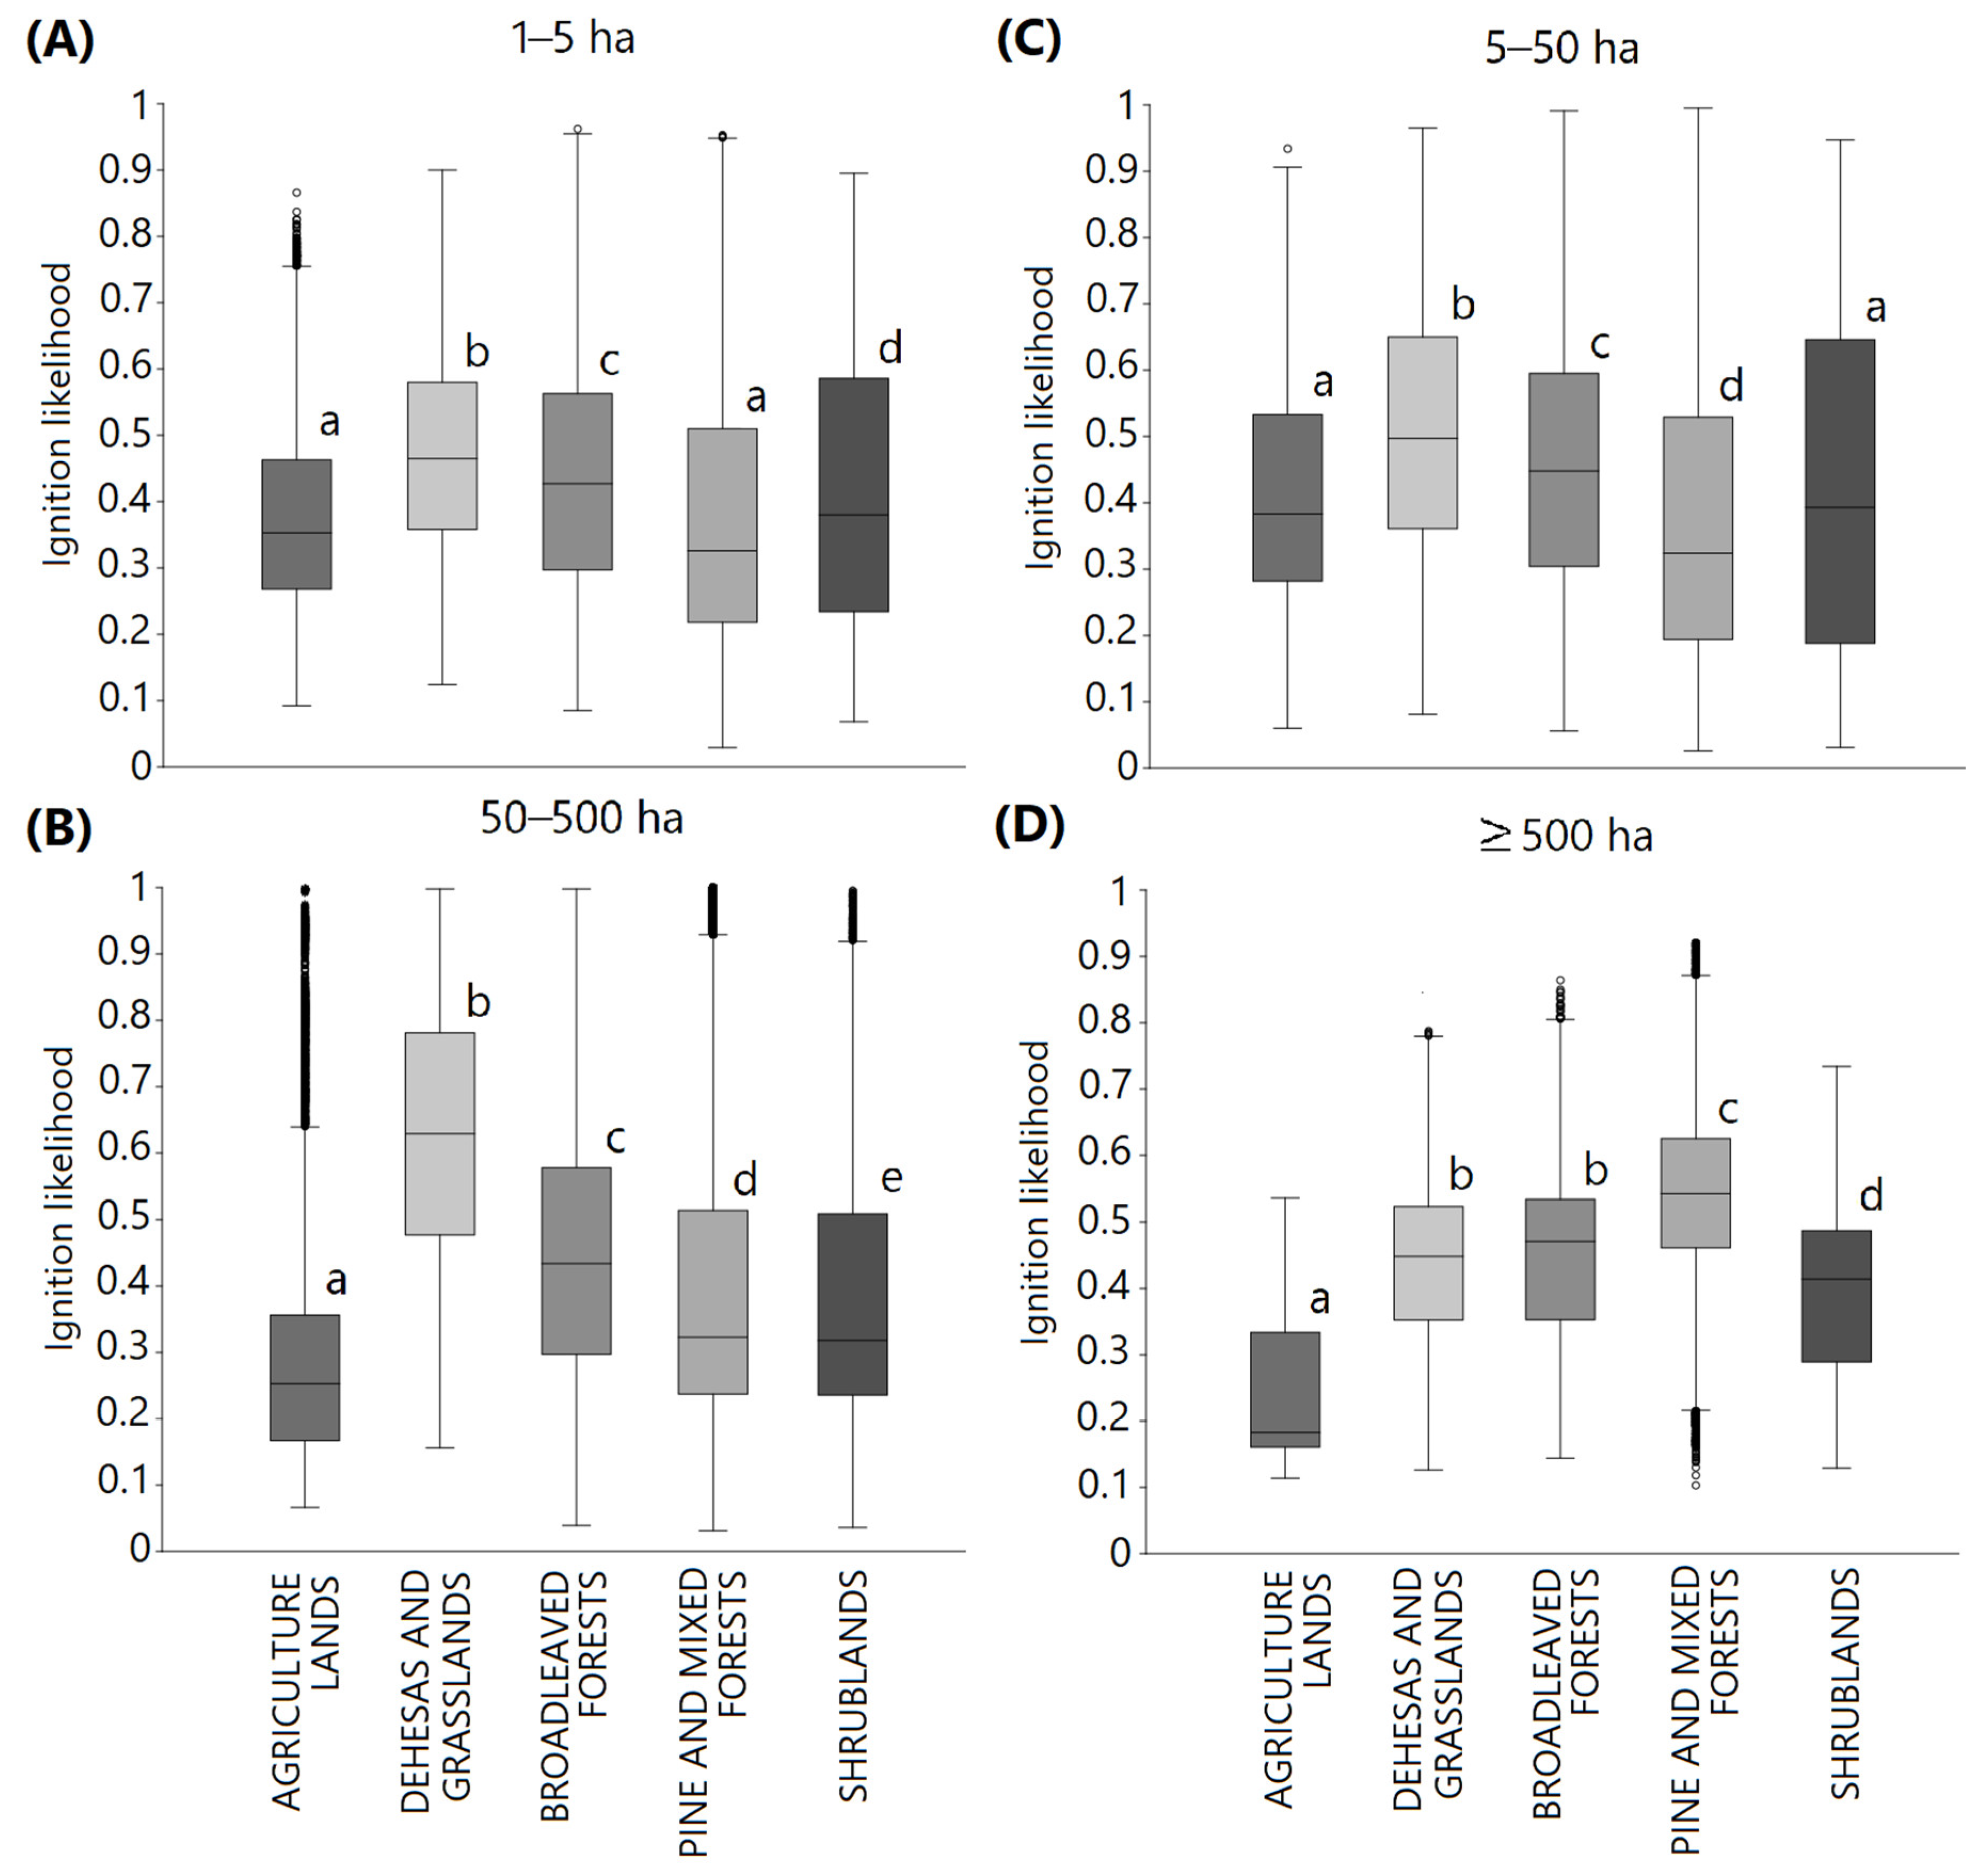
The 172 PA were ordered as a function of their LULC classes, altitude, and slope, with the first two dimensions of the PCA analysis explaining 45% of the variance (Figure 4). The first component was negatively correlated with wetlands and positively correlated with high altitude and slope, areas covered by pine forests, mixed forests, and shrublands; the second component was negatively associated with agricultural lands and positively associated with hardwoods, dehesas (savanna-type oak woodlands), and grasslands. Over the multidimensional space, we obtained 6 clusters of PA grouped and named according to their dominant LULC classes (Figure 4): wetlands (cluster 1), agriculture lands (2), dehesas and grasslands (3), broadleaved forests (4), pine and mixed forests (5), and shrublands (6). These PA clusters significantly differed in their fire ignition likelihood (Figure 5). Fire ignition probability for small, medium, and large fire sizes was highest for dehesas, followed by broadleaved forests. However, ignition probability for the largest fires was associated with PA dominated by pine and mixed forests.
4. Discussion
Our results confirm the hypothesis that the highest likelihood of ignitions of very large fires (≥500 ha) occurred in protected areas rather than in non-protected ones, including buffer areas. This suggests that ignitions for very large fires are controlled by the landscape since protected areas or even buffer areas tend to be more densely covered by vegetation (e.g., [65]). On the other hand, PA tend to have a lower density of linear structures, particularly roads, and are more distant from urban settlements, thus causing them to have an overall smaller risk of ignitions, as shown here and in other studies [66]. Therefore, the limited capacity of the landscape to sustain fire propagation over long distances supports arguing that landscape structure, that is, fuel, is the controlling factor of the ultimate fire size [67], as fires tend to stop at breaks and fuel discontinuities [68]. While ignitions are fewer in PA, once they occur, fires can propagate more readily to reach dimensions that exceed those of the other areas (e.g., [22]). This conclusion is also supported by the fact that the very large fires were more likely in protected areas dominated by pine and mixed forest, that is, the most hazardous ones.
Contrary to expectations, the highest overall ignition probability, which is given by that of the smallest fires, was not obtained in non-protected areas but in the buffer zones. We found that for all fire sizes except for the very large fires, buffer zones always had a higher mean probability of ignitions than within or outside protected areas, as found in other studies [19]. It must be noted that buffer areas were selected considering that most fires that occurred in them would end up spreading into a protected area. Indeed, according to Spanish national statistics in the period 2006–2015, 14.24% of fires affected a protected area, either because they originated within it or because, even though they originated outside, they affected its surface [69]. Therefore, our findings support arguing that in Mediterranean ecosystems, pressure over protected areas from their surroundings is higher than had been anticipated. This result is important for managing protected areas since the fire pressure from their surrounding areas might increase due to human activities that are tolerated in the buffer areas but not within protected areas [66]. Furthermore, with time, human pressures may further increase in them, compared to what might be expected in protected areas, thus providing additional ignitions [39,65]. Moreover, given the need to extend protected areas to allow species migration due to the combined effect of global change drivers, particularly climate change [70], the first choice might include expanding protected areas into their buffer zones and beyond. Our study indicates that the analysis of options to mitigate global change impacts on species conservation by expanding protected areas needs to be done with care, weighing in the risk of fires of such options.
Protected areas are at the highest risk of very large fires as well as large fires. Thus, overall fire probability in protected areas is very high in the study area. Since very large fires are more devastating, and the tendency is to increase fire weather danger with climate change and with it, the probability of very large fires [32,71], wildfires need to be fully considered in the management plans of protected areas to reach their conservation goals [72,73]. This is particularly important since many of these areas are rather heterogeneous due to having originated from a variety of previous land use histories. Very large fires might, however, tune up the burned areas and set the clock of secondary succession once they burn, thus producing notable and long-lasting homogenizing changes in the landscape and vegetation [74,75]. Currently, the management plans in these areas are mostly concentrated on preventing fires but not on managing the ecosystem with fire [12,24]. Our results indicate that given the propensity of these areas to harbor fires of the largest sizes, the focus for management needs to change from halting fires only to managing them, including the need to anticipate how the ecosystem will respond once burned and being prepared to manage the ecosystem and the landscape with a focus on previously set targets [76,77]. If not, very large fires, including those that burn thousands of hectares, will occur without a specified plan for action, which could compromise conservation goals.
We found that explaining wildfire ignitions was possible by using Maxent and a limited number of ancillary variables. This is an addition to the many statistical and modelling tools used until now to model ignitions [78], including resource selection functions (e.g., [79]), negative binomial models (e.g., [37]), logistic and Poisson regression (e.g., [80,81,82]), or machine learning algorithms (e.g., [83]), including Maxent (e.g., [84,85]). The accuracy with which ignitions can be modelled can vary as a function of seasonality [85] or fire size (this study), among other factors. We found that the smallest fires were very difficult to model, and model accuracy was low. Including more variables, even tens of them, did not change the result. Ignitions were better predicted with a small number of variables and adding more variables did not change the outcome. It appears that small fires can occur virtually everywhere and that there is no specific variable that controls them other than just having some vegetation/fuel to burn. In many cases, this only amounts to abandoned areas covered by herbs and other sparse vegetation. Modelling accuracy increased as fire size increased, as found previously (e.g., [86]), which indicates that other factors than ignitions entered into play. Mean annual precipitation was a variable included with a high score in all models, which reflects that primary productivity, hence, fuels, may be a major controlling factor, an issue that is common in many of these types of studies (e.g., [84,87]). Moreover, with very few additional variables, this was sufficient to explain the overall pattern of ignitions for larger-size fires, including the very large ones. Other variables contributing to explaining ignitions were related to human pressure (i.e., distances to towns or roads), particularly for small and medium fires, as has been commonly found in this type of analysis (e.g., [37,80,88,89]).
Results document that the nature of the vegetation dominating in protected areas is important for determining fire ignition probability and fire size. The finding that protected areas were dominated by the most hazardous vegetation (pine and mixed forests) was expected. More surprising is the result that dehesas, grasslands, broadleaved forests, and shrublands, in this order, were the protected area types with the highest ignition probability in all but the very large fires. We thus document that the fire pressure in areas dominated by less hazardous fuels is larger than might have been anticipated and coincides with results that showed that some of these land use/land cover types are on the rise of burning in some areas of Spain [30]. The results for broadleaved forests were unexpected; this LULC type is commonly less selected by fires, including in the area for deciduous species [67]. This also applies to shrublands, which were found to be the second most selected vegetation type in the area [67], as also shown in other studies where shrublands were the most likely land cover selected for by fire [87,90], although strictly speaking, this goes beyond ignitions. Given the different approaches that have been used in studies addressing burning likelihood vs. ignition likelihood makes comparison difficult. Similarly, what might be true at a larger scale might be different at lower ones. Further studies are needed to go beyond ignition and consider burning rates to further characterize how protected areas are subjected to the risks of wildfires.
5. Conclusions
Our results confirm that protected areas in west-central Spain are at the highest risk of very large fires, particularly those dominated by the more flammable fuels of pine and mixed forests. Moreover, the likelihood of fires of large, medium, or small sizes was highest in the buffer zones, warning about the pressure from the surroundings of the protected areas. Ignitions of small fires can occur almost anywhere in the territory, and their modelling was difficult even using a large set of variables. Modelling accuracy increased with fire size, up to the largest fire size used that could be modeled with just a few variables.
Because large fires can be most devastating, our results argue that the focus for management needs to change from only halting fires to managing them. This includes the need to anticipate how the ecosystem will respond once burned and being prepared to manage the ecosystem and the landscape with a focus on previously set conservation targets. Protected areas that are undergoing rapid shifts in their ecological state due to the cessation of traditional practices, more so when they are declared protected, may be becoming more hazardous. Such areas need special attention, particularly where the maintenance of biodiversity values is incompatible with fire occurrence (e.g., due to the presence of fire-sensitive species), in particular, large fires.
Supplementary Materials
The following supporting information can be downloaded at: https://0-www-mdpi-com.brum.beds.ac.uk/article/10.3390/fire6010028/s1, Table S1: Protected Areas.
Author Contributions
Conceptualization, J.M.M. and I.R.U.; Methodology, J.M.M., I.R.U. and G.A.-d.-V.; Software, G.A.-d.-V.; Validation, G.A.-d.-V. and I.R.U.; Formal analysis, G.A.-d.-V.; investigation, G.A.-d.-V. and I.R.U.; Resources, J.M.M.; Data curation, G.A.-d.-V.; Writing—original draft preparation, J.M.M. and I.R.U.; Writing—review and editing, J.M.M., I.R.U. and G.A.-d.-V.; Visualization, G.A.-d.-V. and I.R.U.; Supervision, J.M.M. and I.R.U.; Project administration, J.M.M.; Funding acquisition, J.M.M. All authors have read and agreed to the published version of the manuscript.
Funding
This research is part of the project INFORICAM (PID2020-119402RB-I00) funded by the Spanish MCIN/AEI/10.13039/501100011033 and by the European Union NextGenerationEU/PRTR. G.A.-d.-V. was financed by UCLM contract 2018/12504 cofounded by the European Social Fund.
Institutional Review Board Statement
Not applicable.
Informed Consent Statement
No applicable.
Data Availability Statement
Data are available upon written request.
Conflicts of Interest
The authors declare no conflict of interest.
References
- Margules, C.R.; Pressey, R.L. Systematic conservation planning. Nature 2000, 405, 243–253. [Google Scholar] [CrossRef] [PubMed]
- Bowman, D.M.; Balch, J.K.; Artaxo, P.; Bond, W.J.; Carlson, J.M.; Cochrane, M.A.; D’Antonio, C.M.; DeFries, R.S.; Doyle, J.C.; Harrison, S.P. Fire in the Earth system. Science 2009, 324, 481–484. [Google Scholar] [CrossRef] [PubMed]
- Harrison, S.P.; Marlon, J.R.; Bartlein, P.J. Fire in the Earth System. In Changing Climates, Earth Systems and Society; Dodson, J., Ed.; Springer: Dordrecht, The Netherlands, 2010; pp. 21–48. [Google Scholar] [CrossRef]
- Resco de Dios, V. Fire as an Earth System Process. In Plant-Fire Interactions: Applying Ecophysiology to Wildfire Management; Resco de Dios, V., Ed.; Springer International Publishing: Cham, Switzerland, 2020; pp. 31–51. [Google Scholar] [CrossRef]
- Keeley, J.E.; Pausas, J.G.; Rundel, P.W.; Bond, W.J.; Bradstock, R.A. Fire as an evolutionary pressure shaping plant traits. Trends Plant Sci. 2011, 16, 406–411. [Google Scholar] [CrossRef] [Green Version]
- Leach, M.K.; Givnish, T.J. Ecological determinants of species loss in remnant prairies. Science 1996, 273, 1555–1558. [Google Scholar] [CrossRef]
- Peterson, D.W.; Reich, P.B. Fire frequency and tree canopy structure influence plant species diversity in a forest-grassland ecotone. Plant Ecol. 2008, 194, 5–16. [Google Scholar] [CrossRef]
- Kelly, L.T.; Giljohann, K.M.; Duane, A.; Aquilué, N.; Archibald, S.; Batllori, E.; Bennett, A.F.; Buckland, S.T.; Canelles, Q.; Clarke, M.F.; et al. Fire and biodiversity in the Anthropocene. Science 2020, 370, eabb0355. [Google Scholar] [CrossRef] [PubMed]
- Marlon, J.R.; Bartlein, P.J.; Daniau, A.-L.; Harrison, S.P.; Maezumi, S.Y.; Power, M.J.; Tinner, W.; Vanniére, B. Global biomass burning: A synthesis and review of Holocene paleofire records and their controls. Quat. Sci. Rev. 2013, 65, 5–25. [Google Scholar] [CrossRef]
- Zedler, P.H. Are some plants born to burn? Trends Ecol. Evol. 1995, 10, 393–395. [Google Scholar] [CrossRef]
- Saura-Mas, S.; Paula, S.; Pausas, J.G.; Lloret, F. Fuel loading and flammability in the Mediterranean Basin woody species with different post-fire regenerative strategies. Int. J. Wildland Fire 2010, 19, 783–794. [Google Scholar] [CrossRef] [Green Version]
- Moreira, F.; Ascoli, D.; Safford, H.; Adams, M.A.; Moreno, J.M.; Pereira, J.M.; Catry, F.X.; Armesto, J.; Bond, W.; González, M.E. Wildfire management in Mediterranean-type regions: Paradigm change needed. Environ. Res. Lett. 2020, 15, 011001. [Google Scholar] [CrossRef]
- Kelly, L.T.; Brotons, L. Using fire to promote biodiversity. Science 2017, 355, 1264–1265. [Google Scholar] [CrossRef]
- Amatulli, G.; Rodrigues, M.J.; Trombetti, M.; Lovreglio, R. Assessing long-term fire risk at local scale by means of decision tree technique. J. Geophy. Res. Biogeo. 2006, 111, G04S05. [Google Scholar] [CrossRef] [Green Version]
- Guglietta, D.; Migliozzi, A.; Ricotta, C. A Multivariate Approach for Mapping Fire Ignition Risk: The Example of the National Park of Cilento (Southern Italy). Environ. Manag. 2015, 56, 157–164. [Google Scholar] [CrossRef]
- Foresta, M.; Carranza, M.L.; Garfì, V.; Di Febbraro, M.; Marchetti, M.; Loy, A. A systematic conservation planning approach to fire risk management in Natura 2000 sites. J. Environ. Manag. 2016, 181, 574–581. [Google Scholar] [CrossRef]
- Molina, J.R.; González-Cabán, A.; Rodríguez y Silva, F. Wildfires impact on the economic susceptibility of recreation activities: Application in a Mediterranean protected area. J. Environ. Manag. 2019, 245, 454–463. [Google Scholar] [CrossRef]
- Archibald, S.; Nickless, A.; Scholes, R.J.; Schulze, R. Methods to determine the impact of rainfall on fuels and burned area in southern African savannas. Int. J. Wildland Fire 2010, 19, 774–782. [Google Scholar] [CrossRef]
- Palumbo, I.; Grégoire, J.M.; Simonetti, D.; Punga, M. Spatio-temporal distribution of fire activity in protected areas of Sub-Saharan Africa derived from MODIS data. Procedia Environ. Sci. 2011, 7, 26–31. [Google Scholar] [CrossRef]
- Mansuy, N.; Miller, C.; Parisien, M.-A.; Parks, S.A.; Batllori, E.; Moritz, M.A. Contrasting human influences and macro-environmental factors on fire activity inside and outside protected areas of North America. Environ. Res. Lett. 2019, 14, 064007. [Google Scholar] [CrossRef]
- Rodríguez, G.L.; Vicente, V.R.; Pérez, M.F.M. Influence of the Declaration of Protected Natural Areas on the Evolution of Forest Fires in Collective Lands in Galicia (Spain). Forests 2022, 13, 1161. [Google Scholar] [CrossRef]
- Salis, M.; Ager, A.A.; Arca, B.; Finney, M.A.; Bacciu, V.; Duce, P.; Spano, D. Assessing exposure of human and ecological values to wildfire in Sardinia, Italy. Int. J. Wildland Fire 2013, 22, 549–565. [Google Scholar] [CrossRef]
- Oliveira, S.; Félix, F.; Nunes, A.; Lourenço, L.; Laneve, G.; Sebastián-López, A. Mapping wildfire vulnerability in Mediterranean Europe. Testing a stepwise approach for operational purposes. J. Environ. Manag. 2018, 206, 158–169. [Google Scholar] [CrossRef]
- Alcasena, F.J.; Ager, A.A.; Bailey, J.D.; Pineda, N.; Vega-García, C. Towards a comprehensive wildfire management strategy for Mediterranean areas: Framework development and implementation in Catalonia, Spain. J. Environ. Manag. 2019, 231, 303–320. [Google Scholar] [CrossRef]
- Alcasena, F.; Ager, A.; Le Page, Y.; Bessa, P.; Loureiro, C.; Oliveira, T. Assessing Wildfire Exposure to Communities and Protected Areas in Portugal. Fire 2021, 4, 82. [Google Scholar] [CrossRef]
- Naveh, Z. The evolutionary significance of fire in the mediterranean region. Vegetatio 1975, 29, 199–208. [Google Scholar] [CrossRef]
- Blondel, J. The ‘Design’ of Mediterranean Landscapes: A Millennial Story of Humans and Ecological Systems during the Historic Period. Hum. Ecol. 2006, 34, 713–729. [Google Scholar] [CrossRef]
- Connor, S.E.; Vannière, B.; Colombaroli, D.; Anderson, R.S.; Carrión, J.S.; Ejarque, A.; Gil Romera, G.; González-Sampériz, P.; Hoefer, D.; Morales-Molino, C.; et al. Humans take control of fire-driven diversity changes in Mediterranean Iberia’s vegetation during the mid–late Holocene. Holocene 2019, 29, 886–901. [Google Scholar] [CrossRef]
- Moreno, J.M.; Morales-Molino, C.; Torres, I.; Arianoutsou, M. Fire in Mediterranean pine forests: Past, present and future. In Pines and Their Mixed Forest Ecosystems in the Mediterranean Basin; Springer: Cham, Switzerland, 2021; pp. 421–456. [Google Scholar] [CrossRef]
- Urbieta, I.R.; Franquesa, M.; Viedma, O.; Moreno, J.M. Fire activity and burned forest lands decreased during the last three decades in Spain. Ann. For. Sci. 2019, 76, 90. [Google Scholar] [CrossRef]
- Amatulli, G.; Camia, A.; San-Miguel-Ayanz, J. Estimating future burned areas under changing climate in the EU-Mediterranean countries. Sci. Total Environ. 2013, 450, 209–222. [Google Scholar] [CrossRef]
- Bedia, J.; Herrera, S.; Camia, A.; Moreno, J.; Gutiérrez, J.M. Forest fire danger projections in the Mediterranean using ENSEMBLES regional climate change scenarios. Clim. Change 2014, 122, 185–199. [Google Scholar] [CrossRef] [Green Version]
- Turco, M.; Rosa-Cánovas, J.J.; Bedia, J.; Jerez, S.; Montávez, J.P.; Llasat, M.C.; Provenzale, A. Exacerbated fires in Mediterranean Europe due to anthropogenic warming projected with non-stationary climate-fire models. Nat. Commun. 2018, 9, 1–9. [Google Scholar] [CrossRef] [Green Version]
- Ganteaume, A.; Jappiot, M. What causes large fires in Southern France. Forest Ecol. Manag. 2013, 294, 76–85. [Google Scholar] [CrossRef] [Green Version]
- Ricotta, C.; Bajocco, S.; Guglietta, D.; Conedera, M. Assessing the Influence of Roads on Fire Ignition: Does Land Cover Matter? Fire 2018, 1, 24. [Google Scholar] [CrossRef] [Green Version]
- Calviño-Cancela, M.; Chas-Amil, M.L.; García-Martínez, E.D.; Touza, J. Interacting effects of topography, vegetation, human activities and wildland-urban interfaces on wildfire ignition risk. Forest Ecol. Manag. 2017, 397, 10–17. [Google Scholar] [CrossRef] [Green Version]
- D’Este, M.; Ganga, A.; Elia, M.; Lovreglio, R.; Giannico, V.; Spano, G.; Colangelo, G.; Lafortezza, R.; Sanesi, G. Modeling fire ignition probability and frequency using Hurdle models: A cross-regional study in Southern Europe. Ecol. Process. 2020, 9, 54. [Google Scholar] [CrossRef]
- Viedma, O.; Urbieta, I.R.; Moreno, J.M. Wildfires and the role of their drivers are changing over time in a large rural area of west-central Spain. Sci. Rep. 2018, 8, 1–13. [Google Scholar] [CrossRef] [PubMed] [Green Version]
- Bajocco, S.; Ferrara, C.; Guglietta, D.; Ricotta, C. Fifteen years of changes in fire ignition frequency in Sardinia (Italy): A rich-get-richer process. Ecol. Indic. 2019, 104, 543–548. [Google Scholar] [CrossRef]
- San-Miguel-Ayanz, J.; Durrant, T.; Boca, R.; Camia, A. Forest Fire Damage in Natura 2000 Sites 2000–2012. In JRC Scientific and Policy Reports, Publisher European Commission, Joint Research Centre; European Commission: Ispra, Italy, 2012. [Google Scholar] [CrossRef]
- San-Miguel-Ayanz, J.; Durrant, T.; Boca, R.; Maianti, P.; Libertà, G.; Artés Vivancos, T.; Oom, D.; Branco, A.; De Rigo, D.; Ferrari, D.; et al. Forest Fires in Europe, Middle East and North Africa 2021; Publications Office of the European Union: Luxembourg, 2022; ISBN 978-92-76-58585-5. [Google Scholar] [CrossRef]
- Chazarra-Bernabé, A.; Flórez García, E.; Peraza, B.; Tohá Rebull, T.; Lorenzo Mariño, B.; Criado, E.; Moreno García, J.V.; Romero Fresneda, R.; Botey, M.R. Mapas climáticos de España (1981–2010) y ETo (1996–2016); Ministerio para la Transición Ecológica, Agencia Estatal de Meteorología: Madrid, Spain, 2018. [Google Scholar] [CrossRef]
- Morales-Molino, C.; Colombaroli, D.; Tinner, W.; Perea, R.; Valbuena-Carabaña, M.; Carrión, J.S.; Gil, L. Vegetation and fire dynamics during the last 4000 years in the Cabañeros National Park (central Spain). Rev. Palaeobot. Palyno. 2018, 253, 110–122. [Google Scholar] [CrossRef]
- Montiel-Molina, C.; Vilar, L.; Romão-Sequeira, C.; Karlsson, O.; Galiana-Martín, L.; Madrazo-García de Lomana, G.; Palacios-Estremera, M.T. Have historical land use/land cover changes triggered a fire regime shift in central Spain? Fire 2019, 2, 44. [Google Scholar] [CrossRef] [Green Version]
- Trochet, A.; Schmeller, D. Effectiveness of the Natura 2000 network to cover threatened species. Nat. Conserv. 2013, 4, 35. [Google Scholar] [CrossRef]
- Ninyerola, M.; Pons, X.; Roure, J.M. Atlas Climático Digital de la Península Ibérica. In Metodología y Aplicaciones en Bioclimatología y Geobotánica; Universidad Autónoma de Barcelona: Bellaterra, Spain, 2005. [Google Scholar]
- Vicente-Serrano, S.M.; Tomas-Burguera, M.; Beguería, S.; Reig, F.; Latorre, B.; Peña-Gallardo, M.; Luna, M.Y.; Morata, A.; González-Hidalgo, J.C. A high resolution dataset of drought indices for Spain. Data 2017, 2, 22. [Google Scholar] [CrossRef] [Green Version]
- QGIS.org. QGIS Geographic Information System, QGIS 3.0.0; QGIS Association. 2022. Available online: http://www.qgis.org (accessed on 16 October 2022).
- Chas-Amil, M.L.; Touza, J.; García-Martínez, E. Forest fires in the wildland–urban interface: A spatial analysis of forest fragmentation and human impacts. Appl. Geogr. 2013, 43, 127–137. [Google Scholar] [CrossRef]
- Phillips, S.J.; Anderson, R.P.; Schapire, R.E. Maximum entropy modeling of species geographic distributions. Ecol. Model. 2006, 190, 231–259. [Google Scholar] [CrossRef] [Green Version]
- Phillips, S.J.; Anderson, R.P.; Dudík, M.; Schapire, R.E.; Blair, M.E. Opening the black box: An open-source release of Maxent. Ecography 2017, 40, 887–893. [Google Scholar] [CrossRef]
- Fonseca, M.G.; Aragão, L.E.O.C.; Lima, A.; Shimabukuro, Y.E.; Arai, E.; Anderson, L.O. Modelling fire probability in the Brazilian Amazon using the maximum entropy method. Int. J. Wildland Fire 2016, 25, 955–969. [Google Scholar] [CrossRef]
- Syphard, A.D.; Rustigian-Romsos, H.; Mann, M.; Conlisk, E.; Moritz, M.A.; Ackerly, D. The relative influence of climate and housing development on current and projected future fire patterns and structure loss across three California landscapes. Global Environ. Chang. 2019, 56, 41–55. [Google Scholar] [CrossRef]
- West, A.M.; Kumar, S.; Brown, C.S.; Stohlgren, T.J.; Bromberg, J. Field validation of an invasive species Maxent model. Ecol. Infor. 2016, 36, 126–134. [Google Scholar] [CrossRef] [Green Version]
- Akaike, H. Information theory and an extension of the maximum likelihood principle. In Selected Papers of Hirotugu Akaike; Springer: New York, NY, USA, 1998; pp. 199–213. [Google Scholar] [CrossRef]
- Warren, D.L.; Glor, R.E.; Turelli, M. ENMTools: A toolbox for comparative studies of environmental niche models. Ecography 2010, 33, 607–611. [Google Scholar] [CrossRef]
- Anderson, D.R.; Burnham, K.P. Avoiding pitfalls when using information-theoretic methods. J. Wildl. Manag. 2002, 66, 912–918. [Google Scholar] [CrossRef]
- Warren, D.L.; Seifert, S.N. Ecological niche modeling in Maxent: The importance of model complexity and the performance of model selection criteria. Ecol. Appl. 2011, 21, 335–342. [Google Scholar] [CrossRef] [Green Version]
- Peterson, A.T.; Soberón, J.; Pearson, R.G.; Anderson, R.P.; Martínez-Meyer, E.; Nakamura, M.; Araújo, M.B. Ecological niches and geographic distributions (MPB-49). In Ecological Niches and Geographic Distributions (MPB-49); Princeton University Press: Princeton, NJ, USA, 2011. [Google Scholar] [CrossRef]
- Kaufman, L.; Rousseeuw, P.J. Partitioning around medoids (Program PAM). In Finding Groups in Data: An Introduction to Cluster Analysis; Wiley Series in Probability and Statistics John Wiley & Sons: Hoboken, NJ, USA, 1990; Volume 344, pp. 68–125. [Google Scholar]
- Legendre, P.; Legendre, L. Numerical Ecology, 3rd ed.; Elsevier: Oxford, UK, 2012. [Google Scholar]
- Kassambara, A. Practical Guide to Cluster Analysis in R: Unsupervised Machine Learning; Sthda CreateSpace: North Charleston, SC, USA, 2017; Volume 1. [Google Scholar]
- Tibshirani, R.; Walther, G.; Hastie, T. Estimating the number of clusters in a data set via the gap statistic. J. R. Stat. Soc. Series B Stat. Methodol. 2001, 63, 411–423. [Google Scholar] [CrossRef]
- R Core Team. R: A Language and Environment for Statistical Computing; R Foundation for Statistical Computing: Vienna, Austria, 2021; Available online: https://www.R-project.org (accessed on 16 November 2022).
- Martínez-Fernández, J.; Ruiz-Benito, P.; Zavala, M.A. Recent land cover changes in Spain across biogeographical regions and protection levels: Implications for conservation policies. Land Use Policy 2015, 44, 62–75. [Google Scholar] [CrossRef]
- Rodríguez-Rodríguez, D.; Martínez-Vega, J. Assessing recent environmental sustainability in the Spanish network of National Parks and their statutory peripheral areas. Appl. Geogr. 2017, 89, 22–31. [Google Scholar] [CrossRef]
- Moreno, J.M.; Viedma, O.; Zavala, G.; Luna, B. Landscape variables influencing forest fires in central Spain. Int. J. Wildland Fire 2011, 20, 678–689. [Google Scholar] [CrossRef] [Green Version]
- Viedma, O.; Angeler, D.G.; Moreno, J.M. Landscape structural features control fire size in a Mediterranean forested area of central Spain. Int. J. Wildland Fire 2009, 18, 575–583. [Google Scholar] [CrossRef]
- López-Santalla, A.; López-Garcia, M. Los Incendios Forestales en España. Decenio 2006–2015; Ministerio de Agricultura Pesca y Alimentación: Madrid, Spain, 2019. [Google Scholar]
- Lanzas, M.; Hermoso, V.; Morán-Ordoñez, A.; Regos, A.; Bota, G.; Brotons, L. The value of unprotected land for future conservation efforts under dynamic conditions. Biol. Conserv. 2021, 261, 109232. [Google Scholar] [CrossRef]
- Turco, M.; Von Hardenberg, J.; AghaKouchak, A.; Llasat, M.C.; Provenzale, A.; Trigo, R.M. On the key role of droughts in the dynamics of summer fires in Mediterranean Europe. Sci. Rep. 2017, 7, 81. [Google Scholar] [CrossRef] [Green Version]
- Shyphard, A.D.; Radeloff, V.C.; Hawbaker, T.J.; Stewart, S.L. Conservation Threats Due to Human-Caused Increases in Fire Frequency in Mediterranean-Climate Ecosystems. Conserv. Biol. 2009, 23, 758–769. [Google Scholar] [CrossRef]
- San-Miguel-Ayanz, J.; Durrant, T.; Boca, R.; Camia, A. Forest Fire Damage in Natura 2000 Sites 2000–2012; Publications Office of the European Union: Luxembourg, 2012. [Google Scholar] [CrossRef]
- Lloret, F.; Calvo, E.; Pons, X.; Díaz-Delgado, R. Wildfires and landscape patterns in the Eastern Iberian Peninsula. Landsc. Ecol. 2002, 17, 745–759. [Google Scholar] [CrossRef] [Green Version]
- Viedma, O.; Moreno, J.M.; Rieiro, I. Interactions between land use/land cover change, forest fires and landscape structure in Sierra de Gredos (Central Spain). Environ. Conserv. 2006, 33, 212–222. [Google Scholar] [CrossRef]
- Scott, J.H.; Thompson, M.P.; Calkin, D.E. A Wildfire Risk Assessment Framework for Land and Resource Management; Gen. Tech. Rep.; RMRS-GTR-315: Fort Collins, CO, USA, 2013; p. 83. [Google Scholar]
- Hegeman, E.E.; Dickson, B.G.; Zachmann, L.J. Probabilistic models of fire occurrence across National Park Service units within the Mojave Desert Network, USA. Landsc. Ecol. 2014, 29, 1587–1600. [Google Scholar] [CrossRef]
- Costafreda-Aumedes, S.; Comas, C.; Vega-Garcia, C. Human-caused fire occurrence modelling in perspective: A review. Int. J. Wildland Fire 2017, 26, 983–998. [Google Scholar] [CrossRef]
- Bajocco, S.; Ricotta, C. Evidence of selective burning in Sardinia (Italy): Which land-cover classes do wildfires prefer? Landsc. Ecol. 2008, 23, 241–248. [Google Scholar] [CrossRef]
- Catry, F.X.; Rego, F.C.; Bação, F.; Moreira, F. Modeling and mapping wildfre ignition risk in Portugal. Int. J. Wildland Fire 2009, 18, 921–931. [Google Scholar] [CrossRef] [Green Version]
- Faivre, N.; Jin, Y.; Goulden, M.L.; Randerson, J.T. Controls on the spatial pattern of wildfire ignitions in Southern California. Int. J. Wildland Fire 2014, 23, 799–811. [Google Scholar] [CrossRef] [Green Version]
- Boubeta, M.; Lombardía, M.J.; Marey-Pérez, M.F.; Morales, D. Prediction of forest fires occurrences with area-level Poisson mixed models. J. Environ. Manag. 2015, 154, 151–158. [Google Scholar] [CrossRef]
- Oliveira, S.L.J.; Pereira, J.M.C.; Carreiras, J.M.B. Fire frequency analysis in Portugal (1975–2005), using Landsat-based burnt area maps. Int. J. Wildland Fire 2012, 21, 48–60. [Google Scholar] [CrossRef]
- Parisien, M.-A.; Snetsinger, S.; Greenberg, J.A.; Nelson, C.R.; Schoennagel, T.; Dobrowski, S.Z.; Moritz, M.A. Spatial variability in wildfire probability across the western United States. Int. J. Wildland Fire 2012, 21, 313–327. [Google Scholar] [CrossRef]
- Martín, Y.; Zúñiga-Antón, M.; Rodrigues Mimbrero, M. Modelling temporal variation of fire-occurrence towards the dynamic prediction of human wildfire ignition danger in northeast Spain. Geomat. Nat. Hazards Risk 2019, 10, 385–411. [Google Scholar] [CrossRef]
- Peris-Llopis, M.; González-Olabarria, J.R.; Mola-Yudego, B. Size dependency of variables influencing fire occurrence in Mediterranean forests of Eastern Spain. Eur. J. For. Res. 2020, 139, 525–537. [Google Scholar] [CrossRef] [Green Version]
- Oliveira, S.; Pereira, J.M.C.; San-Miguel-Ayanz, J.; Lourenço, L. Exploring the spatial patterns of fire density in Southern Europe using Geographically Weighted Regression. Appl. Geogr. 2014, 51, 143–157. [Google Scholar] [CrossRef]
- Romero-Calcerrada, R.; Novillo, C.J.; Millington, J.D.A.; Gomez-Jimenez, I. GIS analysis of spatial patterns of human-caused wildfire ignition risk in the SW of Madrid (Central Spain). Landsc. Ecol. 2008, 23, 341–354. [Google Scholar] [CrossRef]
- Vilar del Hoyo, L.; Martín Isabel, M.P.; Martínez Vega, F.J. Logistic regression models for human-caused wildfire risk estimation: Analysing the effect of the spatial accuracy in fire occurrence data. Eur. J. For. Res. 2011, 130, 983–996. [Google Scholar] [CrossRef]
- Moreira, F.; Vaz, P.; Catry, F.; Silva, J.S. Regional variations in wildfire susceptibility of land-cover types in Portugal: Implications for landscape management to minimize fire hazard. Int. J. Wildland Fire 2009, 18, 563–574. [Google Scholar] [CrossRef]
Figure 1.
(A) Location of the study area (inset) within peninsular Spain and distribution of protected areas (grey shading) and elevation (larger map). Maps of points of ignition for wildfires that occurred in west-central Spain during 2001–2015. (B) 1–5 ha (n = 5895); (C) 5–50 ha (n = 2658); (D) 50–500 ha (n = 462); (E) ≥ 500 ha (n = 74).

Figure 2.
Variable contribution (%) to best models for each fire size: (A) 1–5 ha fires; (B) 5–50 ha; (C) 50500 ha; (D) ≥500 ha. Each group of variables is represented in different colors: climate (blue), LULC (green), infrastructures and socioeconomy (red).
Figure 2.
Variable contribution (%) to best models for each fire size: (A) 1–5 ha fires; (B) 5–50 ha; (C) 50500 ha; (D) ≥500 ha. Each group of variables is represented in different colors: climate (blue), LULC (green), infrastructures and socioeconomy (red).

Figure 3.
Maps of probability of fire ignition for fires 1–5 ha, 5–50 ha, 50–500 ha, and ≥500 ha (left panels, A–D) in west-central Spain based on Maxent models. Black areas correspond to reservoirs and urban areas. Histograms (middle, E–H) and box plots (right, I–L) of ignition probability in protected (PA), buffer (BZ) and non-protected areas (NP). Differences among areas are shown by the different letters based on generalized linear models and post hoc pairwise comparisons with Bonferroni correction from 30,000 random points (p < 0.001).

Figure 4.
Distribution of the 172 protected areas (PA) in the principal component analysis biplot. Ellipses indicate the 6 clusters of PA grouped according to a hierarchical clustering analysis. Larger symbols represent the centroid of each cluster.
Figure 4.
Distribution of the 172 protected areas (PA) in the principal component analysis biplot. Ellipses indicate the 6 clusters of PA grouped according to a hierarchical clustering analysis. Larger symbols represent the centroid of each cluster.

Figure 5.
Box plots showing ignition likelihood distribution for fires 1–5 ha (A), 5–50 ha (B), 50–500 ha (C), and ≥500 ha (D) in each PA cluster (2 to 6 in Figure 4; wetlands not shown). Letters indicate significant differences (p < 0.001) between PA clusters based on generalized linear models and post hoc pairwise comparisons with Bonferroni correction.


Table 1.
Explanatory variables used in the fire ignition models.
| Variable | Mean (Range) | Resolution/Scale | Year |
|---|---|---|---|
| Climate | |||
| Mean annual temperature (°C) | 13.4 (4.5–17.8) | 200 m | 2001–2015 |
| Mean annual maximum temperature (°C) | 19.7 (9–24.3) | ||
| Mean annual precipitation (mm) | 575 (230–1700) | ||
| Mean SPEI 12 months | −0.24 (−1–0.64) | 1.1 km | |
| Topography | |||
| Elevation (m) | 801 (226–2591) | 25 m | 2008–2015 |
| Slope (°) | 2.7 (0–37.8) | ||
| Aspect: Northness | 0 (−1–1) | ||
| Aspect: Eastness | 0 (−1–1) | ||
| Radiation (kW/m2·h) | 745 (515–816) | ||
| Summer sunlight (h) | 1253 (734–1293) | ||
| Land Use/Land Cover | Area percentage | ||
| Pinus nigra, P. uncinata, P. sylvestris forests | 3.1% | 1:50,000 | 1997–2002 |
| P. pinea, P. pinaster, P. halepensis forests | 6.4% | ||
| Mixed forests | 3.7% | ||
| Evergreen oak forests | 8.6% | ||
| Deciduous oak forests | 2.7% | ||
| Broadleaved forests | 2.2% | ||
| Juniperus sp. woodlands | 1.1% | ||
| Transitional woodlands and shrublands | 0.3% | ||
| Shrublands | 8.4% | ||
| Dehesas (savanna-type oak woodlands) | 5.1% | ||
| Grasslands | 3.0% | ||
| Agricultural lands (crops and pastures) | 25.4% | ||
| Artificial surfaces | 1.2% | ||
| Water bodies and wetlands | 0.8% | ||
| Interfaces | |||
| Wildland–Agrarian Interface (WAI) | 18.9% | 1:50,000 | 1997–2002 |
| Wildland–Grassland Interface (WGI) | 8.3% | ||
| Wildland–Urban Interface (WUI) | 1.2% | ||
| Remoteness | |||
| Distance to protected areas (m) | 4082 (0–36,345) | 1:50,000 | 2020 |
| Distance to built-up areas (m) | 3140 (0–16,620) | 1:25,000 | 2019 |
| Linear infrastructures | |||
| Road density (km/km2) | 0.5 (0–4.4) | 1:50,000 | 2019 |
| Dirt road density (km/km2) | 2.2 (0–14) | 1:25,000 | 2019 |
| Powerline density (km/km2) | 0.1 (0–0.8) | 1:10,000 | 2015–2016 |
| Socioeconomy | |||
| Population density (No./km2) | 60.9 (0.4–6550) | Municipality data | 2001 |
| Population change (%) | −1.1 (−66–1531) | 2001–2015 | |
| Agricultural machine density (No./km2) | 1.2 (0–31.1) | 1999 | |
| Farm density (No./km2) | 2.4 (0–73.1) | 1999 | |
| Farm change (%) | −35.4 (−100–3900) | 1999–2009 | |
| Agrarian surface (%) | 57.4 (0–100) | 1999 | |
| Agrarian surface change (%) | −4.7 (−84.6–76.4) | 1999–2009 | |
| Cattle density (No./km2) | 21.7 (0–611.9) | 1999 | |
| Cattle change (%) | 23.5 (−100–30,700) | 1999–2009 |
Table 2.
Number of ignitions in the different areas (protected, buffer, non-protected) and total study area for all fire sizes and each fire size class (2001–2015).
Table 2.
Number of ignitions in the different areas (protected, buffer, non-protected) and total study area for all fire sizes and each fire size class (2001–2015).
| All Fire Sizes | 1–5 ha | 5–50 ha | 50–500 ha | ≥500 ha | |
|---|---|---|---|---|---|
| Protected areas (PA) | 2416 (27%) | 1506 (25%) | 719 (27%) | 157 (34%) | 34 (46%) |
| Buffer zones (BZ) | 1128 (12%) | 809 (14%) | 257 (10%) | 50 (11%) | 12 (16%) |
| Non-protected areas (NP) | 5545 (61%) | 3580 (61%) | 1682 (63%) | 255 (55%) | 28 (38%) |
| Total study area | 9089 | 5895 | 2658 | 462 | 74 |
Disclaimer/Publisher’s Note: The statements, opinions and data contained in all publications are solely those of the individual author(s) and contributor(s) and not of MDPI and/or the editor(s). MDPI and/or the editor(s) disclaim responsibility for any injury to people or property resulting from any ideas, methods, instructions or products referred to in the content. |
© 2023 by the authors. Licensee MDPI, Basel, Switzerland. This article is an open access article distributed under the terms and conditions of the Creative Commons Attribution (CC BY) license (https://creativecommons.org/licenses/by/4.0/).
Share and Cite
MDPI and ACS Style
Arellano-del-Verbo, G.; Urbieta, I.R.; Moreno, J.M. Large-Fire Ignitions Are Higher in Protected Areas than Outside Them in West-Central Spain. Fire 2023, 6, 28. https://0-doi-org.brum.beds.ac.uk/10.3390/fire6010028
AMA Style
Arellano-del-Verbo G, Urbieta IR, Moreno JM. Large-Fire Ignitions Are Higher in Protected Areas than Outside Them in West-Central Spain. Fire. 2023; 6(1):28. https://0-doi-org.brum.beds.ac.uk/10.3390/fire6010028
Chicago/Turabian StyleArellano-del-Verbo, Gonzalo, Itziar R. Urbieta, and José M. Moreno. 2023. "Large-Fire Ignitions Are Higher in Protected Areas than Outside Them in West-Central Spain" Fire 6, no. 1: 28. https://0-doi-org.brum.beds.ac.uk/10.3390/fire6010028