
Triggering Pyro-Convection in a High-Resolution Coupled Fire–Atmosphere Simulation
by
 and
and
Flavio Tiago Couto
1,2,*, 
Jean-Baptiste Filippi
3,
Roberta Baggio
3,
Cátia Campos
1 and
Rui Salgado
1,2 1
Instituto de Ciências da Terra—ICT (Polo de Évora), Instituto de Investigação e Formação Avançada—IIFA, Earth Remote Sensing Laboratory (EaRS Lab), Universidade de Évora, 7004-516 Évora, Portugal
2
Departamento de Física, Escola de Ciências e Tecnologia, Universidade de Évora, 7000-671 Évora, Portugal
3
Centre National de la Recherche Scientifique (CNRS), Sciences Pour l’Environnement—Unité Mixte de Recherche 6134, Università di Corsica, Campus Grossetti, 20250 Corte, France
*
Author to whom correspondence should be addressed.
Fire 2024, 7(3), 92; https://0-doi-org.brum.beds.ac.uk/10.3390/fire7030092
Submission received: 31 January 2024
/
Revised: 11 March 2024
/
Accepted: 15 March 2024
/
Published: 16 March 2024
Abstract
:This study aimed to assess fire–atmosphere interactions using the fully coupled Meso-NH–ForeFire system. We focused on the Pedrógão Grande wildfire (28,914 ha), which occurred in June 2017 and was one of the deadliest and most damaging fires in Portugal’s history. Two simulations (control and fully coupled fire–atmosphere) were performed for three two-way nested domains configured with horizontal resolutions of 2 km, 0.4 km, and 0.08 km, respectively, in the atmospheric model Meso-NH. Fire propagation was modeled within the innermost domain with ForeFire, which solves the fire front with a 20 m resolution, producing the heat and vapor fluxes which are then injected into the atmospheric model. A simplified homogeneous fuel distribution was used in this case study. The fully coupled experiment helped us to characterize the smoke plume structure and identify two different regimes: (1) a wind-driven regime, with the smoke plume transported horizontally southward and in the lower troposphere, and (2) a plume-dominated regime, in which the simulated smoke plume extended vertically up to upper levels, favoring the formation of a pyro-cloud. The simulations were compared, and the results suggest that the change in the fire regime was caused by an outflow that affected the main fire front. Furthermore, the fully coupled simulation allowed us to explore the change in meteorology caused by an extreme fire, namely through the development of a pyro-cloud that also induced outflows that reached the surface. We show that the Meso-NH–ForeFire system may strongly contribute to an improved understanding of extreme wildfires events and associated weather phenomena.
1. Introduction
Extreme wildfires have become a widespread issue affecting forested regions from tropical to polar latitudes in both hemispheres [1,2,3,4]. Currently, many of these extreme wildfires are categorized as mega fires, characterized by a total burned area exceeding 10,000 ha. These mega fires significantly and adversely affect both society and the environment [5,6]. Considering this increase in mega fire events, it is of great importance to achieve an increased understanding and a better numerical representation of the extreme pyro-convection phenomenon, i.e., the deep convection occurring within a smoke plume, triggered by the buoyancy variations caused by the heat released by the fire.
One of the main aspects of mega fires is the associated changes in the wind field that may lead to unpredictable fire behavior or extreme pyro-convection resulting in the formation of pyro-clouds. For instance, as the fire activity is maintained by hot and dry air in the lower troposphere in such a manner that plume buoyancy is increased, the convective column may reach the middle levels of the troposphere where water vapor condenses and clouds form, intensifying the vertical motions. These conditions are known to favor the development of pyro-cumulonimbus (pyroCb) clouds. PyroCb clouds are one of the main hazards associated with mega fires and directly affect the fire front propagation [7,8,9]. Such an environment represents significant challenges to firefighters and communities, especially when wildfires occur near an urban interface. However, pyroCb cloud formation is not the only factor producing sudden changes in the evolution of the fire front. For instance, as shown in several studies [10,11,12,13], complex terrain also affects fire propagation. Therefore, forecasting the behavior of the fire front under the extreme conditions induced by the fire–atmosphere interaction is one of the most challenging issues that firefighters have to face.
Over the last decades, the continuous advances in computational capabilities have allowed for more sophisticated numerical modeling of fire–atmosphere interactions and fire spread, thus contributing to an increased understanding of critical situations. To conduct meaningful numerical simulations of fire behavior, it is essential to account for numerous factors [14], and the development of more advanced numerical modeling tools is an active field of research. For instance, in a recent paper, Mohammadian Bishe [15] proposed a modified quasi-physical fire spread model to predict fire propagation in grasslands, and showed improvements in fire spread predictions, considering radiative heat transfer and convective heat transfer.
One of the recent developments in fire modeling comes from the coupling of cloud-resolving models (CRMs) with fire propagation models [14,16]. Considering the coupled fire–atmosphere model WRF-SFIRE [17], an idealized study showed that the inclusion of the two-way fire–atmosphere coupling, i.e., where fire-released heat and moisture fluxes are fed to the atmosphere to resolve fire-induced winds, which in turn affect the evolution of the fire spread, improves the representation of fire behavior, with fire-induced winds accelerating fire progression 36.2% faster than the one-way coupled simulation, i.e., where fire-released heat and moisture fluxes are neglected [18]. The WRF-Fire code [19] was utilized to determine the fire spread and explore the impact of the energy released near the fire front, aiming to understand fire–atmosphere interactions [20]. The fire induced an increase in temperature within the first 2 km above the ground, with a consequent generation of vertical motion due to fluctuations in buoyancy. The vertical motion was simulated extending up to middle-tropospheric levels [20]. These are a few examples of modeling the fire–atmosphere interaction, and other equivalent models have been developed to support decision makers and help firefighters [21,22].
The use of real-time coupled simulations can support the management of an emergency response, providing crucial insights into potential fire propagation. Moreover, high-resolution simulations enhance the accuracy of such predictions by considering factors such as wind patterns, terrain, and fuel types [23]. The Meso-NH–ForeFire model is one of the numerical modeling tools able to represent the complex fire–atmosphere system and has been successfully used in the last decade [24,25,26,27,28]. Meso-NH is an open area, research Numerical Weather Prediction model which can be used to forecast atmospheric motions on a large range of scales [29], spanning from thousands of kilometers to a few meters. ForeFire is a fire propagation model which represents the fire front using lagrangian markers [24,30]. It features a large variety of spread propagation models and supports high-resolution fuel distribution and orography maps. We discuss these two models in more detail in Section 2.
When dealing with wildfire suppression, the abrupt changes in the fire propagation are very challenging to control for firefighters, thus posing a significant risk for all emergency responders and the local community. In 2017, an extreme fire season dramatically affected mainland Portugal with more than 16,000 ignitions and 440,000 hectares of burned area [31]. A total of 11 mega fire events evolved beyond control in mid-June, July, and mid-October [32]. These wildfires destroyed homes, buildings, and infrastructures, leaving many residents displaced and causing significant economic losses. The Pedrógão Grande wildfire was the deadliest event, causing more than 60 fatalities. It was ignited at 1330 UTC on 17 June 2017 and occurred in a region formed by some areas that had not burned for 20 years, indicating a greater accumulation of forest fuel [33].
The meteorological conditions were characterized by a dry thunderstorm environment that favored the development of a mesoscale convective system [34,35]. Such a cloud system and its electrical activity produced several natural ignitions on that afternoon, as well as several convective outflows in the region where the wildfire occurred [34]. However, the most remarkable event was the sudden area expansion that took by surprise those traveling on the roads, particularly in EN 236-1. To understand this episode at the fire-scale environment, the impact of the fire on the atmosphere was recently studied using a fire to atmosphere simulation, which showed a fire-generated thunderstorm during the Pedrógão Grande wildfire [28].
With respect to a previous study by Couto [28], which is based on a one-way fire to atmosphere coupling, here we use the fully coupled version of the Meso-NH–ForeFire code, which allows us to investigate the impact of fire-induced atmospheric motions on the fire’s own propagation. In other words, the modeling considers both the impact of the fire on the local atmosphere and the influence of the atmospheric conditions on the progression of the fire front itself. This short communication brings our recent findings from the use of the fully coupled Meso-NH–ForeFire system, particularly in terms of accurately representing smoke plume structure, boundary-layer circulations and associated weather phenomena generated from extreme pyro-convection.
2. Method
2.1. Meso-NH Atmospheric Model Configuration
Meso-NH is a CRM able to represent the movements and main physical processes within the atmosphere, namely convection, turbulence, cloud microphysics, and atmospheric electricity, among others [29]. To further understand the fire–atmosphere system, two simulations were carried out. In the first simulation, which we refer to as the control (CTRL), the fire does not affect the atmospheric model. In the second one, called “fully coupled”, the fire–atmosphere interaction is considered as the heat and water vapor fluxes generated by the fire evolution modeled by ForeFire are used as input in the Meso-NH atmospheric model.
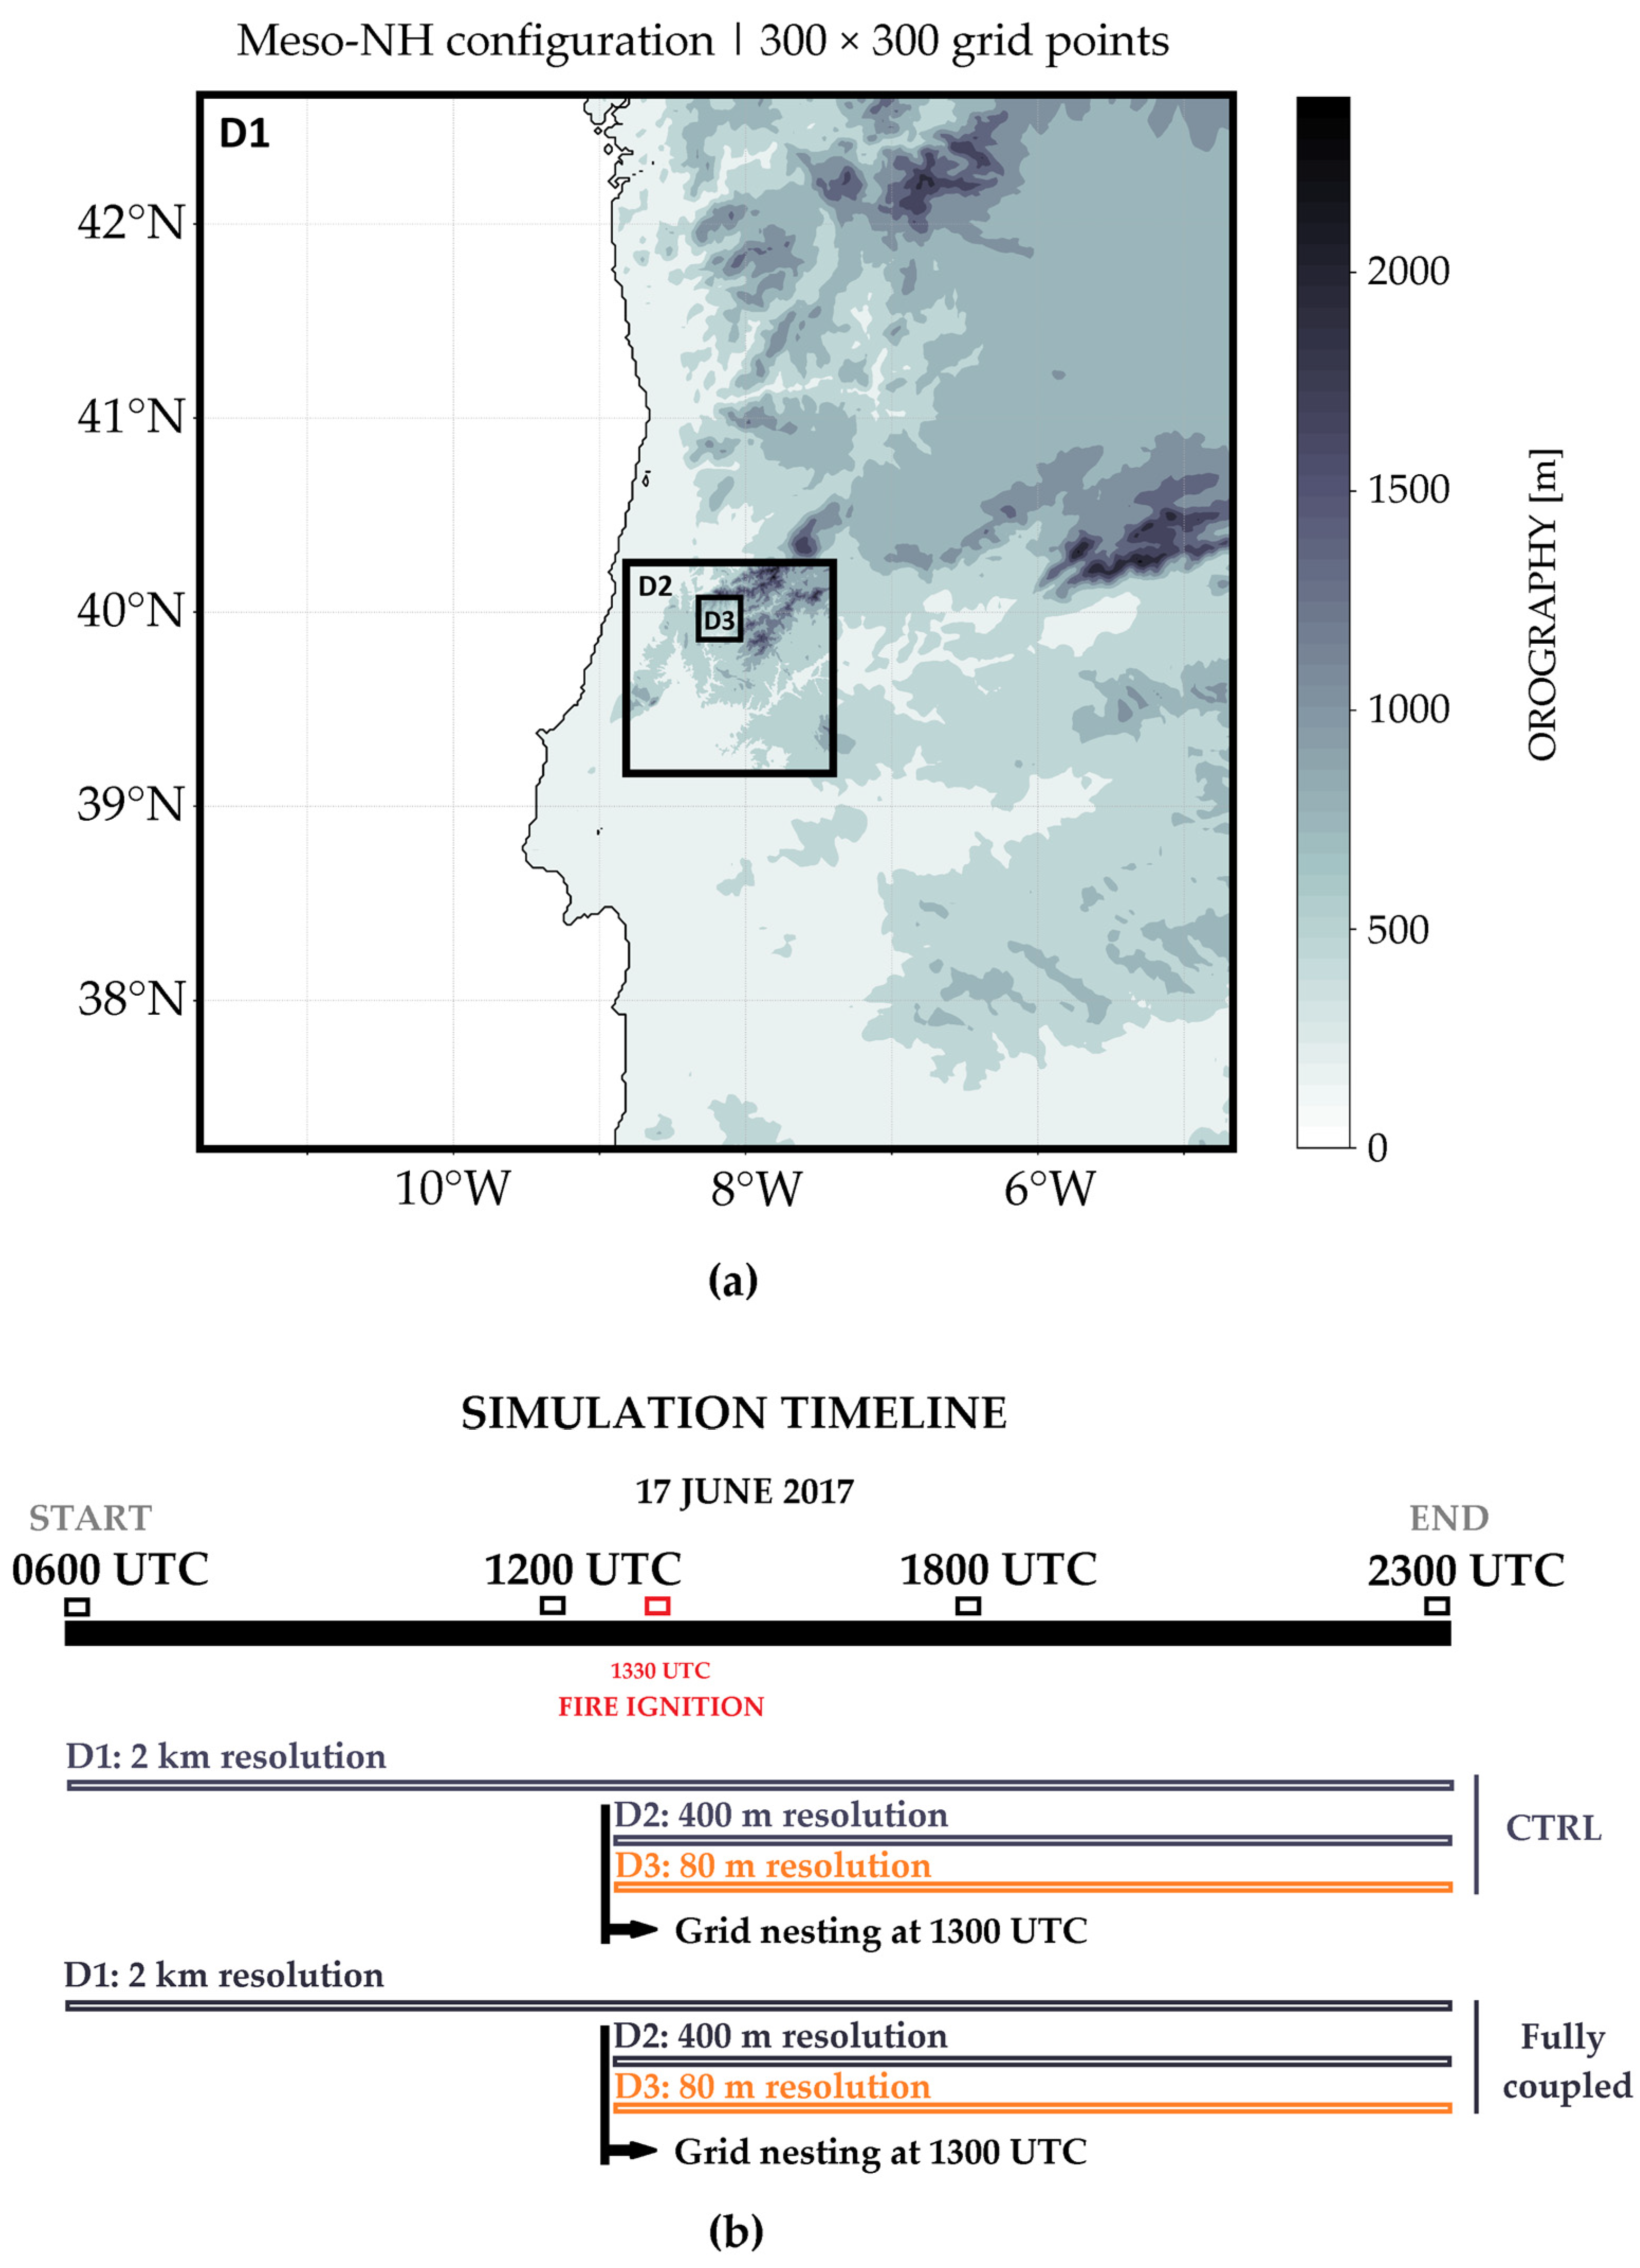
The simulations were performed using three two-way nested domains configured with 300 × 300 grid points and horizontal resolutions of 2 km (D1), 0.4 km (D2), and 0.08 km (D3), as shown in Figure 1a. The innermost domain, which is the one coupled with the ForeFire code, was configured with high horizontal resolution in order to study the atmospheric features of the fire environment. The vertical resolution is the same for all the domains, with 50 levels up to 20 km, stretching gradually from 30 m height (bottom and following the terrain) to 900 m (top). Figure 1b displays the timeline of each simulation. The simulation with the 2 km resolution (D1) began on 17 June 2017 at 0600 UTC, with the grid nesting (D2 and D3) beginning at 1300 UTC (Figure 1b). Initial and lateral boundary conditions for the outer domain were provided by a European Center for Medium-Range Weather Forecasts (ECMWF) analysis (updated every 6 h) considering the ECMWF’s Integrated Forecasting System (IFS) with a horizontal resolution of about 9 km.
Concerning the physical configuration of the Meso-NH model, all nested domains used a one-and-a-half-order turbulence closure scheme [36]. The two highest resolution domains (D2 and D3) used the 3D version of the scheme, while the first domain (D1) considered only the 1D version, neglecting horizontal turbulent flows. Cloud microphysics was parameterized by the ICE3 one-moment bulk microphysical scheme, considering six categories of the water substance (water vapor, cloud droplets, rain drops, pristine ice crystals, snow-aggregates, and graupel) [37]. The spatial resolutions used in this study allowed the model to solve explicitly deep and shallow convection. The radiation parameterization was based on the Rapid Radiative Transfer Model [38], whereas the surface energy exchanges were parameterized from the externalized platform of surface models, SURFEX [39]. It is noteworthy that the nesting setup was such that only averaged turbulence was exchanged between the coarser domains to the inner higher resolution domains, thus filtering out part of the turbulent flow. Nevertheless, as the evolving fire front was fully contained in the highest resolution domain, turbulence from the fire itself was actually resolved at the highest possible resolution.
2.2. ForeFire Fire Propagation Model Configuration
The ForeFire model is a fire propagation model that allows for the calculation of the fire front temporal evolution and the emission of energy and mass fluxes to the atmosphere, considering the terrain slope, atmospheric properties, and fuel characteristics [24,30]. Concerning its configuration in the present study, it was set up on a grid resolution of 20 m and 1200 × 1200 grid points and coupled to the innermost domain (D3).
The formulation of the ForeFire model can be found in works by Filippi [24,30], in particular regarding the treatment of heat fluxes. Here, we considered an energy emission equivalent to 8 MJ being emitted during 250 s for each square meter when and where the fire was present. This amount of energy corresponds to the type of fuel found in the Pedrógão Grande region. In the fully coupled simulation, we used a simplified fuel model, i.e., the fuel load and the fuel moisture were considered horizontally homogeneous in the ForeFire model that here used the Rothermel equation [40] to account for the fire rate of spread, following Anderson’s fuel model 11 [41]. As for propagation, only the fine dead fuel load was considered. Here, 0.4 Kg per square meter was composed of 50 g of water for 400 g of dry mass, a 12.5% moisture content.
As a remark, a more accurate estimate of the fire behavior, the local rate of spread and fire intensity, would have required taking into account detailed fuel distribution, including the effects of roads and fuel-breaks that may interfere strongly with fire propagation. However, considering that the main objective of this present study concerns the ability of the coupled setup to trigger pyro-convection, a systematic method to parameterize detailed fuel state and distribution is left for later work.
The smoke plume is shown using the relative smoke tracer concentration variable (S), emitted where and when fire is present [26]. The smoke tracer S is a passive scalar field injected at a rate of 1 m2·s−1 wherever the fire is present. Fire is considered present if the heat flux from the fire is >100 w·m2. It is computed at the fire resolution, so if an atmospheric cell has only fire active on 10% of its area, then the injection rate is 0.1 m2·s−1. Such a variable does not interact with other modules of the model, and is thus not being considered in cloud microphysics processes nor in radiative transfer.
We evaluated the simulations by comparison with previous studies that documented the wildfire evolution on the basis of observations [33,35], as well as numerical simulations of the atmospheric environment [34] and fire environment using a fire to atmosphere simulation [28]. The next section presents the results and a general discussion about the CTRL and fully coupled simulations.
3. Results and Discussion
In this section, we present the main results of the coupled simulation and the main aspects of the pyro-convective activity in Pedrógão Grande. We focus on the atmospheric phenomena associated with fire propagation, while a detailed discussion on the evolution of the fire front is out of the scope of this publication.
3.1. Identification of Fire Regime from Smoke Plume Structure
Generally speaking, the smoke plume structure significantly affects the environment surrounding the fire, mainly by causing loss of visibility and the transport of pollutants. To analyze the fire regime during the Pedrógão Grande wildfire, the evolution of the smoke tracer concentration variable (S) is discussed.
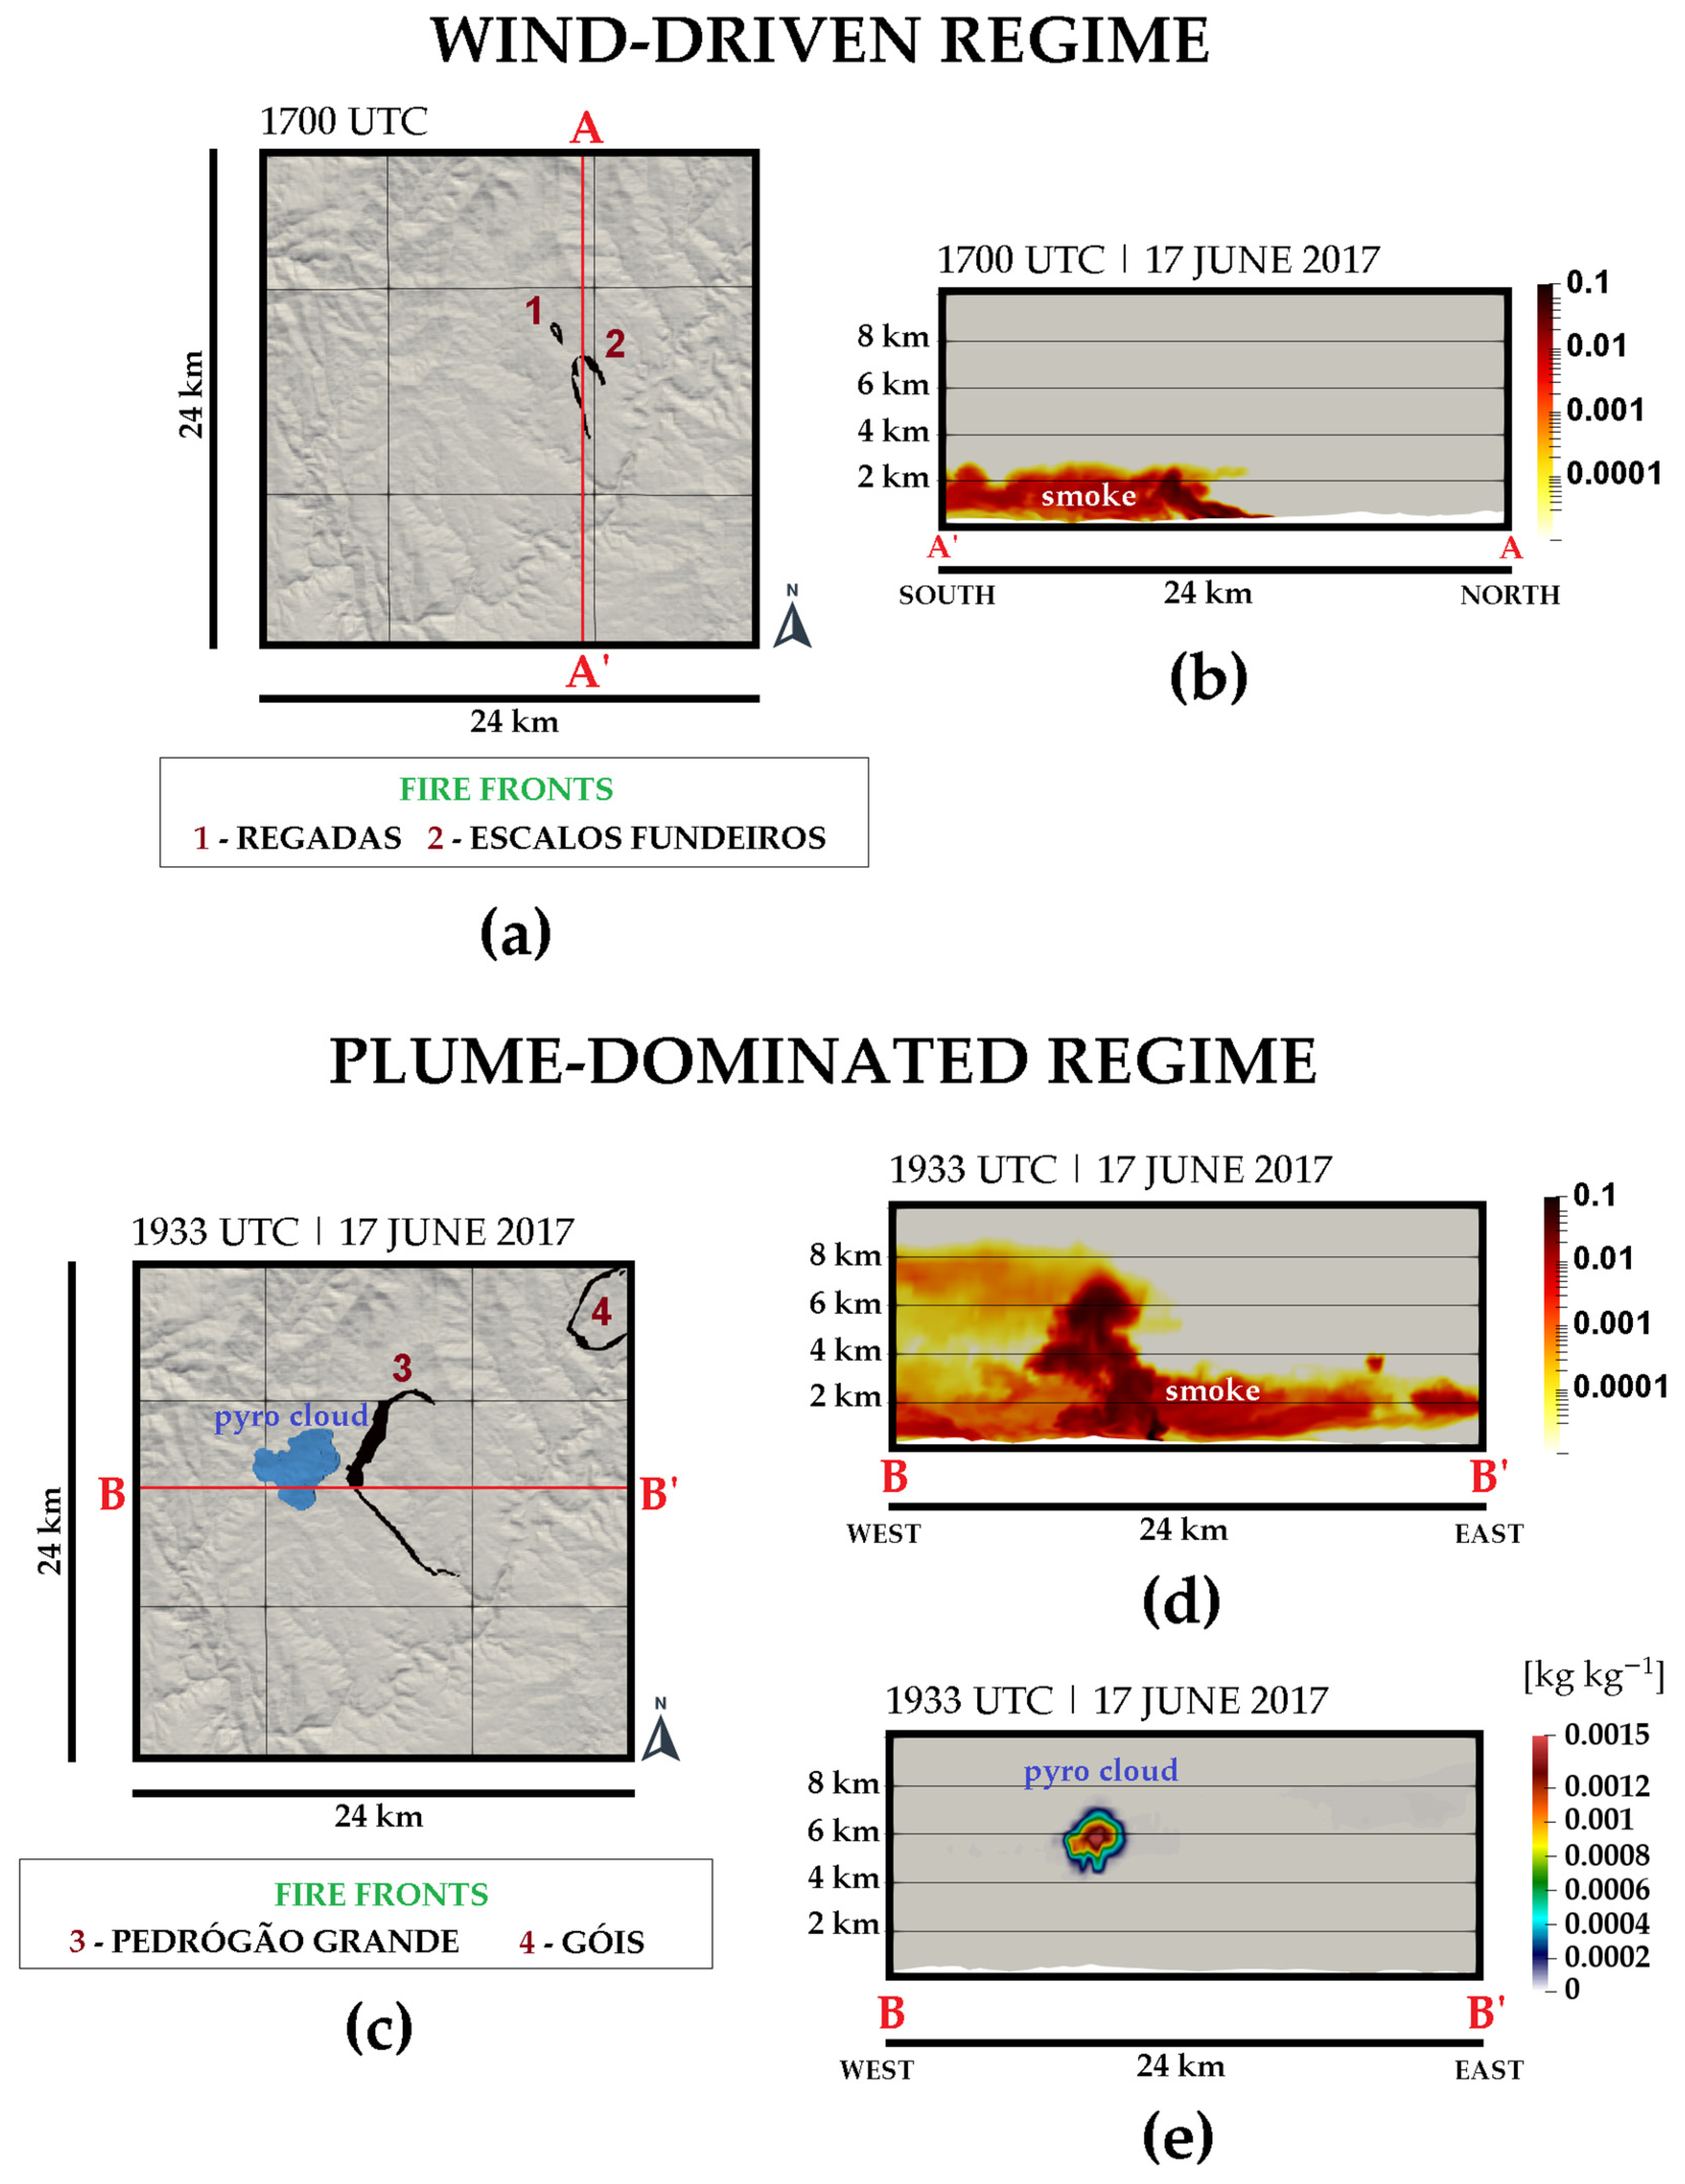
Figure 2 shows that the fire presented two distinct phases when considering the fire plume vertical structure. First, the fire fronts associated with the “Regadas” and “Escalos Fundeiros” ignitions propagated southwards (Figure 2a). The smoke plume was transported southward, more horizontally, and remained in the lower troposphere, not exceeding 2.5 km in altitude (vertical cross-section A–A’, Figure 2b). This initial phase of the fire development was characterized by a wind-driven regime and a lack of pyro-clouds, i.e., the period was marked by the absence of any concentration of hydrometeors in the smoke plume.
In the second phase, after 1900 UTC, the simulation shows the presence of clouds within the smoke plume, thus indicating a plume-dominated regime. Figure 2c shows that the fire fronts (1 and 2) indicated in Figure 2a had already merged to form a single front at 1933 UTC, which is designated as “Pedrógão Grande” (3). It is also possible to identify the “Góis” fire (4) northeast of Pedrógão, which was another wildfire ignited in the afternoon of 17 June 2017 which burned a total area of 17,521 ha [33]. At this moment, a region of liquid water content above 0.0001 kg kg−1 is simulated westward of the Pedrógão Grande fire front (blue shadow). The vertical cross-section B-B’ crossing this region is shown in Figure 2d,e. The plume-dominated regime is evident with the smoke plume extending above a 6 km altitude and giving rise to a cloud (Figure 2e). The pyro-cloud is represented here by the sum of the mixing ratios of cloud droplets and graupel.
3.2. Analysis of the Plume-Dominated Regime Period
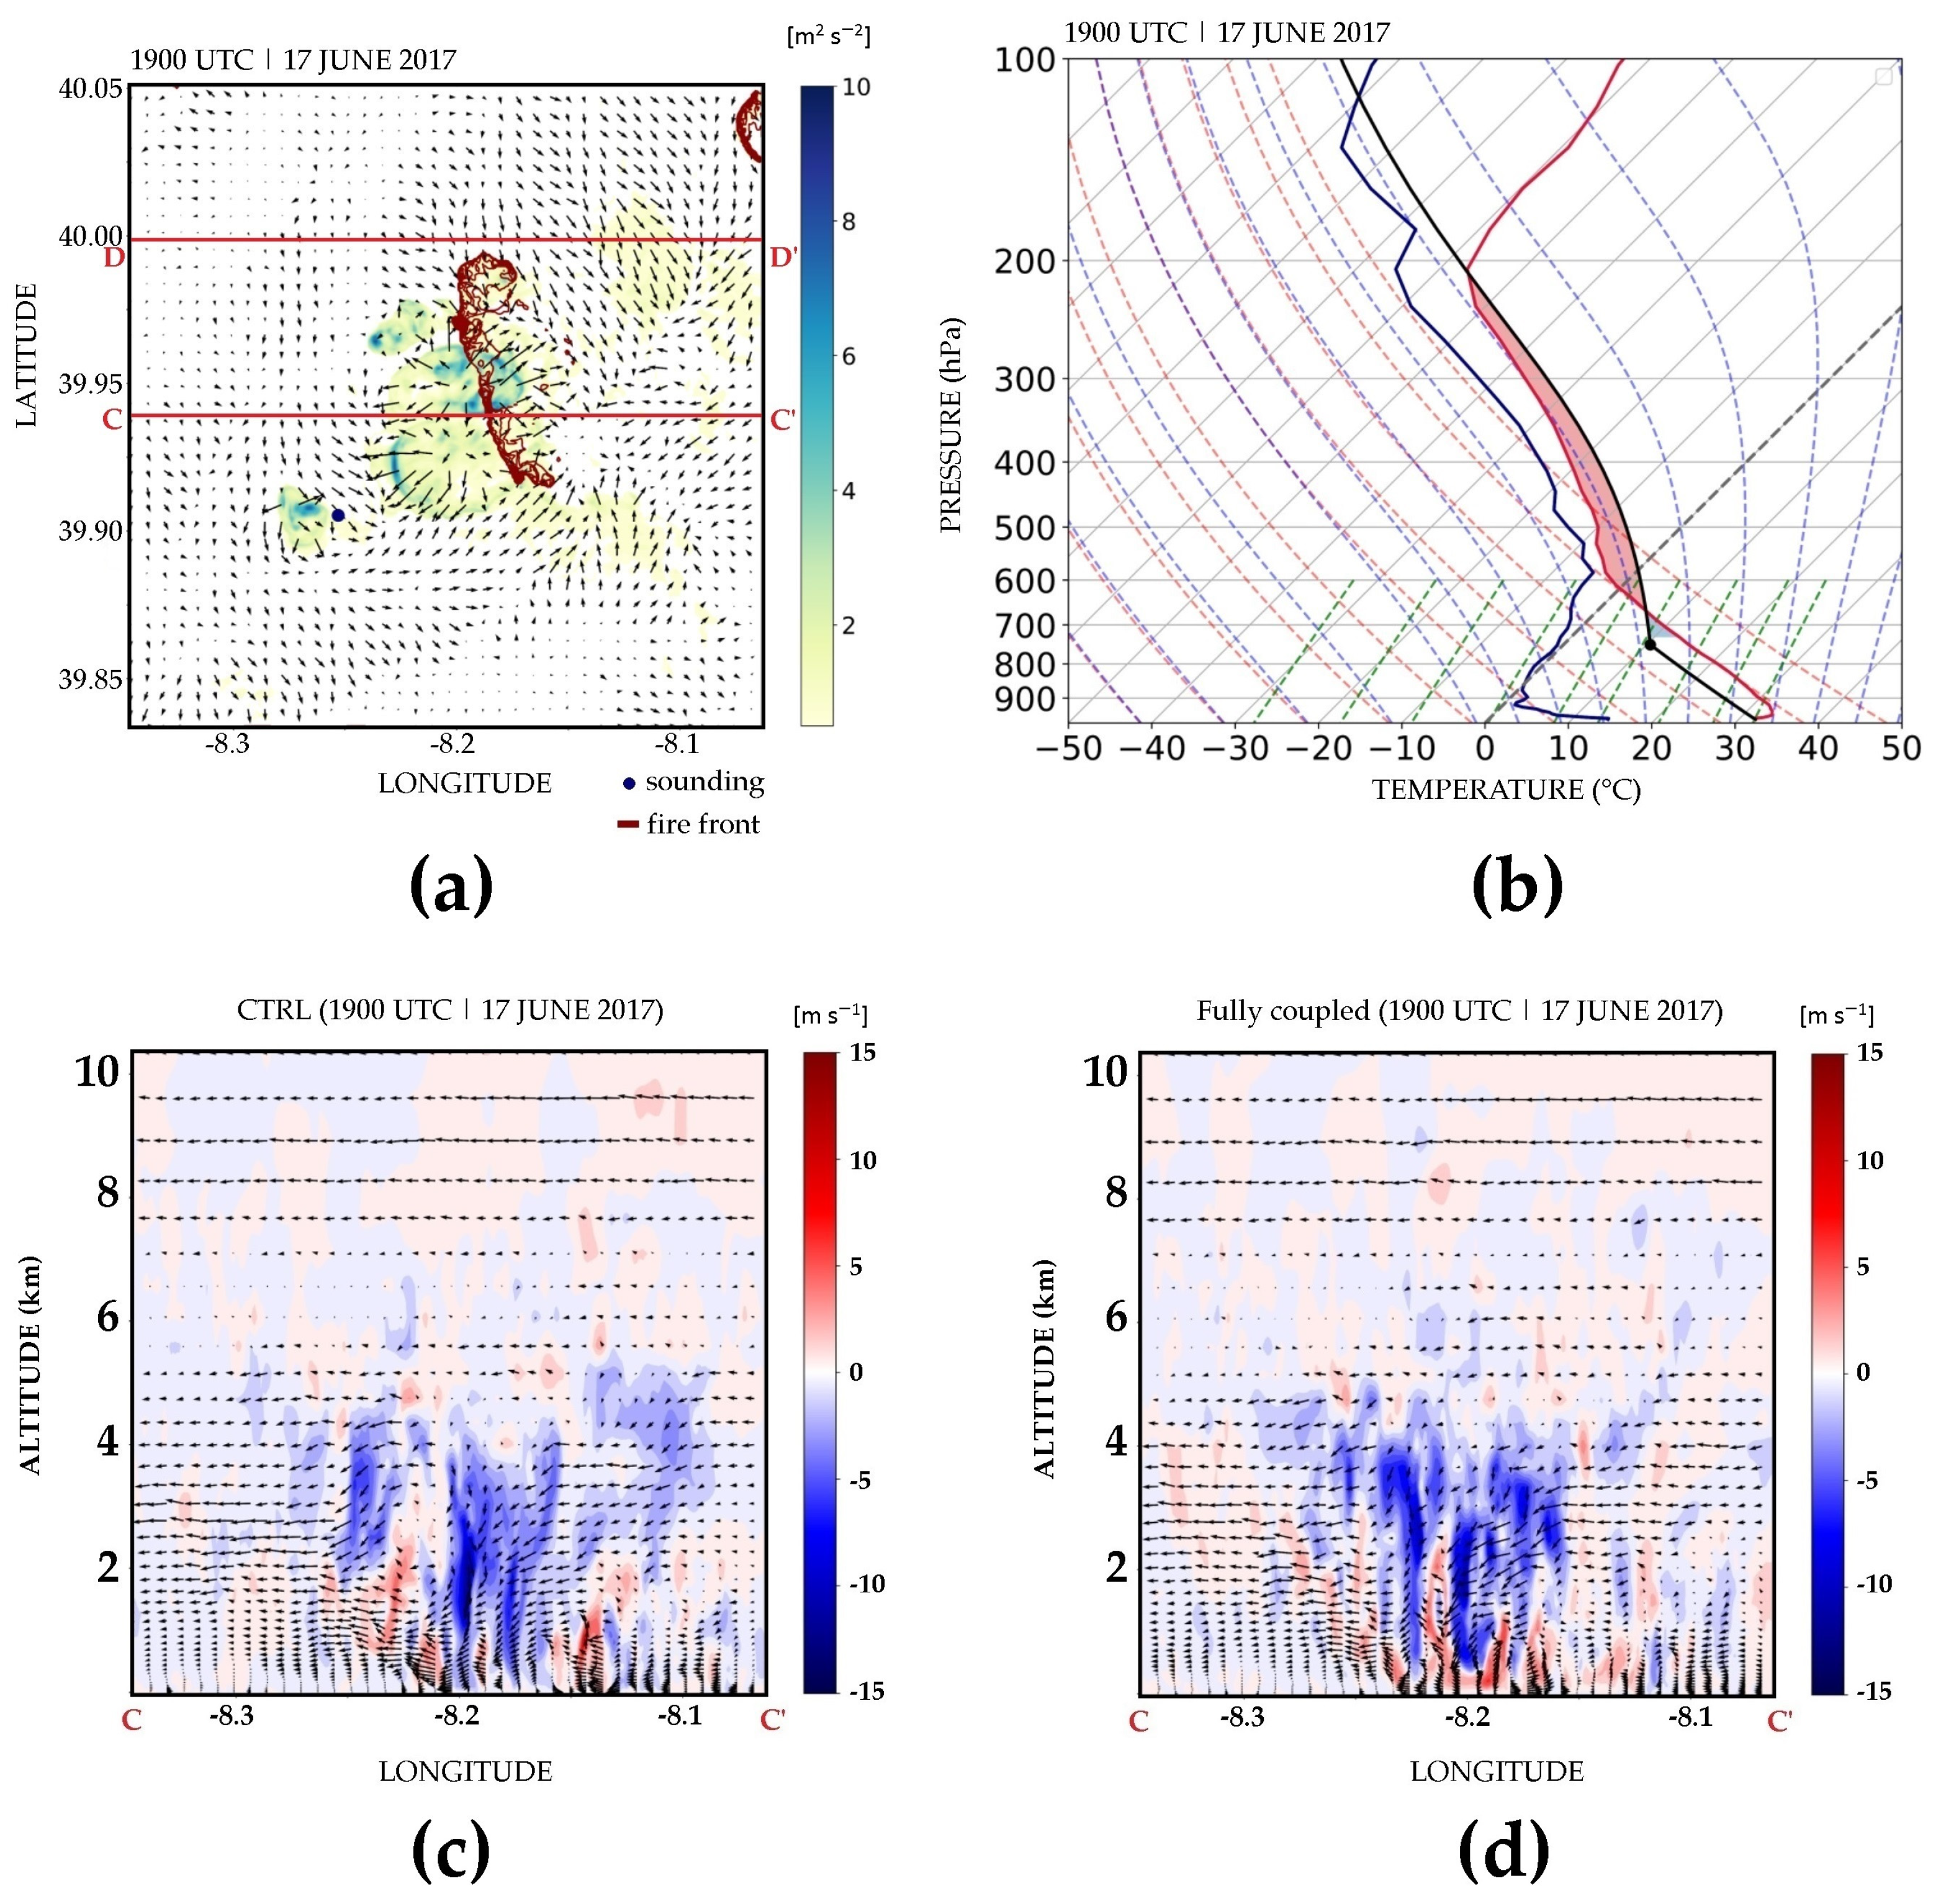
In order to understand the cause of the change in the fire regime and some aspects related to the pyro-convection phenomenon, the main features of the plume-dominated regime are presented in this subsection. Figure 3a shows the turbulent kinetic energy at the surface (m2 s−2) and the fire front at 1900 UTC, the moment that we consider as the beginning of this phase. An outflow at the surface with a downburst signature is identified over the fire front with radial winds and a turbulent kinetic energy (TKE) value of about 5 m2 s−2.
Figure 3b exhibits the vertical thermodynamic structure of the atmosphere at the point indicated in Figure 3a. At this instant, the sounding presents a Convective Available Potential Energy (CAPE) of 957.7 J Kg−1 and a Lifting Condensation Level (LCL) of 749.08 hPa. In addition, hot and dry air in the lower troposphere and a moist layer above characterize a dry thunderstorm environment.
To understand the origin of the outflow mentioned above (Figure 3a), Figure 3c,d show the vertical velocity fields from both simulations (CTRL and fully coupled). A downward motion from the middle levels of the troposphere and velocities above 10 m s−1 are identified in both experiments. Since the CTRL simulation does not consider the fire effects and also presents the downward motion, we conclude that the outflow at the surface (Figure 3a) had a meteorological origin.
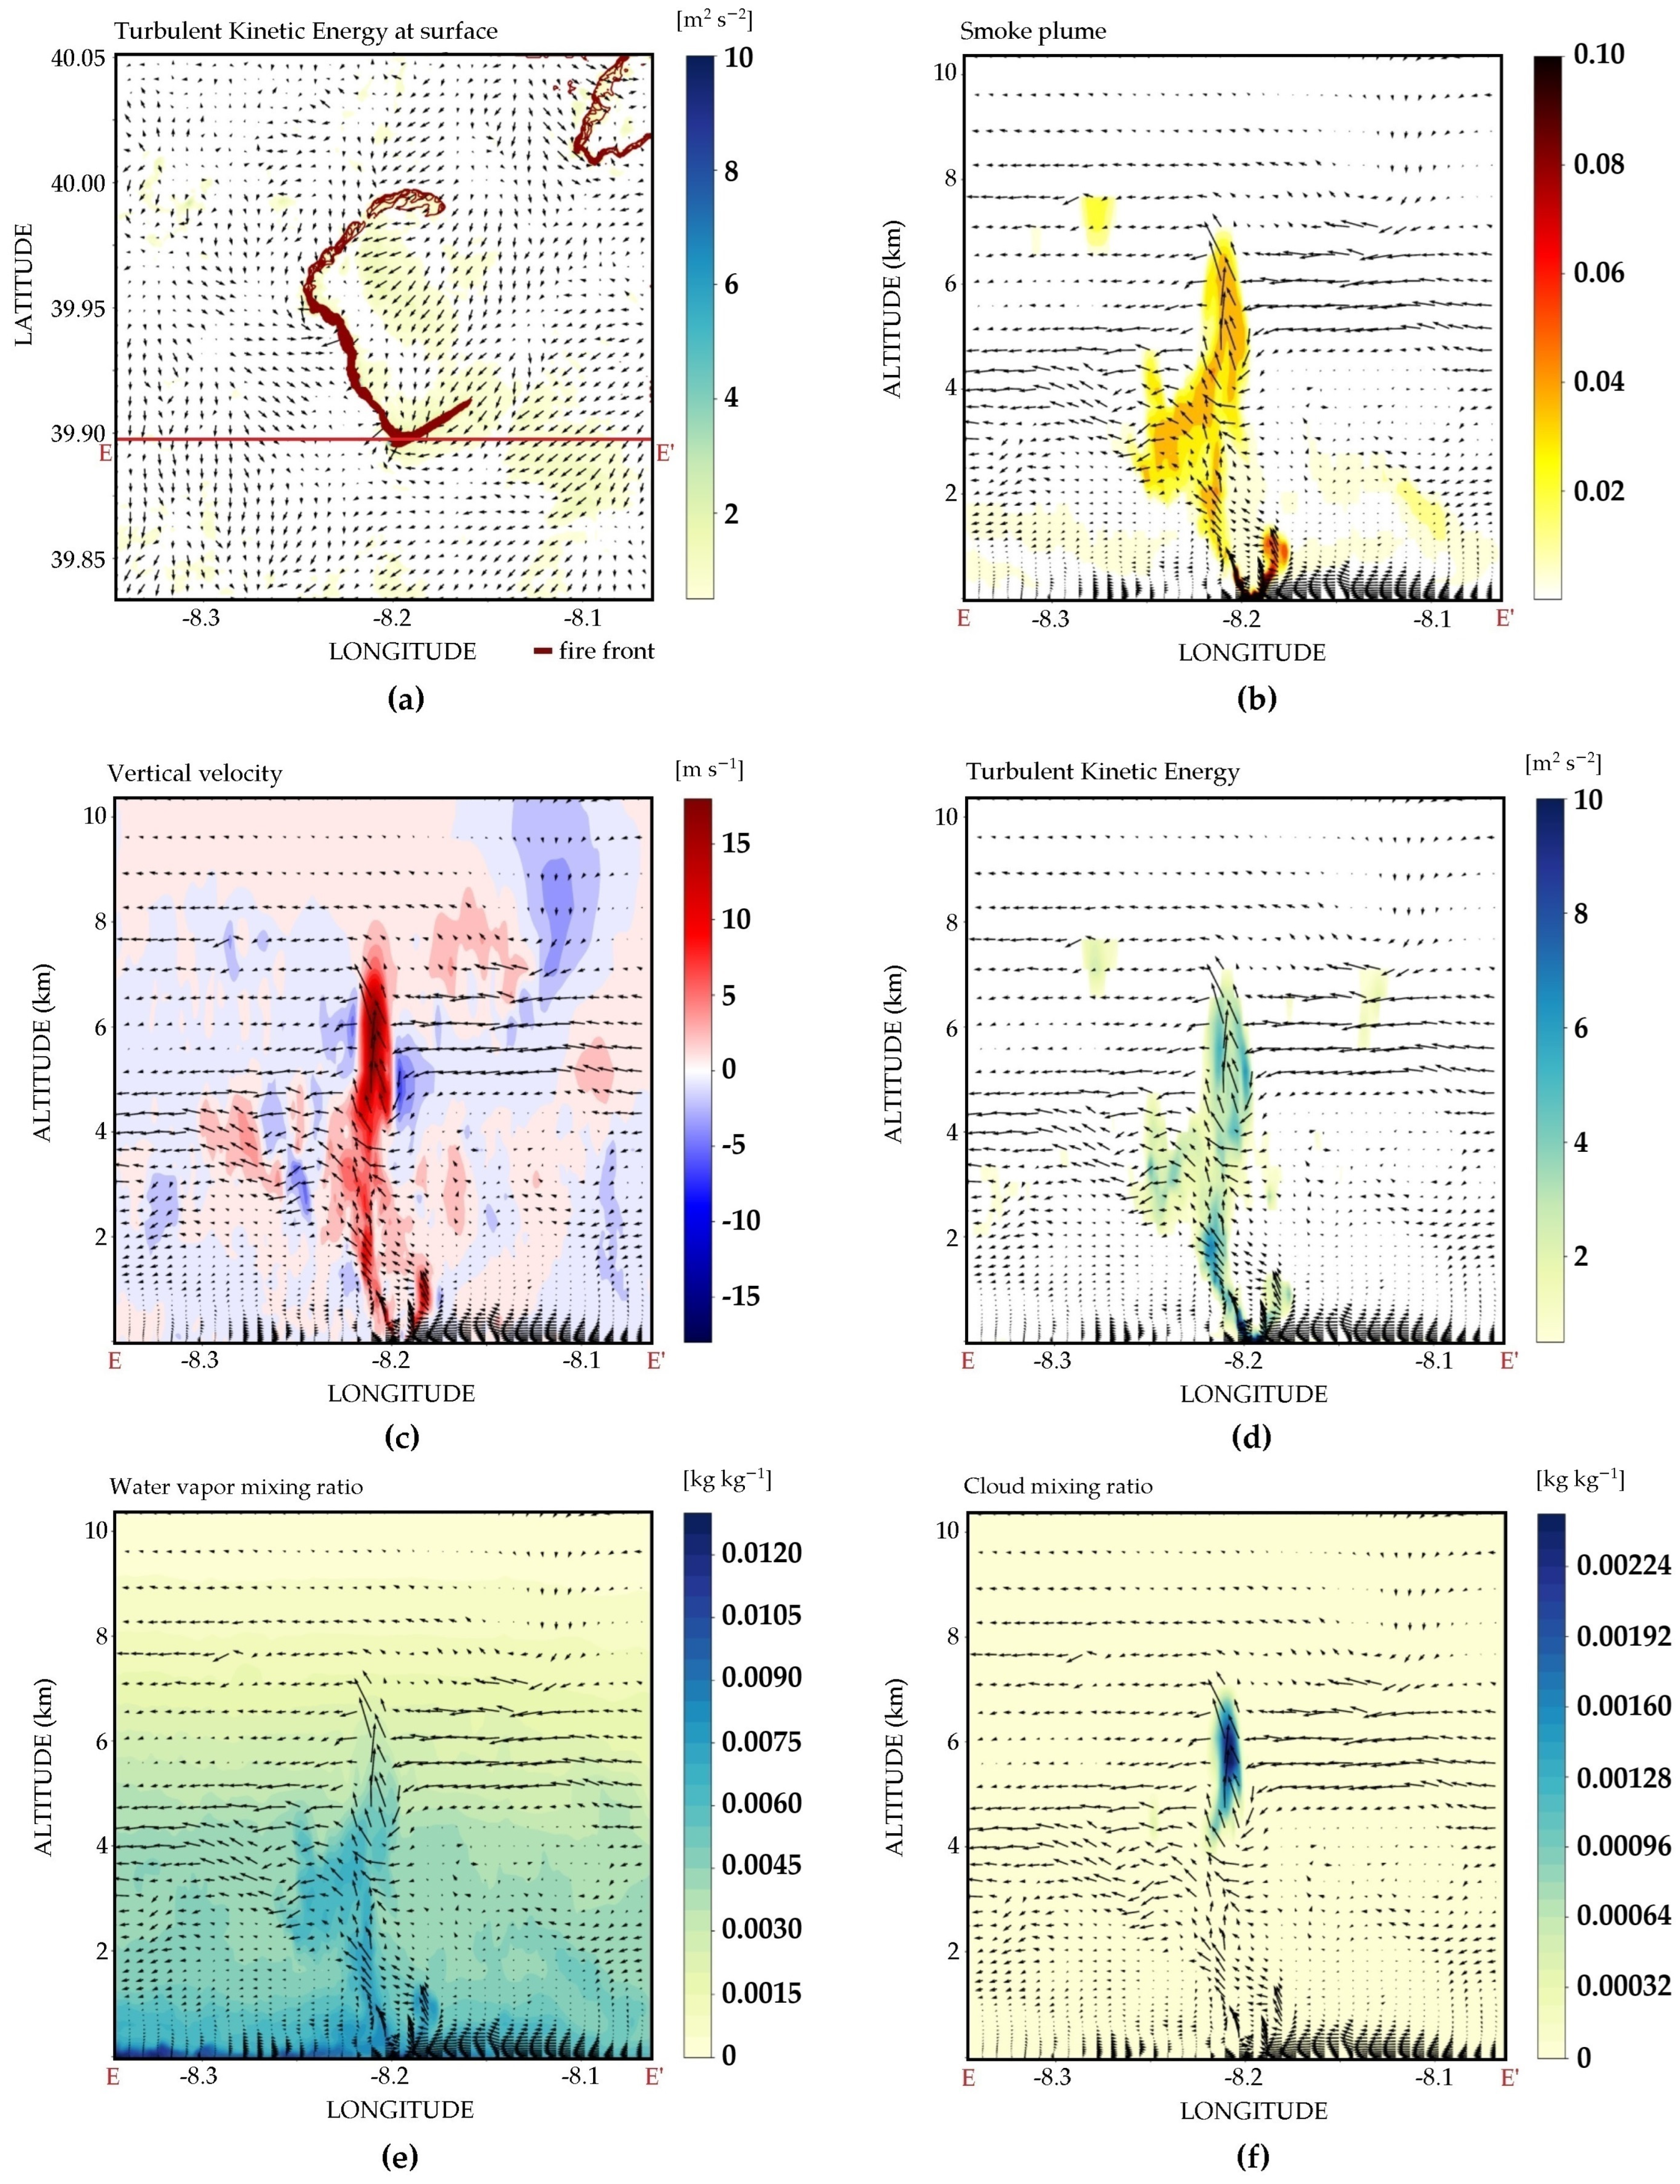
Note that the instant exhibited in Figure 2c–e to illustrate the plume-dominated regime was not the only time the smoke plume was simulated extending vertically and leading to the formation of clouds. Figure 4a displays the fire front position at 2000 UTC and the turbulent motion at the surface. In addition, Figure 4b–f display the main features associated with the fire activity from the vertical cross-section E-E′, namely the smoke plume structure (Figure 4b), vertical velocity (Figure 4c), turbulent motion (Figure 4d), and the mixing ratio for water vapor (Figure 4e) and cloud droplets (Figure 4f).
The fields are highly disturbed within the smoke plume, which extends vertically up to a 7 km altitude (Figure 4b). The vertical velocities around 10 m s−1 are simulated up to above the middle troposphere and maximum values around 15 m s−1 at a 6 km altitude (Figure 4c). The vertical ascending motion is also associated with a turbulent motion, which extends from the fire up to above a 7 km altitude with values of TKE around 6 m2s−2 (Figure 4d). The vertical and turbulent motion generated from the fire activity favor the vertical transport of water vapor (Figure 4e) and the formation of a cloud, i.e., a pyro-cloud (Figure 4f). Figure 4 allows us to realize that the ascending motions related to the intense fire activity can be reinforced by the potential instability released in the middle troposphere from microphysical processes during cloud development.
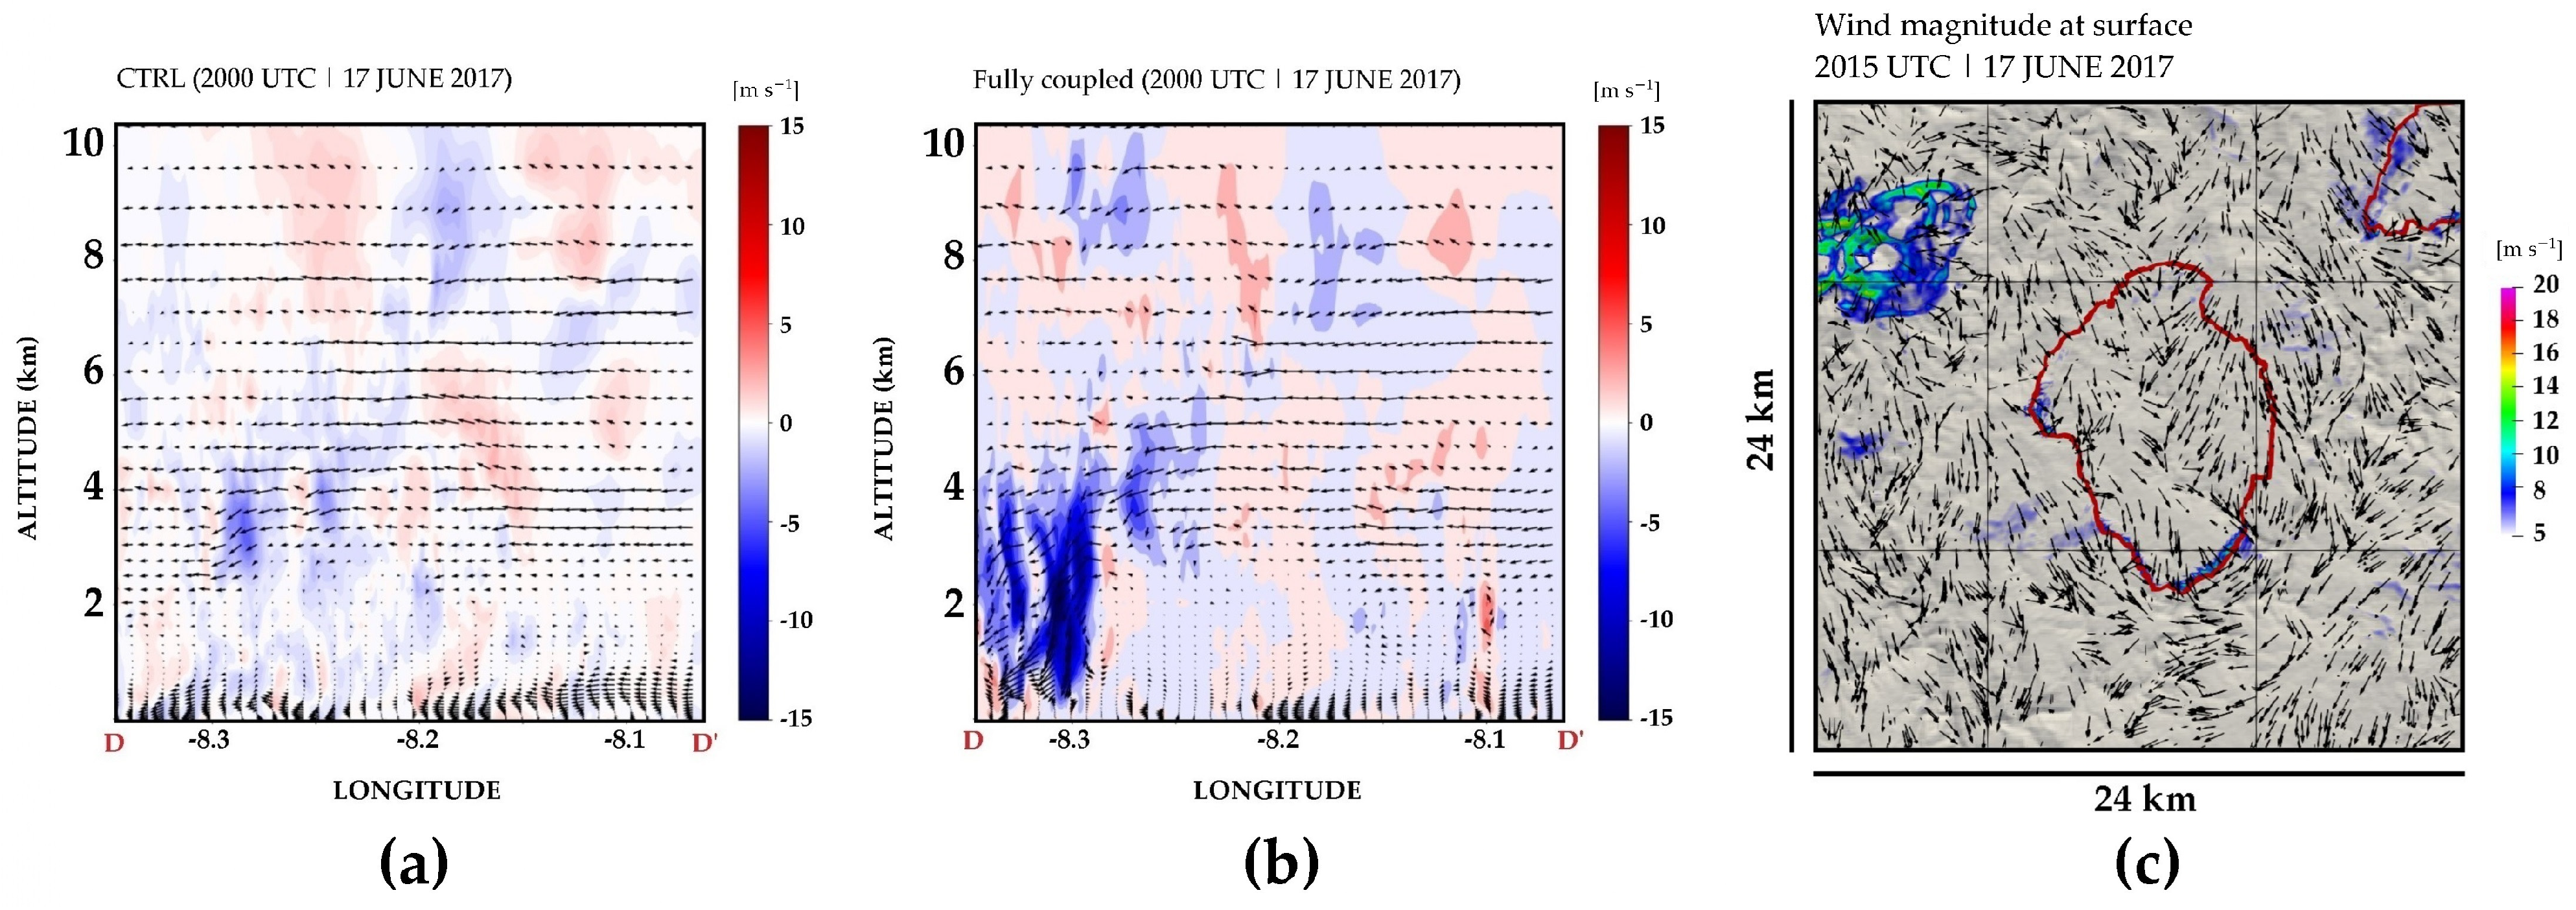
While intense pyro-convection is simulated in some points along the fire front, the beginning of another outflow is identified northwestward of the fire front at 2000 UTC (Figure 4a). In order to understand the origin of this outflow, Figure 5a,b show the D-D’ vertical cross-section of the vertical velocity field from both simulations (CTRL and fully coupled). This second outflow is observed only in the fully coupled simulation (Figure 5b), indicating its origin in the pyro-cloud that develops at 1933 UTC (Figure 2c) and clearly touches the ground at 2015 UTC (Figure 5c).
In the Pedrógão Grande mega fire event, these different smoke plume regimes were previously found from a fire to atmosphere simulation [28] and documented from observations [35]. In the present study, we found that the fully coupled simulation using the Meso-NH–ForeFire code is also able to represent the development of pyro-clouds when the fire propagation is computed and not imposed from observations, such as shown by the authors of [28]. However, the pyro-clouds simulated here are less deep than the pyroCb clouds simulated by Couto [28], which at their height reached a 10 km altitude. Regarding other studies about pyroCb modeling, for example, the ACCESS-Fire model produced pyroCb clouds in two extreme wildfire events in Australia. In the Waroona fire (January 2016), the coupled model produced a pyroCb cloud above the fire front, which extended to nearly a 15 km altitude [43]. In the Sir Ivan fire (February 2017), the simulations were able to generate deep moist convection extending up to a 12 km altitude [9]. Furthermore, the authors highlighted the sensitivity of deep moist convection to fuel load, and then to heat flux [9]. Concerning the fuel moisture content, it has a small influence on the formation of pyro-clouds, with atmospheric moisture availability being the main factor favoring the development of these clouds [44].
Besides showing that the fully coupled simulation can produce pyro-convection and associated phenomena, this communication brings a relevant result about the environmental conditions during the Pedrógão Grande mega fire, namely the possible factors that led to an intensification of pyro-convection activity and changes in the fire regime. Our simulation suggests that the main factor explaining the propagation of the fire front westward was the presence of a downburst, of meteorological origin, which formed at 1900 UTC and touched the ground exactly over the fire front. This convective outflow was also observed in the CTRL simulation. This situation was not identified in the previous simulation [28], which documented the approaching of a gusty front in the fire region, but not a downburst.
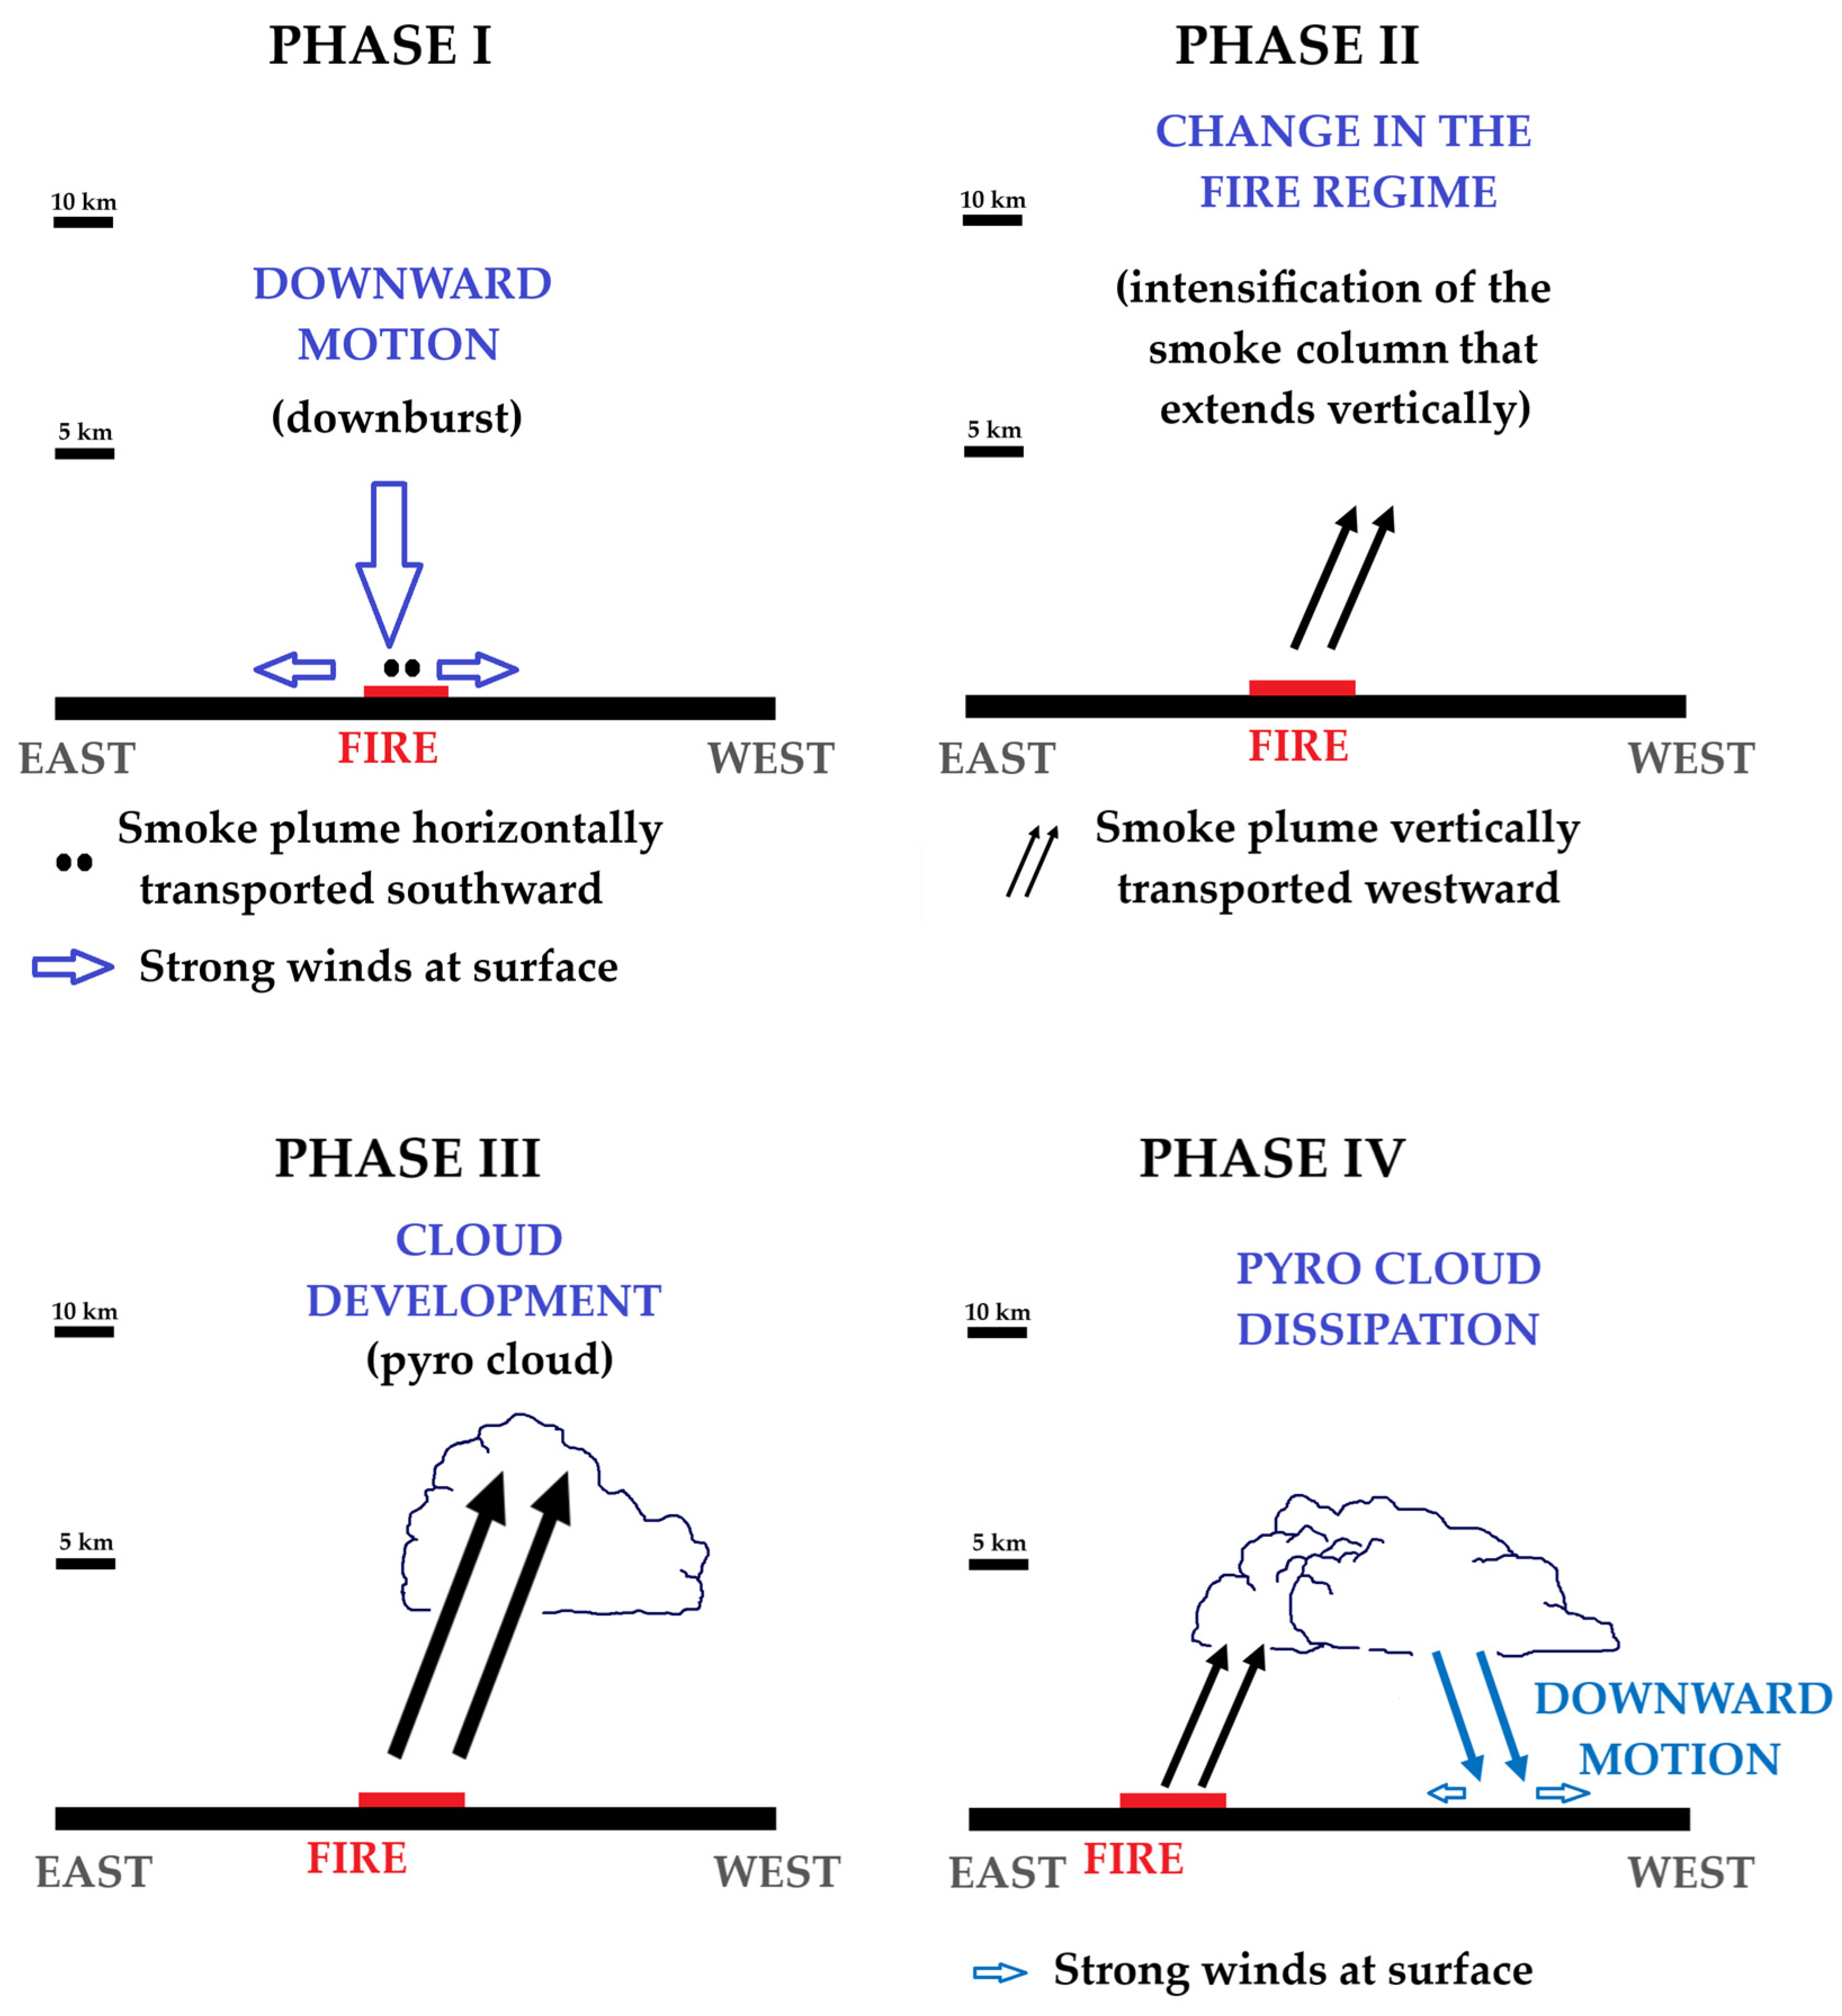
The main features explaining the fire regime which have been identified in this study are summarized in Figure 6. The first stage is characterized by the occurrence of a descending air motion which produced strong and turbulent winds at the surface and over the fire front (STAGE I), contributing to the convection. This led to the vertical development of the smoke plume (STAGE II), which favored the formation of pyro-clouds inside it (STAGE III). The final stage, when the pyro-cloud started to dissipate, is marked by an outflow that formed at middle levels from the pyro-cloud and produced strong winds at the surface as it touched the ground (STAGE IV). In the simulation, the four stages together took less than 1 h 30 min.
4. Concluding Remarks
In this study, we presented the results of a fully coupled fire–atmosphere simulation to investigate pyro-convection in the Pedrógão Grande wildfire.
Based on the results of the presented simulation, we conclude that the pyro-convection phenomenon was successfully represented by the Meso-NH–ForeFire coupled model, thus confirming that the coupling of cloud-resolving models to fire propagation ones is a powerful tool in the study of extreme wildfire dynamics.
In summary, the experiment helped us to characterize the fire regime on the basis of the smoke plume structure and to identify two different regimes: (1) a wind-driven regime, and (2) a plume-dominated regime. In the first one, the smoke plume was transported by the mesoscale environment southward, whereas in the second regime, it was directed westward. The simulation suggested that the change in fire regime was initiated by a meteorological convective outflow (downburst) that affected the main fire front. Also, this study showed a real case example, showing how an extreme wildfire may create its own meteorology, namely through the development of pyro-clouds and strong outflows from its dynamics.
While this study underscores the efficacy of fire–atmosphere coupled approaches in elucidating fire-induced meteorological phenomena, it also presents certain limitations, particularly in the context of fuel representation within the fire propagation model. Simplification through uniform fields of fuel load and moisture constrains our ability to infer microscale fire behavior accurately. Consequently, this study’s findings primarily focus on broader, macroscale interactions rather than detailed, microscale dynamics.
Despite these limitations, our investigation demonstrates the Meso-NH/ForeFire system’s capacity to initiate pyro-convection, highlighting the robustness of the numerical configurations employed for such phenomena. The analysis suggests that while the current model provides a solid foundation for understanding fire-induced atmospheric conditions, future enhancements in fuel parameterization are essential. This would involve leveraging high-resolution data, potentially from satellite imagery, to refine fuel distribution models, thereby allowing for more precise simulations of fire spread and its interaction with the landscape, including small-scale features like roads that significantly influence fire behavior.
In conclusion, the research validates the significant potential of coupled fire propagation-atmospheric models in advancing our comprehension of fire-induced meteorology. It suggests that further refinements in modeling, particularly in fuel representation, are vital for the operational application of these models. Such advancements could significantly contribute to predicting hazardous conditions during extreme wildfire events, thereby enhancing emergency evacuation management, firefighter safety, and fire suppression strategies.
Author Contributions
Conceptualization, F.T.C. and J.-B.F.; methodology, F.T.C., J.-B.F. and R.B.; software, J.-B.F.; validation, F.T.C., J.-B.F., R.B. and C.C.; formal analysis, F.T.C., C.C., J.-B.F., R.B. and R.S.; investigation, F.T.C. and J.-B.F.; resources, J.-B.F.; data curation, J.-B.F. and R.B.; writing—original draft preparation, F.T.C.; writing—review and editing, J.-B.F., R.B., C.C. and R.S.; visualization, F.T.C., J.-B.F. and C.C.; supervision, F.T.C. and J.-B.F.; project administration, F.T.C. and R.S.; funding acquisition, F.T.C., R.S. and J.-B.F. All authors have read and agreed to the published version of the manuscript.
Funding
This research was funded by national funds through the FCT—Foundation for Science and Technology, I.P. under the PyroC.pt project (Refs. PCIF/MPG/0175/2019), ICT project (Refs. UIDB/04683/2020 and UIDP/04683/2020) and also by the European Union through the European Regional Development Fund in the framework of the Interreg V A Spain—Portugal program (POCTEP) through the CILIFO project (Ref.: 0753-CILIFO-5-E) and the FIREPOCTEP+ (0139_FIREPOCTEP_MAS_6_E), RH.VITA (ALT20-05-3559-FSE-000074), and H2020 FIRE-RES projects (GA: 101037419).
Institutional Review Board Statement
Not applicable.
Informed Consent Statement
Not applicable.
Data Availability Statement
The raw data supporting the conclusions of this article will be made available by the authors on request.
Acknowledgments
The authors are grateful to the European Centre for Medium-Range Weather Forecasts (ECMWF) for the provided meteorological analysis and the supercomputing center of the University of Corsica under grant PIA UNITI ANR-22-EXES-0016 for their support on the coupled simulation computation.
Conflicts of Interest
The authors declare no conflicts of interest.
References
- Bowman, D.M.J.S.; Kolden, C.A.; Abatzoglou, J.T.; Johnston, F.H.; van der Werf, G.R.; Flannigan, M. Vegetation fires in the Anthropocene. Nat. Rev. Earth Environ. 2020, 1, 500–515. [Google Scholar] [CrossRef]
- Fischer, R. The Long-Term Consequences of Forest Fires on the Carbon Fluxes of a Tropical Forest in Africa. Appl. Sci. 2021, 11, 4696. [Google Scholar] [CrossRef]
- Ponomarev, E.I.; Kharuk, V.I.; Ranson, K.J. Wildfires Dynamics in Siberian Larch Forests. Forests 2016, 7, 125. [Google Scholar] [CrossRef]
- Kharuk, V.I.; Dvinskaya, M.L.; Im, S.T.; Golyukov, A.S.; Smith, K.T. Wildfires in the Siberian Arctic. Fire 2022, 5, 106. [Google Scholar] [CrossRef]
- Linley, G.D.; Jolly, C.J.; Doherty, T.S.; Geary, W.L.; Armenteras, D.; Belcher, C.M.; Bliege Bird, R.; Duane, A.; Fletcher, M.-S.; Giorgis, M.A.; et al. What do you mean, ‘megafire’? Glob. Ecol. Biogeogr. 2022, 31, 1906–1922. [Google Scholar] [CrossRef]
- Tedim, F.; Leone, V.; McGee, T.K. Extreme Wildfire Events and Disasters. Root Causes and New Management Strategies; Elsevier: Amsterdam, The Netherlands, 2020. [Google Scholar] [CrossRef]
- Fromm, M.; Servranckx, R.; Stocks, B.J.; Peterson, D.A. Understanding the critical elements of the pyrocumulonimbus storm sparked by high-intensity wildland fire. Commun. Earth Environ. 2022, 3, 243. [Google Scholar] [CrossRef]
- Castellnou, M.; Bachfischer, M.; Miralles, M.; Ruiz, B.; Stoof, C.R.; Vilà-Guerau de Arellano, J. Pyroconvection classification based on atmospheric vertical profiling correlation with extreme fire spread observations. J. Geophys. Res. Atmos. 2022, 127, e2022JD036920. [Google Scholar] [CrossRef]
- Peace, M.; Ye, H.; Greenslade, J.; Kepert, J.D. The Destructive Sir Ivan Fire in New South Wales, Australia; Simulations Using a Coupled Fire—Atmosphere Model. Fire 2023, 6, 438. [Google Scholar] [CrossRef]
- Kartsios, S.; Karacostas, T.; Pytharoulis, I.; Dimitrakopoulos, A.P. Numerical investigation of atmosphere-fire interactions during high-impact wildland fire events in Greece. Atmos. Res. 2020, 247, 105253. [Google Scholar] [CrossRef]
- Couto, F.T.; Salgado, R.; Guiomar, N. Forest Fires in Madeira Island and the Fire Weather Created by Orographic Effects. Atmosphere 2021, 12, 827. [Google Scholar] [CrossRef]
- Couto, F.T.; Santos, F.L.M.; Campos, C.; Andrade, N.; Purificação, C.; Salgado, R. Is Portugal Starting to Burn All Year Long? The Transboundary Fire in January 2022. Atmosphere 2022, 13, 1677. [Google Scholar] [CrossRef]
- Tomašević, I.C.; Cheung, K.K.W.; Vučetić, V.; Fox-Hughes, P.; Horvath, K.; Telišman Prtenjak, M.; Beggs, P.J.; Malečić, B.; Milić, V. The 2017 Split wildfire in Croatia: Evolution and the role of meteorological conditions. Nat. Hazards Earth Syst. Sci. 2022, 22, 3143–3165. [Google Scholar] [CrossRef]
- Coen, J. Some Requirements for Simulating Wildland Fire Behavior Using Insight from Coupled Weather—Wildland Fire Models. Fire 2018, 1, 6. [Google Scholar] [CrossRef]
- Mohammadian Bishe, E.; Afshin, H.; Farhanieh, B. Modified Quasi-Physical Grassland Fire Spread Model: Sensitivity Analysis. Sustainability 2023, 15, 13639. [Google Scholar] [CrossRef]
- Bakhshaii, A.; Johnson, E. A review of a new generation of wildfire−atmosphere modeling. Can. J. For. Res. 2019, 49, 565–574. [Google Scholar] [CrossRef]
- Mandel, J.; Beezley, J.D.; Kochanski, A.K. Coupled atmosphere-wildland fire modeling with WRF 3.3 and SFIRE 2011. Geosci. Model Dev. 2011, 4, 591–610. [Google Scholar] [CrossRef]
- Benik, J.T.; Farguell, A.; Mirocha, J.D.; Clements, C.B.; Kochanski, A.K. Analysis of Fire-Induced Circulations during the FireFlux2 Experiment. Fire 2023, 6, 332. [Google Scholar] [CrossRef]
- Coen, J.L.; Cameron, M.; Michalakes, J.; Patton, E.G.; Riggan, P.J.; Yedinak, K.M. WRF-Fire: Coupled Weather–Wildland Fire Modeling with the Weather Research and Forecasting Model. J. Appl. Meteorol. Climatol. 2013, 52, 16–38. [Google Scholar] [CrossRef]
- Wang, Y.; Shi, L.; Shi, Z.; Yao, Q.; Wang, Z.; Zhong, L. Assessing the Fire-Modified Meteorology of the Grassland and Forest Intersection Zone in Mongolia Using the WRF-Fire Model. Fire 2023, 6, 443. [Google Scholar] [CrossRef]
- Mandel, J.; Amram, S.; Beezley, J.D.; Kelman, G.; Kochanski, A.K.; Kondratenko, V.Y.; Lynn, B.H.; Regev, B.; Vejmelka, M. Recent advances and applications of WRF–SFIRE. Nat. Hazards Earth Syst. Sci. 2014, 14, 2829–2845. [Google Scholar] [CrossRef]
- Coen, J.L.; Schroeder, W. The High Park fire: Coupled weather-wildland fire model simulation of a windstorm-driven wildfire in Colorado’s Front Range. J. Geophys. Res. Atmos. 2015, 120, 131–146. [Google Scholar] [CrossRef]
- Kochanski, A.K.; Jenkins, M.A.; Mandel, J.; Beezley, J.D.; Krueger, S.K. Real time simulation of 2007 Santa Ana fires. For. Ecol. Manag. 2013, 294, 136–149. [Google Scholar] [CrossRef]
- Filippi, J.; Bosseur, F.; Pialat, X.; Santoni, P.; Strada, S.; Mari, C. Simulation of Coupled Fire/Atmosphere Interaction with the MesoNH-ForeFire Models. J. Combust. 2011, 2011, 540390. [Google Scholar] [CrossRef]
- Filippi, J.-B.; Bosseur, F.; Mari, C.; Lac, C. Simulation of a Large Wildfire in a Coupled Fire-Atmosphere Model. Atmosphere 2018, 9, 218. [Google Scholar] [CrossRef]
- Baggio, R.; Filippi, J.B.; Truchot, B.; Couto, F.T. Local to continental scale coupled fire-atmosphere simulation of large industrial fire plume. Fire Saf. J. 2022, 134, 103699. [Google Scholar] [CrossRef]
- Campos, C.; Couto, F.T.; Filippi, J.-B.; Baggio, R.; Salgado, R. Modelling pyro-convection phenomenon during a mega-fire event in Portugal. Atmos. Res. 2023, 290, 106776. [Google Scholar] [CrossRef]
- Couto, F.T.; Filippi, J.-B.; Baggio, R.; Campos, C.; Salgado, R. Numerical investigation of the Pedrógão Grande pyrocumulonimbus using a fire to atmosphere coupled model. Atmos. Res. 2024, 299, 107223. [Google Scholar] [CrossRef]
- Lac, C.; Chaboureau, J.-P.; Masson, V.; Pinty, J.-P.; Tulet, P.; Escobar, J.; Leriche, M.; Barthe, C.; Aouizerats, B.; Augros, C.; et al. Overview of the Meso-NH model version 5.4 and its applications. Geosci. Model Dev. 2018, 11, 1929–1969. [Google Scholar] [CrossRef]
- Filippi, J.-B.; Bosseur, F.; Mari, C.; Lac, C.; Le Moigne, P.; Cuenot, B.; Veynante, D.; Cariolle, D.; Balbi, J.-H. Coupled atmosphere–wildland fire modelling. J. Adv. Model. Earth Syst. 2009, 2, 11. [Google Scholar] [CrossRef]
- ICNF, 2017. Relatório Provisório de incêNdios Florestais. 2017. Available online: https://www.icnf.pt/api/file/doc/2c45facee8d3e4f8 (accessed on 9 March 2024).
- CTI Report, 2018. Avaliação dos Incêndios Ocorridos entre 14 e 16 de Outubro de 2017 em Portugal Continental. Relatório Final da Comissão téCnica Independente. Available online: https://www.portugal.gov.pt/pt/gc21/comunicacao/documento?i=avaliacao-dos-incendios-ocorridos-entre-14-e-16-de-outubro-de-2017-em-portugal-continental (accessed on 7 March 2024).
- CTI Report, 2017. In Análise e Apuramento dos Factos Relativos aos Incêndios que Ocorreram em Pedrógão Grande, Castanheira de Pera, Ansião, Alvaiázere, Figueiró dos Vinhos, Arganil, Góis, Penela, Pampilhosa da Serra, Oleiros e Sertã, entre 17 e 24 de Junho de 2017; Comissão Técnica Independente (CTI), Assembleia da República: Lisboa, Portugal, 2017; p. 296.
- Couto, F.T.; Iakunin, M.; Salgado, R.; Pinto, P.; Viegas, T.; Pinty, J.-P. Lightning modelling for the research of forest fire ignition in Portugal. Atmos. Res. 2020, 242, 104993. [Google Scholar] [CrossRef]
- Pinto, P.; Silva, Á.P.; Viegas, D.X.; Almeida, M.; Raposo, J.; Ribeiro, L.M. Influence of Convectively Driven Flows in the Course of a Large Fire in Portugal: The Case of Pedrógão Grande. Atmosphere 2022, 13, 414. [Google Scholar] [CrossRef]
- Cuxart, J.; Bougeault, P.; Redelsperger, J.L. A turbulence scheme allowing for mesoscale and large-eddy simulations. Q. J. R. Meteorol. Soc. 2000, 126, 1–30. [Google Scholar] [CrossRef]
- Pinty, J.-P.; Jabouille, P. A mixed-phase cloud parameterization for use in mesoscale non-hydrostatic model: Simulations of a squall line and of orographic precipitations. In Proceedings of the Conference on Cloud Physics, Everett, WA, USA, 17–21 August 1998; American Meteorological Society: Boston, MA, USA, 1999; pp. 217–220. [Google Scholar]
- Mlawer, E.J.; Taubman, S.J.; Brown, P.D.; Iacono, M.J.; Clough, S.A. Radiative transfer for inhomogeneous atmospheres: RRTM, a validated correlated-k model for the longwave. J. Geophys. Res. 1997, 102, 16663–16682. [Google Scholar] [CrossRef]
- Masson, V.; Le Moigne, P.; Martin, E.; Faroux, S.; Alias, A.; Alkama, R.; Belamari, S.; Barbu, A.; Boone, A.; Bouyssel, F.; et al. The SURFEXv7.2 land and ocean surface platform for coupled or offline simulation of earth surface variables and fluxes. Geosci. Model Dev. 2013, 6, 929–960. [Google Scholar] [CrossRef]
- Rothermel, R.C. A Mathematical Model for Predicting Fire Spread in Wildland Fuels; Intermountain Forest & Range Experiment Station, Forest Service, US Department of Agriculture: Ogden, UT, USA, 1972; Volume 115.
- Anderson, H.E. Aids to Determining Fuel Models for Estimating fire Behaviour; General Technical Report INT-122; U.S. Department of Agriculture, Forest Service, Intermountain Forest and Range Experiment Station: Ogden, UT, USA, 1982.
- May, R.M.; Goebbert, K.H.; Thielen, J.E.; Leeman, J.R.; Camron, M.D.; Bruick, Z.; Bruning, E.C.; Manser, R.P.; Arms, S.C.; Marsh, P.T. MetPy: A Meteorological Python Library for Data Analysis and Visualization. Bull. Am. Meteorol. Soc. 2022, 103, E2273–E2284. [Google Scholar] [CrossRef]
- Peace, M.; Greenslade, J.; Ye, H.; Kepert, J.D. Simulations of the Waroona fire using the coupled atmosphere-fire model ACCESS-Fire. J. South. Hemisph. Earth Syst. Sci. 2022, 72, 126–138. [Google Scholar] [CrossRef]
- Eghdami, M.; Juliano, T.W.; Jiménez, P.A.; Kosovic, B.; Castellnou, M.; Kumar, R.; Vila-Guerau de Arellano, J. Characterizing the role of moisture and smoke on the 2021 Santa Coloma de Queralt pyroconvective event using WRF-fire. J. Adv. Model. Earth Syst. 2023, 15, e2022MS003288. [Google Scholar] [CrossRef]
Figure 1.
Numerical experiment: (a) the outer domain at a 2 km resolution (D1) and the inner domains at 400 m and 80 m resolutions, D2 and D3, respectively; (b) Numerical experiment timeline. The orography is obtained from the SRTM database.
Figure 1.
Numerical experiment: (a) the outer domain at a 2 km resolution (D1) and the inner domains at 400 m and 80 m resolutions, D2 and D3, respectively; (b) Numerical experiment timeline. The orography is obtained from the SRTM database.

Figure 2.
The fire regime on 17 June 2017: wind-driven regime (a) the fire fronts at 1700 UTC are illustrated through the smoke tracer concentration variable (S). The red line represents the cross-section (A–A’) location. (b) The vertical cross-section of the smoke tracer concentration variable (S) at 1700 UTC. The plume-dominated regime: (c) the fire fronts at 1933 UTC are illustrated through the smoke tracer concentration variable (S) and the figure shows the development of a pyro-cloud from the liquid water content, i.e., cloud droplets (blue areas). The red line represents the cross-section (B–B’) location; (d) as (b), but at 1933 UTC; (e) a pyro-cloud (kg kg−1) formed inside the the smoke plume displayed in Figure (d). The pyro-cloud is represented by the sum of the mixing ratios of cloud droplets and graupel.

Figure 3.
Atmospheric conditions on 17 June 2017 at 1900 UTC: (a) Turbulent kinetic energy (m2 s−2) at surface (colored areas) and wind direction (arrows). (b) Thermodynamic diagram simulated with 80 m horizontal resolution near Pedrógão Grande and plotted using the MetPy package [42], dew point temperature (blue line), air temperature (red line), parcel profile (black line), 0 °C isotherm (grey dashed), LCL (black point), CAPE (red area).; vertical velocity (m s−1) along vertical cross-section C–C’ indicated in (a) for (c) CTRL simulation, and (d) fully coupled simulation.

Figure 4.
The main features of the plume-dominated regime on 17 June 2017 at 2000 UTC: (a) the turbulence kinetic energy (m2 s−2) and wind direction at the surface (m s−1). The fire front is represented by the dark red contour and the red line represents the E–E’ cross-section location. Vertical cross-section E–E’ showing: (b) the smoke tracer concentration variable (S) and wind vectors (arrows), (c) the vertical velocity (m s−1) and wind vectors (arrows); (d) the turbulent kinetic energy (m2 s−2) and wind vectors (arrows); (e) the water vapor mixing ratio (kg kg−1) and wind vectors (arrows); and (f) the cloud mixing ratio (kg kg−1) and wind vectors (arrows).

Figure 5.
(a,b) show the D–D’ vertical cross-section indicated in Figure 3a with vertical velocity (m s−1) at 2000 UTC in the CTRL and fully coupled simulations, respectively; (c) the wind field at the surface (colored areas for wind magnitude and arrows for wind direction) and the burned area (red contour) on 17 June 2017 at 2015 UTC.

Figure 6.
A schematic diagram showing the stages of development of the plume-dominated regime as seen from the fully coupled simulation at an 80 m horizontal resolution.
Figure 6.
A schematic diagram showing the stages of development of the plume-dominated regime as seen from the fully coupled simulation at an 80 m horizontal resolution.

Disclaimer/Publisher’s Note: The statements, opinions and data contained in all publications are solely those of the individual author(s) and contributor(s) and not of MDPI and/or the editor(s). MDPI and/or the editor(s) disclaim responsibility for any injury to people or property resulting from any ideas, methods, instructions or products referred to in the content. |
© 2024 by the authors. Licensee MDPI, Basel, Switzerland. This article is an open access article distributed under the terms and conditions of the Creative Commons Attribution (CC BY) license (https://creativecommons.org/licenses/by/4.0/).
Share and Cite
MDPI and ACS Style
Couto, F.T.; Filippi, J.-B.; Baggio, R.; Campos, C.; Salgado, R. Triggering Pyro-Convection in a High-Resolution Coupled Fire–Atmosphere Simulation. Fire 2024, 7, 92. https://0-doi-org.brum.beds.ac.uk/10.3390/fire7030092
AMA Style
Couto FT, Filippi J-B, Baggio R, Campos C, Salgado R. Triggering Pyro-Convection in a High-Resolution Coupled Fire–Atmosphere Simulation. Fire. 2024; 7(3):92. https://0-doi-org.brum.beds.ac.uk/10.3390/fire7030092
Chicago/Turabian StyleCouto, Flavio Tiago, Jean-Baptiste Filippi, Roberta Baggio, Cátia Campos, and Rui Salgado. 2024. "Triggering Pyro-Convection in a High-Resolution Coupled Fire–Atmosphere Simulation" Fire 7, no. 3: 92. https://0-doi-org.brum.beds.ac.uk/10.3390/fire7030092