
Upgrading Carthamus by HTC: Improvement of Combustion Properties


Department of Applied Physics, School of Industrial Engineering, University of Extremadura, Av. de Elvas. s/n, 06006 Badajoz, Spain
*
Author to whom correspondence should be addressed.
Fire 2024, 7(4), 106; https://0-doi-org.brum.beds.ac.uk/10.3390/fire7040106
Submission received: 18 February 2024
/
Revised: 19 March 2024
/
Accepted: 20 March 2024
/
Published: 22 March 2024
(This article belongs to the Special Issue Upgrading of Biomass Resources for Subsequent Combustion Use)
Abstract
:This study investigated the fuel potential and combustion behavior of hydrochars derived from a unique precursor: Carthamus pomace. Initially, the hydrothermal carbonization process of this novel feedstock was examined across various temperature ranges (180–240 °C) and durations (15–180 min). The impact of these processing conditions was analyzed in terms of degradation mechanisms and their correlation with the resulting properties of the hydrochars (HCs) produced. Then, the combustion performance of these materials was studied by means of thermogravimetry, and the differences in reactivity and activation energy were analyzed and associated with preparation processes. Finally, the most promising HTC parameters were identified and a thermoeconomic study on the use of selected HCs on a thermal plant devoted to the production of electricity was evaluated including energy savings associated with the implementation of heat exchangers using the heat of the flue gases to partially supply the energy needs associated with HTC.
1. Introduction
Safflower, also known as Carthamus (Carthamus tinctorius), is an herbaceous plant primarily cultivated for its flowers, which hold high value as natural dyes. Additionally, safflower finds use in human nutrition. This plant is abundant in countries such as Mexico, India, China, Russia, and Kazakhstan [1], where its exploitation in agriculture and processing activities has a significant weight in the local economies, being a key product for the subsistence of agriculture in many countries. Thus, safflower is mainly used to extract oil from its seeds.
Some works have also reported the potential valorization of this oil in the chemical industry for the synthesis of certain elements [2] or biodiesel synthesis [3,4].
Safflower is generally resistant to dry climates. However, some studies [5] have developed different varieties of summer and winter safflower making year-round safflower production possible in a wide variety of climates. Recent studies have established the viability and importance of safflower as an alternative to winter crops for rotation with cereals in the Mediterranean area. This has been seen as a favorable option for the weed problem in agriculture [6]. Consequently, depending on the geographical area where it has been cultivated, its uses have varied. For example, in countries such as Turkey, Mexico, or Morocco, production has been mainly destined for the production of seeds or oil. In some countries, it has been used in traditional medicine. For example, in China, clinical application studies have found very effective results in the treatment of coronary heart disease and angina pectoris [7]. In India and Pakistan, different parts of the plant have also been used for different diseases [8] (pp. 24–25).
Regarding compounds present in safflower, studies [9] have isolated many chemical compounds such as quinocalcones, flavonoids, alkaloids, polyacetylenes, alkanediol, fatty acids, steroids, lignans, etc. Quinocalcones and flavonoids are considered to be the characteristic and active constituents of safflower. Safflower forms have 12 pairs of chromosomes. In addition, 2n = 20, 2n = 24, 2n = 44, and 2n = 64 forms of diploid chromosome number were also found [10].
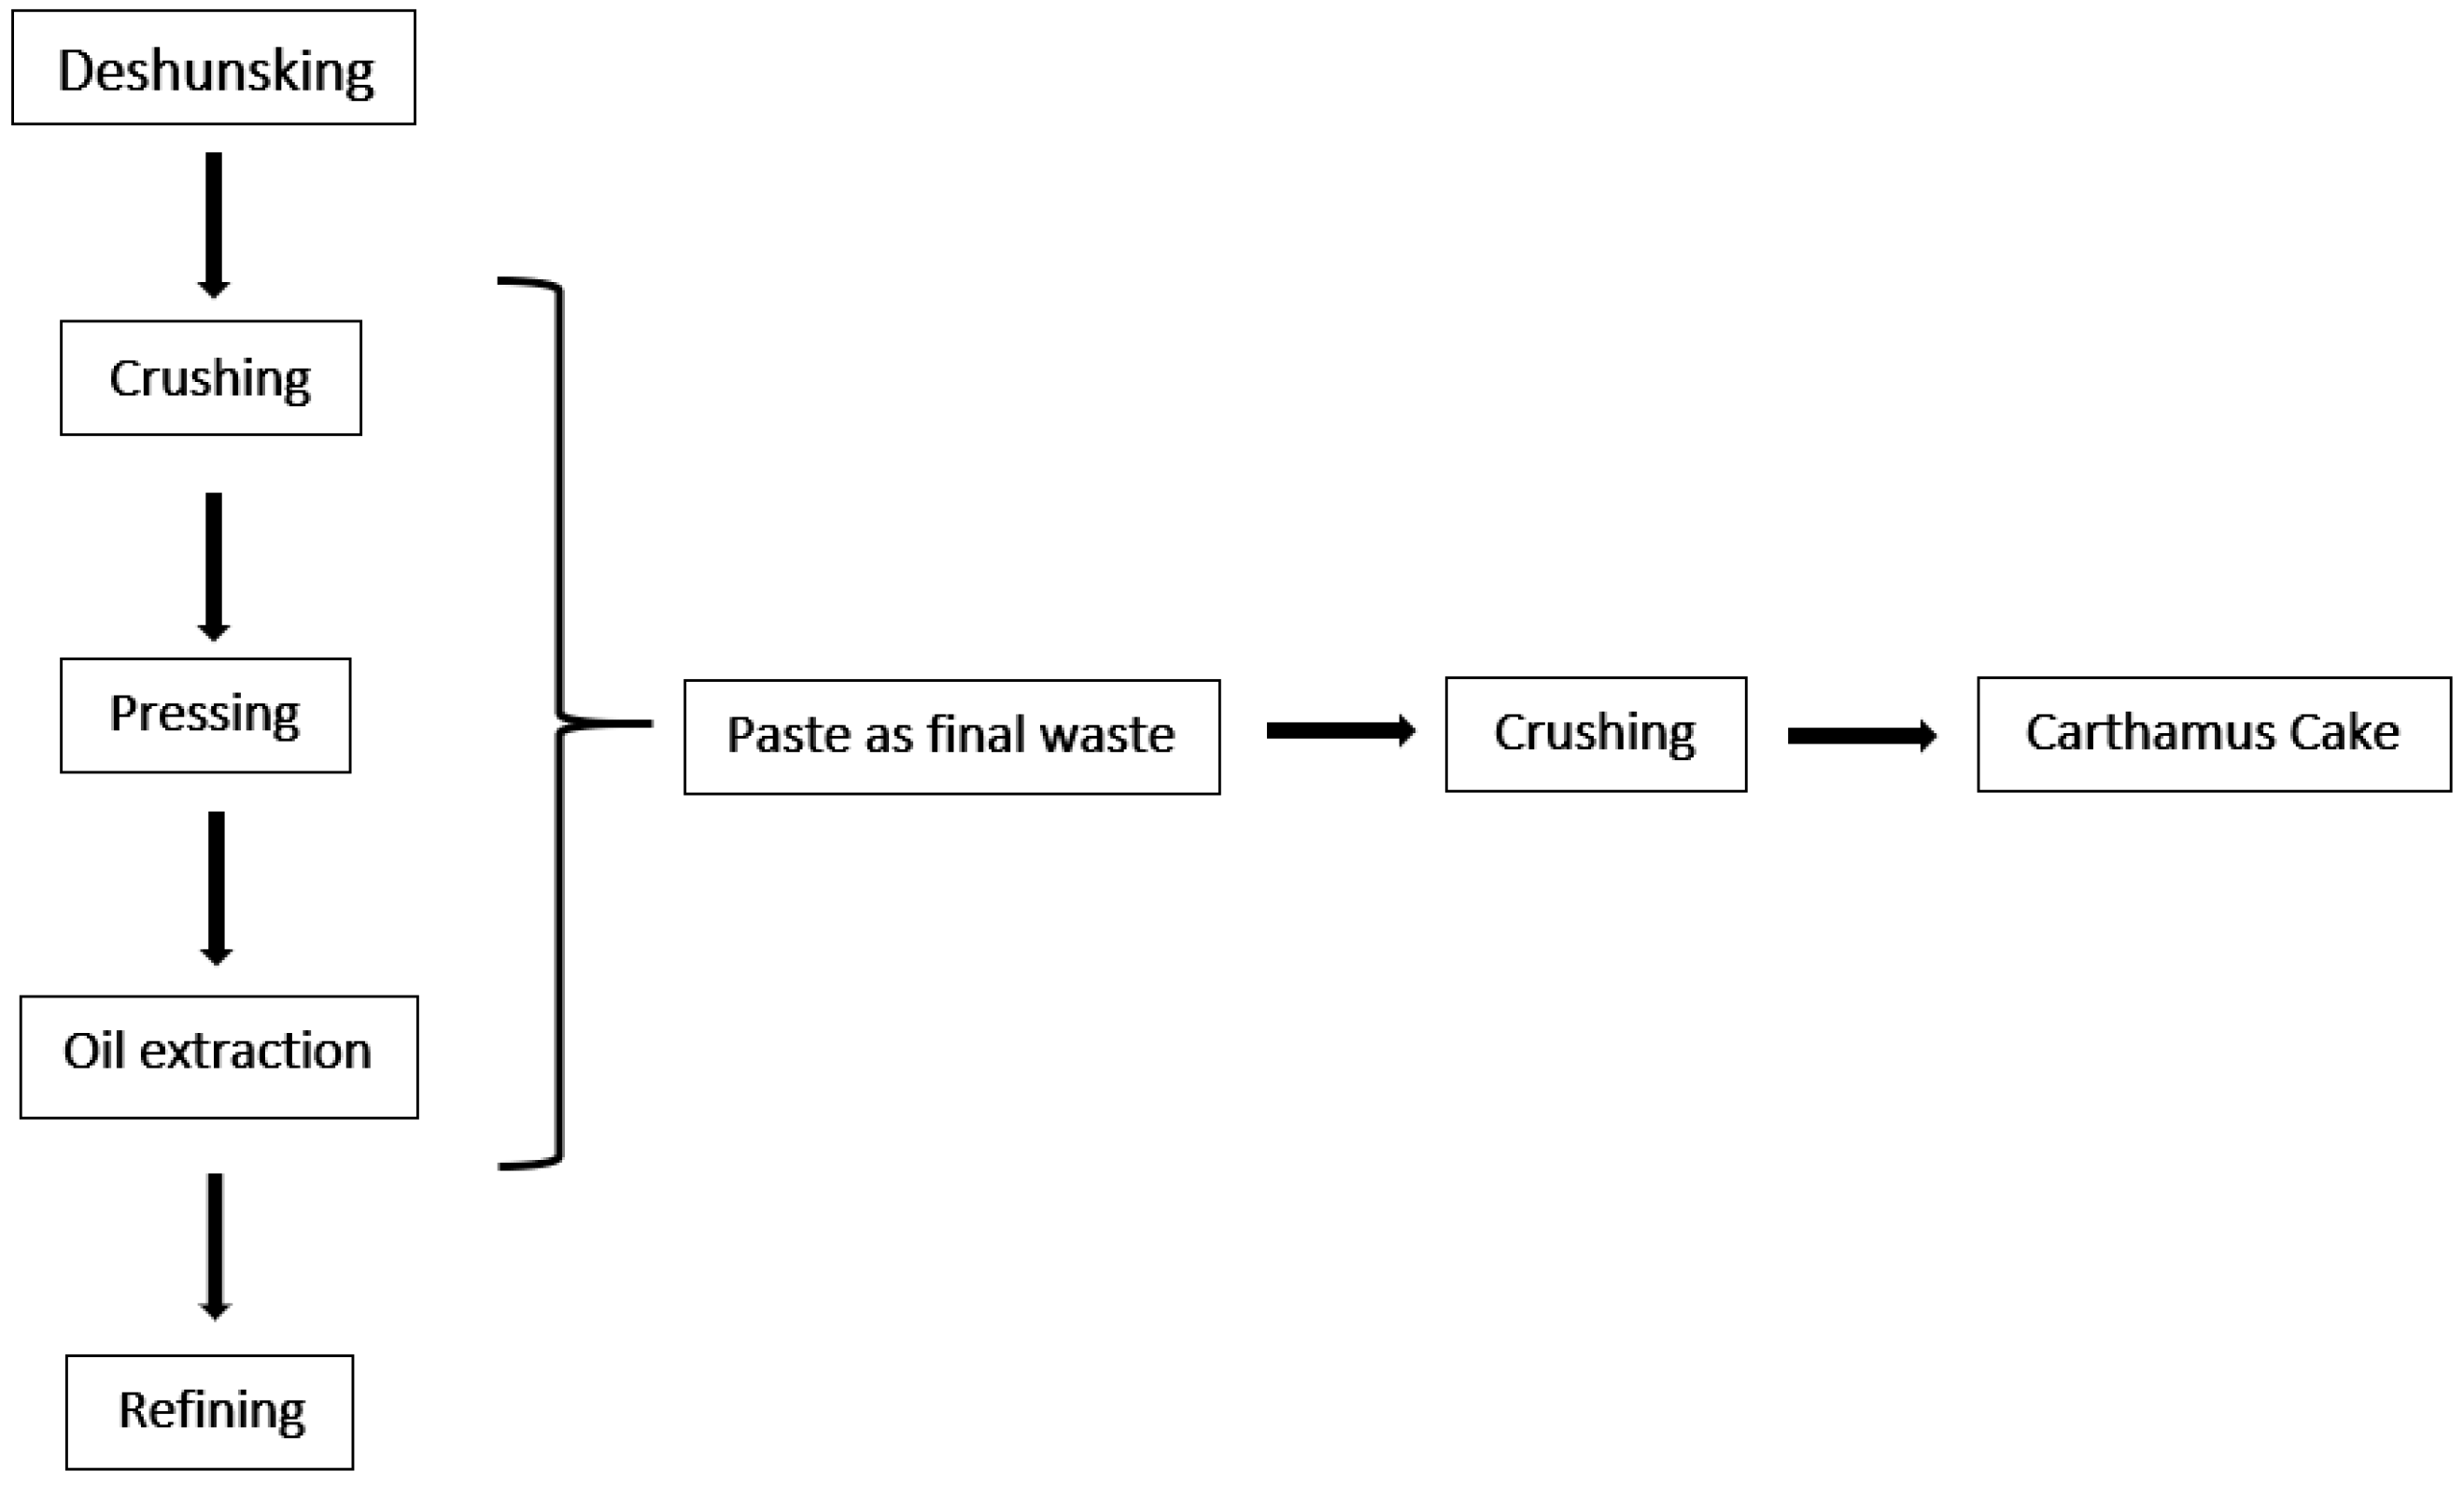
To obtain Carthamus oil, a series of basic stages take place (Figure 1): firstly, the feedstock is subjected to “dehusking” (i.e., separating the seeds from the bud of the plant and the impurities). The shells are further used for energy production (fuel) or for animal feed. Then, there is the crushing and extraction stage; the former allows for the breaking of the plant cells, which are then pressed to obtain the oil. At an industrial scale, the extraction is carried out using authorized solvents. Finally, the refining of the extractive is performed. In this step, the impurities that have formed in the previous phases are eliminated, with the aim of softening the flavor of the oil and reducing the degree of acidity. The final product is a yellowish or orange oil.
Once the previous process is finished, a paste is obtained. To achieve greater homogeneity and to be able to use this paste during the experimental process, it is usually crushed to yield a powder. This final residue is called Carthamus cake (CC) and has no practical use and is simply removed and discarded from the production chain. Within the scope of the circular economy and climate and fossil fuel crisis [11], giving use to this waste as a primary source of energy or maybe for other uses is especially interesting and would provide added value to the whole process.
So far, the only references aiming to upgrade this waste have investigated its processing via pyrolysis [12,13,14]. As a fuel, this pomace cannot be used because of its low high-heating value (HHV). In this work, we propose a possible alternative to open the applicability of this material by increasing its calorific value through Hydrothermal carbonization (HTC).
HTC has received increasing attention during recent years because, amongst other significant advantages, it allows the use of high-moisture biomass. By HTC, biomass is heated in the presence of water, usually under moderate temperature conditions (180–250 °C) and at a sufficient pressure (autogenous) to keep the water in a liquid state. The inherited advantage of using wet feedstock in the HTC process stems from the fact that the reaction medium is subcritical water, so cost-intensive pre-drying is no longer necessary. Under HTC conditions, the water dielectric constant drops drastically (more as the temperature is increased), and so does the solubility of biomass components. The hydrolysis of biomass constituents gives rise to the formation of other compounds (such as monomers, aminoacids, carboxylic acids, salts, etc.), which further react following variable pathways. As a whole, HTC is a very complex process in which a large variety of reactions have been identified so far (dehydration, decarboxylation, decarbonylation, deamination, polymerization, condensation, repolymerization, etc.) whose prominence is highly dependent on reaction conditions [15]. As a result of the process, the initial mixture of water/biomass ends up as a slurry, which, after being filtered, gives rise to a solid product (hydrochar, HC) that generally has a higher C content than the original feedstock.
Apart from having a greater calorific value, other combustion parameters are improved as a result of HTC. For example, the HC is hydrophobic in nature and grabs less water upon storage than the parent biomass. Its surface features (porous structure and surface functional groups) make it suitable for pelleting without the addition of chemical binders. HCs improve in terms of thermal stability and resistance to ignition and the ashes of an HC are tunable because water dissolves a fraction of them under the acidic conditions of the system.
All these advantages have prompted HTC to be considered as a way of producing biofuels (HCs) that can be used either alone or mixed with coal or biomass in combustion processes; combustion is the most investigated application of HCs today, although other uses such as activated carbon production and soil amendment are becoming more and more appealing to scientists all over the world.
According to the above-mentioned background, this work proposes the use of Carthamus cake as an alternative energy source after being processed by HTC. First, the basic characteristics of the precursor material (cake) are analyzed. Later, an investigation on the combustion behavior of HCs produced under different time and temperature conditions (180–240 °C and 15–180 min, respectively) is carried out. For this, energetic parameters obtained from TG/DTG degradation curves are obtained, the evolution of elemental composition and HHV of the HCs is performed, and HTC mechanisms are suggested. Finally, a thermoeconomic study is carried out on the performance and economic savings of using Carthamus cake HCs as a possible fuel in a steam power plant coupled with HTC.
2. Materials and Methods
2.1. Materials
In this work, Carthamus cake (CC) was supplied by a Moroccan rural cooperative near Agadir. As received, the material had the appearance of yellowish powder, and no crushing or grinding process was needed; however, the hydrophilic nature caused it to bind together, and manual size homogenization was needed using a mortar.
Raw CC had a calorific value equal to 20.47 MJ/kg.
2.2. Hydrothermal Carbonization Processes
HTC processes were performed in a 0.015 L stainless-steel microcolumn reactor (weight of the dried and empty column: 221.7 g), which allowed the flash injection of water–biomass mixtures. In each experiment, 11.83 g of tap water and 3.55 g of CC were used. Once the microcolumn had been filled, it was tightly closed, weighed, and left for 24 h at room temperature.
Thereafter, the microcolumns were weighed again and introduced to a muffle reactor previously set to target temperatures (180 °C, 200 °C, 220 °C, and 240 °C) and were left for a variable residence time (from 15 min to 150 min at 15 min intervals and for 180 min). After that, it was cooled down by an ice bath, and when it reached room temperature, the column was weighed again (closed, filled column) and opened, and finally the slurry was taken out and the liquid and solid (HC) phases were separated by filtration (Whatman filter paper no. 3). The conductivity and pH of the liquid phase (processing water, PW) were immediately measured.
Furthermore, PW samples were collected in Eppendorf tubes and centrifugated for 6 min at 9000 rpm. After centrifugation, the overdrain was collected and filtered through 0.45 mm syringe filters. Next, it was diluted in deionized water in a 1:20 ratio and frozen for further analysis. This procedure for PW sample storage has been verified to guarantee the stability of the solution; in previous experiments with CC, it was determined that not diluting the sample caused their reaction even under freezing conditions.
Finally, the solid phase (HC) was dried with the filter in the oven for at least 24 h. After this time, the filter with the biochar was weighed and the solid was collected in tight sample bags for subsequent analysis.
Solid Yield (SY) was calculated as the relationship between the final and initial mass of the feedstock on a dry basis. We randomly selected 10 out of the 40 runs made and repeated them three times in order to estimate the experimental error associated with both SY and the High Heating Value (HHV, as described in Section 2.3). For those samples (200 °C sample for the time period), the experimental relative error was always lower than 5%, and the value shown corresponds to the average value.
2.3. Characterization Techniques
The ultimate composition of the HCs, namely C, H, N, and S, was determined directly using a Euro Elemental Analyzer (Eurovector; HEKAtech GmbH, Pavia, Italy) after oven-drying the HC at 105 °C overnight. The ash content of the HC was also measured directly after dry oxidation at 550 °C according to the DIN EN 14775:2010-04 standard. The CHNS and ash contents were then used to determine the O content of the HC by calculating the difference between these values and 100% (on an ash-free basis). Characteristic ratios (H/C and O/C) were further used to build a Van Krevelen diagram and depict degradation mechanisms.
The High Heating Value (HHV) of the HCs was determined using a calorimeter (1351 PARR, Ilinois, USA) following the norm CEN/TS 14918.
Furthermore, the thermal degradation profiles of selected HCs were determined using an STA 449 F3 Jupiter (Netzsch, Berlin, Germany) thermobalance in an oxidizing atmosphere (20% oxygen and 80% argon with a flow rate of 100 mL/min) using a ramp from 20 °C/min up to 700 °C. These experimental conditions were defined based on previous experiences that showed that this heating ramp allows the identification of characteristic degradation peaks.
2.4. Kinetic Study
An assumption of first-order reaction mechanisms is most frequently used for solid fuel decomposition/combustion. Therefore, the kinetic parameters (activation energy and pre-exponential factor) of the combustion of hydrochars were calculated according to this method [16,17]. Combustion of the hydrochars may be expressed by the following formula:
where A is the pre-exponential factor, Ea is the activation energy, T is the absolute temperature, t is the time, and x is the weight loss fraction, which can be calculated by:
where m0 is the initial weight of the sample, mt is the weight at time t, and mf is the weight at the final temperature.
For a constant heating rate during combustion, = dT/dt. Rearranging Equation (1) and integrating it gives:
If combustion follows a first-order reaction mechanism, the plot of ln[−ln(1 − x)/T2] against 1/T should give a straight line. The values of activation energy, Ea, and the pre-exponential constant, A, can be calculated from the slope and the intercept, respectively. The temperature range of combustion for hydrochars was between 180 and 240 °C, and the thermogravimetric data over this range were used to perform the kinetic analysis.
3. Results
3.1. HTC Processes
3.1.1. Influence of Thermodynamical Properties
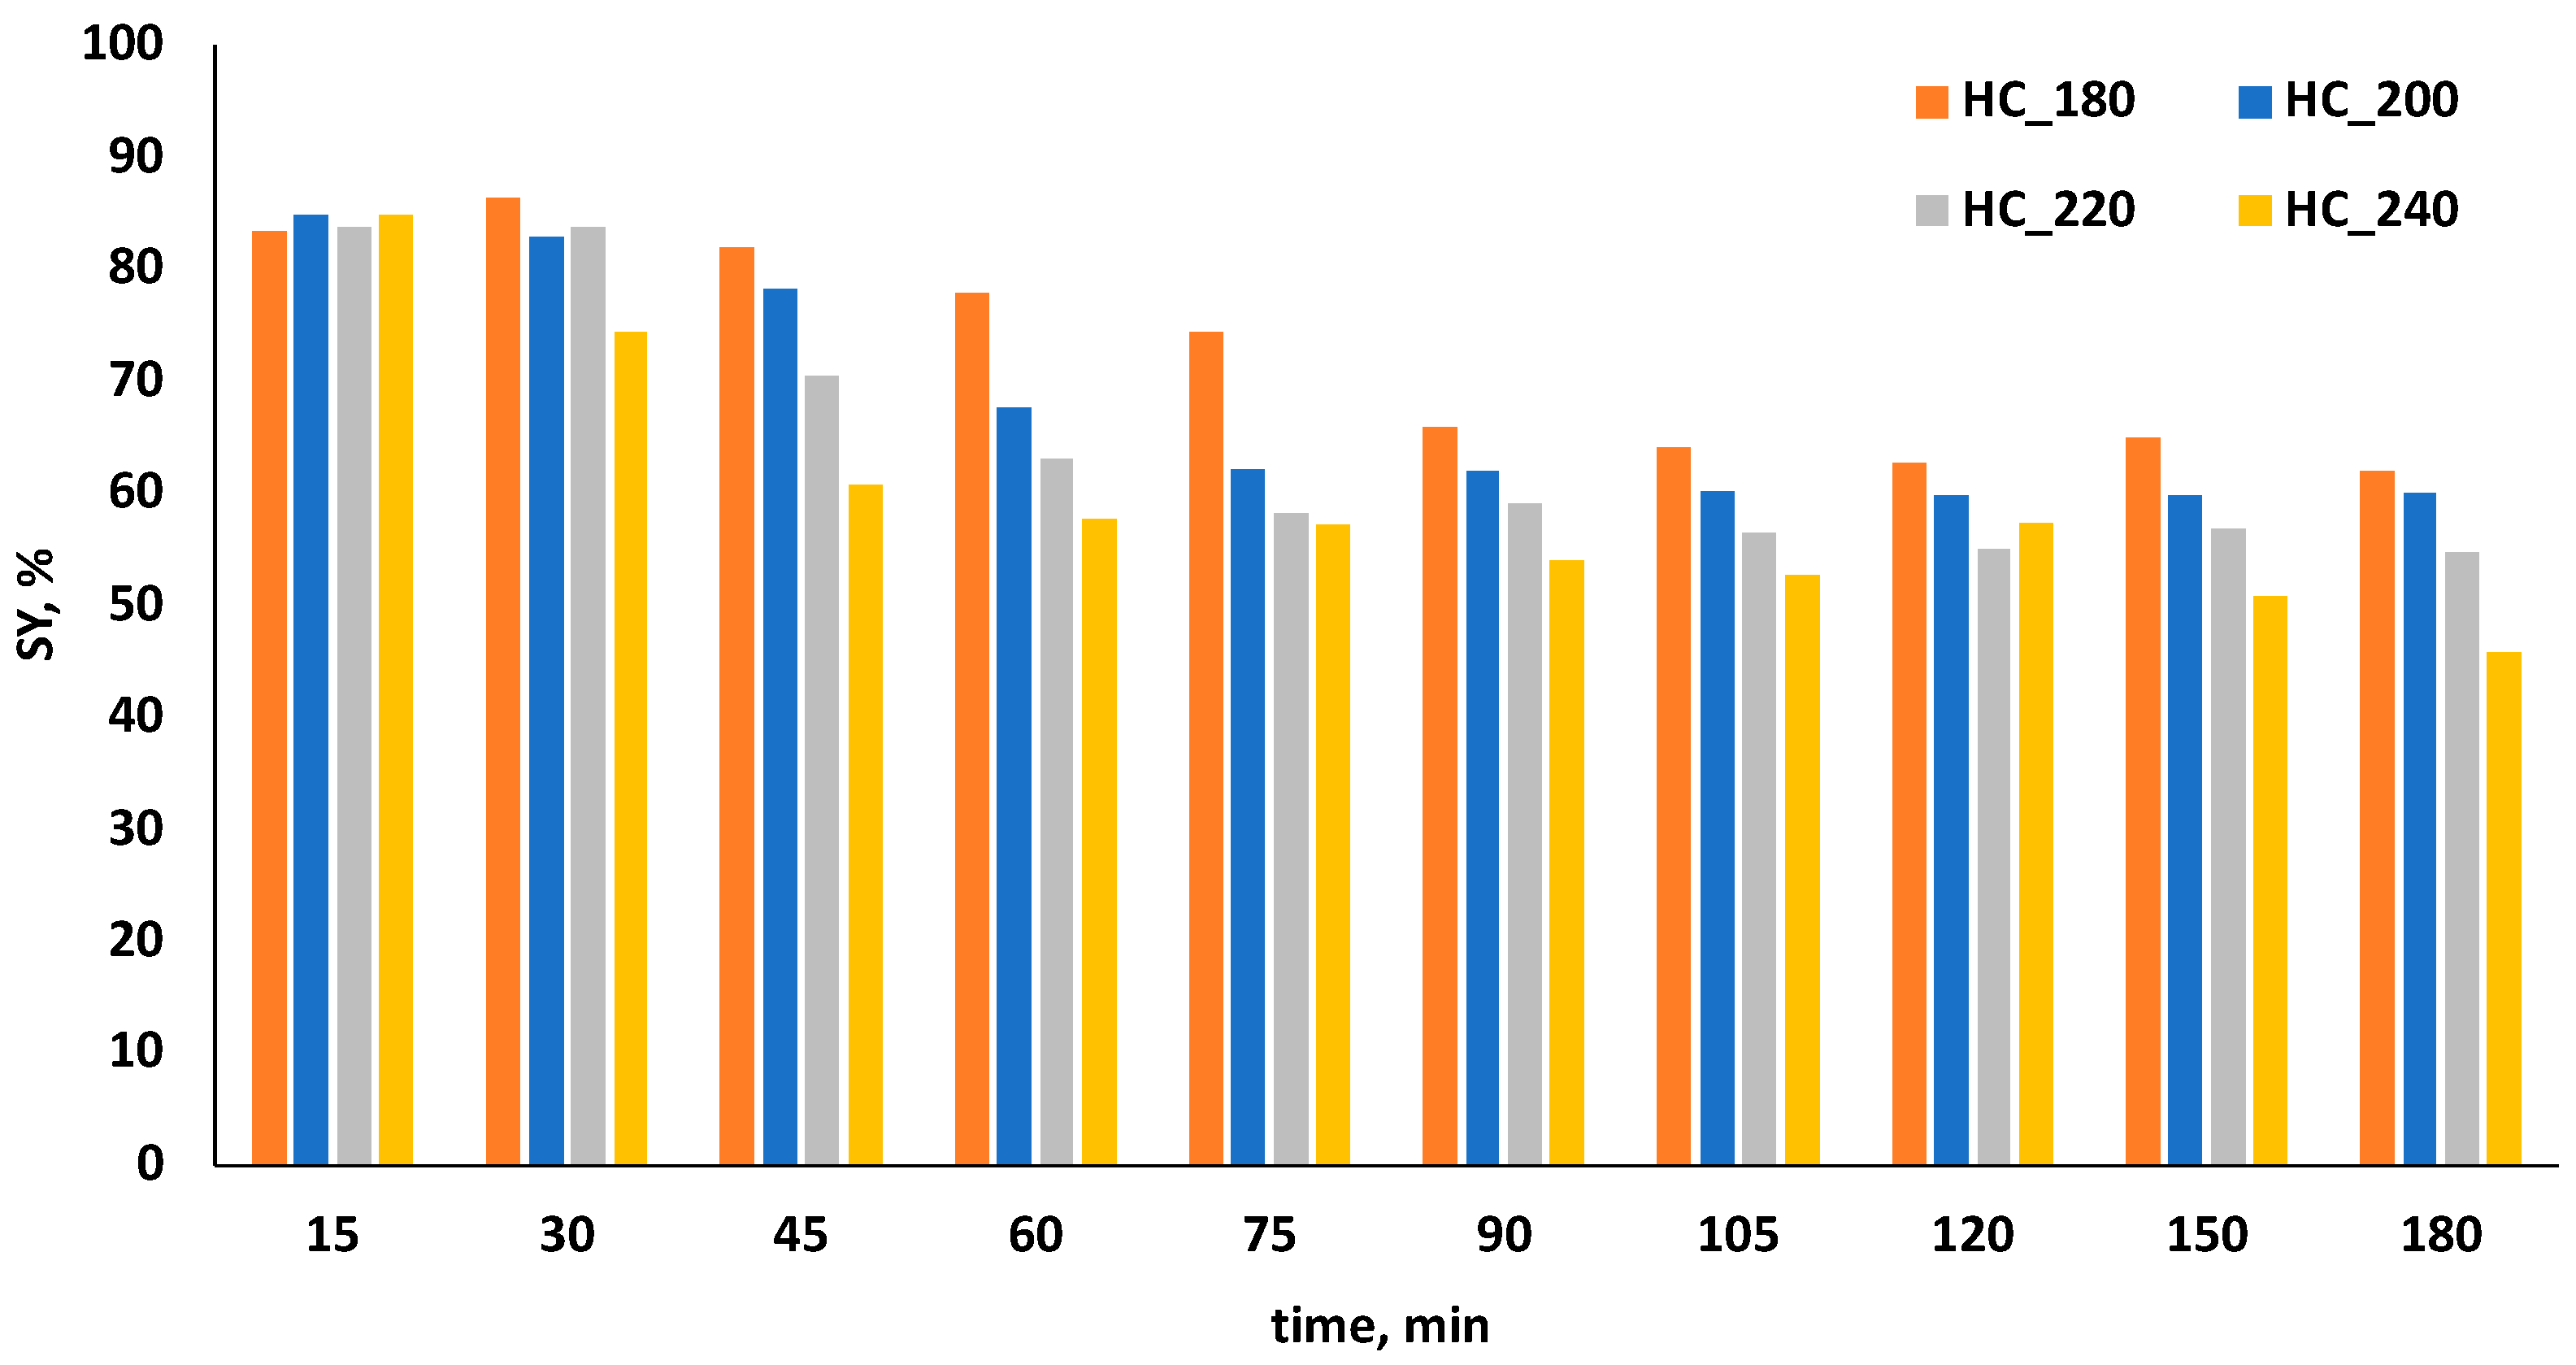
HTC processes, for a given biomass-to-water ratio, as is the case of this study, are typically influenced, among other factors, by temperature and time. In Figure 2, the SY, HHV, and PW have been plotted for the different runs. PH values ranged from 3.9–5.1 and showed the same trend for all temperature conditions, with a lower value at short residence times and a slight increase as this variable increased.
The Solid Yield (SY) values varied between 45.76% and 86.44%, showing a general decrease as the temperature increased across all time periods, except for the 15 min duration. Interestingly, within this brief time frame, the temperature variation did not appear to significantly affect the SY results.
Although the reactor had very fine walls, 15 min might not be enough to let the process go beyond the first degradation steps. The removal of biomass extractives has been identified at temperatures as low as 80 °C [18] and then hydrolysis of the aliphatic bonds of hemicellulose polymers can happen at around 150 °C, and this is considered the HTC starting point, giving rise to an increase in the concentration of the process water hydronium ions [19]. A period time of 15 min might not be enough to guarantee heat transfer to the biomass particles.
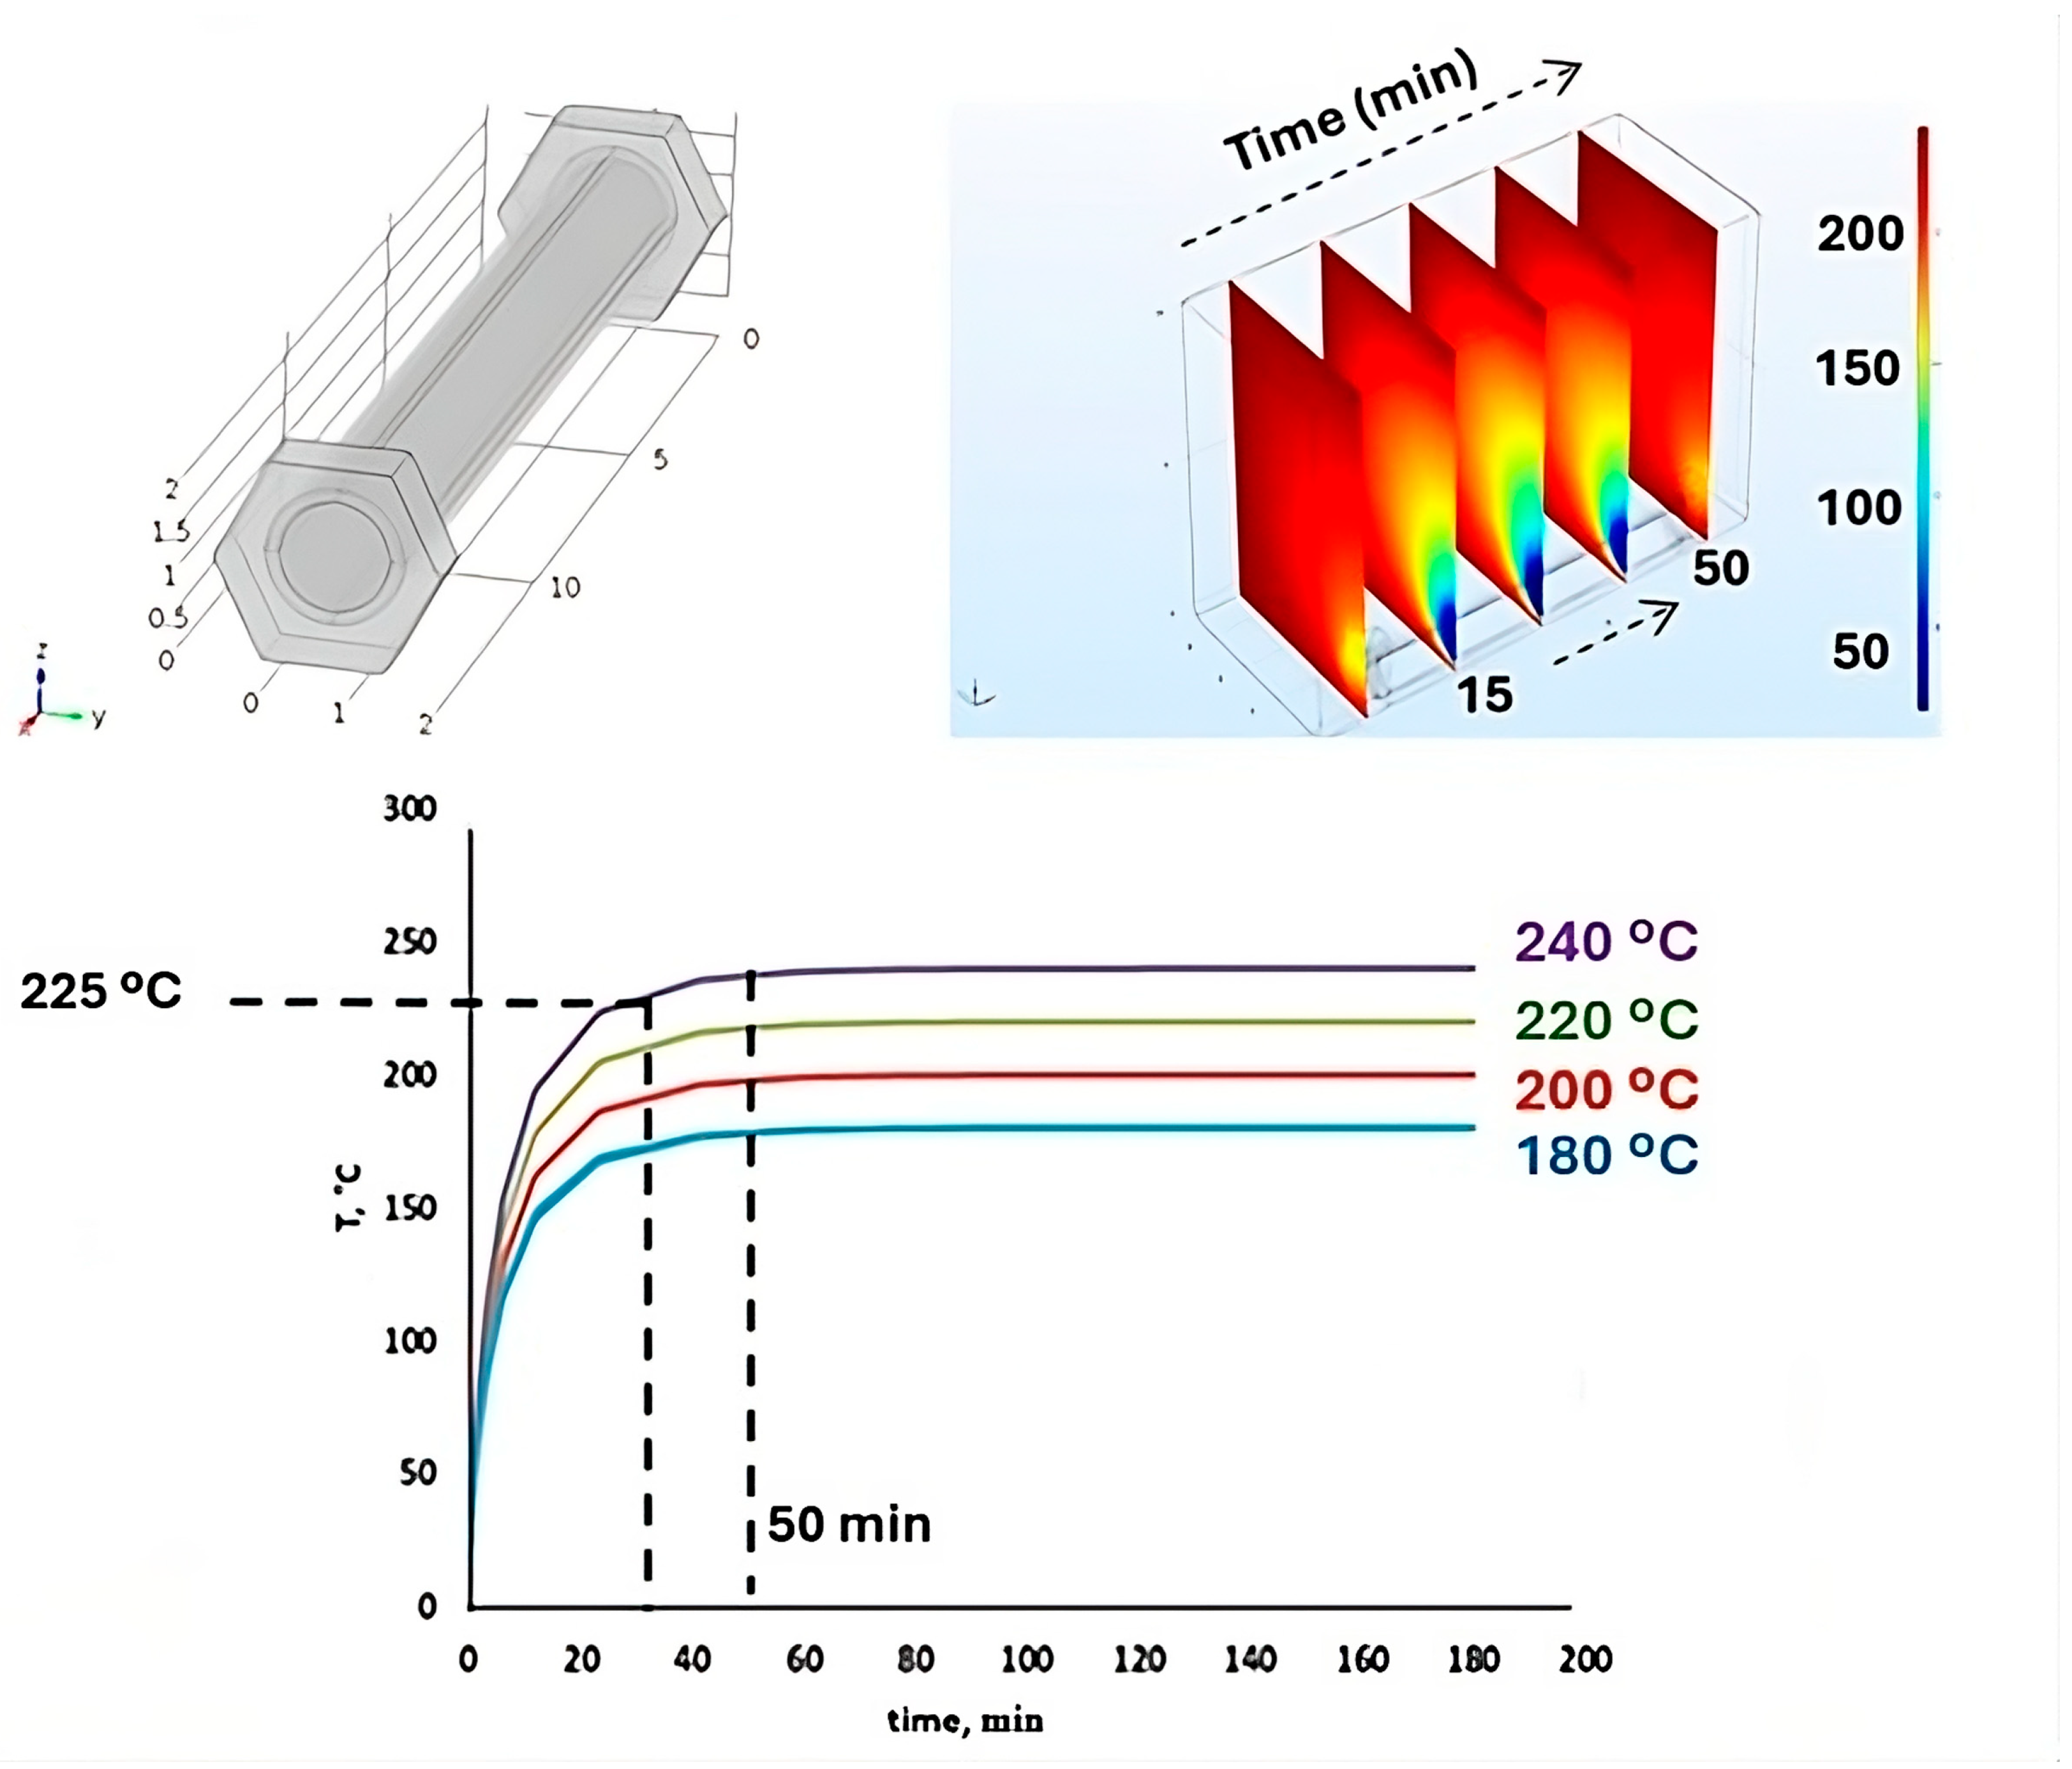
In order to estimate the time required for biomass particles to reach the desired temperature, the system was modeled according to the procedure described in a previous work [20] using COMSOL Multiphysics software v4.4. Both the heating system (muffle oven) and column reactor were defined as edge conditions. In the first case, the oven was defined as a rectangular prism (25 × 25 × 30 cm) while the reactor was modeled as a cylinder (diameter: 1 cm; height: 10 cm; reactor thickness: 0.01 cm); both were modeled as stainless-steel pieces AISI 4340. The reaction medium was defined as water; although the process water composition changes with time due to the presence of organic and inorganic compounds as biomass is degraded, its thermodynamical behavior was assumed to be constant.
The various heat transfer resistances, including conductive, convective, and radiation mechanisms under dynamic conditions, were included in the model. The simulation involved the column reactor, temperature gradients, and consequently, the temperature distribution within the system core.
The simulated temperature profiles attained in the core of the reactor are plotted in Figure 3. It can be seen that independently of the set temperature, the transient heating period has a duration close to 50 min. This information can also be deduced from the temperature gradients shown on the right-hand part of Figure 3, which shows how the heat transfer allows for attaining the set temperature for the specific case of 240 °C.
Figure 3 also shows that after 30 min, the set temperature has not been attained. The simulation shows that this parameter is approximately 25 °C lower than the final plateau temperature in all cases. Despite this delay, SY values confirm the initiation of the process. Even the 180 °C run (which according to the temperature profile would correspond to 155 °C at 30 min) has a SY of 86%, that is, HTC under these conditions already involves a slight degradation, likely associated with the removal of extractives and first hydrolytic reactions. The SY values for 30 min or longer time periods depict a very clear fostering of biomass conversion with temperature in coherence with the enhanced ionic constant and a decrease in the dielectric constant of water. As the production of acids and more hydronium ions increases, further endothermal degradation reactions like decarboxylation and decarbonylation help the gradual degradation of the solid product, all bringing about a decrease in SY.
When one looks at the intensity of the SY drop, it can be found that the reaction residence time determines the extent of the effect of temperature. In this way, for times between 30 and 90 min, SY decreases with a greater slope than that found for longer times. Moreover, the slope of the SY drop in the time range of 90–180 min is rather similar. Also, if one temperature is selected, the effect of time on SY vanishes as time is increased.
Many previous works have identified the shift in the effect of the time increase when longer time intervals are considered, from having a negative effect to an almost null or positive effect on SY. HTC process water, composed of a wide variety of organic and inorganic compounds, is highly reactive, and some of the monomers and degradation products react to yield other products and eventually macromolecules that polymerize and form nanoparticles that are deposited on the HC surface. This additional contribution to SY is usually referred to as secondary HC [21] and is likely responsible for the mitigation effect described above.
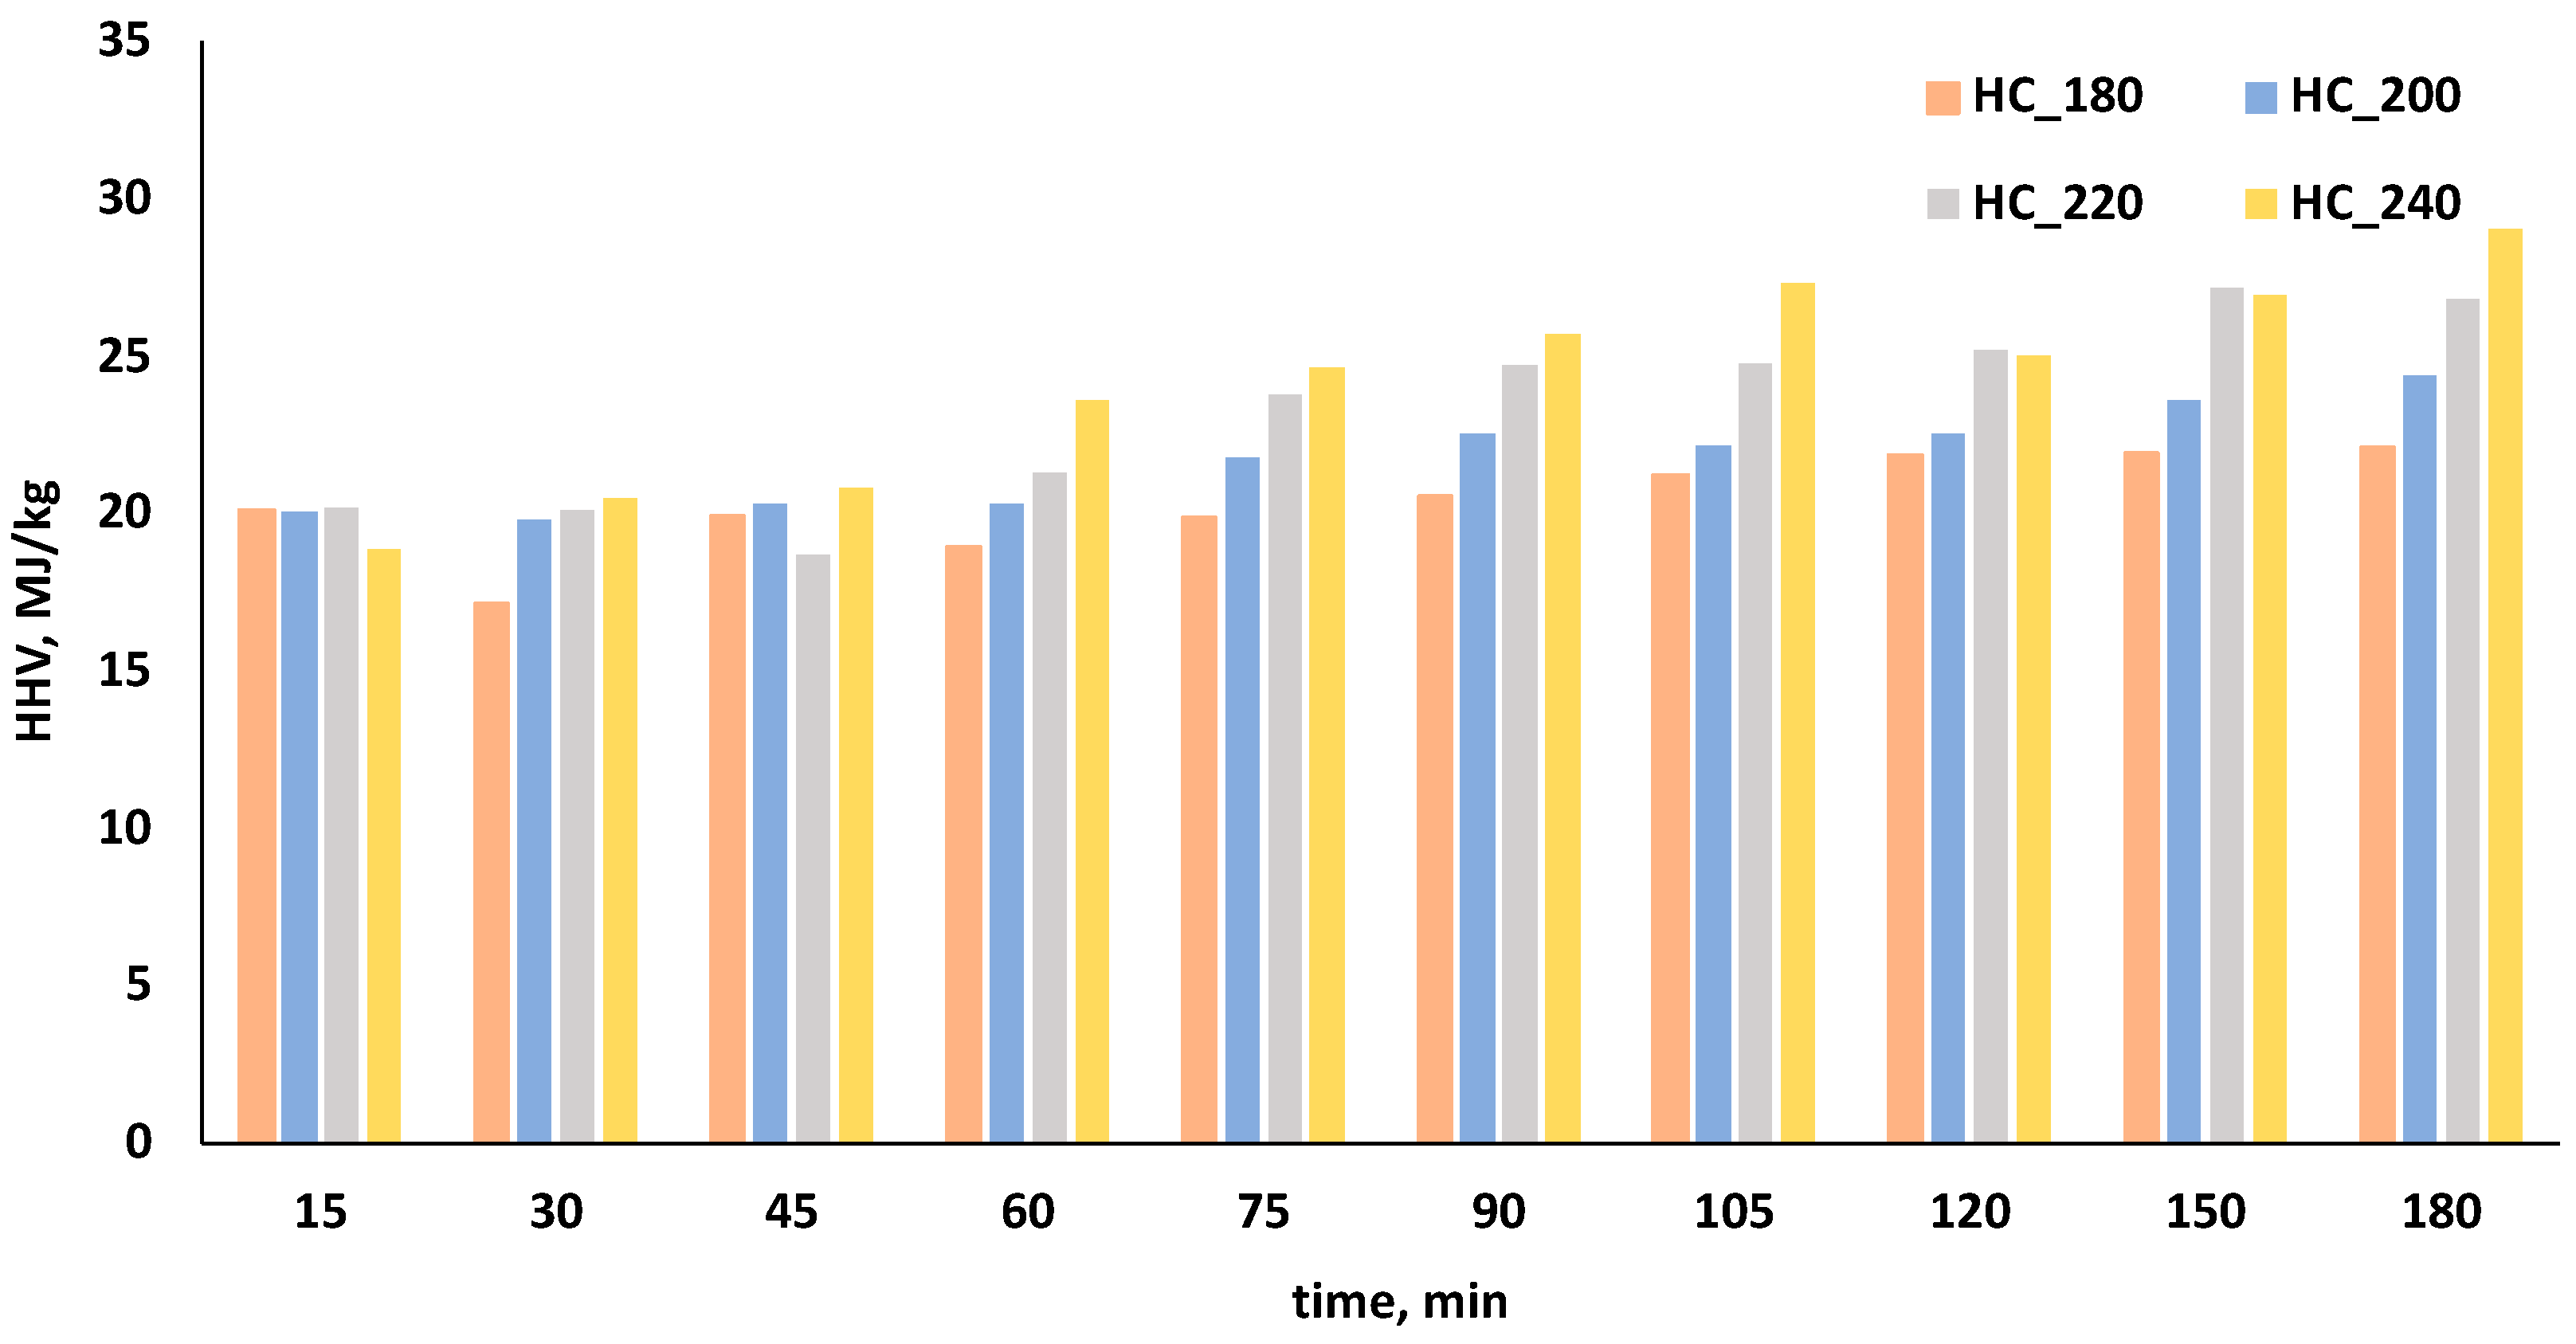
The abovementioned effects described for SY are reflected in reverse on the HHV (Figure 4), although there are differences that must be highlighted. First, with the exception of 15 min runs, increasing temperature yields a rise in HHV. Upon HTC, SY decreases mostly at the expense of O [22]; in this way, C (and HHV) also gradually increases for all times considered. A very remarkable effect of time is found in relation to time; while it eventually yielded a stabilization of SY, the case of HHV is not the same. It can increase for longer times without entraining a net decrease in SY; indeed, the average value of this parameter is 22.42 MJ/kg, while the maximum value reached is 29.05 MJ/kg, similar to that presented by some lignites, and this corresponds to the HC made at 240 °C during 180 min.
This effect is inspiring with regards to industrial applications and has to do with the secondary HC that is formed as a consequence of the recombination of process water degradation fragments, as well as the adsorption on the solid product of molecules having a high HHV, as is the case of several organic compounds [23] that are usually present in the system.
Since no previous work on HTC of SS pomace has been found in the bibliography, the authors cannot compare their results with those obtained in previous work. However, the results can be compared with other studies that the working team has conducted using the same reactor column and other biomass waste. For example, in ref. [24], a weed, water hyacinth (WH), was hydrocarbonized, and HHV up to 21.84 MJ/kg was achieved (250 °C, 68 min). This value is lower than the maximum HHV for CC HCs (29.5 MJ/kg, 240 °C, 180 min). This may be due to the higher fat content of safflower seeds compared to WH. Moreover, for equal reaction times, the HHV value obtained is also higher for CC than for WH. Thus, for similar conditions (205 °C for WH and 200 °C for CC, both for 120 min), the HHV results are 18.94–22.53 MJ/kg, respectively. The minimum HHV values obtained for both biomasses are around 17 MJ/kg (16.83 MJ/kg for WH and 17.16 MJ/kg for CC), with both values obtained in very similar conditions: 178 °C and 36 min (WH) and 180 °C and 30 min (CC). Regarding SY, in [24], similar trends are also obtained. Thus, SY is higher for shorter reaction times than for longer times, in which SY decreases, regardless of the reaction temperature, something that can also be observed in Figure 2.
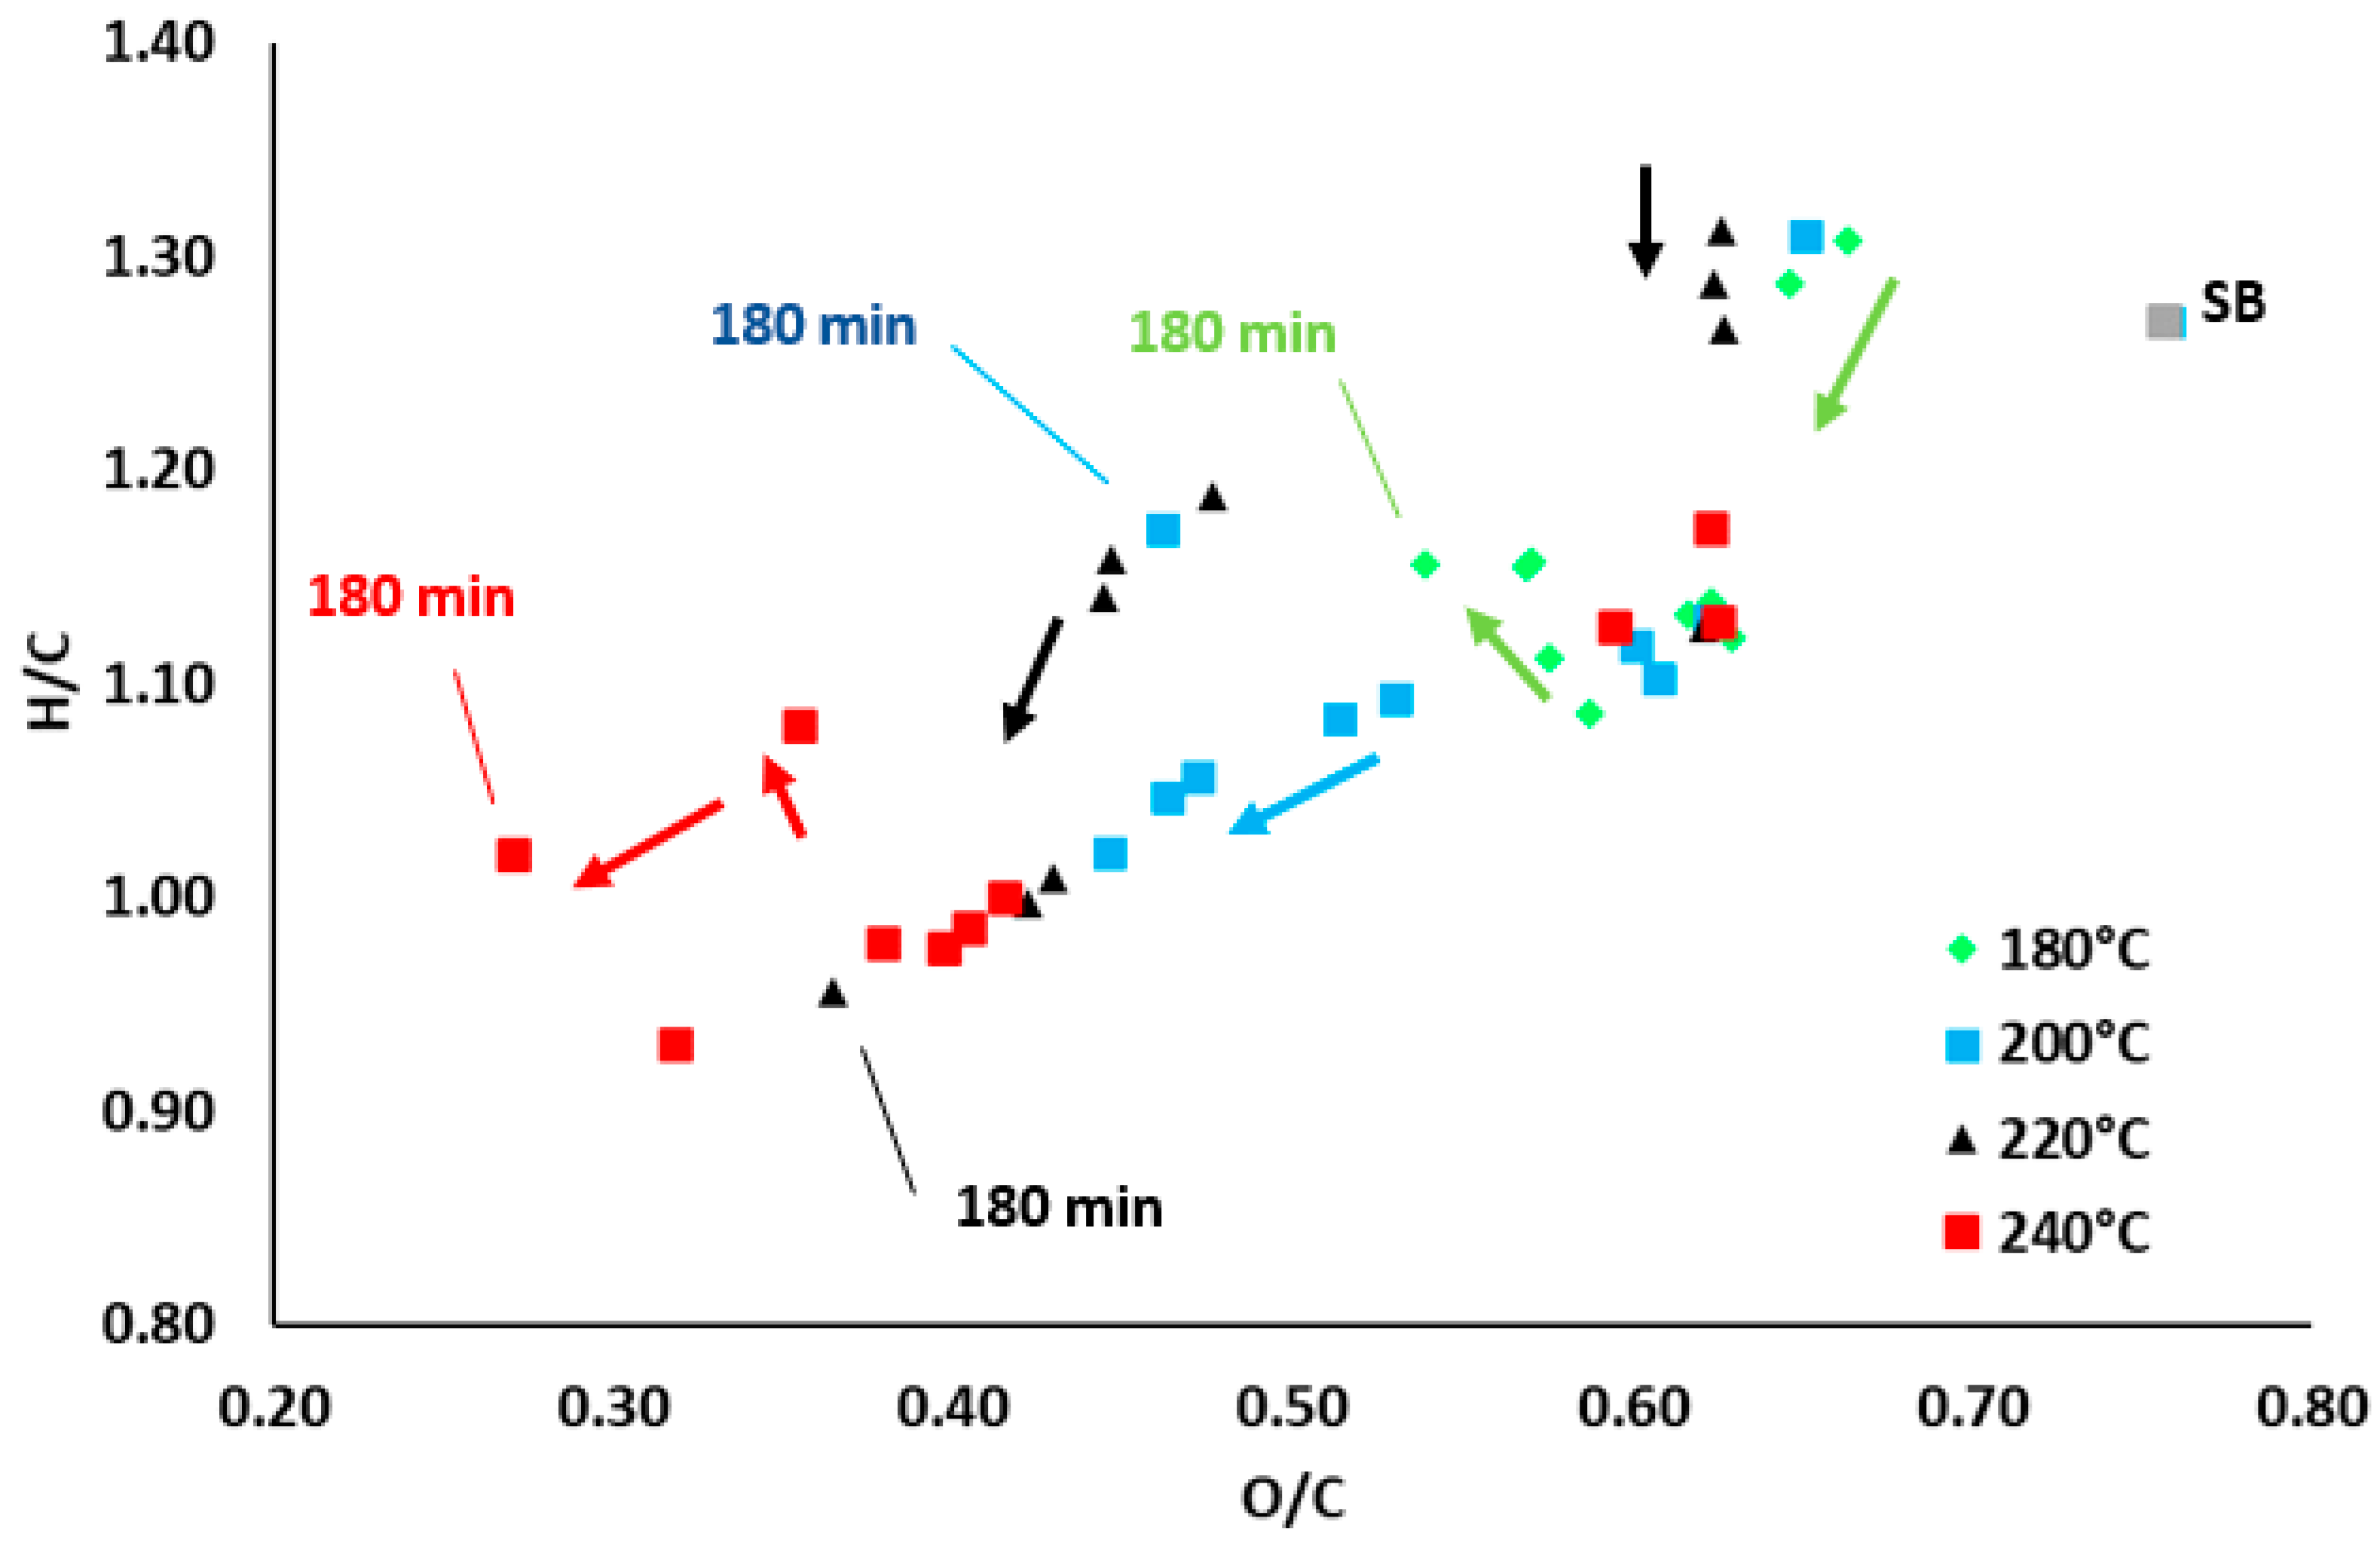
An interesting way to investigate the decomposition processes taking place during HTC is by means of the Van Krevelen diagram, which relates to the H/C and O/C ratios for the HCs. Figure 5 shows this diagram for the different temperatures and times studied. The point corresponding to the starting biomass (point SB in the figure) has been included in the graph. It can be seen that the O/C parameter decreases after HTC regardless of the circumstances. In the conditions studied, HTC always leads to a decrease in the O ratio of the precursor (46.3%). Indeed, the values 43.6% and 21.1% are the maximum and minimum values found for O in hydrochars. The decrease effect is generally also found for the H/C ratio, although in this case, the origin of this trend is not the increase in H in the hydrochars (which, in fact, increases) but rather only the increase in C concentration, which is more pronounced at a higher temperature. The decreases are, in any case, more intense for the O/C ratio than H/C (note the change in the scale).
It can be seen in Figure 5 that the evolution of HC at higher temperatures evolves into compositions more similar to lignite as a consequence of the decarboxylation (more intense) and dehydration. The arrows indicate the increase in reaction time for HCs and, as observed, this variable promoted lower O/C ratios and H/C in general.
3.1.2. Combustion Analysis
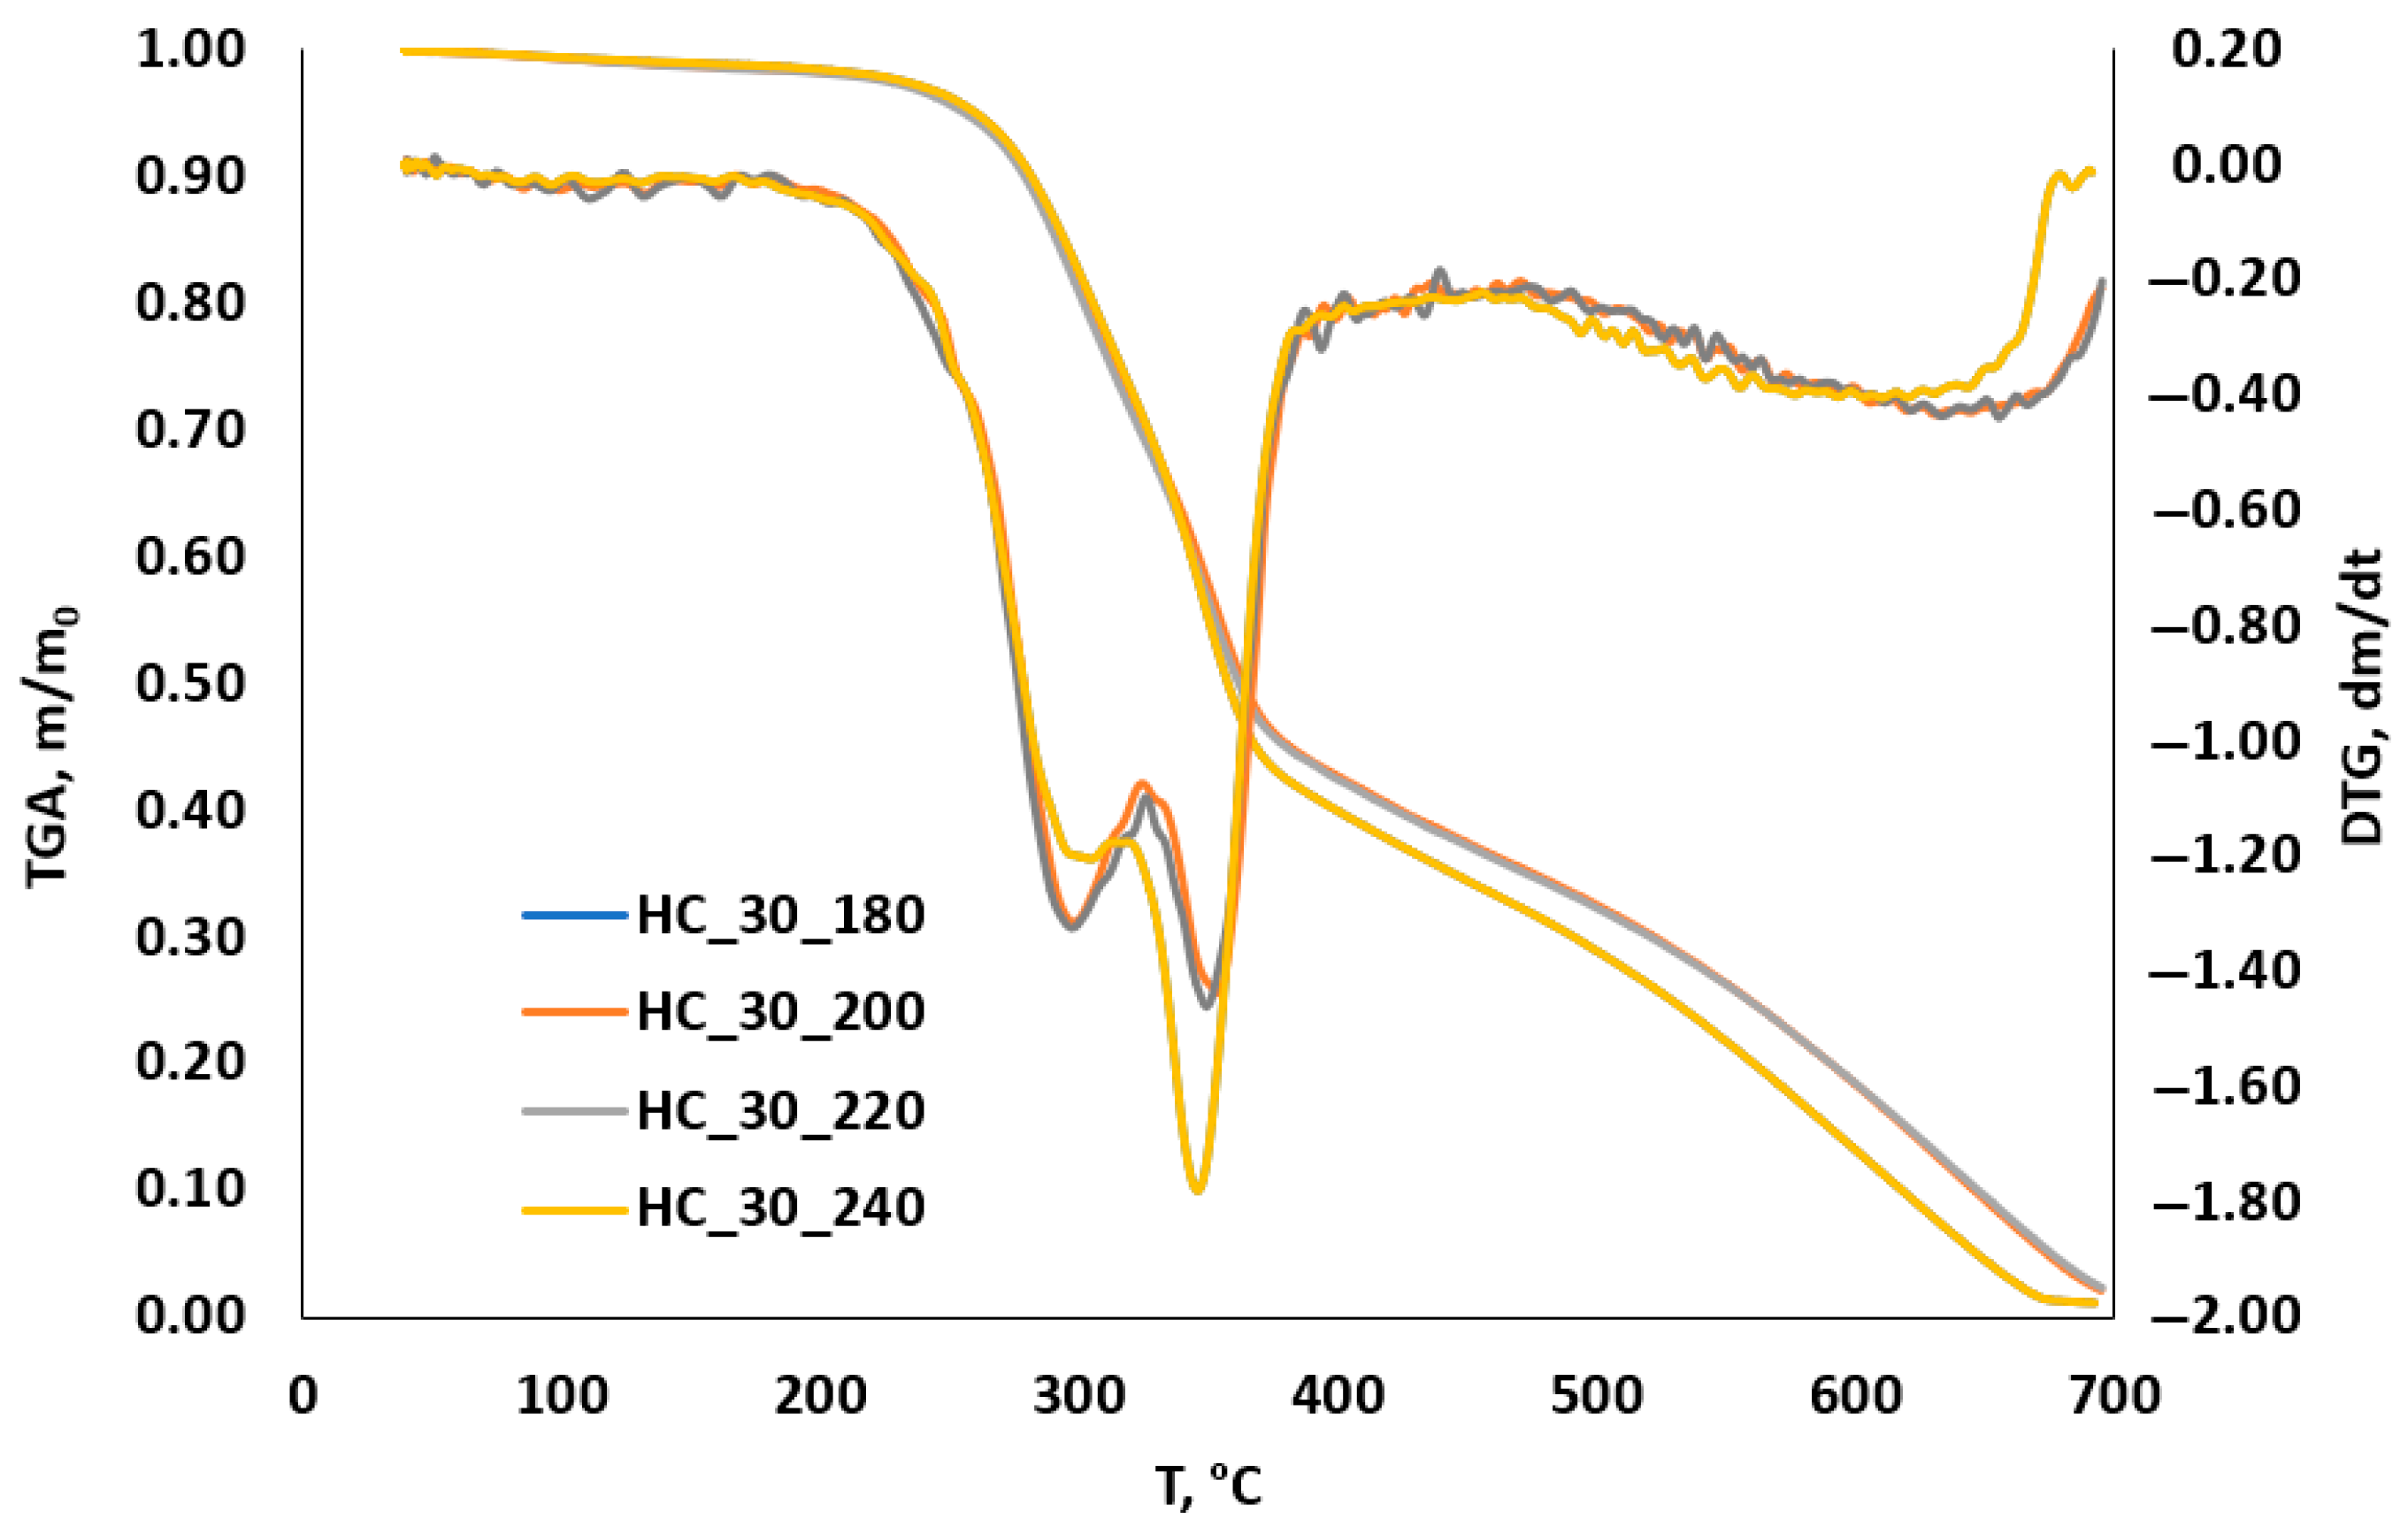
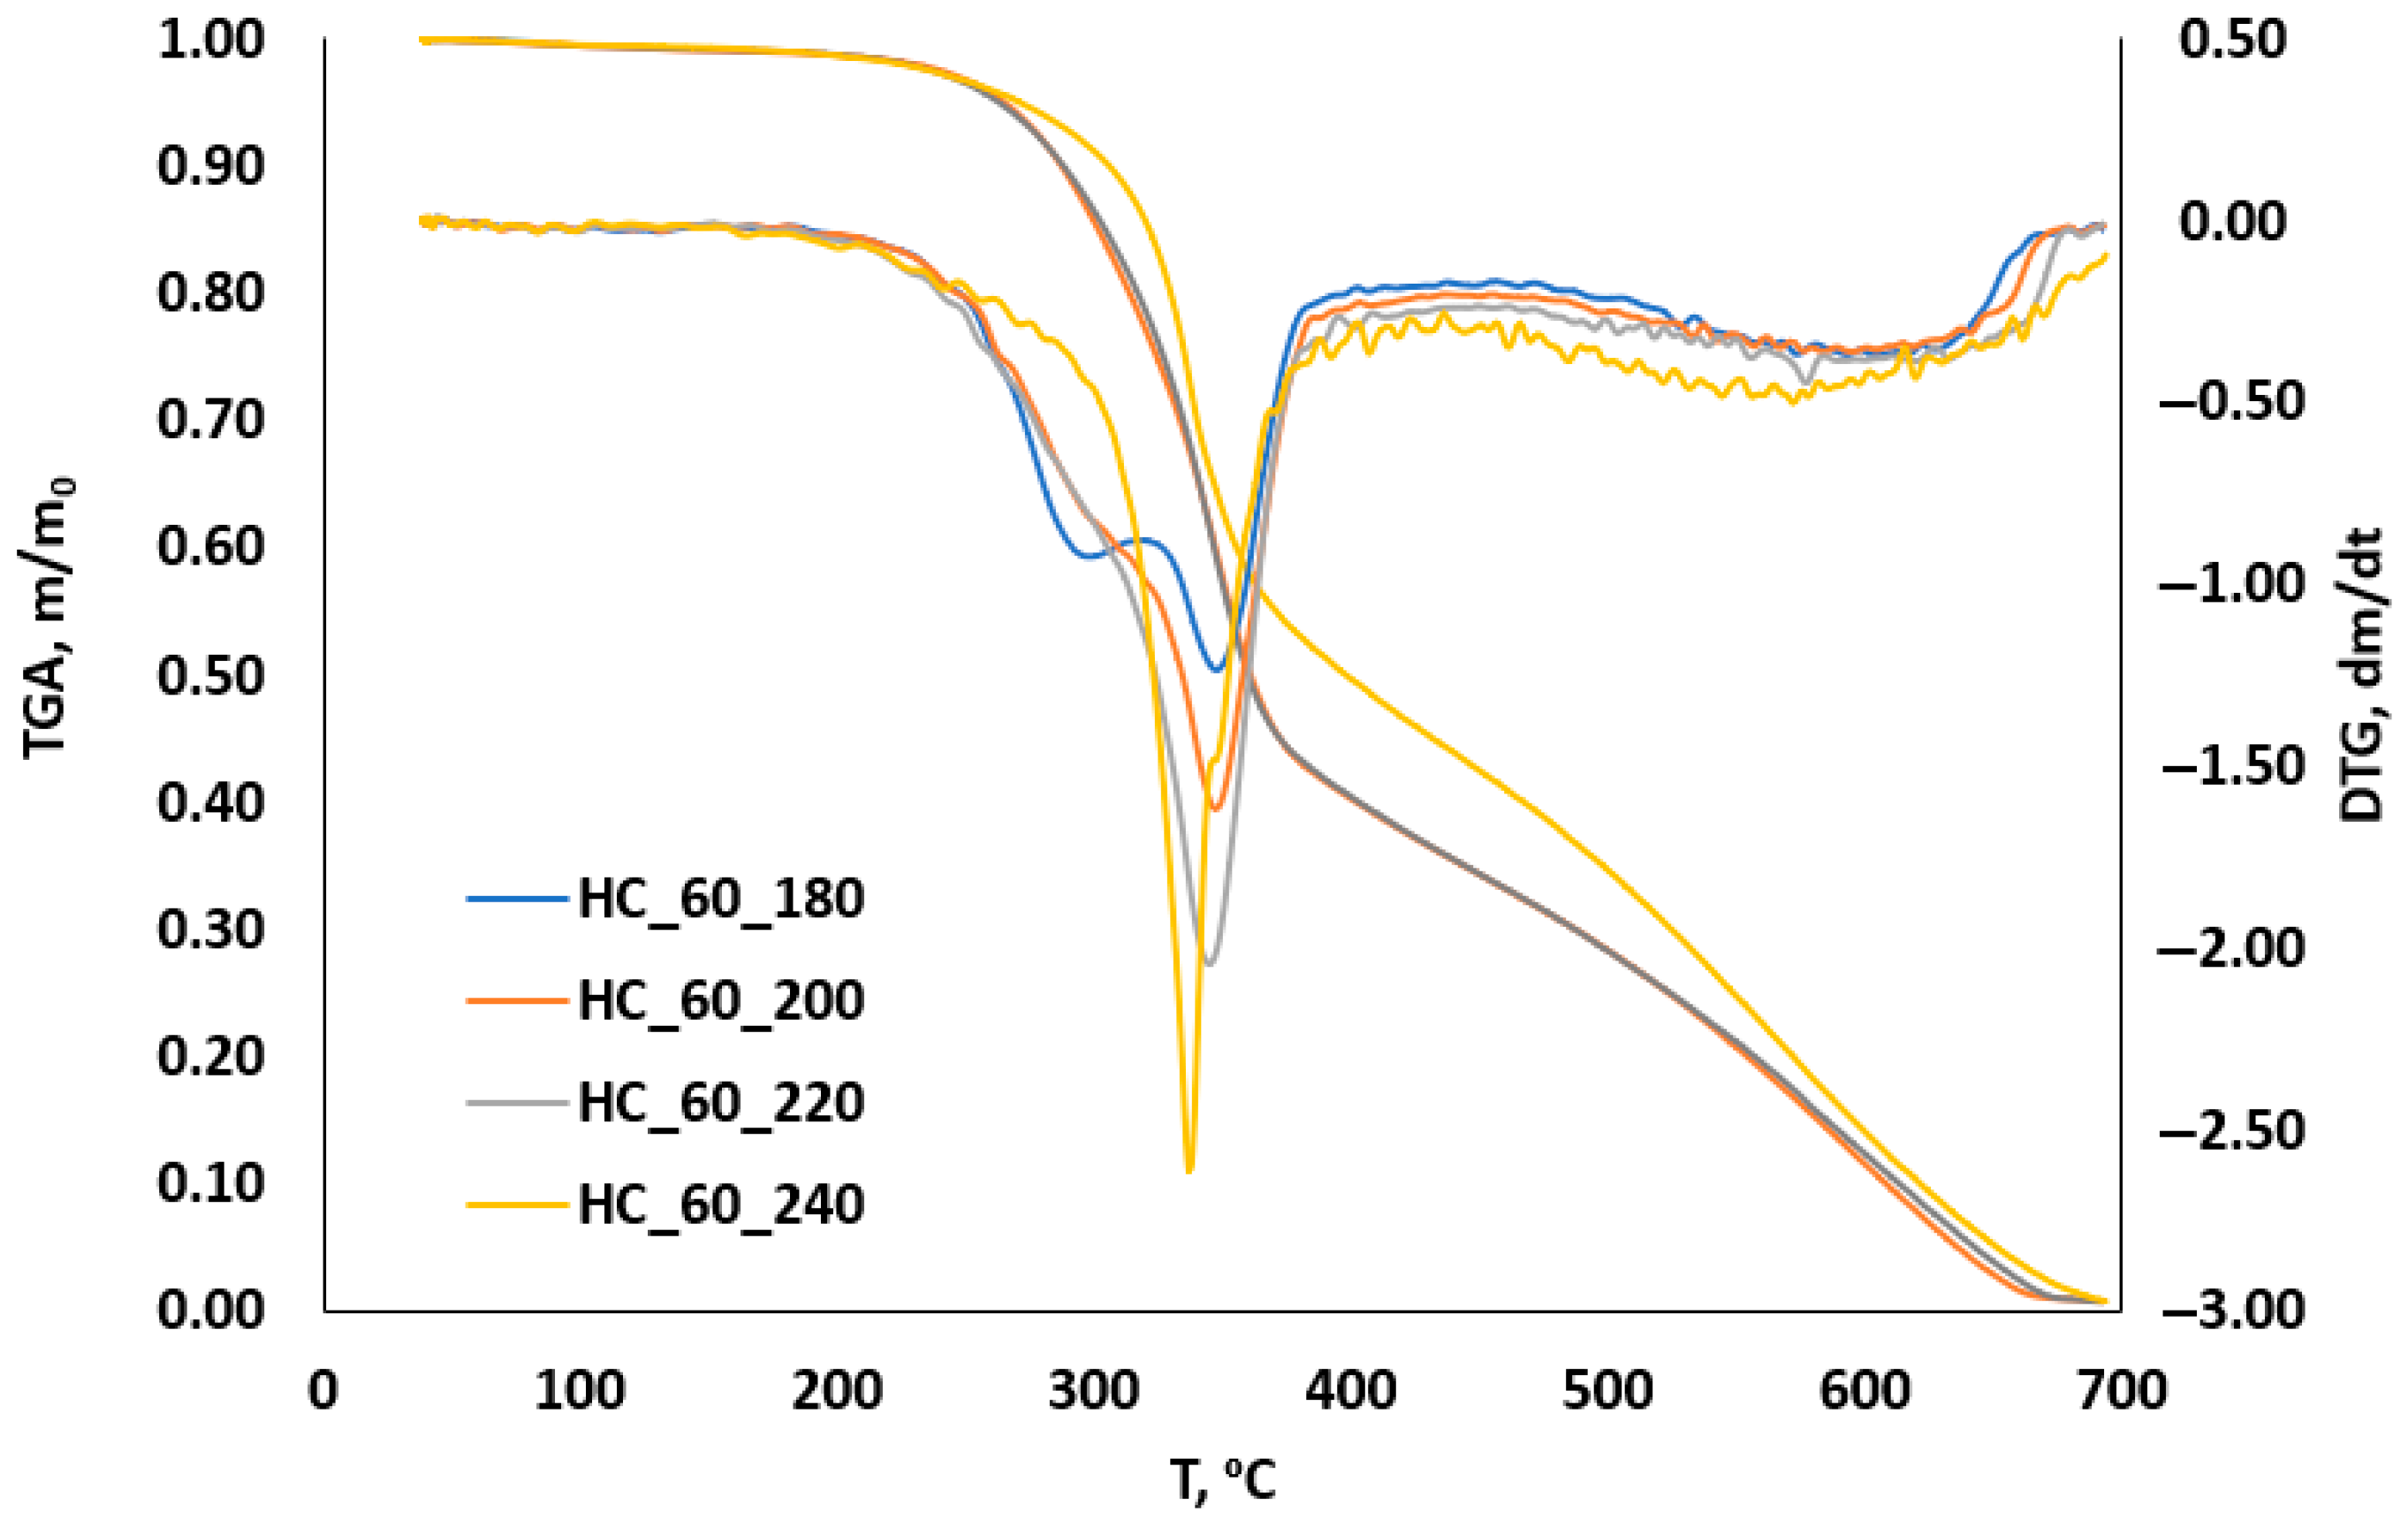
The thermal degradation profiles of some selected HCs have been plotted in Figure 6, Figure 7, Figure 8 and Figure 9 (TGA/DTA), grouped with the aim of helping the identification of differences in their combustion features. The nomenclature used for the different samples is as follows: HC_reactiontime_temperature. Again, the time period determines the extent of the temperature influence.
In Figure 6, the HCs made during a time period of 30 min have been included. It can be seen that a greater HTC temperature in the range of 180–240 °C does not have an effect on the degradation profiles. In this Figure, it can be seen that with a very slight drop in mass as a result of water removal, a temperature of approximately 225 °C is needed to start a noticeable degradation period. This period occurs through two steps, as it can be inferred from TGA (two slopes in the curve) or from DTG (two peaks composing the main one), indicating that the HCs made at 30 min are composed of hemicellulose and cellulose. After these two peaks, residual mass progressive loss can be associated with lignin degradation. This is also the tendency found for 60 min (Figure 7), but a clear diminishment of the first peak intensity is found. This suggests that the increase in time from 30 to 60 min allows for more completed HTC reactions so that the resulting HCs have a lower hemicellulose fraction (that was consumed in the process). The lower amount of hemicellulose therefore causes the DTA curve to evolve from two peaks to one main peak exhibiting one left shoulder.
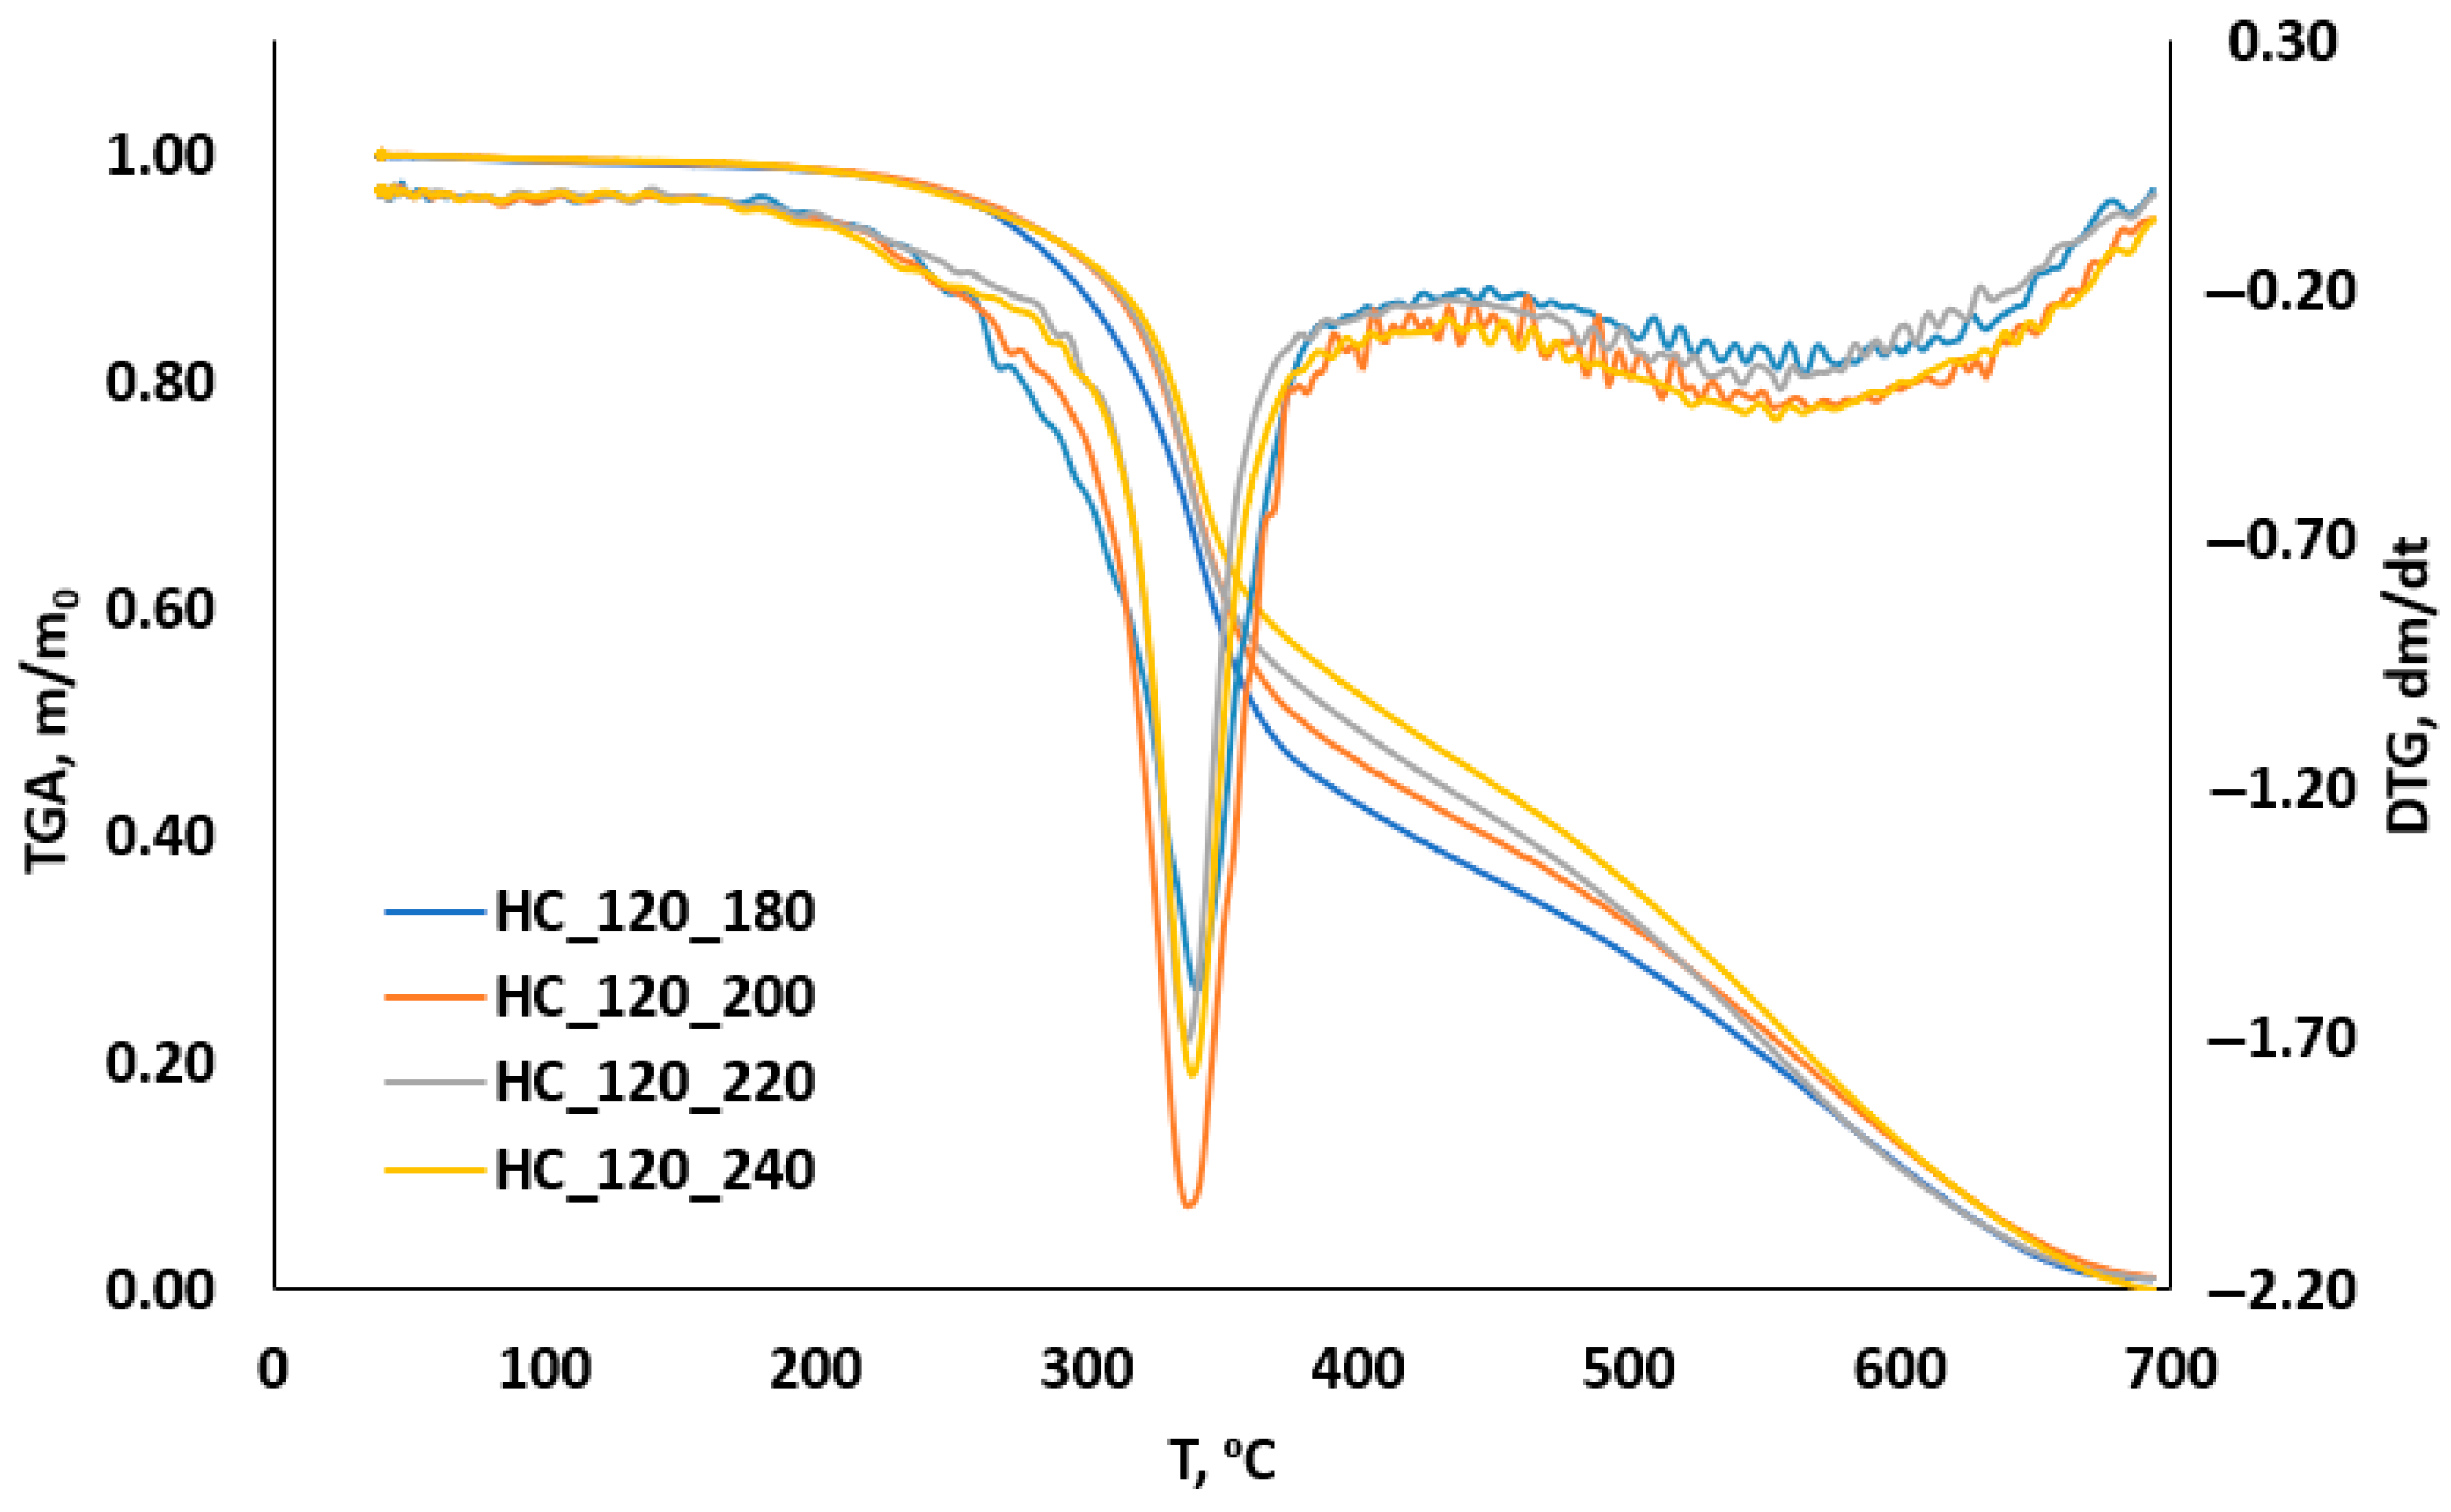
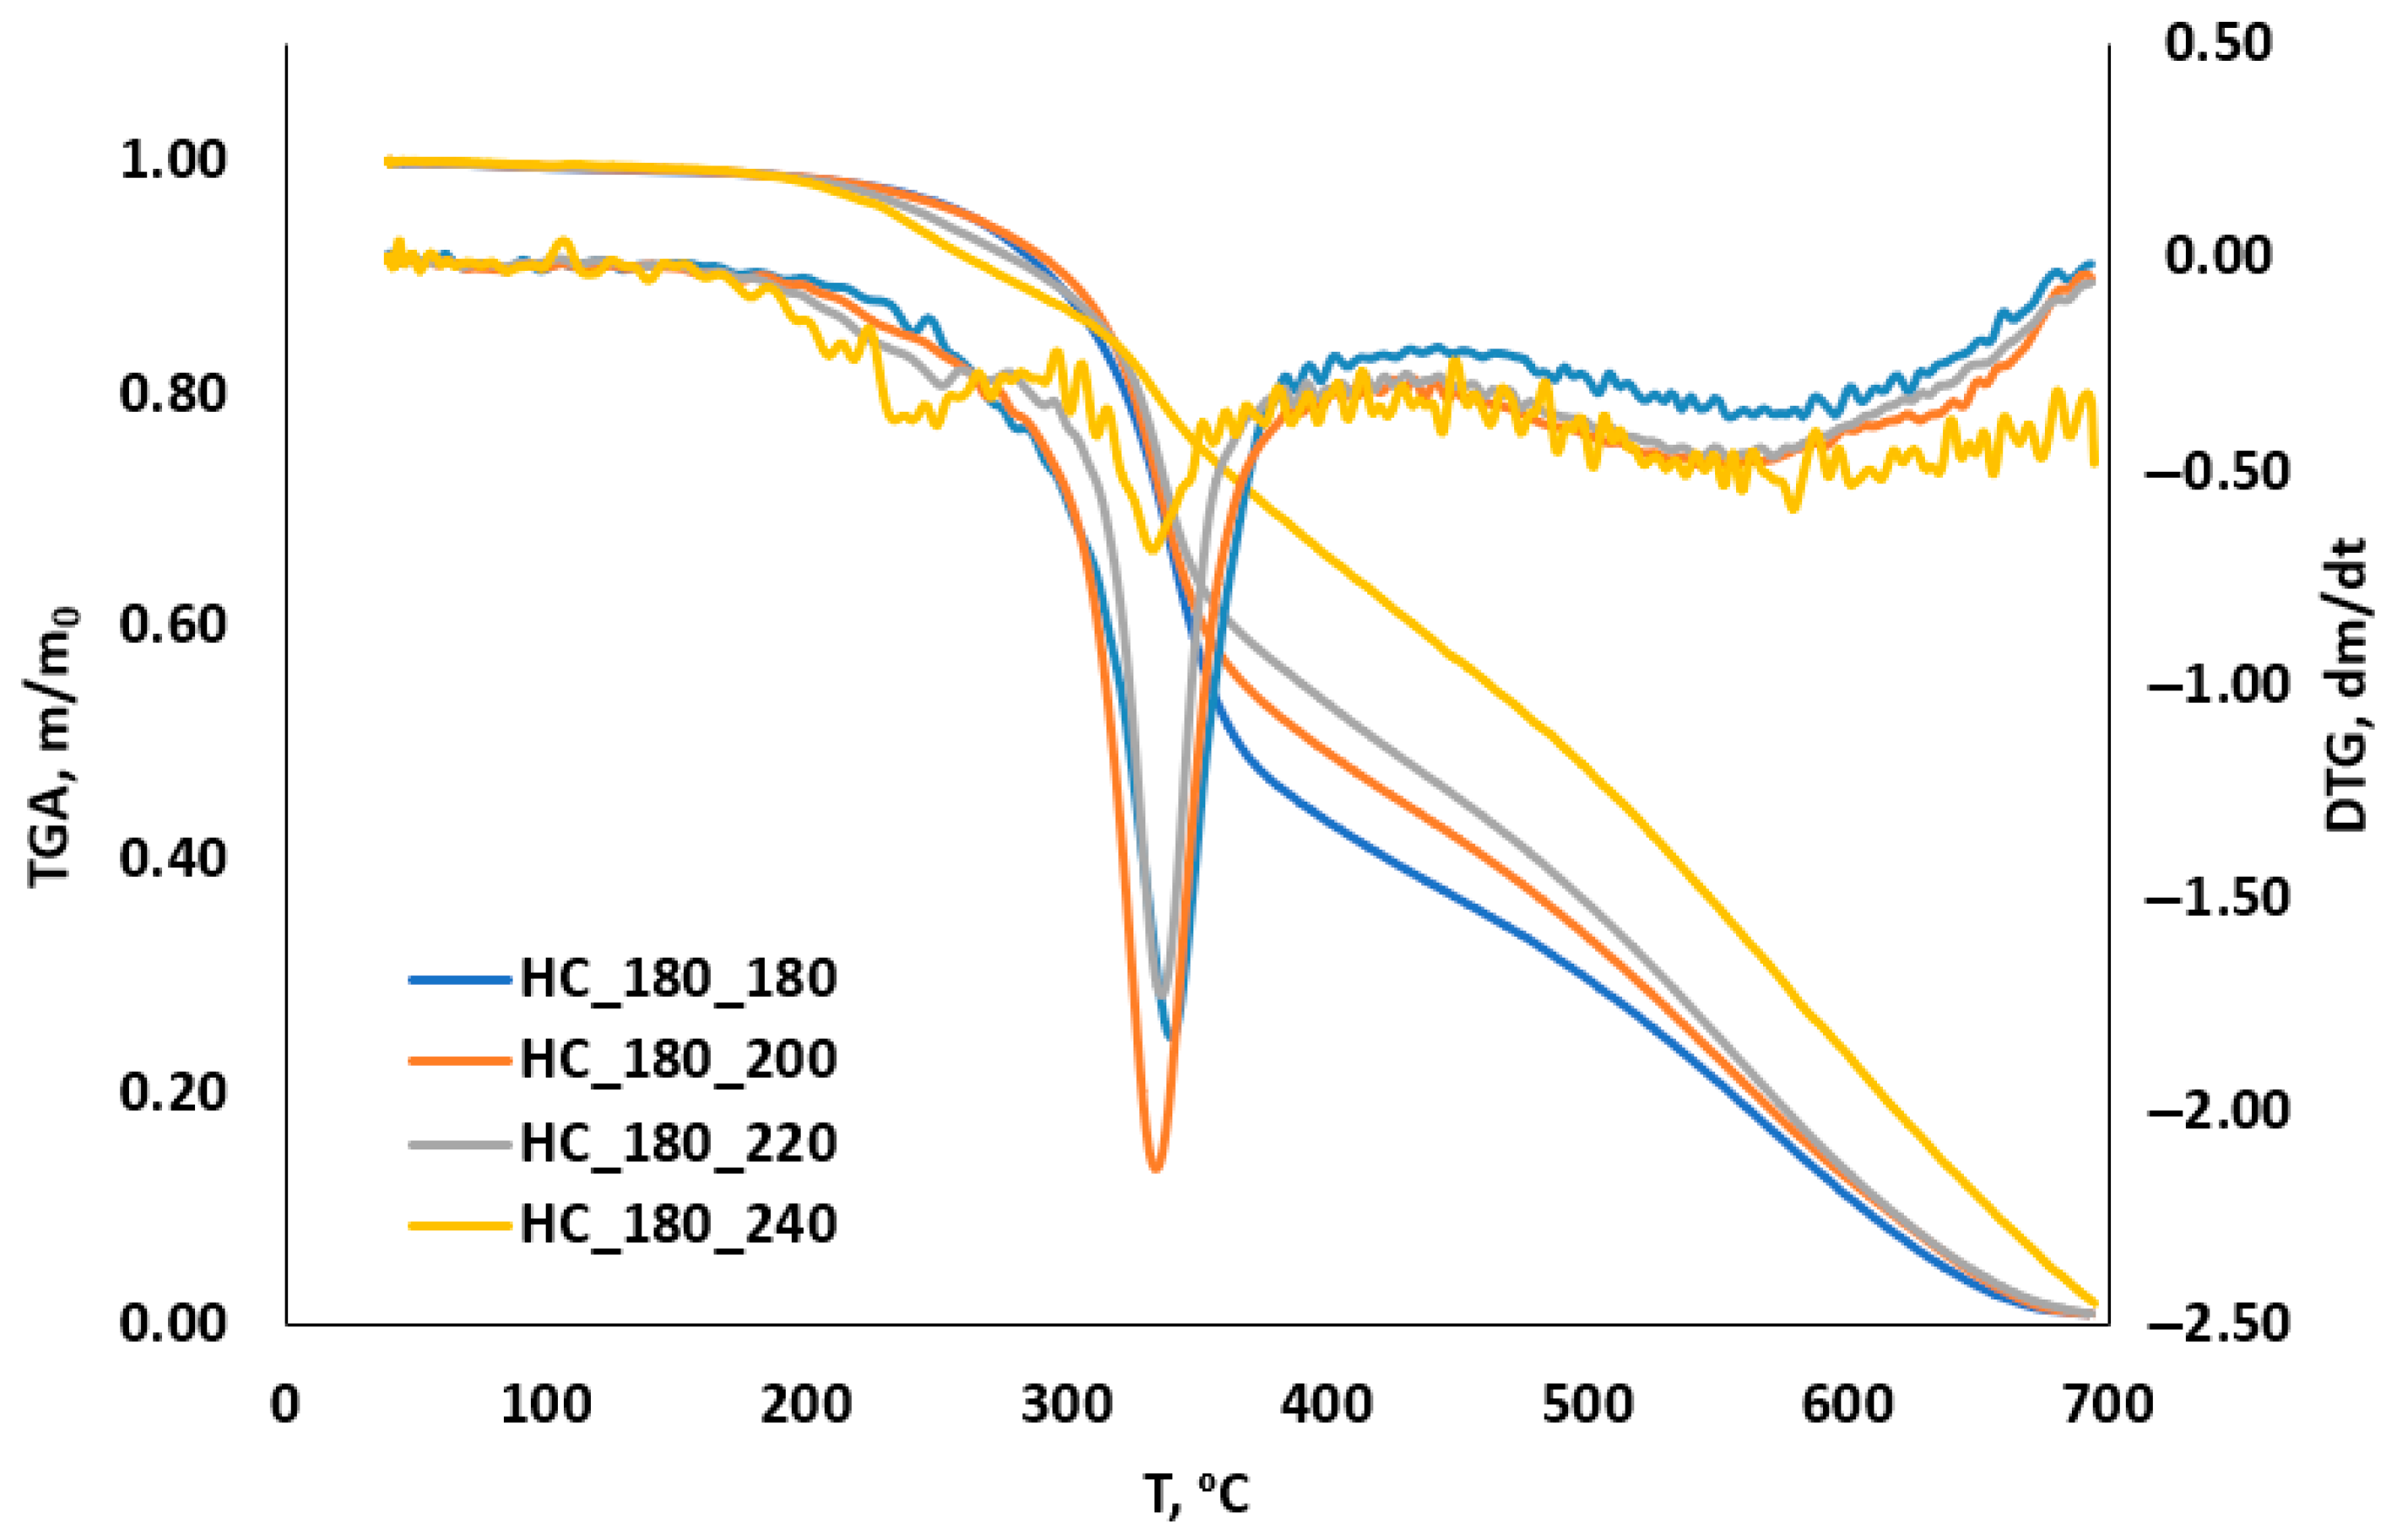
The described pattern becomes more and more evident for the 120 and 180 min series, for which only one centered peak is found (Figure 8 and Figure 9, respectively).
Not only the shape, but the temperature at which they are located on the TGA curves is also very informative. The characteristic peak location has been displayed in Table 1, as well as the corresponding residual mass. The expected higher resistance to degradation for HCs made at higher temperatures can be seen along the series, not only with temperature but also with time.
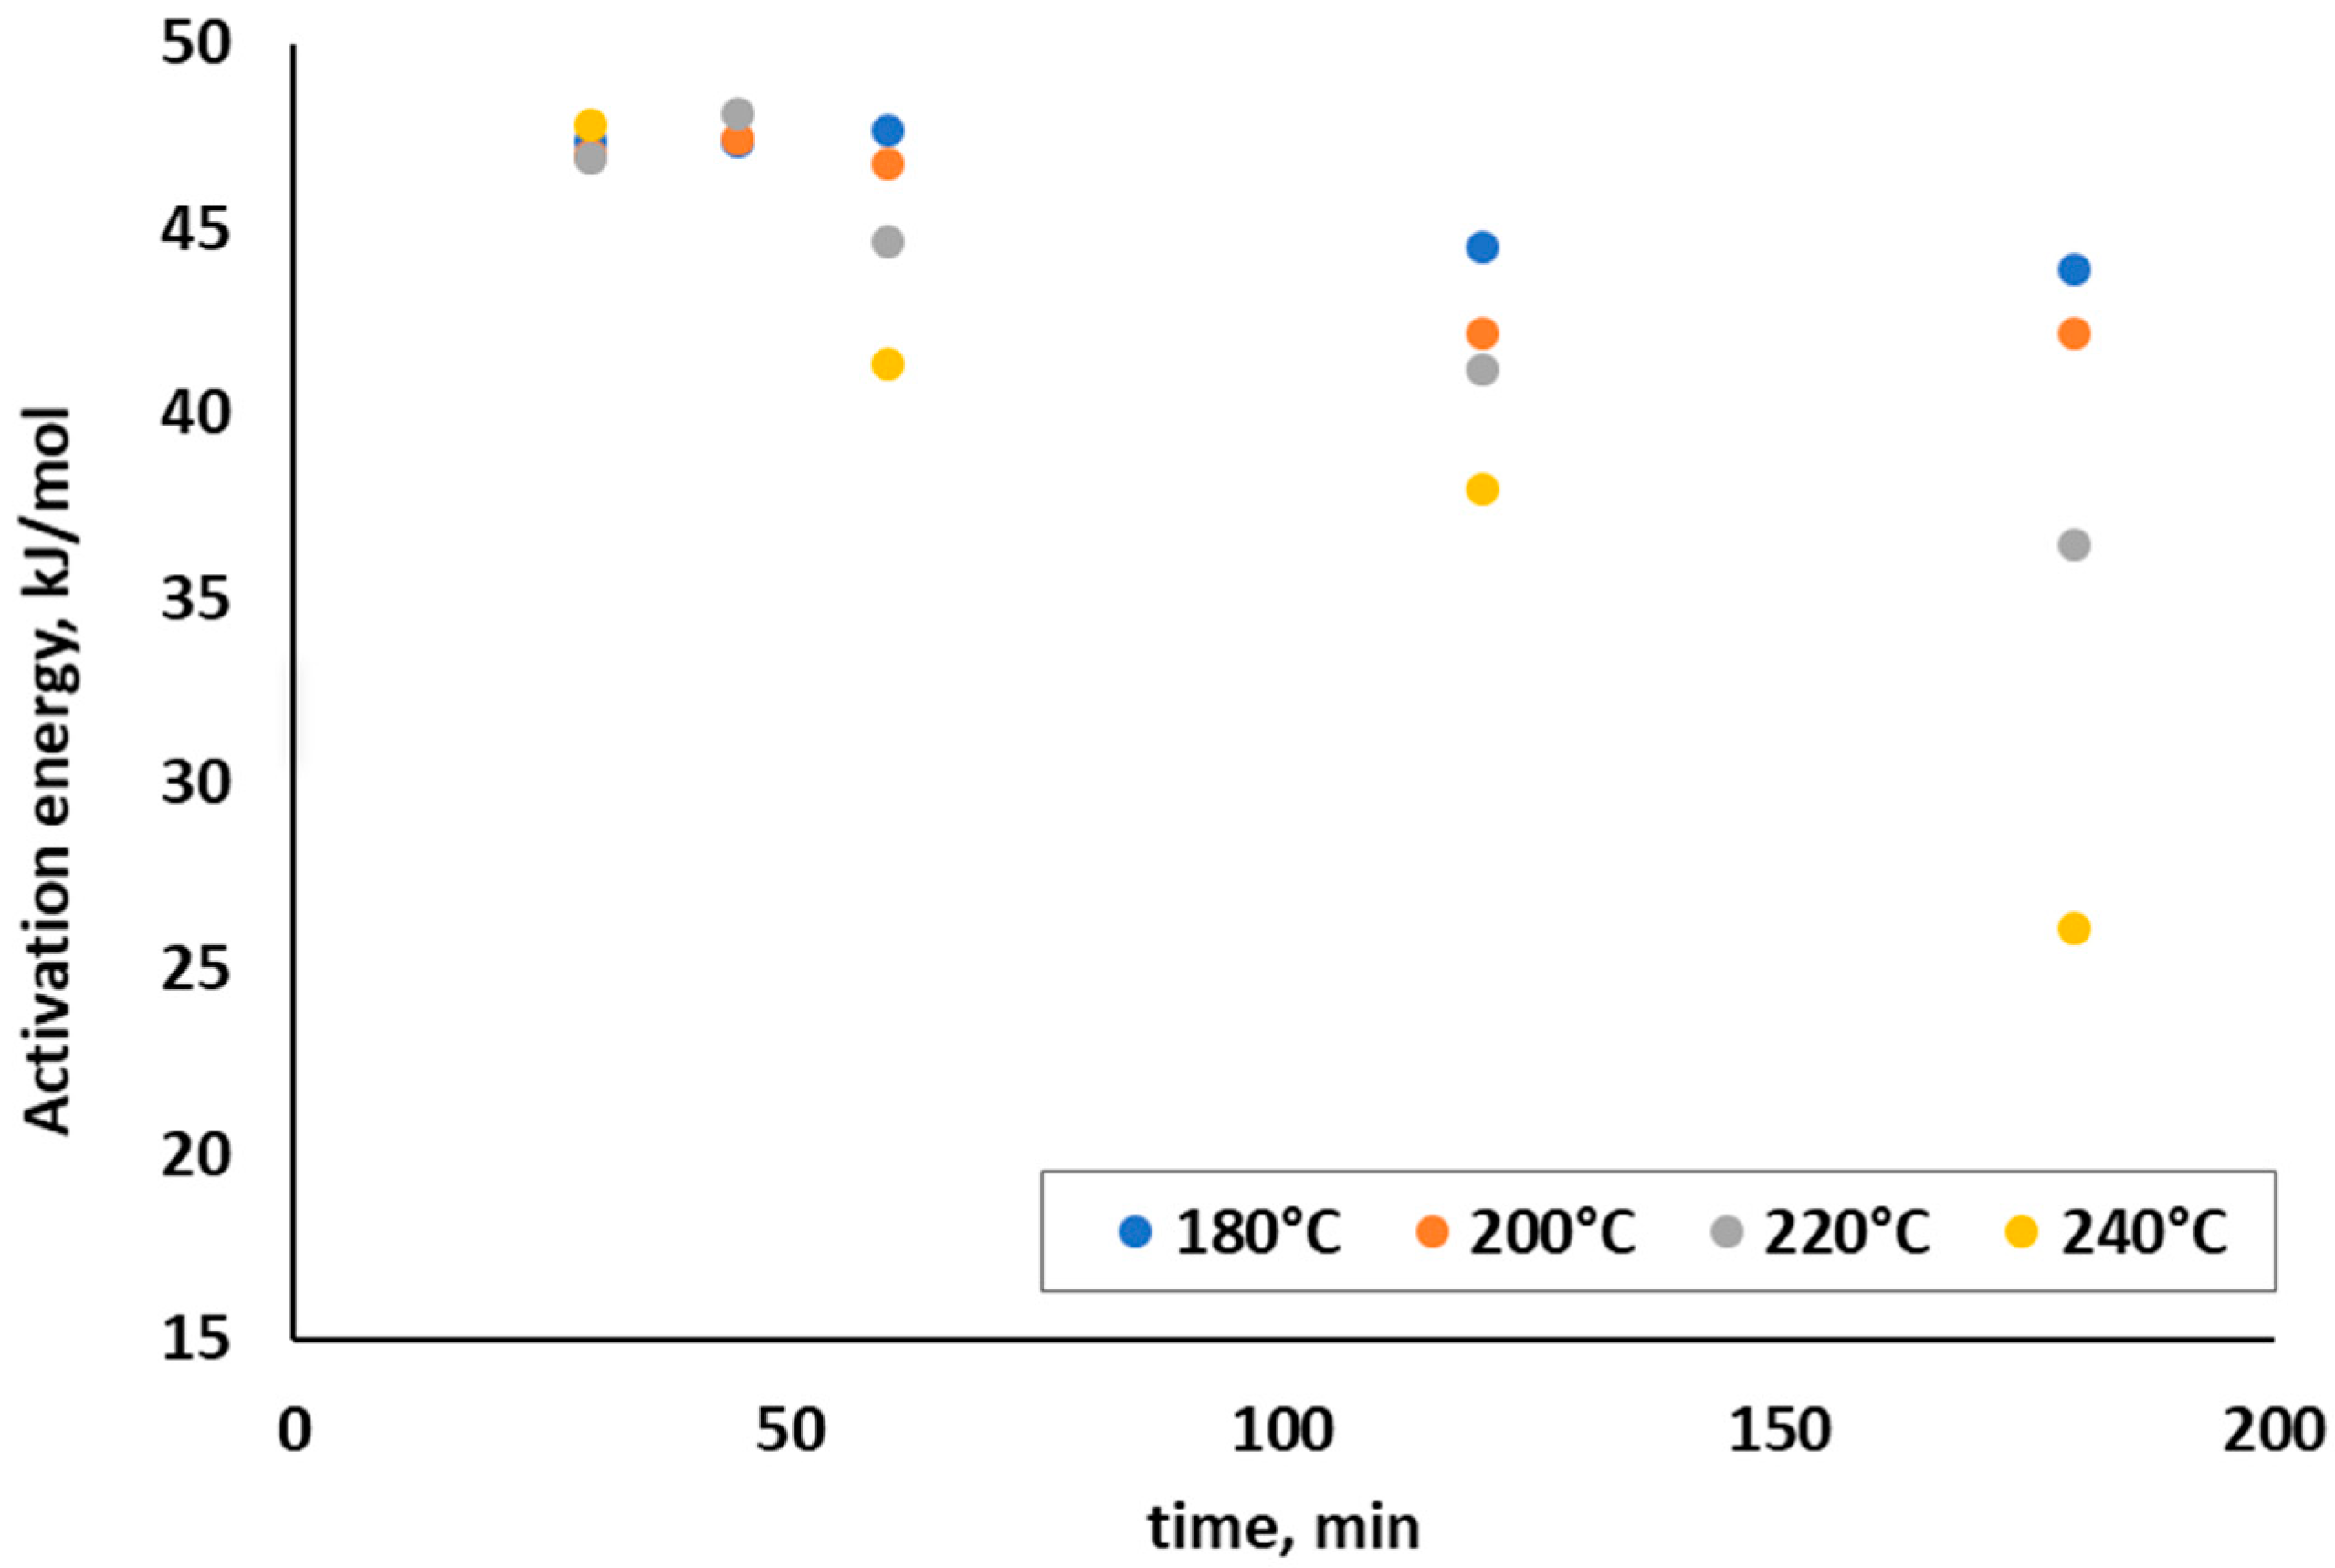
By applying Equation (3), the values of Activation Energy associated with the combustion of the HCs produced have been plotted in Figure 10. Very good fitting correlations were obtained in all cases, with R2 values close to 1. Plots of the experimental data and tendency lines, as deduced from the model, have been included as Supplementary Material (Figure S1). In general, the values show very slight changes with temperature and an almost null effect of time (again, after 45 min). These values are slightly lower than those found in the literature by other authors with HCs obtained by other feedstocks.
In relation to the values of the pre-exponential factor, the values obtained from the intercept of Equation (3) with the experimental data were in the range of 0.25–2.34 s−1. They increased slightly with temperature and time.
3.2. Thermoeconomical Analysis of Coupling HTC to Combustion in a Thermal Plant—Case Study
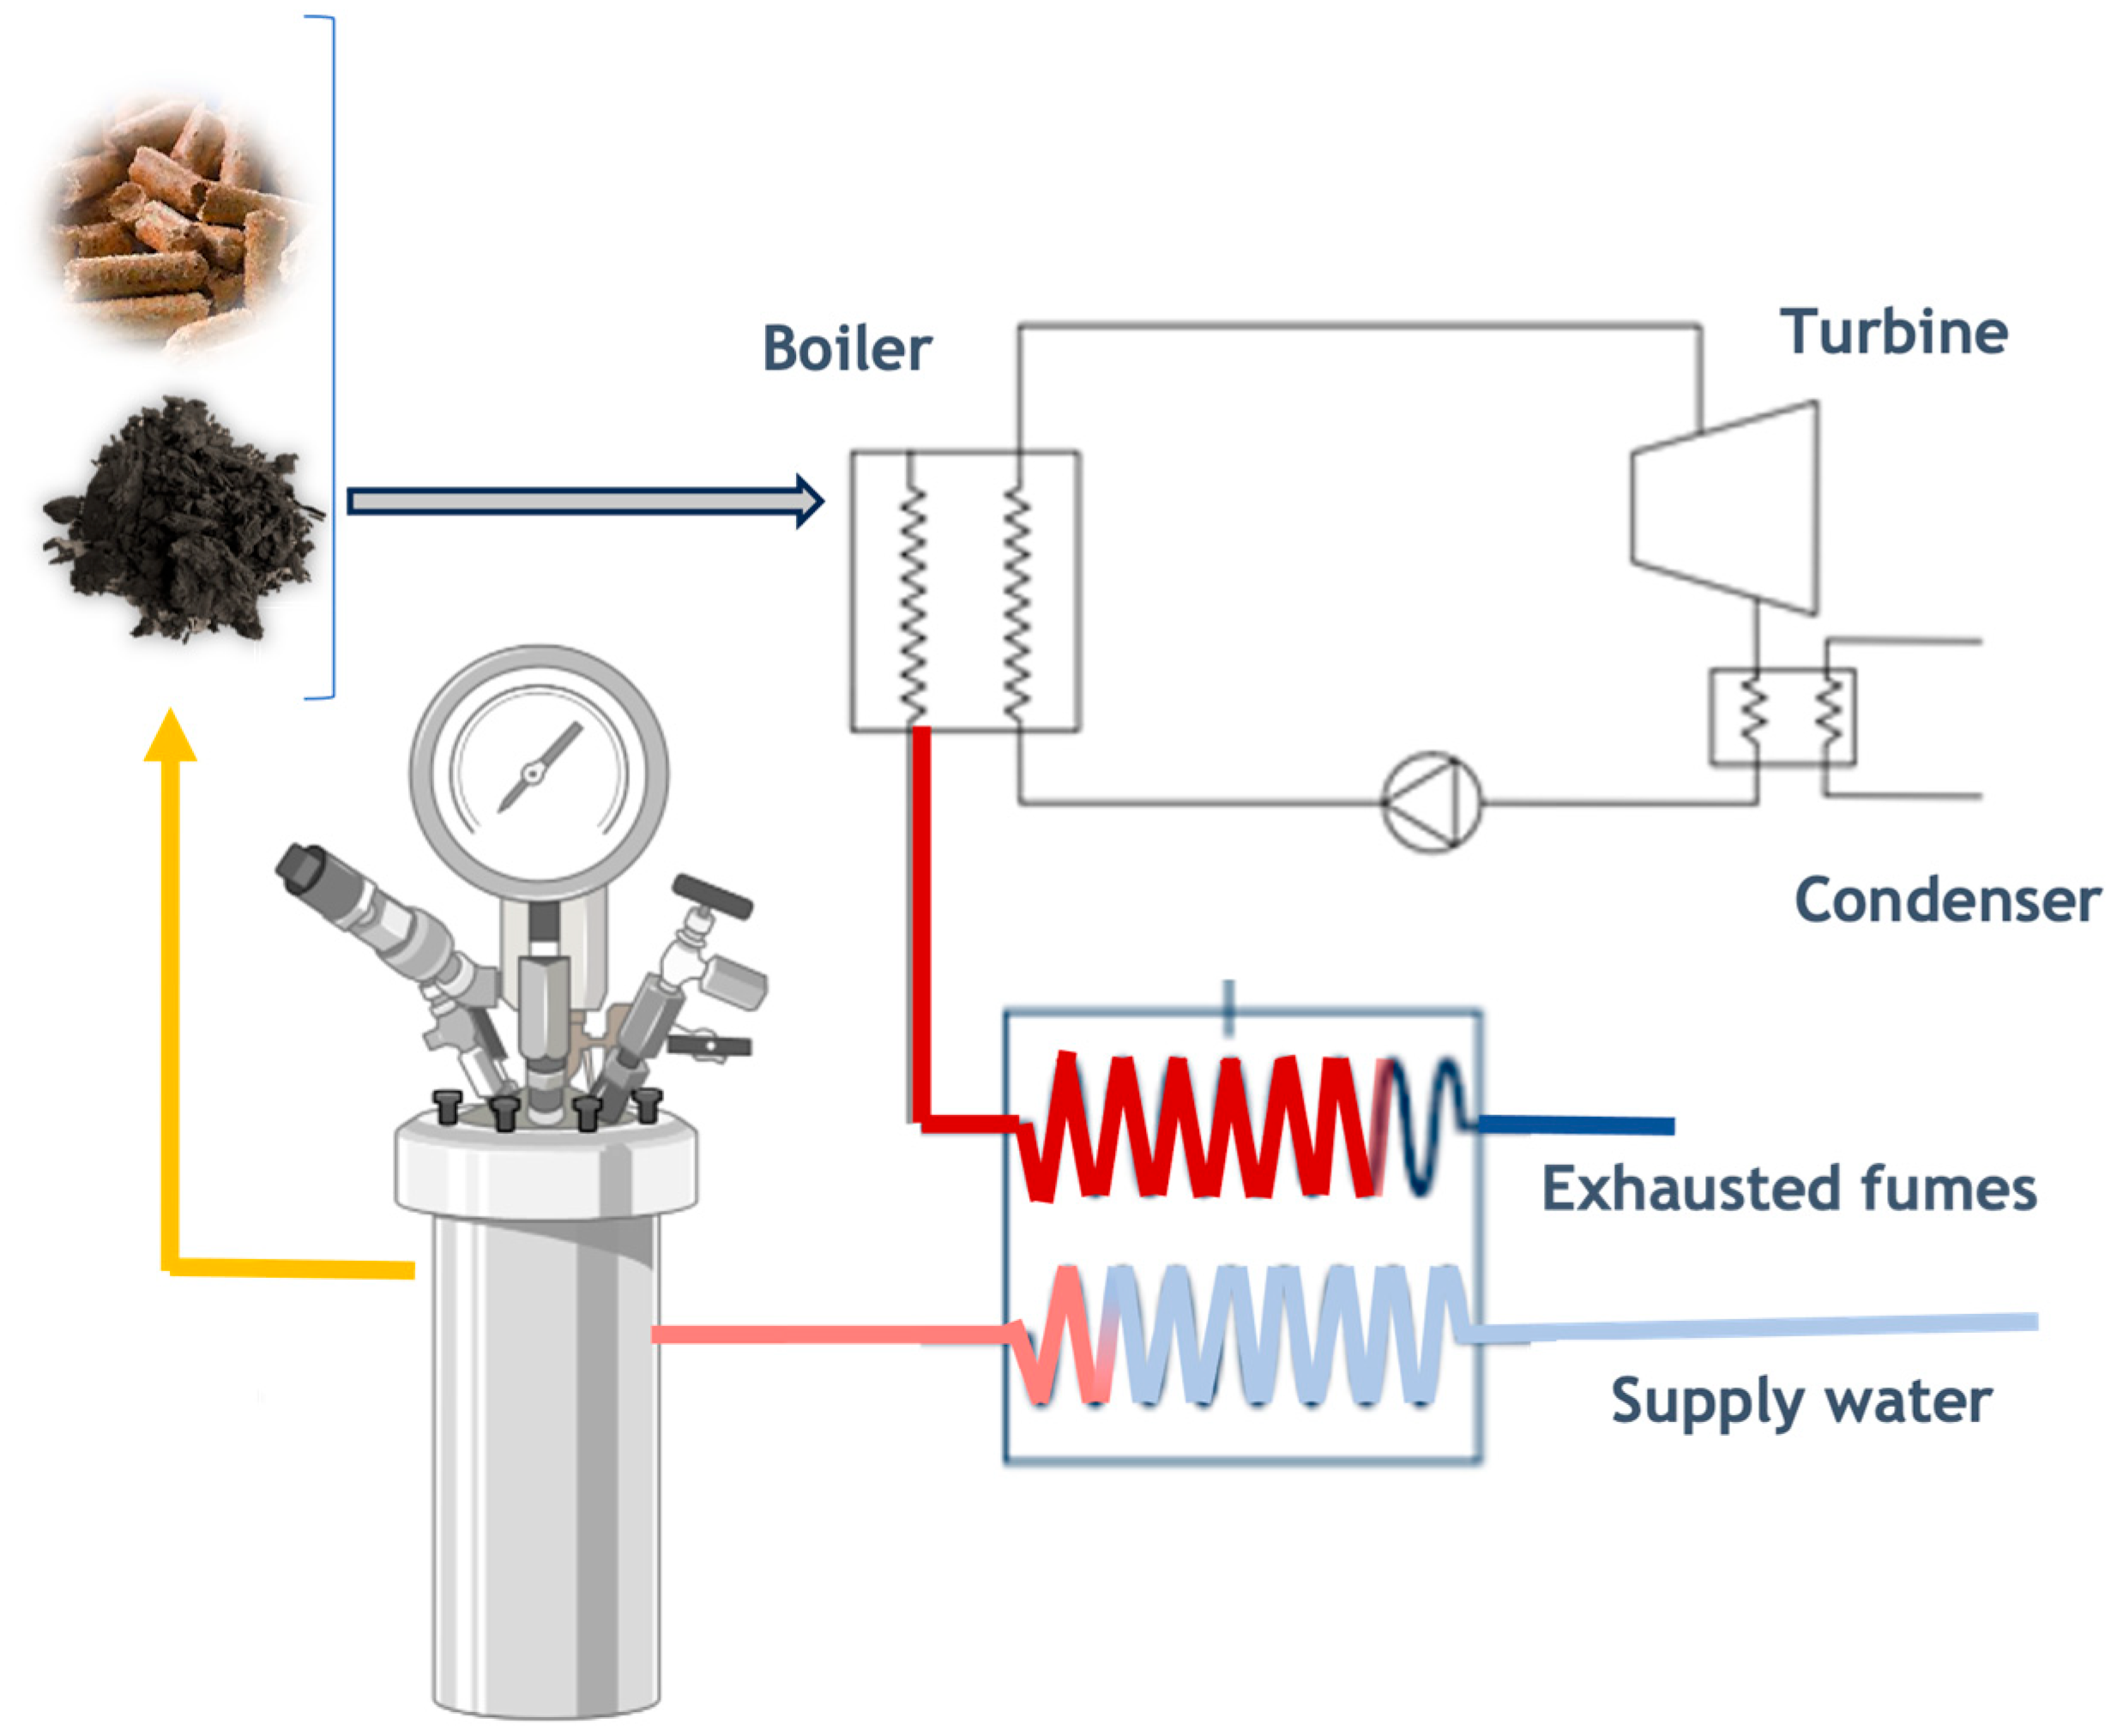
This section aimed to develop a preliminary approach for the coupling of HTC to a cogeneration thermal plant run through a Rankine cycle. The starting scheme of the cogeneration installation is shown in Figure 11.
The proposed HTC installation aims to take advantage of the energy of the flue gases from the boiler, which are expelled from the thermal plant chimney at high temperatures, to heat the water used in the reactors in which HTC is carried out. Subsequently, the HC obtained in the process will be used to replace at least a fraction of the fuel used in the boiler (in this case, biomass pellets). This would in turn provide economic savings for the plant due to the enhanced heating value of the blend used in the co-combustion or the savings of pellet load, which would make the installation more independent from the external supply.
As can be seen in Figure 11, the flue gases from the combustion of biomass in the main cycle boiler pass to an exchanger where they provide part of their energy and heat the water to the HTC reactor inlet temperature. Subsequently, these flue gases are expelled into the atmosphere at a lower temperature, decreasing the losses by the sensible heat of the flue gases so that the overall plan efficiency improves. On the other hand, the HTC processing water (PW) could be used cyclically and then be derived to a treatment plant where a valuable number of salts and organic compounds can be recovered through different procedures.
This work does not intend to establish a complete description of the configuration that the cogeneration power plant should have, but rather to establish the bases that allow for an adequate configuration of the installation. The following sections explain the steps carried out to establish these bases.
Table 2 shows the starting data necessary for calculation. The boiler efficiency was assumed to be 80%. For this first analysis, the turbine power is not a necessary starting point. With this basic information, a fast and efficient tool is achieved that is automatically updated by varying only a few parameters.
These data were used to calculate various characteristic combustion parameters in the boiler. First, the lower heating value (LHV) of the pellets used in the boiler per kg of pellets was calculated using Equation (4), where PX is the proportion of each element/wt./wt.
Then, according to Equation (5), the mass flow rate of fuel required to be supplied to the boiler can be obtained, depending on the boiler power and its efficiency and the LHV value calculated according to Equation (4):
In turn, with the corresponding combustion equations, the volume of CO2, CO, SO2, H2O, SO2, and N2 per kg of pellets is calculated, according to the data in Table 1. The total volume of flue gases (VT) per second is therefore obtained according to Equation (6):
where VT is the volumetric flow of flue gases in m3 N/s and is the fuel mass flow obtained according to Equation (5) in kg/s.
Finally, the flue gas mass flow rate can be obtained from Equation (7):
where Q is the flue gases’ mass flow in kg/s, VT is obtained by Equation (6) and is the flue gases’ density in kg/m3.
The volume of flue gases (MF) produced by the boiler, calculated according to Equation (8), is necessary to carry out the energy balance in the exchanger.
where MF is the kg of flue gases per kg of fuel and Q and are calculated by Equations (7) and (5), respectively.
3.2.1. Analysis of Reactor Heating
The HTC temperature was set at 200 °C since this condition guarantees moderate degradation and SY and also corresponds to the temperature of the flue gases from the boiler as the thermal fluid.
According to Figure 11, the process water, heated by the flue gases that have been sent directly to the exchanger, must enter the HTC reactor at a temperature that gives rise to an equilibrium temperature of the biomass–water mixture equal to 200 °C. Once the reactor tank is filled with the PW, an upper hatch would be opened and the biomass would drop down and enter at an ambient temperature of approximately 25 °C. The biomass/water ratio is set at 0.3 kg biomass per kg water based on previous experiences, and the Cp of the biomass is assumed to be 2.5 kJ·kg−1°C −1. The water is in a saturated liquid state, with the fraction of saturated steam being less than 0.1%. Under these conditions, the Cp (in Joule) of water can be described by Equation (9):
where T is the water temperature in Kelvin.
For the calculations, it must be considered that the balance data are per kg of fuel (Table 3), which will consist of wood pellets. The price of these pellets was assumed to be 0.45 €/kg. With an LHV of 4.854 kWh/kg, 1.234 kWh/kg of electrical energy will be produced, with a price of 0.15€ (estimated) for each kWh produced. As mentioned above, the project aims to establish a basis for further, more detailed thermo-economic studies. It is obvious that the economic value of electricity production is cyclical and will depend on the conditions of the electricity market and current legislation.
According to Table 3, once we have the LHV of the boiler fuel, it is enough to multiply this LHV value by the data corresponding to the efficiency of the plant, the boiler, and the alternator. The selling price of electricity will therefore be an immediate value according to this calculated value and the pellet price as established.
Subsequently, the energy balance between the biomass and input water is determined. For a biomass/water ratio equal to 0.3, when setting the equilibrium temperature at 200 °C, the inlet water temperature, Tinl H2O, must be equal to 228.6 °C. This value has been obtained by a simple energy balance in the reactor according to Equation (10):
where Teq is 200 °C, Tinl bio is 25 °C, mbio is 0.3 kg, mH2O is 1 kg, and CP bio is 2.5 kJ·kg−1°C −1. CpH2O is calculated by Equation (9); however, it has been decided to use an average value of this Cp (between the water temperature at 228.6 and Teq). This value depends on the temperature to be calculated according to Equation (10) and is different from the value of Cp of water at the equilibrium temperature. In addition, calculating this Cp is an iterative process because to apply Equation (9) for this calculation, the temperature is necessary.
Then, the energy balance in the heat exchanger is carried out. The conditions shown in Table 4 are established, and it is considered that the Cp of the flue gases is constant. In Table 4, CpH2O is the average value between the Cp of the water at the temperature of 228.6 °C calculated above and the Cp at the temperature of the water at 25 °C; according to Equation (9), Mflue gases is calculated according to Equation (8). Tout H2O in this calculation is the same as the reactor inlet temperature previously calculated. The rest of the data have been fixed.
Therefore, with the values in Table 4, the flue gases produced per kg of fuel, with the imposed conditions, allow heating 2.249 kg of water (mH2O), as calculated by Equation (11):
As can be seen, for the starting power plant, coupling an HTC reactor using the flue gases produced in the boiler is energetically feasible. Thus, to maintain an HTC reaction at 200 °C, the required supply water temperature and flow rate are technically feasible to achieve.
3.2.2. Hydrochar Production
With all the data provided in the previous sections, an estimate of hydrochar production can be made. The input data for these calculations include the SY (experimentally determined), as well as the HHV value. As explained above, a comprehensive economic study is beyond the scope of this work. However, very interesting preliminary conclusions can be drawn from a practical point of view. In the example presented in Table 5 (corresponding to Carthamus cake), as this material has a significant percentage of fat, the calorific value is quite high. This fat is extracted in the HTC reaction, thus reducing the calorific value of the final product. Only when the hydrochar fraction in the product is high is higher HHV than the starting biomass achieved. Table 5 shows the substitutable original pellet fuel fraction in the case of an HC product at 200 °C.
The mass of biomass treated is calculated according to Equation (12) and the mass of HC produced is calculated according to Equation (13). The fraction of original fuel (pellets) substitutable by the HC produced has been calculated according to Equation (14). The estimated price of this HC is determined with the calculated fraction, Equation (14), applied to the original pellet price (0.45 €/kg).
where 0.3 is the ratio biomass/water established above and mH2O is calculated according to Equation (11).
where Treated biomass is calculated according to Equation (12) and SY is determined experimentally (average value of all HCs produced at 200 °C), as described in Section 2.2.
where mass HC· LHVHC is calculated immediately in Table 5 and LHV original pellets is calculated according to Equation (4).
HHVHC is obtained experimentally too, as an average value of all HCs produced at 200 °C. LHVHC is calculated according to Equation (15):
where H is the %H (average value) and moisture is %Moisture according to Table 5, which have been determined, as well as SY, experimentally.
4. Conclusions
Carthamus cake, the waste generated after Carthamus is used, can find a valorization path by means of hydrothermal treatment. A greater temperature involves a higher energy densification and gives HCs with HHV in the range of 20–29 MJ/kg, although it also involves a lower SY; at least 30 min of reaction are needed to guarantee the target temperature is attained for biomass particles. These materials made under more severe conditions are also more stable to thermal degradation and have lower O/C ratios.
The coupled use of HTC and combustion was analyzed and proved to be suitable to improve the overall efficiency of the thermal plant. The HTC reaction was performed using the boiler exhaust flue gases, and a mass flow of water of 2.249 kg/s by kg of fuel with an inlet temperature in the reactor of 228.6 °C is necessary. With these conditions, it would be possible to produce 0.46 kg/Kg of fuel of HCs from Carthamus cake, which would allow for replacing up to 54.24% of the original pellets in the boiler, maintaining the established operating conditions.
Supplementary Materials
The following supporting information can be downloaded at: https://0-www-mdpi-com.brum.beds.ac.uk/article/10.3390/fire7040106/s1.
Author Contributions
Conceptualization, S.R. and B.L.; methodology, J.M.D.-R.; formal analysis, J.M.D.-R. and M.A.; investigation, J.M.D.-R. and M.A.; writing—original draft preparation, J.M.D.-R.; writing—review and editing, J.M.D.-R., M.A. and B.L.; visualization, J.M.D.-R., M.A. and B.L; supervision, S.R.; project administration, S.R. and B.L.; funding acquisition, S.R. All authors have read and agreed to the published version of the manuscript.
Funding
This research was funded by Agencia Española de Investigación with financial help through project PID2020-116144RB-I00/AEI/10.13039/501100011033, and to CYTED programme through net RIMSGES.
Institutional Review Board Statement
Not applicable.
Acknowledgments
The authors are thankful to SAIUEX (Servicios de Apoyo a la Investigación de la UEX) for their support with the characterization analysis.
Conflicts of Interest
The authors declare no conflicts of interest.
References
- Food and Agriculture Organization of the United Nations. Crops and Livestock Products, 2015–2022. Available online: https://www.fao.org/faostat/en/#data/QCL/visualize (accessed on 3 January 2024).
- Rodríguez-Felix, F.; López-Cota, A.G.; Moreno-Vásquez, M.J.; Graciano-Verdugo, A.Z.; Quintero-Reyes, I.E.; Del-Toro-Sánchez, C.L.; Tapia-Hernández, J.A. Sustainable-green synthesis of silver nanoparticles using safflower (Carthamus tinctorius L.) waste extract and its antibacterial activity. Heliyon 2021, 7, e06923. [Google Scholar] [CrossRef] [PubMed]
- Nogales-Delgado, S.; Encinar, J.M.; Cortés, Á.G. High oleic safflower oil as a feedstock for stable biodiesel and biolubricant production. Ind. Crops Prod. 2021, 170, 113701. [Google Scholar] [CrossRef]
- Yeşilyurt, M.K.; Cesur, C.; Aslan, V.; Yilbaşi, Z. The production of biodiesel from safflower (Carthamus tinctorius L.) oil as a potential feedstock and its usage in compression ignition engine: A comprehensive review. Renew. Sustain. Energy Rev. 2020, 119, 109574. [Google Scholar] [CrossRef]
- Esendal, E.; Arslan, B.; Paşa, C. Effect of winter and spring sowing on yield and plant traits of safflower (Carthamus tinctorius L.). In Proceedings of the 7th International Safflower Conference, Wagga Wagga, NSW, Australia, 3–6 November 2008. [Google Scholar]
- Zanetti, F.; Angelini, L.G.; Berzuini, S.; Foschi, L.; Clemente, C.; Ferioli, F.; Vecchi, A.; Rossi, A.; Monti, A.; Tavarini, S. Safflower (Carthamus tinctorius L.) a winter multipurpose oilseed crop for the Mediterranean region: Lesson learnt from on-farm trials. Ind. Crops Prod. 2022, 184, 115042. [Google Scholar] [CrossRef]
- Zhai, J.; Ji, Z.; Jin, X.; Du, X.; Cao, L.; Zheng, W. Meta-Analysis of the Effect of Honghua Injection in the Treatment of Coronary Heart Disease Angina Pectoris. Evid.-Based Complement. Altern. Med. eCAM 2022, 2022, 4537043. [Google Scholar] [CrossRef] [PubMed]
- Li, D.; Mündel, H.H. Carthamus tinctorius L. Promoting the Conservation and Use of Underutilized and Neglected Crops, 7th ed.; Institute of Plant Genetics and Crop Plant Research: Gatersleben, Germany; International Plant Genetic Resources Institute: Rome, Italy, 1996; pp. 24–25. [Google Scholar]
- Zhou, X.; Tang, L.; Xu, Y.; Zhou, G.; Wang, Z. Towards a better understanding of medicinal uses of Carthamus tinctorius L. in traditional Chinese medicine: A phytochemical and pharmacological review. J. Ethnopharmacol. 2014, 151, 27–43. [Google Scholar] [CrossRef] [PubMed]
- Sehgal, D.; Raina, S.N.; Devarumath, R.M.; Sasanuma, T.; Sasakuma, T. Nuclear DNA assay in solving issues related to ancestry of the domesticated diploid safflower (Carthamus tinctorius L.) and the polyploid (Carthamus) taxa, and phylogenetic and genomic relationships in the genus Carthamus L. (Asteraceae). Mol. Phylogenet. Evol. 2009, 53, 631–644. [Google Scholar] [CrossRef] [PubMed]
- EUR-Lex. Access to European Union Law: A New Circular Economy Action Plan for a Cleaner and More Competitive Europe. Available online: https://eur-lex.europa.eu/legal-content/EN/TXT/?qid=1583933814386&uri=COM:2020:98:FIN (accessed on 12 May 2023).
- Şensöz, S.; Angin, D. Pyrolysis of safflower (Carthamus tinctorius L.) seed press cake: Part 1. The effects of pyrolysis parameters on the product yields. Bioresour. Technol. 2008, 99, 5492–5497. [Google Scholar] [CrossRef] [PubMed]
- Şensöz, S.; Angin, D. Pyrolysis of safflower (Carthamus tinctorius L.) seed press cake in a fixed-bed reactor: Part 2. Structural characterization of pyrolysis bio-oils. Bioresour. Technol. 2008, 99, 5498–5504. [Google Scholar] [CrossRef] [PubMed]
- Angin, D. Effect of pyrolysis temperature and heating rate on biochar obtained from pyrolysis of safflower seed press cake. Bioresour. Technol. 2013, 128, 593–597. [Google Scholar] [CrossRef] [PubMed]
- Funke, A.; Ziegler, F. Hydrothermal carbonization of biomass: A summary and discussion of chemical mechanisms for process engineering. Biofuels Bioprod. Biorefining 2010, 4, 160–177. [Google Scholar] [CrossRef]
- Gil, M.V.; Casal, D.; Pevida, C.; Pis, J.J.; Rubiera, F. Thermal behaviour and kinetics of coal/biomass blends during co-combustion. Bioresour. Technol. 2010, 101, 5601–5608. [Google Scholar] [CrossRef] [PubMed]
- Yorulmaz, S.Y.; Atimtay, A.T. Investigation of combustion kinetics of treated and untreated waste wood samples with thermogravimetric analysis. Fuel Process. Technol. 2009, 90, 939–946. [Google Scholar] [CrossRef]
- Lachos-Perez, D.; Brown, A.B.; Mudhoo, A.; Martinez, J.; Timko, M.T.; Rostagno, M.A.; Forster-Carneiro, T. Applications of subcritical and supercritical water conditions for extraction, hydrolysis, gasification, and carbonization of biomass: A critical review. Biofuel Res. J. 2017, 4, 611–626. [Google Scholar] [CrossRef]
- Reza, M.T.; Yan, W.; Uddin, M.H.; Lynam, J.G.; Hoekman, S.K.; Coronella, C.J.; Vásquez, V.R. Reaction kinetics of hydrothermal carbonization of loblolly pine. Bioresour. Technol. 2013, 139, 161–169. [Google Scholar] [CrossRef] [PubMed]
- Álvarez-Murillo, A.; Sabio, E.; Ledesma, B.; Román, S.; González-García, C. Generation of biofuel from hydrothermal carbonization of cellulose. Kinetics modelling. Energy 2016, 94, 600–608. [Google Scholar] [CrossRef]
- Ischia, G.; Cutillo, M.; Guella, G.; Bazzanella, N.; Cazzanelli, M.; Orlandi, M.; Miotello, A.; Fiori, L. Hydrothermal carbonization of glucose: Secondary char properties, reaction pathways, and kinetics. Chem. Eng. J. 2022, 449, 137827. [Google Scholar] [CrossRef]
- Román, S.; Libra, J.; Berge, N.; Sabio, E.; Ro, K.; Li, L.; Ledesma, B.; Álvarez, A.; Bae, S. Hydrothermal carbonization: Modeling, final properties design and applications: A review. Energies 2018, 11, 216. [Google Scholar] [CrossRef]
- Kambo, H.S.; Dutta, A. A comparative review of biochar and hydrochar in terms of production, physico-chemical properties and applications. Renew. Sustain. Energy Rev. 2015, 45, 359–378. [Google Scholar] [CrossRef]
- Román, S.; Ledesma, B.; Álvarez, A.; Coronella, C.; Qaramaleki, S.V. Suitability of hydrothermal carbonization to convert water hyacinth to added-value products. Renew. Energy 2020, 146, 1649–1658. [Google Scholar] [CrossRef]
Figure 1.
Carthamus cake waste from safflower seeds.

Figure 2.
Experimental data of solid yield (SY) vs. time for the HCs obtained at different temperature conditions.
Figure 2.
Experimental data of solid yield (SY) vs. time for the HCs obtained at different temperature conditions.

Figure 3.
Column reactor design (cm), simulated temperature gradient across the reactor column (°C) for a 240 run, and time needed to attain target temperature for each experimental series (COMSOL Multiphysics).
Figure 3.
Column reactor design (cm), simulated temperature gradient across the reactor column (°C) for a 240 run, and time needed to attain target temperature for each experimental series (COMSOL Multiphysics).

Figure 4.
Experimental data of solid High Heating Value (HHV) vs. time for the HCs obtained at different temperature conditions.
Figure 4.
Experimental data of solid High Heating Value (HHV) vs. time for the HCs obtained at different temperature conditions.

Figure 5.
Van Krevelen diagram.

Figure 6.
TGA/DTA curves for HCs made during 30 min.

Figure 7.
TGA/DTA curves for HCs made during 60 min.

Figure 8.
TGA/DTA curves for HCs made during 120 min.

Figure 9.
TGA/DTA curves for HCs made during 180 min.

Figure 10.
Evolution of combustion activation energy with time for HCs made under different temperature conditions.
Figure 10.
Evolution of combustion activation energy with time for HCs made under different temperature conditions.

Figure 11.
Cogeneration thermal plant scheme.


Table 1.
Peak temperature (Tp,°C) and residual mass (g) values for TG/DTG curves.
| Sample (T_reac-time) | Tp1 | m/m0 p1 | DTG p1 | Tp2 | m/m0 p2 | DTG p2 | m/m0 final |
|---|---|---|---|---|---|---|---|
| HC180_30 | 294 | 0.86 | −1.15 | 350 | 0.70 | −1.26 | 0.5 |
| HC200_30 | 298 | 0.85 | −1.31 | 353 | 0.69 | −1.44 | 0.1 |
| HC220_30 | 297 | 0.85 | −1.32 | 349 | 0.7 | −1.46 | 0.1 |
| HC240_30 | 305 | 0.83 | −1.20 | 346 | 0.7 | −1.78 | 0.5 |
| HC180_60 | 299 | 0.83 | −0.92 | 349 | 0.57 | −1.23 | |
| HC200_60 | 347 | 0.60 | −1.61 | - | - | - | |
| HC220_60 | 344 | 0.62 | −2.04 | - | - | - | |
| HC240_60 | 337 | 0.73 | −2.61 | - | - | - | |
| HC180_120 | 340 | 0.66 | −1.59 | - | - | - | |
| HC200_120 | 337 | 0.72 | −2.03 | - | - | - | |
| HC220_120 | 337 | 0.72 | −1.69 | - | - | - | |
| HC240_120 | 339 | 0.74 | −1.77 | - | - | - | |
| HC180_180 | 340 | 0.67 | −1.82 | - | - | - | |
| HC200_180 | 334 | 0.73 | −2.13 | - | - | - | |
| HC220_180 | 336 | 0.73 | −1.72 | - | - | - | |
| HC240_180 | 333 | 0.80 | −0.68 | - | - | - |
Table 2.
Combustion parameters and ultimate composition of the fuel (pellets).
| Ultimate Fuel Composition | % Weigh |
|---|---|
| % C | 50.20 |
| % H | 6.49 |
| % O * | 41.37 |
| % S | 0.04 |
| % N | 0.60 |
| % Ash | 1.30 |
| Combustion Parameters | |
| Excess air coefficient, n | 3 |
| Fraction burned, x | 0.95 |
| Flue gases temperature | 250 °C |
| Flue gases density | 1.34 kg/m3 |
* Balanced.
Table 3.
Initial data for the economic study and power plant parameters.
| Data per kg of Fuel (Pellets) | Value |
|---|---|
| Pellets price | 0.450 € |
| LHV | 4.854 kWh |
| Electricity | 1.234 kWh |
| Electricity price | 0.150 €/kWh |
| Electricity sale | 0.185 € |
| Other Central Parameters | |
| Central efficiency | 33.44% |
| Boiler efficiency | 80% |
| Alternator efficiency | 95% |
| Cp flue gases | 1 kJ/kg °C |
Table 4.
Data for the balance in the exchanger.
| Data per kg of Fuel | Value |
|---|---|
| M flue gases | 20.27 kg |
| CpH2O | 4.426 kJ/kg °C |
| Cp flue gases | 1 kJ/kg °C |
| Tinl H2O | 25 °C |
| Tout H2O | 228.6 °C |
| T inl flue gases | 250 °C |
| Tout flue gases | 150 °C |
Table 5.
Production of Carthamus cake hydrochars (HC).
| Parameters | Obtained Value |
|---|---|
| Treated biomass | 0.675 kg bio./kg pellets |
| Solid Yield (SY) | 67.7% |
| mass HC | 0.46 kg HC/kg pellets |
| HHVHC | 21.77 MJ/kg |
| LHVHC | 20.75 MJ/kg |
| mass HC · HHVHC | 2.76 kWh |
| mass HC · LHVHC | 2.63 kWh |
| Subs. original pellet fraction | 54.24% |
| HC estimated price | 0.244 € |
| % H (HC) | 5% |
| % Moisture (HC) | 0% |
Disclaimer/Publisher’s Note: The statements, opinions and data contained in all publications are solely those of the individual author(s) and contributor(s) and not of MDPI and/or the editor(s). MDPI and/or the editor(s) disclaim responsibility for any injury to people or property resulting from any ideas, methods, instructions or products referred to in the content. |
© 2024 by the authors. Licensee MDPI, Basel, Switzerland. This article is an open access article distributed under the terms and conditions of the Creative Commons Attribution (CC BY) license (https://creativecommons.org/licenses/by/4.0/).
Share and Cite
MDPI and ACS Style
Díaz-Rasero, J.M.; Ledesma, B.; Alonso, M.; Román, S. Upgrading Carthamus by HTC: Improvement of Combustion Properties. Fire 2024, 7, 106. https://0-doi-org.brum.beds.ac.uk/10.3390/fire7040106
AMA Style
Díaz-Rasero JM, Ledesma B, Alonso M, Román S. Upgrading Carthamus by HTC: Improvement of Combustion Properties. Fire. 2024; 7(4):106. https://0-doi-org.brum.beds.ac.uk/10.3390/fire7040106
Chicago/Turabian StyleDíaz-Rasero, José Manuel, Beatriz Ledesma, María Alonso, and Silvia Román. 2024. "Upgrading Carthamus by HTC: Improvement of Combustion Properties" Fire 7, no. 4: 106. https://0-doi-org.brum.beds.ac.uk/10.3390/fire7040106