
Evaluation of Available Safety Egress Time (ASET) in Performance-Based Design (PBD) Using CFAST


1
Department of Disaster Prevention, Graduate School, Daejeon University, 62 Daehak-ro, Dong-Gu, Daejeon 34520, Republic of Korea
2
Department of Fire and Disaster Prevention, Daejeon University, 62 Daehak-ro, Dong-Gu, Daejeon 34520, Republic of Korea
*
Author to whom correspondence should be addressed.
Fire 2024, 7(4), 108; https://0-doi-org.brum.beds.ac.uk/10.3390/fire7040108
Submission received: 4 March 2024
/
Revised: 21 March 2024
/
Accepted: 22 March 2024
/
Published: 25 March 2024
(This article belongs to the Special Issue Performance-Based Design in Structural Fire Engineering, Volume II)
Abstract
:In South Korea, the need to link fire and evacuation simulations to compare the available safety egress time (ASET) and required safety egress time (RSET) in real time when implementing performance-based design in buildings is increasing. Accordingly, the Consolidated Model of Fire Growth and Smoke Transport (CFAST) has been discussed as an alternative to the fire dynamics simulator, which requires high computational costs, sufficient experience in fire dynamics numerical calculations, and various input parameters and faces limitations in integration with evacuation simulations. A method for establishing a reasonable computational domain to predict the activation times of smoke and heat detectors has been proposed. This study examined the validity of using CFAST to predict factors relevant to the ASET evaluation. The results showed that CFAST, which solved empirical correlations based on heat release rates, predicted high gas temperatures similarly. Moreover, the applicability of the visibility distance calculation method using smoke concentration outputs from CFAST was examined. The results suggest that despite the limitations of the zone model, CFAST can produce reasonable ASET results. These results are expected to enhance the usability of CFAST in terms of understanding general fire engineering technology and simple fire dynamics trends.
1. Introduction
In South Korea, predicting outcomes for various fire scenarios based on the purpose and use of different buildings is essential for implementing performance-based design (PBD). Generally, PBD is adopted for the fire safety design of buildings, employing engineering-based simulations to address fire hazards. PBD evaluates the fire safety of buildings by comparing the available safety egress time (ASET) and required safety egress time (RSET) obtained through fire and evacuation simulations, respectively. This involves assessing time-related factors for the safety of building occupants in scenarios with a high fire risk. The ASET > RSET is considered safer than the ASET < RSET [1]. For fire simulation, the fire dynamics simulator (FDS) and Consolidated Model of Fire Growth and Smoke Transport (CFAST) are generally used [2,3]. They were developed and validated by the National Institute of Standard and Technology (NIST). For evacuation simulations, Pathfinder [4] developed by Thunderhead Engineering, Simulex [5], and buildingEXODUS [6] are utilized. In conducting these simulations independently, the temperature and concentrations of chemical species from fire simulations are not considered in the location predictions of occupants in evacuation simulations [7].
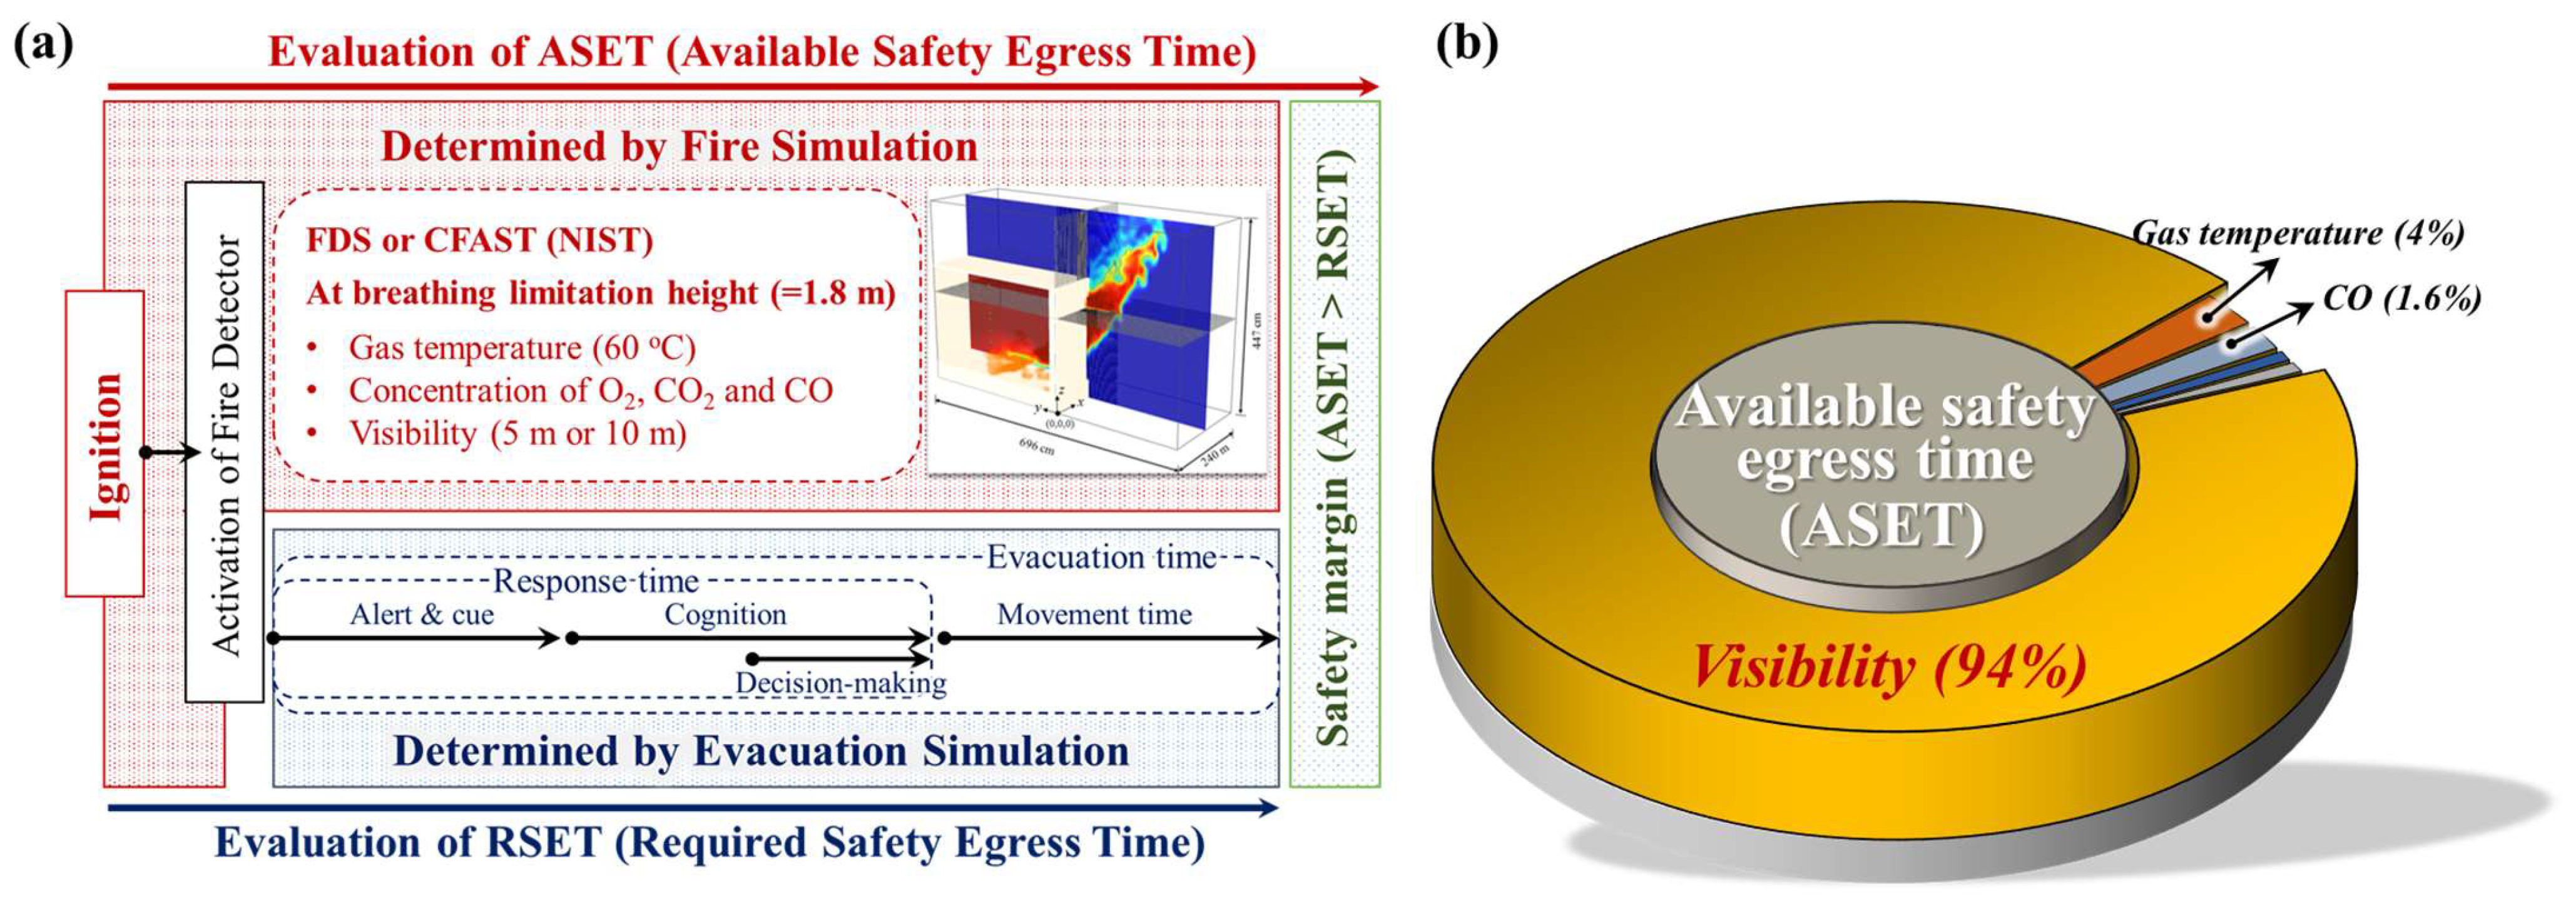
ASET is calculated from the primary results of fire simulations for selected fire scenarios based on the purpose in the PBD implementation. Figure 1a shows the PBD process and evaluation factors for fire and evacuation simulations [8]. ASET evaluates the impact at the height of the breathing limit line (1.8 m) of heat (60 °C), toxic gas concentrations (O2 below 15%, CO2 above 5%, and CO above 1400 ppm), and visibility related to the height of the smoke layer following life safety standards [9]. The visibility is assessed when it is below 5 m in general facilities and below 10 m in relatively high-ceiling assembly and sales facilities. During this process, engineers must simultaneously consider the fundamental prediction uncertainties of the fire modeling and the systematization of interpretation methods and numerical result verification for accurate ASET evaluation. The RSET is the sum of evacuation delay times from evacuation simulations, starting from the activation point of the detectors in the fire simulations. A building is considered safe when the final ASET is larger than the RSET, thereby providing a margin of safety. Figure 1b shows the major parameters that determine the evaluation results among the various parameters calculated for the ASET in the PBD evaluations conducted over the past five years. In 94% of the cases, ASET was determined by visibility [10], thereby indicating the dominant influence and significance of visibility in the ASET evaluation [11].
FDS, commonly used in PBD implementation, continuously performs validation and verification against numerous full-scale fire experiments and is primarily applied due to its ability to efficiently interpret complex fire dynamics using a large eddy simulation (LES) technique [12,13]. However, obtaining reliable predictions with FDS requires accurate physical and numerical input parameters. Specifically, the heat release rate per unit area (HRRPUA) has the highest impact on numerical solutions as a modeling fire source [14]. For accurate predictions of visibility and CO and CO2 concentrations considered in fire safety standards, numerous user-required input parameters, such as the CO and soot yield generated during a fire, are required. Therefore, studies on establishing databases of the experimentally measured heat release rate (HRR), CO concentration, and soot yield for various combustibles under fire conditions have been reported [15,16,17]. To accurately predict detector activation times in the RSET of the PBD implementation in buildings, experimentally measured physical input parameters are presented [18,19]. As such, the use of various input parameters can lead to different risk assessments for similar fire scenarios, a critical drawback depending on the user’s discretion in PBD implementation. Furthermore, the grid size significantly affects the accuracy of numerical solutions, thereby rendering the interpretation results less reliable and dependent on extensive numerical experiences.
CFAST, a typical fire modeling tool applying the zone model, assumes uniform properties by dividing the computation domain into upper hot and lower cool layers and considering the interrelation of heat and mass flux across the boundary. Each zone is assumed to be a control volume, and changes over time are considered through empirical correlations using the law of conservation of mass and energy. Thus, understanding fire dynamics is necessary to conceptually simplify fire behavior, with an existing barrier to entry. Although small computational domains provide a relatively good prediction performance, large domains or aspect ratios can reduce the reliability of the results. Based on the nature of the model, the separation of heat and the concentration between the upper and lower layers must be considered, thereby necessitating similar dimensions for the width and height of the computational domain [20]. However, CFAST has advantages including easy operation after short-term training. It can be used on lower-performance computers and requires a significantly low computational cost. It has faster computation times than other analysis tools and a good prediction performance in smaller computational domains. Owing to these advantages, fire engineers and researchers are continuously verifying the accuracy of CFAST based on experimental results [21,22] and have obtained reasonable results from the perspective of the computational cost [23]. Therefore, by providing a setting approach to understand fire dynamics trends through the simple assumptions of CFAST, its practical application for achieving simple and targeted results has been examined.
This study was conducted as part of a project aimed at developing a program for establishing evacuation plans by fire safety managers in a building fire scenario. The applicability of CFAST, a relatively simple analysis tool, was examined when evaluating the ASET and RSET within the same domain through the real-time integration of fire and evacuation simulations, which is necessary for enhancing the reliability of life safety assessment [24,25]. Based on the assumption of the uniform properties of the zone model within each zone, fire modeling in areas (corridors) with large horizontal aspect ratios requires careful consideration. Previous studies have compared the activation times of smoke and heat detectors predicted by FDS and CFAST, thereby reporting measures for setting computational domains [26]. This study presents a method for utilizing CFAST in evaluating ASET, which has a significantly lower computational cost than FDS. In the future, the prediction performance of CFAST on real buildings will be investigated from the perspective of the practical application of the methodology described in this paper.
2. Conditions and Methods for Fire Simulation
2.1. Fire Simulation Conditions
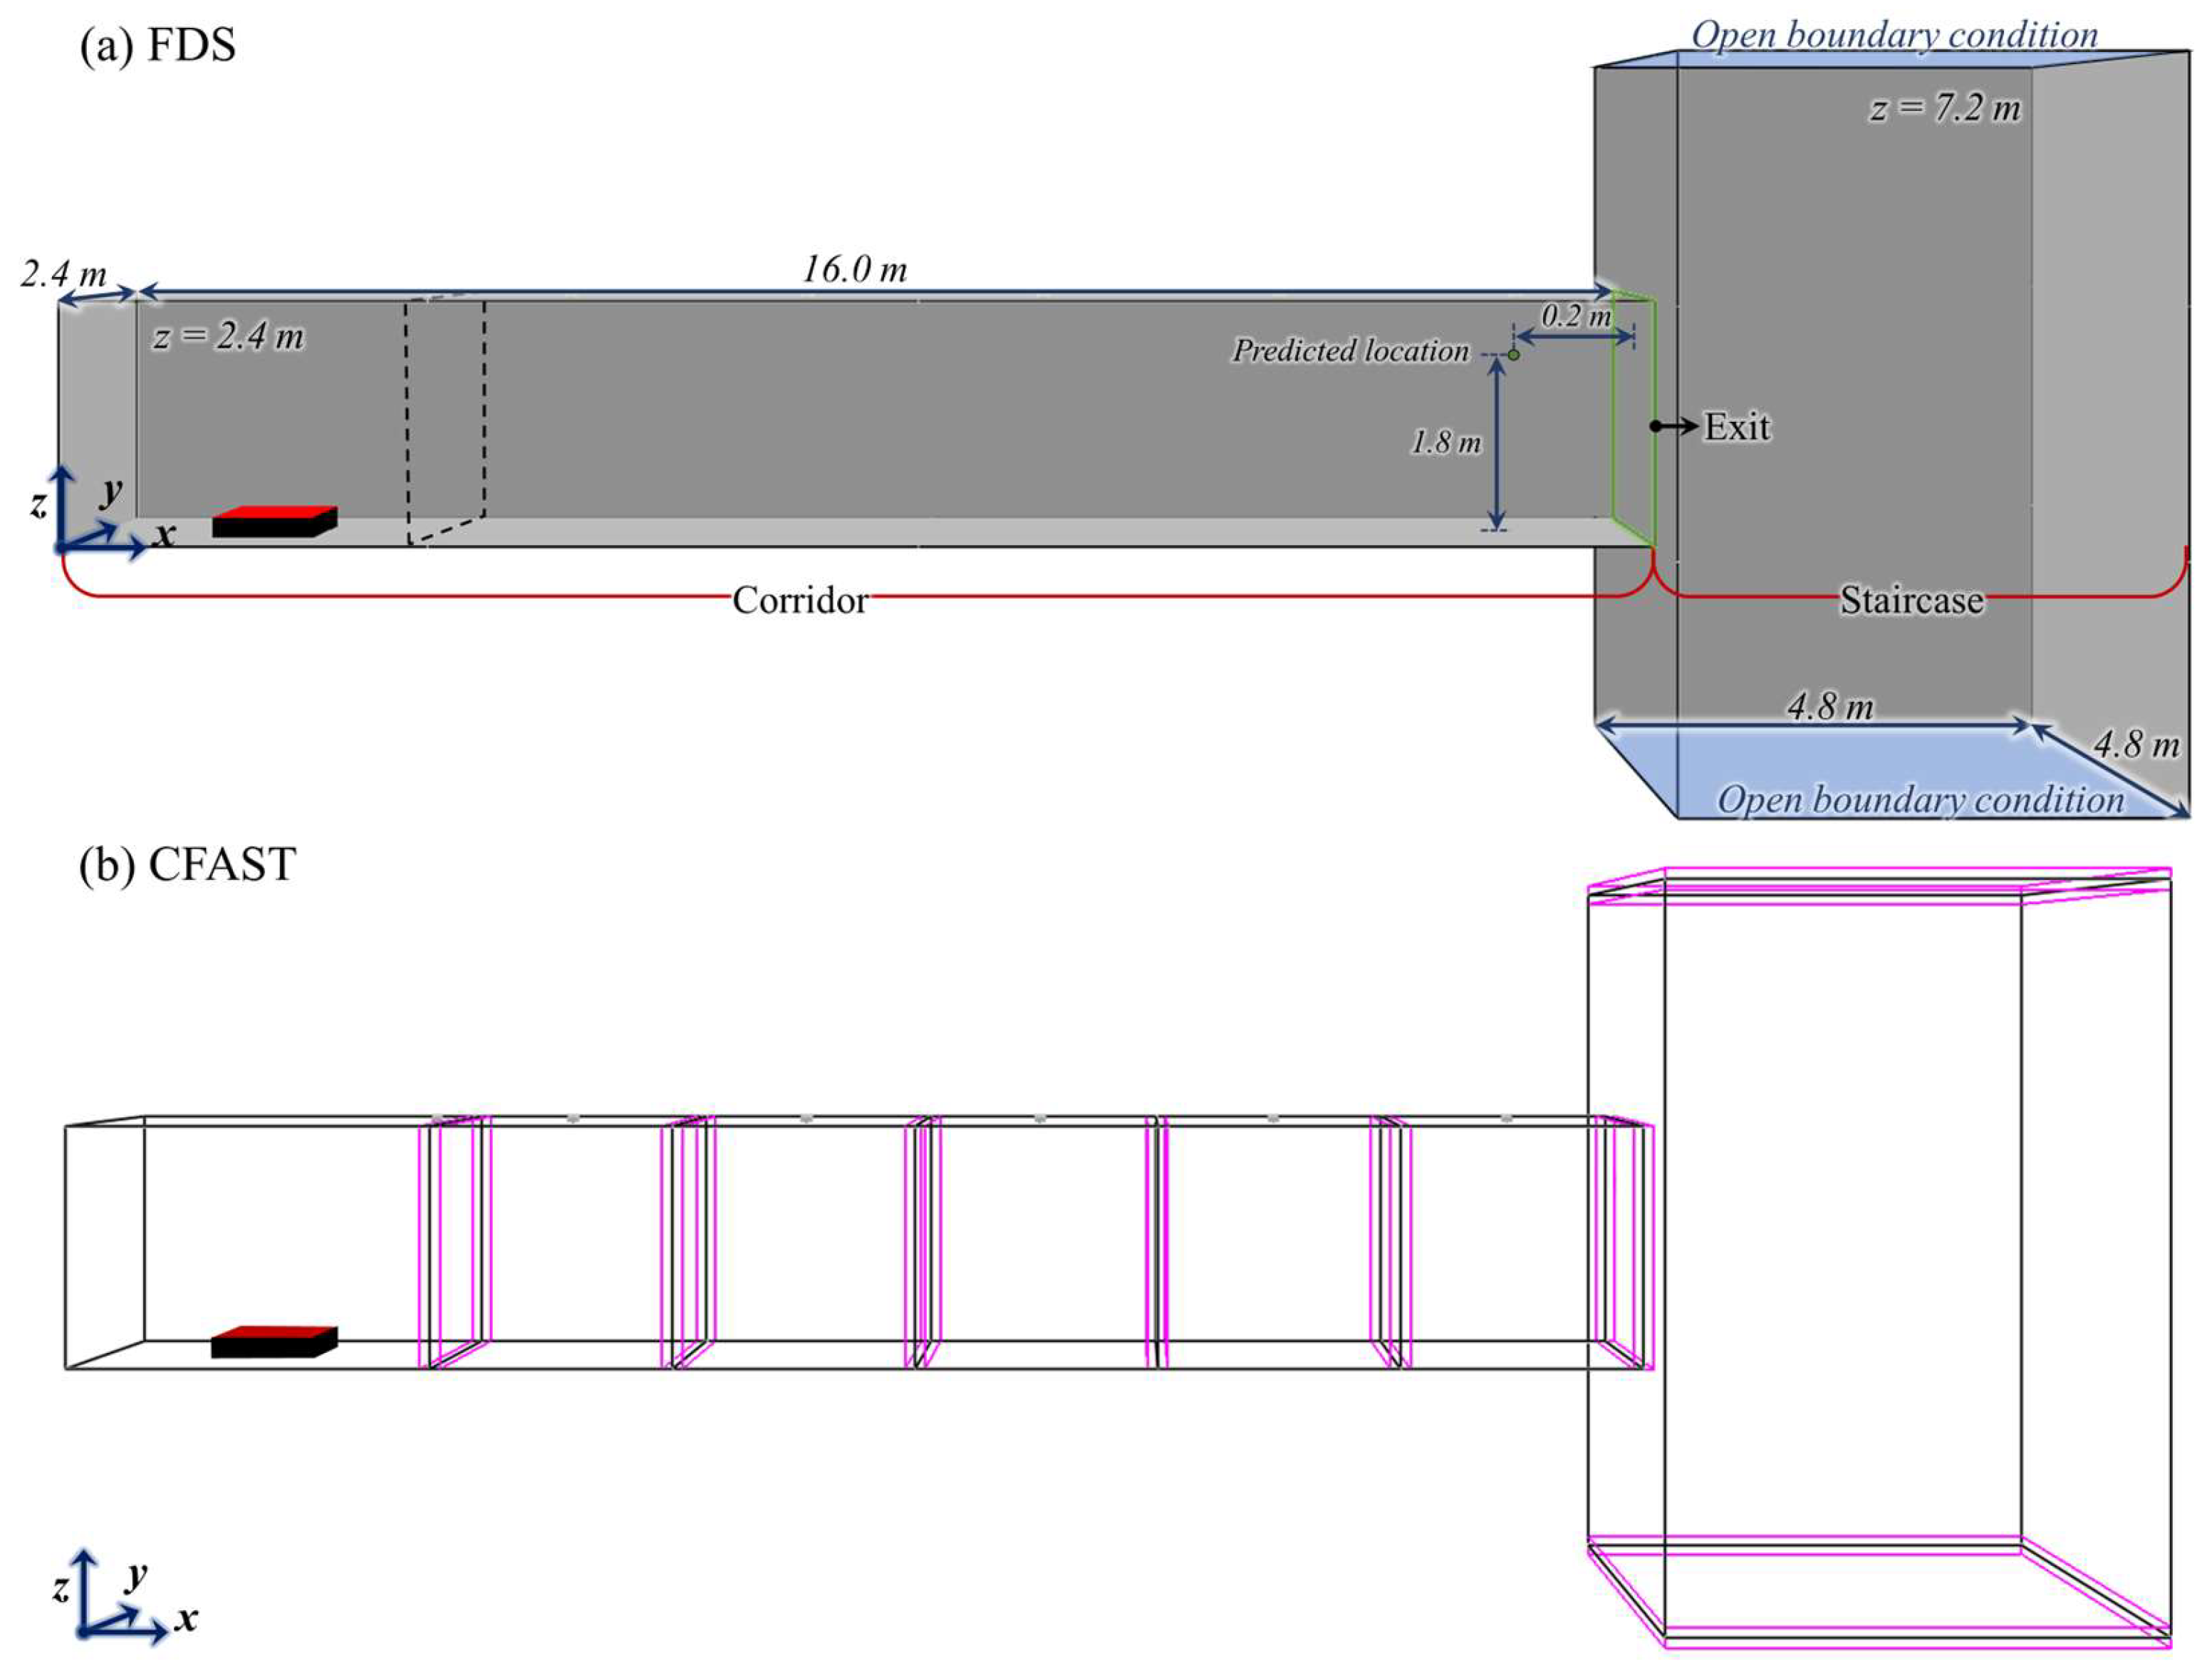
To review the physical quantities evaluated in life safety standards, as predicted by smoke and heat spread in fire models, FDS version 6.7.9 and CFAST version 7.7.0 were applied. Figure 2a shows the computational domain of the FDS considered for the ASET evaluation, which is set in accordance with the standard compartment. In PBD implementation, a single floor is examined; hence, a corridor shape extended by 12.0 m from the opening was considered. In this setup, fire is started inside a standard compartment, and heat and smoke are configured to move into the corridor, while the stairwell geometry limits the flow from the doorway. The corridor section is set to 16.0 m (x) × 2.4 m (y) × 2.4 m (z), and the staircase is set to 4.8 m (x) × 4.8 m (y) × 7.2 m (z). As CFAST cannot consider structures, the opening of the standard compartment was excluded for a direct comparison of the prediction results. The physical quantities considered for the ASET were set at a height of 1.8 m from the floor and spaced 0.2 m apart from the exit to minimize the influence of boundary conditions. Predicted physical quantities included the gas temperature and volume fractions of O2, CO2, and CO, including visibility. CFAST does not output visibility over time; however, we post-processed visibility using smoke concentration data based on the importance and need for visibility, as shown in Figure 1b.
Figure 2b shows that the computational domain in the CFAST is divided and set up with regular intervals. The reason for this approach is that our previous studies showed how to utilize the CFAST, which has the advantage of a low computational cost. Owing to the limitations relative to applying the zone model in areas with large aspect ratios, it was reported that the computational domain needed to be divided at regular intervals to accurately predict the physical quantities. Studies on application measures for utilizing heat and smoke detectors in the CFAST to accurately evaluate RSET have been reported. Based on the prediction correlations of the CFAST for the temperature, flow rate, and smoke concentration, careful consideration is required to divide the computational domain for heat and smoke detectors [26].
In predicting temperature using heat detectors, the influence of velocity is dominant. Even if the area of interest is close to the fire source, if it is divided from the fire room, the ceiling jet velocity is fixed at 0.1 m/s [20]. Although undivided computational domains are appropriate for accurately predicting high gas temperatures, in PBD, fire simulations are conducted for the entire building or a floor, as needed. Hence, when setting the computational domain based on the structure of the building, the probability that the fire room and exit are in the same computational domain is very low. To predict the smoke concentration, the computational domain is appropriate for dividing the fire room, while mass transfer should be ensured between adjacent compartments. In this study, the divided computational domain required for the prediction of various physical quantities was set, including the FDS and CFAST with a square fire source of 1.0 m in the center of each compartment.
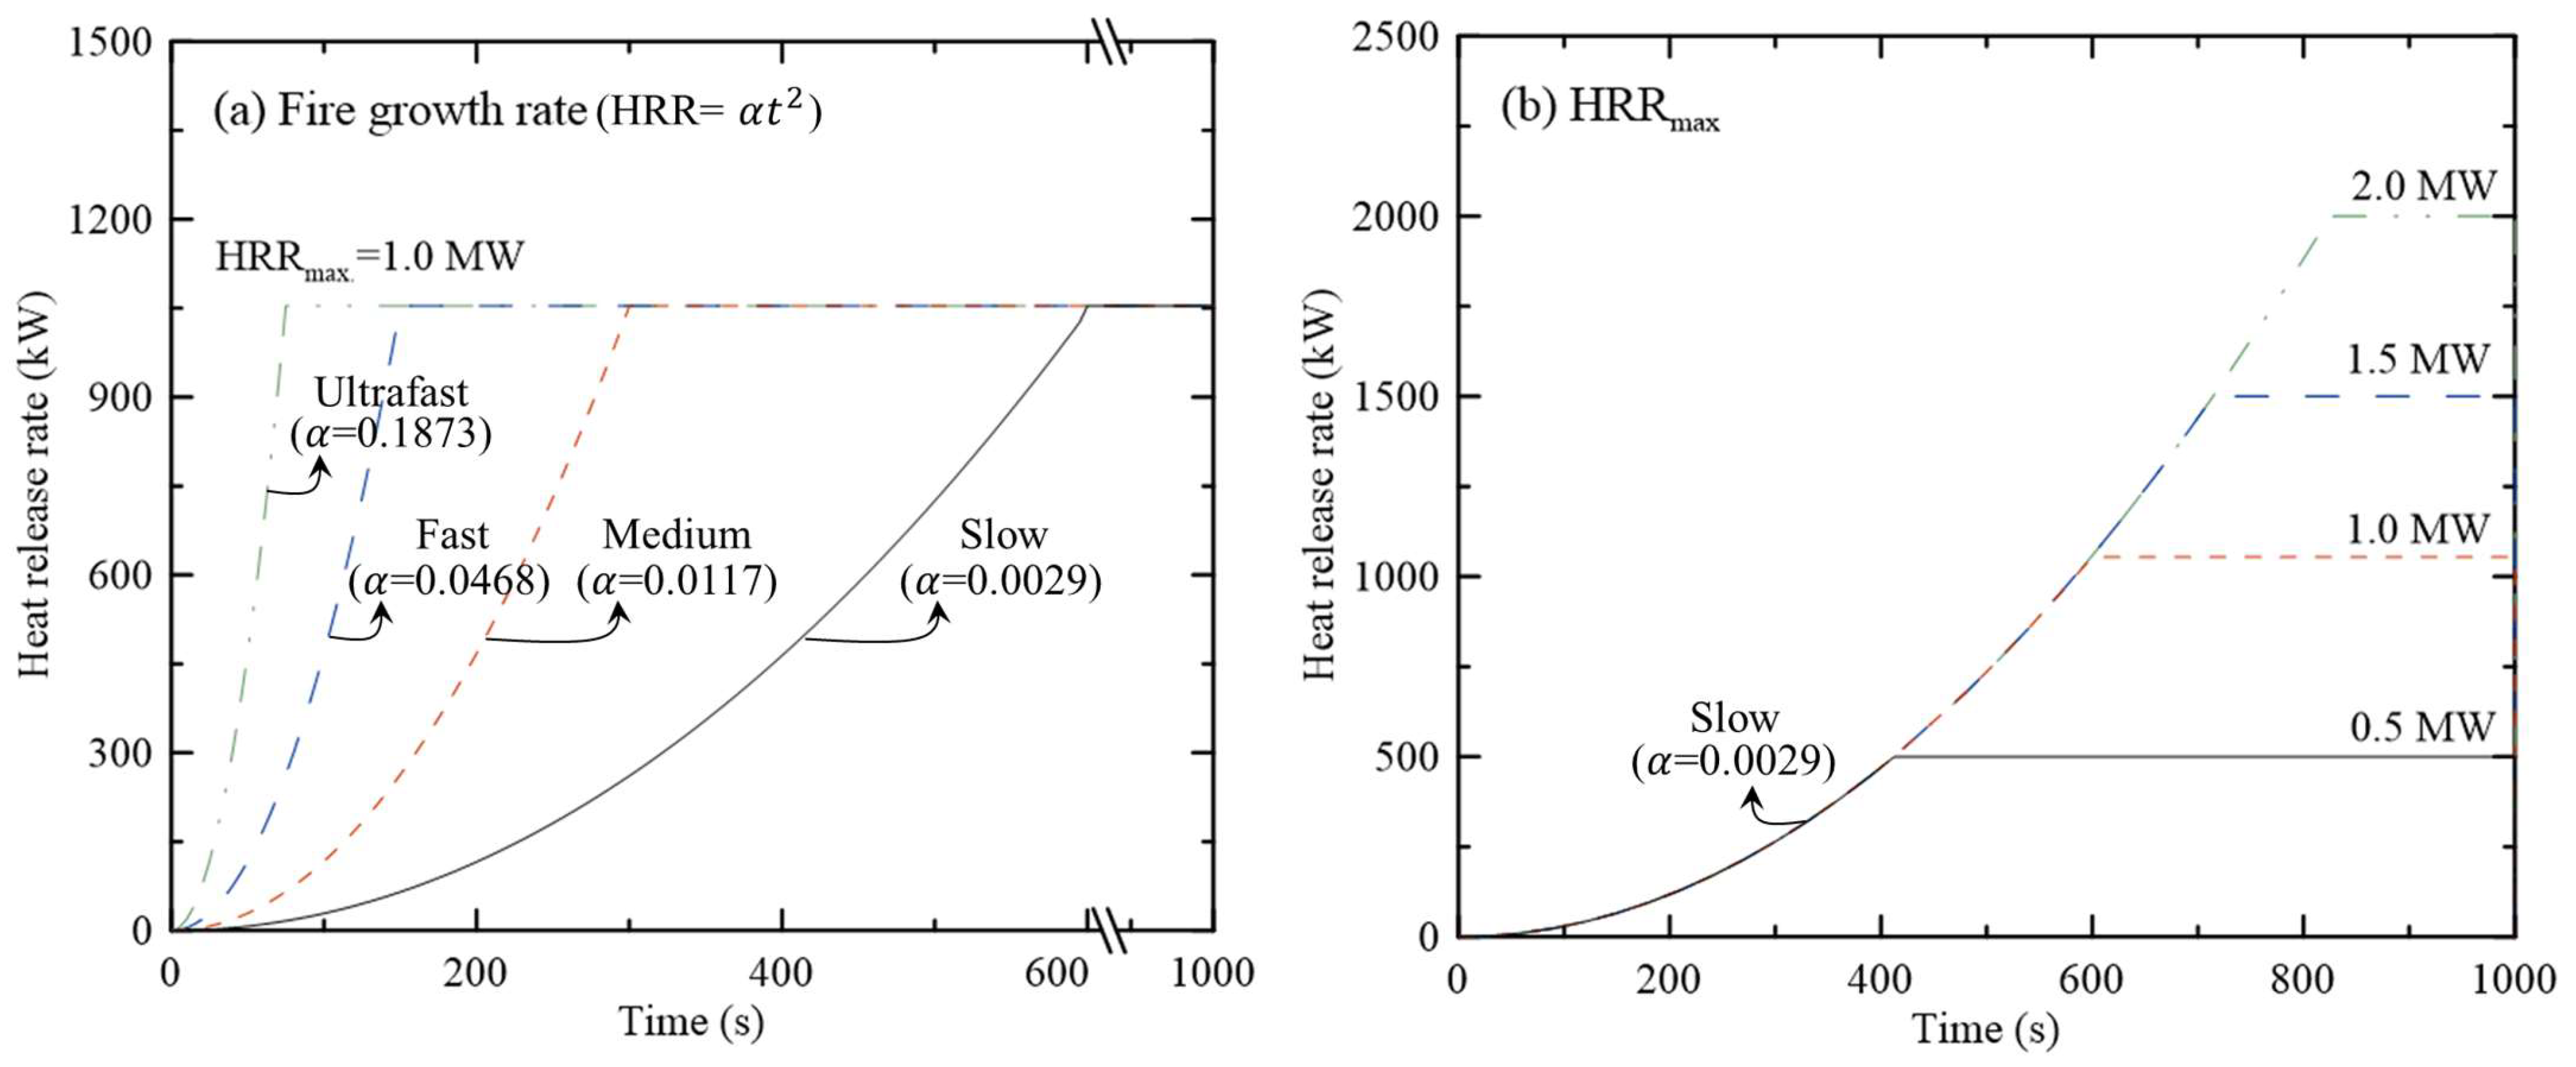
For fire simulation input data, the prediction results of the physical quantities for evaluating the ASET under various fire growth curves were applied, as shown in Figure 3. The temperature of the gases generated from the flame, the concentration of the chemical species, and the visibility can differ significantly from the maximum HRR (HRRmax) and fire growth rate. In this study, the prediction results of the FDS and CFAST were compared based on changes in the HRRmax and fire growth rate. Figure 3a shows the fire conditions considered for review based on changes in the fire growth rate. Four conditions—slow, medium, fast, and ultrafast—outlined in NFPA 92 [27] were considered based on the same HRRmax of 1.0 MW. Additionally, all the conditions were set to reach HRRmax at 1.0 MW and were maintained for 1000 s. Figure 3b shows the fire conditions considered for review based on changes in the HRRmax. To further examine the physical quantities evaluated in the ASET using FDS and CFAST, the slowest fire growth rate ( = 0.0029) was set. All the conditions maintained the slow fire growth rate, although HRRmax was assumed to reach 0.5, 1.0, 1.5, and 2.0 MW and was maintained for 1000 s. Normal heptane was used as the fire source for implementing various fire growth curves [28]. From a computational cost perspective, the FDS required approximately 25,920 min, whereas the computation time of the CFAST was 155,500 times higher.
2.2. Fire Simulation Method
The criteria for evaluating the ASET in PBD for specific target buildings are presented in Table 1. The fire simulations assess the time required to reach a temperature of 60 °C or more at a height of 1.8 m (breathing limit line) from the floor after a fire starts. The time when the concentrations of various chemical species exceed their critical values is evaluated, such as when it is below 15% for O2, above 5% for CO2, and 1400 ppm for CO. This evaluation includes the time when the visibility for occupants drops to 5 m or less for light-reflecting objects. Using a conservative approach, the ASET of the building is evaluated based on the smallest time value among these physical quantities for reaching their respective critical values. The major input parameters of the fire simulation that can significantly alter the physical quantities that influence ASET, such as the heat of combustion, CO yield, and soot yield, were set identically to those in previous studies [26].
The FDS calculates the physical conditions at the center of each cell in a three-dimensional grid as a function of time, which is based on fundamental equations for mass, momentum, and energy. In this case, a simple chemistry method is applied, thereby determining the amount of combustion products simply through yield values. Specifically, the concentrations of the chemical species are implemented in proportion to the fuel supply using user-inputted CO and soot yields [12]. The generated CO and soot move based on the dynamics equations of the gas phase implemented by heat release rates and buoyancy from the fire source. However, CFAST applies Bernoulli’s equation to predict the flow rate and pressure using the mass and energy conservation laws [20]. Therefore, by dividing the area where the fire source is located from areas without it, the concentration of the chemical species in the upper and lower layers of each section is output owing to the pressure difference at the boundary conditions. Similar to the FDS, the CO and soot produced per unit mass of consumed fuel are specified, thereby enabling the implementation of the chemical species and smoke concentration.
Particularly, the smoke concentration predicted based on the user-specified soot yield is closely related to visibility, a major physical quantity in determining ASET. Specifically, in both FDS and CFAST, the smoke concentration is predicted using Equation (1). During a fire, the smoke concentration is calculated along with other major products, which are determined by the intensity of the monochromatic light passing through a distance L [12,20].
where represents the optical density, is the light intensity without smoke, and is the light intensity after passing through smoke. The calculated optical density is then redefined by the light extinction coefficient . Additionally, is a major variable for evaluating visibility within the computational domain, which is expressed as the product of (mass specific extinction coefficient, m2/kg) and (density of smoke particulate, mg/m3) [12]. The default value of K, an average of the various fuels and conditions, is 8700 m2/kg [29]. is determined in real time by the smoke generated in a fire and is directly influenced by the user-inputted soot yield.
The FDS predicts visibility caused by the smoke concentration using Equation (2). S represents visibility, and is a dimensionless specific constant based on the type of object viewed through smoke, with = 8 for light-emitting signs and = 3 for reflective signs. The default value of used in FDS visibility calculations is 3, set for reflective signs [30].
As CFAST does not directly output visibility, it applies Equation (2), which is used in FDS, to evaluate the visibility caused by smoke from a fire. The coefficient , as predicted in CFAST, and the visibility constant set to 3 for reflective markers such as in FDS are utilized. Since FDS assumes a maximum visibility distance of 30 m, any value of exceeding 30 m is set to 30 m in post-processing [12]. Previous studies have reported on the predictive performance by comparing the activation times of heat and smoke detectors in the FDS with those in the CFAST to confirm the feasibility of calculating RSET using CFAST. This approach can contribute to the completeness of programs aimed at developing evacuation plans by fire safety managers.
3. Results and Analysis
3.1. Prediction of ASET Evaluation Factors Based on Fire Models
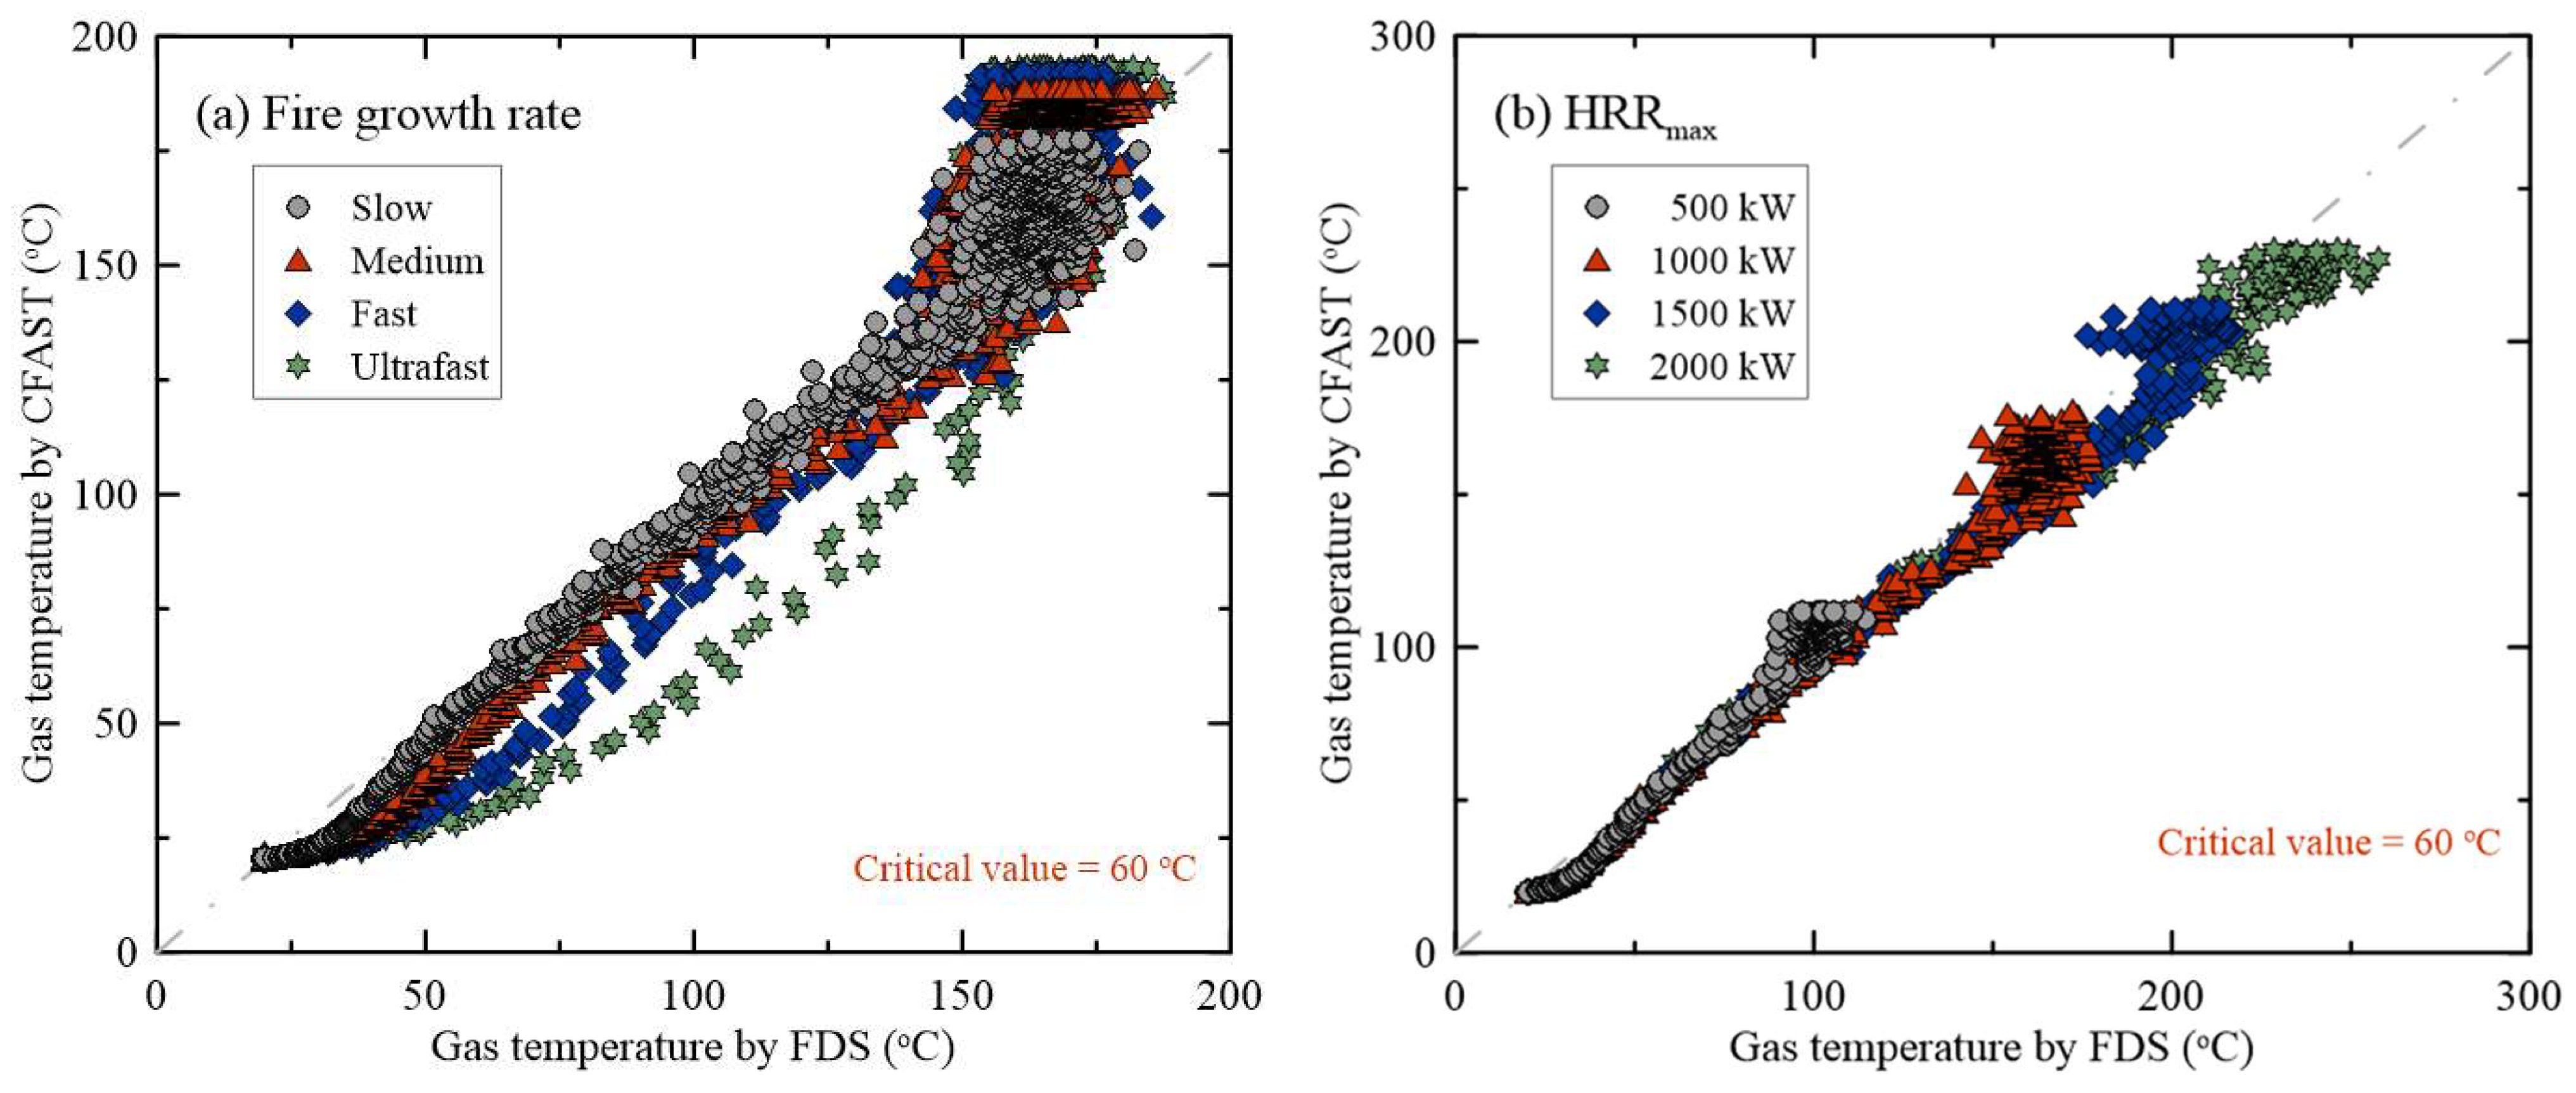
Figure 4 compares the gas temperatures predicted at the 1.8 m breathing limit line using FDS and CFAST. The X-axis shows the gas temperatures predicted using FDS, and the Y-axis shows those predicted using CFAST, thereby enabling a direct comparison of the physical quantities predicted by both tools. The critical value for the PBD is 60 °C. This value is reached in all fire scenarios regardless of the fire growth rate or HRRmax. Figure 4a shows that as the fire growth rate increases, CFAST tends to under-predict the gas temperatures. This under-prediction by CFAST seems to arise because the model does not consider the exact ceiling jet velocity due to the division of the computational domain where the fire source is located and the area predicting the ASET. Specifically, CFAST assumes a ceiling jet velocity of 0.1 m/s in computational domains separated from the fire room, as reported in previous studies [20]. Figure 4b shows that although the range of the predicted gas temperatures varies with the HRRmax, both the FDS and CFAST predict similar gas temperatures.
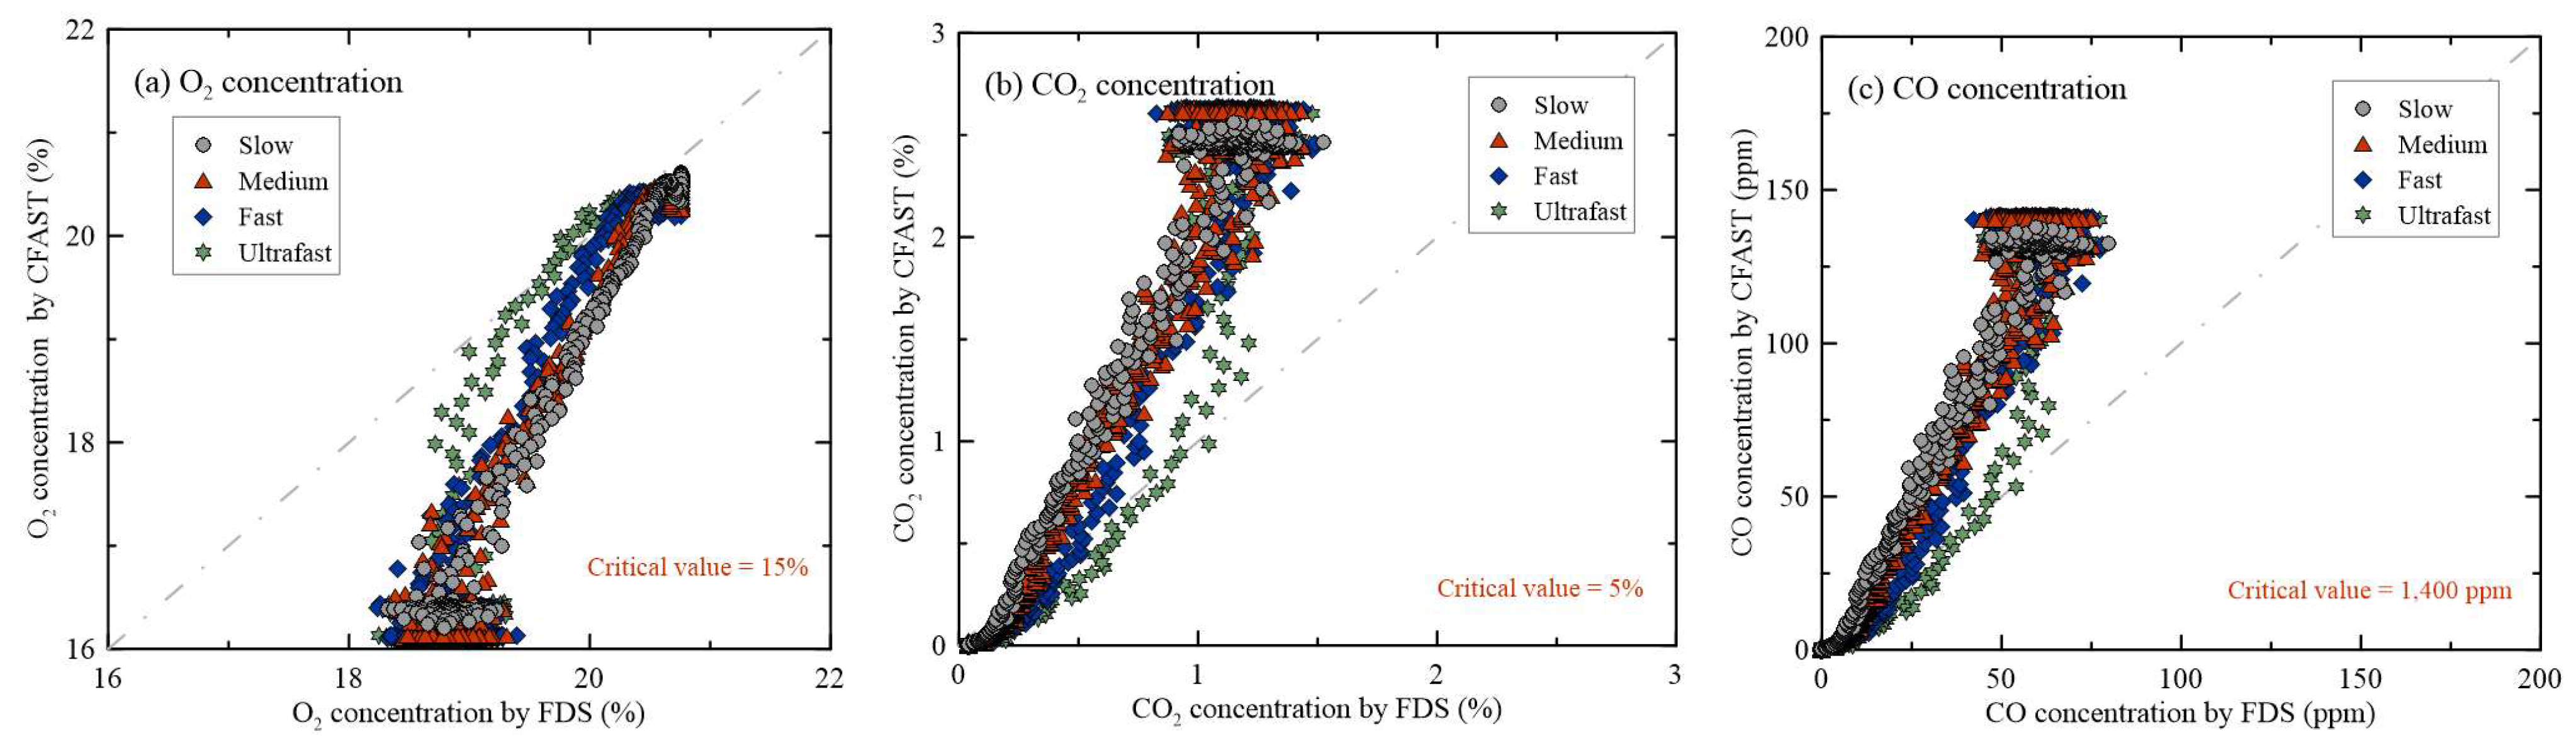
Figure 5 compares the concentrations of the chemical species predicted at positions 0.2 m from the exit using the fire model. By observing the concentrations of O2, CO2, and CO at varying fire growth rates, we confirmed that the concentration is predicted within the same range when only the fire growth speed differs, while the HRRmax remains the same. Furthermore, the faster the fire growth speed, the more similar the results of the predicted O2, CO2, and CO concentrations using FDS in the initial stages of the fire. Conversely, slower speeds tend to result in over-prediction. Looking at the predicted concentrations of the chemical species to evaluate ASET using the fire models, the critical values are not reached under all conditions. The concentrations of the chemical species predicted using CFAST are over-predicted compared to those using FDS, thereby suggesting that ASET values would be smaller than those of FDS. From a conservative perspective, CFAST can be utilized to grasp simple trends in fire engineering.
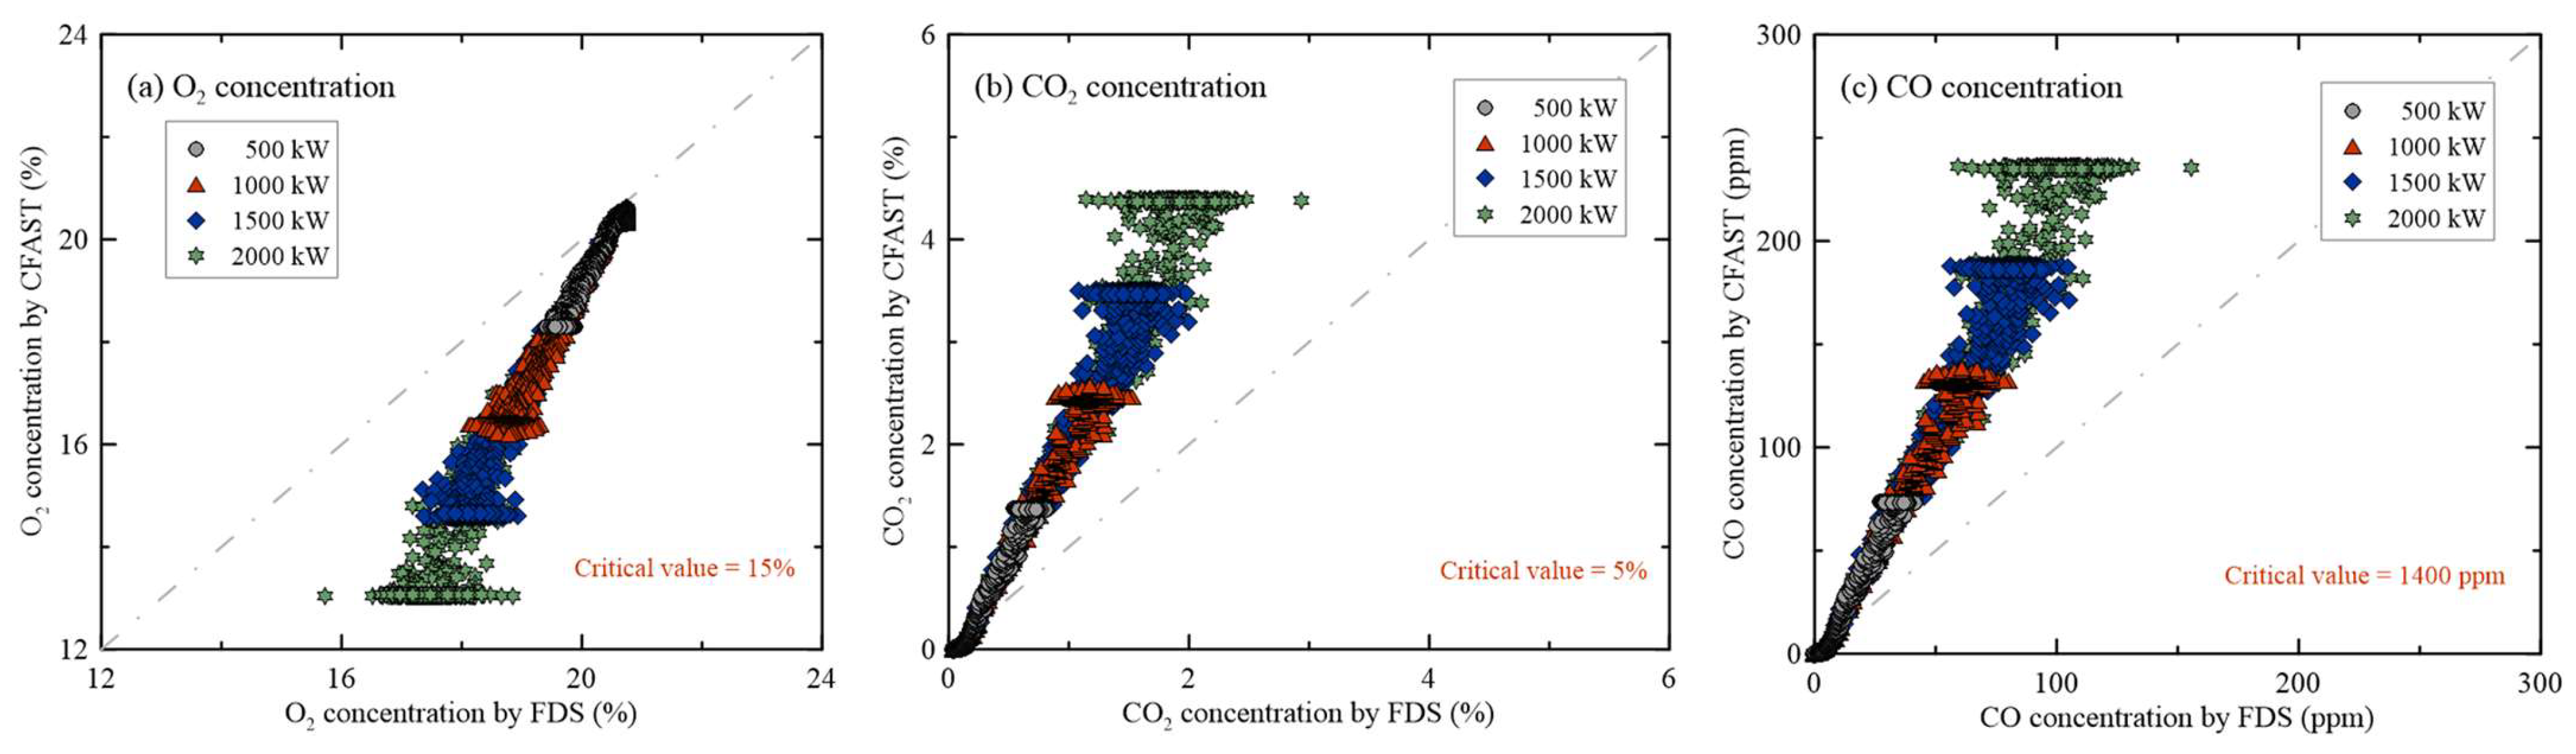
Figure 6 compares the concentrations of the chemical species predicted at the 1.8 m breathing limit line using FDS and CFAST based on the changes in HRRmax. The X-axis shows the concentrations predicted using FDS, and the Y-axis shows those predicted using CFAST, thereby enabling a direct comparison between both tools. Figure 6a shows that as the HRRmax increases, the oxygen concentration predicted using the fire models decreases. As the HRRmax increases, compared with FDS, CFAST tends to over-predict the oxygen concentration. As previously mentioned, the critical value for oxygen concentration is 15%, and this critical value is reached in the 2000 kW condition predicted using CFAST. Examining Figure 6b,c, which compare and illustrate the volume fractions of CO2 and CO predicted using the fire models, the concentrations of CO2 and CO increase as the HRRmax increases. The critical value for CO2 in PBD is 5%. However, the CO2 concentrations predicted by the CFAST and FDS do not reach this critical value. The critical value for CO is 1400 ppm, and studies have shown that neither of the predicted CO concentrations of the fire models have reached this critical value. The concentrations of the chemical species predicted using CFAST are over-predicted compared with those predicted using FDS.
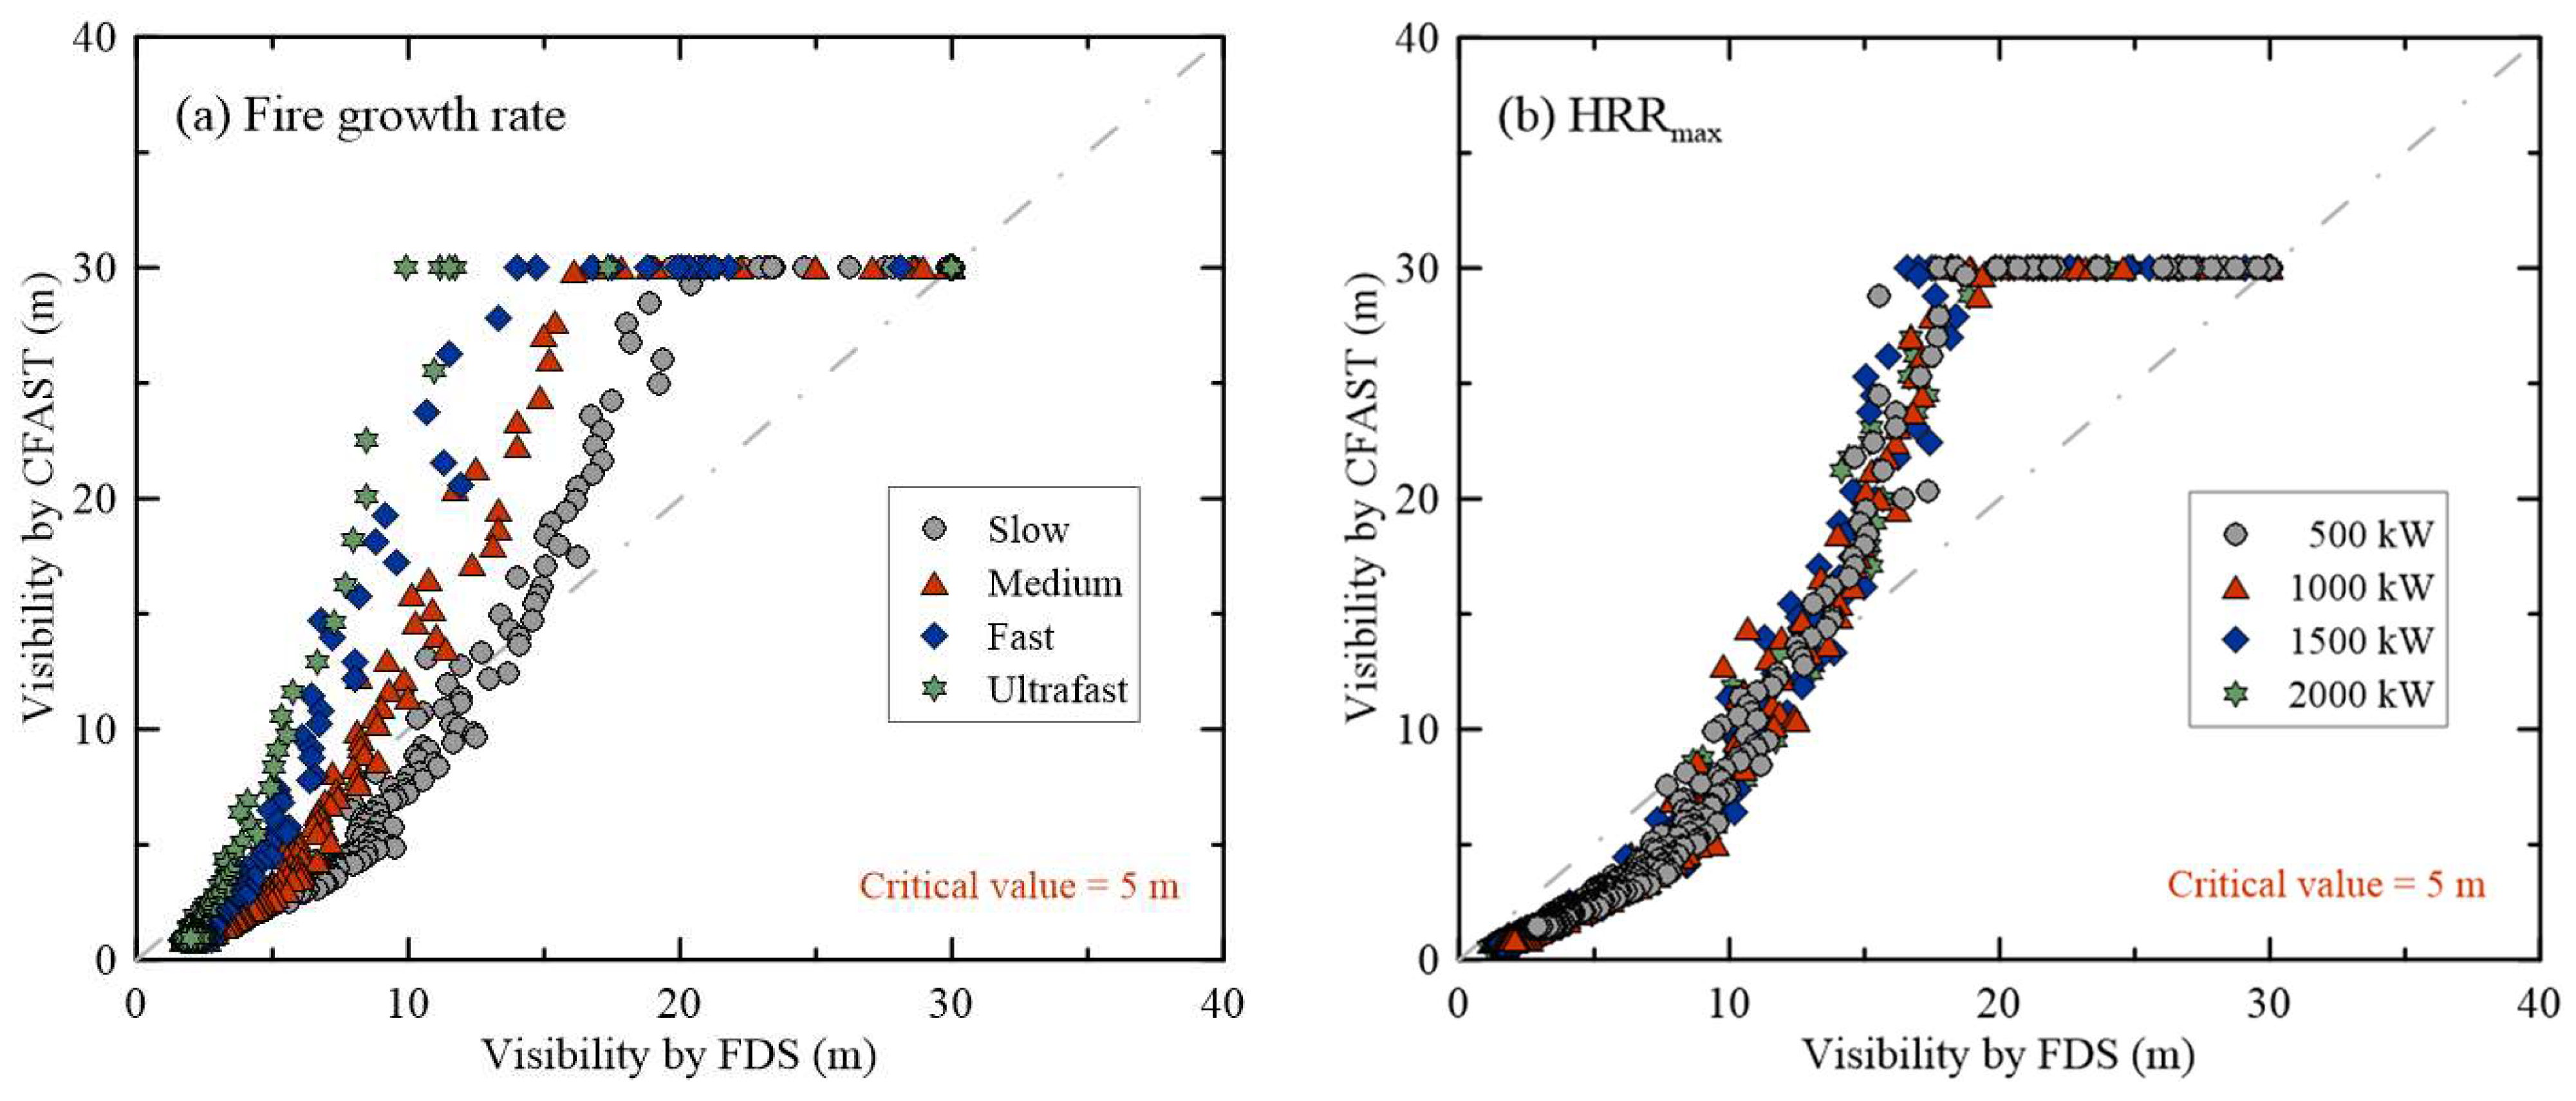
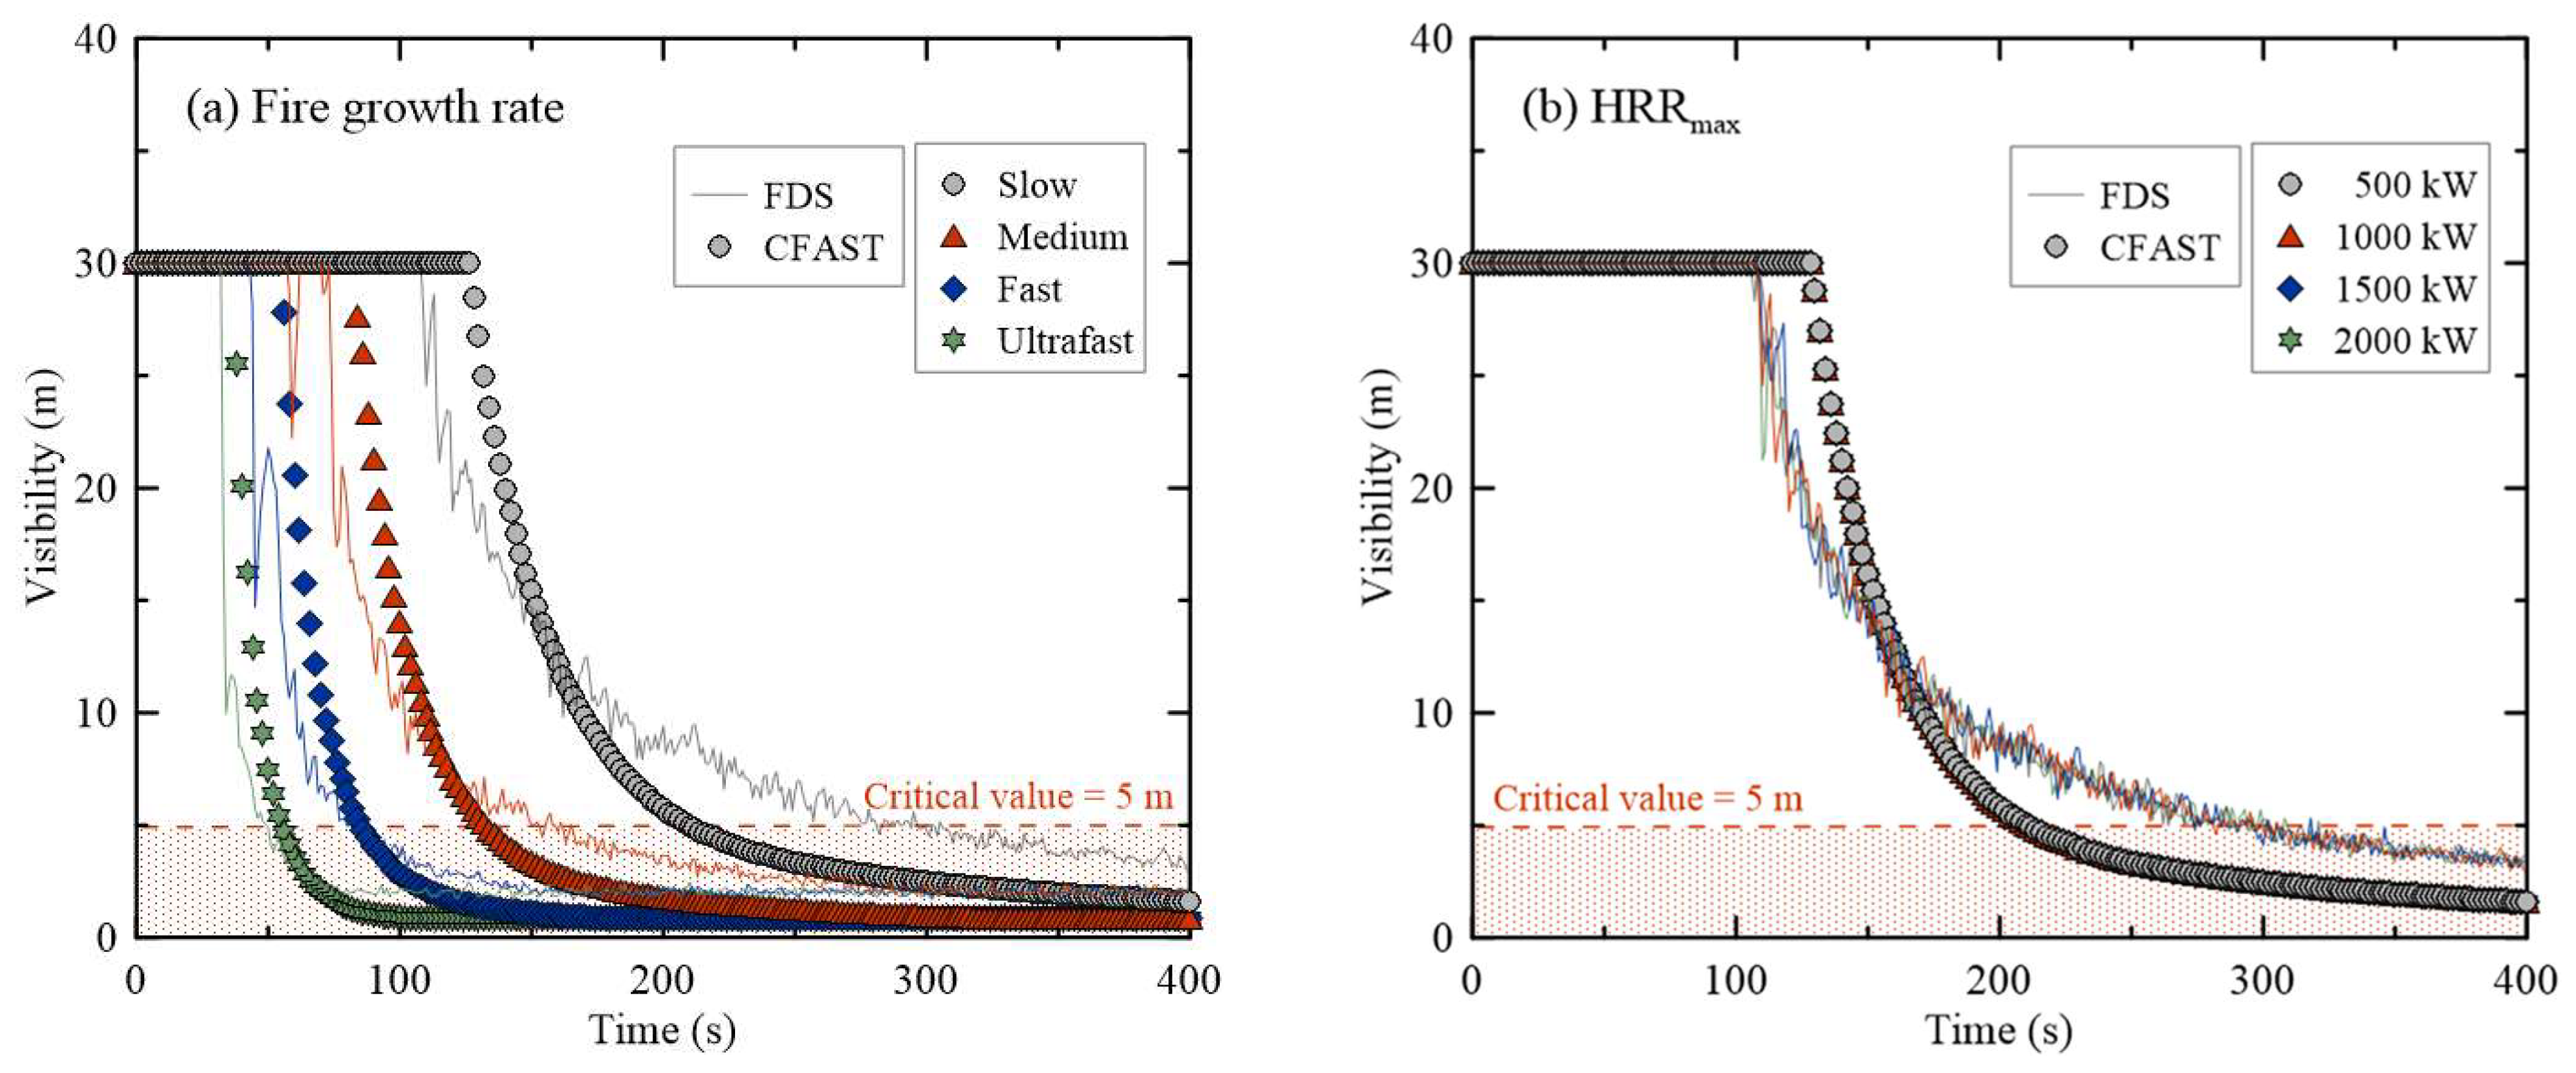
As CFAST does not directly output visibility, as described in Section 2.2, it was post-processed using the method employed by FDS. Thus, visibility predicted at the 1.8 m breathing limit line using the FDS and CFAST is shown in Figure 7. As previously mentioned, when post-processing the optical density predicted by the CFAST into visibility, a limit of 30 m is applied when the value is exceeded. Consequently, compared with FDS, CFAST maintains a visibility of 30 m for an extended duration after smoke generation. The critical value for visibility in PBD is 5 m. All fire scenarios reach this critical value regardless of the fire growth rate or HRRmax. Figure 7a shows that as the fire growth speed increases, the visibility predicted by CFAST is over-estimated compared with that predicted by FDS. This discrepancy exists because CFAST predicts smoke concentration in the relatively averaged wide range of the upper layer, unlike FDS, which calculates visibility based on a localized grid for smoke concentration at a height of 1.8 m. Furthermore, Figure 7b shows that the predicted visibility based on changes in the HRRmax does not exhibit considerably quantitative differences.
3.2. Comparison of Predicted Results of Major ASET Evaluation Factors Using Fire Models
This study compared the raw data of physical quantities reaching critical values among the ASET evaluation factors, as stipulated by the life safety standards in Table 1, through the fire scenarios considered. As shown in Figure 1, the statistically significant ranking of the evaluation factors of the ASET when performing PBD was analyzed and found to be visibility, followed by the gas temperature. Similar physical quantities were selected for the fire scenario applied in this study. Specifically, the prediction results for the gas temperature at the 1.8 m breathing limit line in FDS and in the upper layer in CFAST, including visibility, were compared and analyzed.
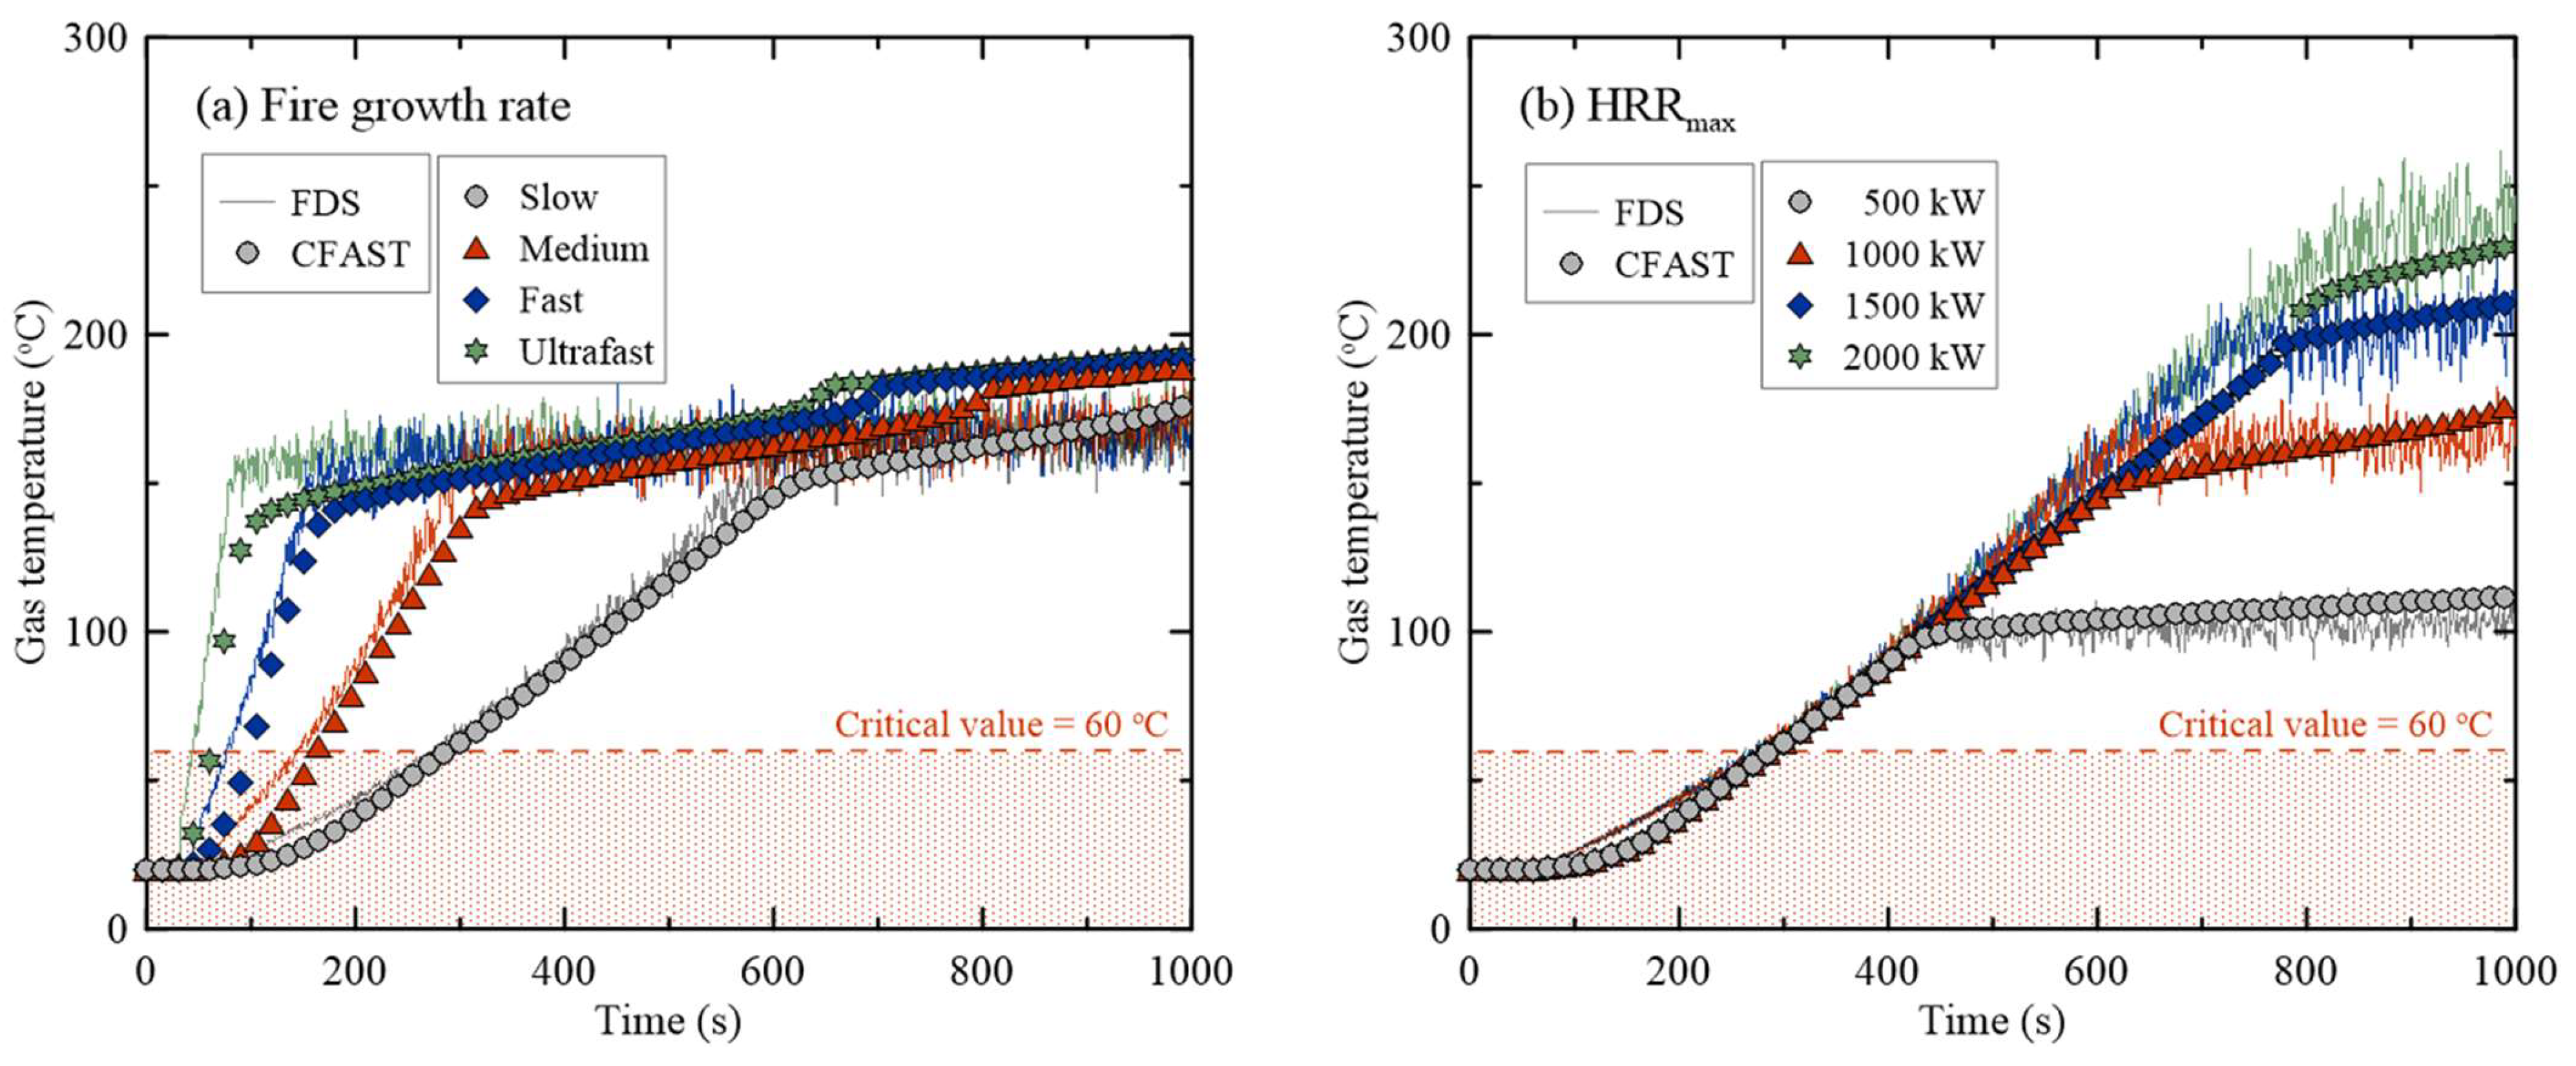
Figure 8a shows the raw data for the changes in the fire growth rate, thereby indicating a similar trend to the predictions of FDS, although the onset of the temperature rise differs. As the fire growth rate increases, the initial temperature rise in the CFAST appears slower. The critical value for the gas temperature in life safety standards is 60 °C, and it is influenced by the change in the fire growth rate. Consequently, the times when the gas temperature reaches the critical value are 279, 143, 77, and 45 s in FDS and 290, 164, 99, and 62 s in CFAST. Figure 8b shows the gas temperature changes based on the HRRmax, thereby revealing overall similar trends. When comparing the results predicted by FDS and CFAST, CFAST tends to under-predict the maximum gas temperature as the HRRmax increases. Regarding changes in the HRRmax, the critical value of the gas temperature (60 °C) is similarly predicted. Listing the times when the gas temperature reaches the critical value, FDS shows 263, 267, 273, and 275 s, whereas CFAST consistently reaches the same time of 290 s for all the conditions. Hence, regardless of the changes in the fire growth rate and HRRmax, the gas temperatures predicted by both fire models correspond.
Figure 9 compares the visibility predicted by FDS and CFAST post-processed into visibility. Observing the predicted results for changes in the fire growth rate, CFAST shows a slower visibility reduction than FDS, although it reaches the critical value faster. The reason for the difference in the fire models is that while FDS calculates numerous grid points, CFAST divides them into two zones and expresses each zone as an average value. Therefore, visibility does not decrease at the initial stages of a relatively low smoke concentration but does as the fire grows and a sufficient smoke concentration is generated. Although the initial reduction in visibility differs, the trend is very similar, with FDS reaching the critical value in 50, 84,151, and 281 s and CFAST reaching it in 58, 88, 135, and 212 s. The delayed reduction in visibility under the slow condition of FDS is attributed to fluctuations caused by fresh air entering at the boundary condition of the exit. Owing to an increase in the HRR, the visibility predicted by FDS and CFAST exhibits similar trends, and a significant difference in the time reaching the critical value is observed under the slow condition. This indicates the need to examine the applicability in various computational domains, rather than a lack of predictive accuracy for a specific fire growth speed.
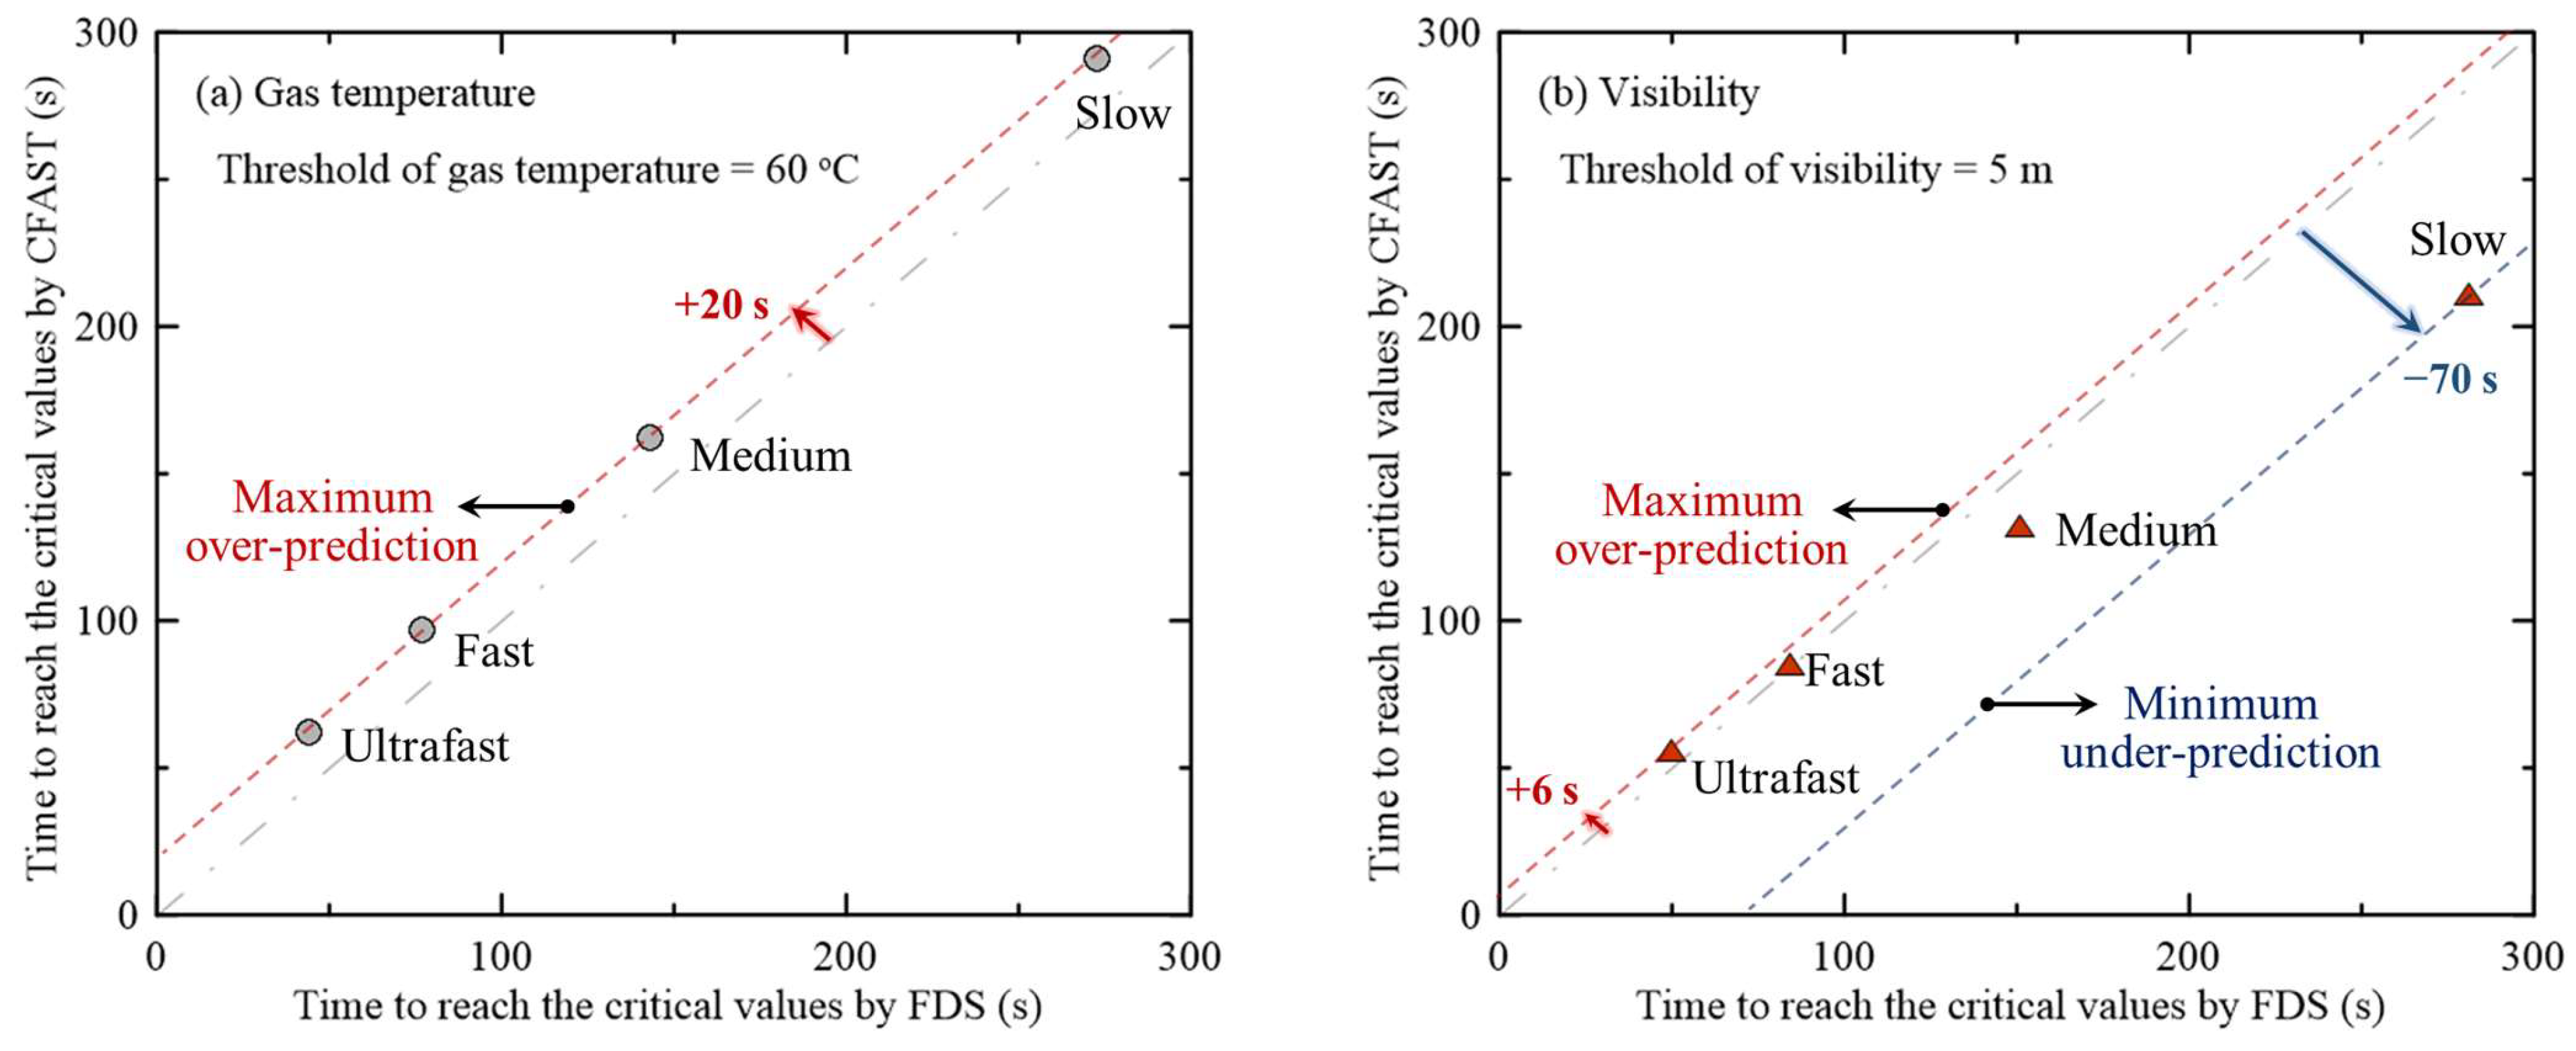
Figure 10 quantitatively compares the times when the gas temperature and visibility reach their critical values in FDS and CFAST, thereby examining the potential applicability of CFAST. According to the life safety standards in Table 1, ASET is assessed using the time required for the gas temperature to exceed 60 °C and for the visibility to drop below 5 m at a height of 1.8 m from the floor. Accordingly, this study applied a similar concept, with the X-axis corresponding to how long it takes to reach the critical values in FDS and the Y-axis corresponding to that for CFAST. Figure 10a shows that the ASET evaluated using the gas temperatures predicted by CFAST is extremely similar to that of FDS. The time difference for reaching the critical values predicted by FDS and CFAST is 20 s slower, with a difference of 7% to 41% relative to the time predicted by the FDS. The time required to reach 60 °C under all conditions, regardless of the fire growth rate, can result in a difference of 20 s compared to FDS. This phenomenon is attributed to the model limitations of the CFAST, wherein the computational domain is divided between the fire source and exit area, thereby fixing the ceiling jet flow at 0.1 m/s [20]. Despite these limitations, CFAST is suitable for predicting gas temperatures considering its substantial advantage in terms of its computational cost.
FDS predicts the smoke concentration at a localized location at a point, while CFAST predicts the average smoke concentration of the upper layer in the exit zone. Figure 10b shows that CFAST predicts a smaller ASET for visibility than FDS, which calculates the smoke concentration at localized positions. In the slow, CFAST under-predicts by 70 s, and in the ultrafast condition, it over-predicts by a maximum of 6 s. This indicates a –25% to 12% range in the time difference for reaching the critical value for visibility compared with FDS. Such results do not indicate the limitations of accuracy for specific fire growth rates. Rather, further examination in terms of applicability in different computational domains will be conducted. Additionally, for CFAST, differences in the time needed to reach the critical value of predicted visibility with changes in the fire growth rate can be observed. This is attributed to the basic assumptions, such as the mass and energy conservation laws, of the zone model in CFAST, thereby resulting in pressure differences between the upper and lower layers in divided spaces [20]. Hence, faster fire growth rates lead to a rapid transfer of smoke concentration in interested computational domains owing to the higher pressure in each divided domain. The possibility of utilization was examined when determining the ASET for the buildings using CFAST, which has a very low calculation cost. The method for and ability of evaluating the time needed to reach the critical values for the gas temperature, chemical species concentration, and visibility through the smoke concentration in CFAST are expected to be highly beneficial for engineers.
4. Conclusions
This study examined the use of CFAST as part of a project to develop a program to help fire safety managers establish evacuation plans in a building fire. We focused on the two most important variables for assessing ASET in building fire risk assessment, namely, visibility and gas temperature. The following are the main conclusions.
Generally, as fire modeling for a single floor of a building is performed, using CFAST in setting the computational domain may involve dividing the area of interest and fire source. Therefore, even if the area of interest is very close to the fire source, by dividing it from the fire room, a fixed flow rate of 0.1 m/s for the gas temperature is evaluated for potential use. Despite these limitations, CFAST is very useful, as it shows an excellent predictive performance for the gas temperature compared with FDS.
The predicted results for the concentration of the chemical species and visibility were over-predicted in CFAST compared to in the FDS. This is because of the zone model limitation of CFAST, which divided the space into hotter upper and cooler lower layers, contrary to FDS, which could predict the concentration at localized positions.
When comparing the times needed to reach the critical value for visibility, as determined by the smoke concentration outputs from CFAST, differences were observed depending on the fire growth rate. Overall, CFAST tended to under-predict visibility. This is believed to be caused by the pressure difference between the upper and lower layers of the smoke generated from the flame in each compartment, which is released by the zone model, which is based on the basic assumption of the conservation of mass and energy. Therefore, CFAST was sufficiently usable from a conservative perspective.
Based on these results, the potential use of the output values of CFAST, which requires a significantly lower computational cost than FDS, for ASET evaluation factors was assessed. The research results are expected to enhance the usability in the understanding of general fire engineering technology and simple fire dynamics trends.
Author Contributions
Conceptualization, H.-Y.J.; methodology, H.-Y.J. and C.-H.H.; validation, H.-Y.J. and C.-H.H.; formal analysis, H.-Y.J.; investigation, H.-Y.J. and C.-H.H.; resources, C.-H.H.; data curation, H.-Y.J.; writing—original draft preparation, H.-Y.J.; writing—review and editing, C.-H.H.; visualization, H.-Y.J.; supervision, C.-H.H.; project administration, C.-H.H.; funding acquisition, C.-H.H. All authors have read and agreed to the published version of the manuscript.
Funding
This paper was supported by the “National Fire Agency” R&D program (20016433) and the Korea Agency for Infrastructure Technology Advancement (KAIA) grant funded by the Ministry of Land, Infrastructure, and Transport (Grant RS-2022-00156237).
Institutional Review Board Statement
Not applicable.
Informed Consent Statement
Not applicable.
Data Availability Statement
The data used to support the findings of this study are available from the corresponding author upon request.
Conflicts of Interest
The authors declare no conflicts of interest.
References
- McGuire, J.H.; Tamura, G.T. Simple analysis of smoke-flow problems in high buildings. Fire Technol. 1975, 11, 15–22. [Google Scholar] [CrossRef]
- McGrattan, K.; Hostikka, S.; McDermott, R.; Floyd, J.; Weinschenk, C.; Overholt, K. Fire Dynamics Simulator User’s Guide, NIST SP, 6th ed.; National Institute of Standards and Technology: Gaithersburg, MD, USA, 2015; Volume 1019. [Google Scholar]
- Peacock, R.D.; Reneke, P.A.; Forney, G.P. CFAST. Consolidated Fire and Smoke Transport: User’s Guide, NIST TN 1889v2, 7th ed.; National Institute of Standards and Technology: Gaithersburg, MD, USA, 2021; Volume 2. [Google Scholar]
- Thunderhead Engineering. Pathfinder User Manual; Thunderhead Engineering: Manhattan, KS, USA, 2020. [Google Scholar]
- IES Virtual Environment. Egress: Simulex User Guide; IES Virtual Environment: Glasgow, UK, 2015. [Google Scholar]
- Galea, E.R.; Lawrence, P.J.; Gwynne, S.; Filippidis, L.; Blackshields, D.; Cooney, D. buildingEXODUS v6.3 User Guide; GUEL Subsidiary of the University of Greenwich: London, UK, 2017. [Google Scholar]
- Korhonen, T.; Hostikka, S.; Heliovaara, S.; Ehtamo, H. ‘FDS+ Evac: An Agent Based Fire Evacuation Model.’ Pedestrian and Evacuation Dynamics 2008; Springer: Berlin/Heidelberg, Germany, 2010. [Google Scholar]
- Jang, H.Y.; Hwang, C.H. Revision of the input parameters for the prediction models of smoke detectors based on the FDS. Fire Sci. Eng. 2017, 31, 44–51. [Google Scholar] [CrossRef]
- National Fire Agency of Republic of Korea. Performance Based Design Methods and Standards on Fire-Fighting System Installation Act; National Fire Agency of Republic of Korea: Sejong, Republic of Korea, 2016; Volume 3-a, Annex 1. [Google Scholar]
- Ahn, S.H. Study on the Improvement of Performance-Based Design (PBD) through the Analysis of the Whole PBDs. Ph.D. Dissertation, The Graduate School of Daejeon University, Daejeon, Republic of Korea, 2018. [Google Scholar]
- Hsieh, H.R.; Chung, H.C.; Kawabata, N.; Seike, M.; Hasegawa, M.; Chien, S.W.; Shen, T.S. Assessment Method Integrating Visibility and Toxic Gas for Road Tunnel Fires Using 2D Maps for Identifying Risks in the Smoke Environment. Fire 2023, 6, 173. [Google Scholar] [CrossRef]
- McGrattan, K.; Hostikka, S.; McDermott, R.; Floyd, J.; Weinschenk, C.; Overholt, K. Fire Dynamic Simulator; Technical Reference Guide, NIST SP, 6th ed.; National Institute of Standards and Technology: Gaithersburg, MD, USA, 2015; Volume 1018-1. [Google Scholar]
- Brohez, S.; Caravita, I. Fire induced pressure in airthigh houses: Experiments and FDS validation. Fire Saf. J. 2020, 114, 103008. [Google Scholar] [CrossRef]
- NRC; EPRI. Verification and Validation of Selected Fire Models for Nuclear Power Plant Applications; NUREG-1824; EPRI 1011999 [Final Report]; United States Nuclear Regulatory Commission: Washington, DC, USA, 2007. [Google Scholar]
- Mun, S.Y.; Cho, J.H.; Hwang, C.H. Effects of external heat flux and exhaust flow rate on CO and soot yields of acrylic in a cone calorimeter. Appl. Sci. 2021, 11, 5942. [Google Scholar] [CrossRef]
- Acherar, L.; Wang, H.Y.; Coudour, B.; Garo, J.P. Assessment of Semi-Empirical Soot Modelling in Turbulent Buoyant Pool Fires from Various Fuels. Thermo 2023, 3, 424–442. [Google Scholar] [CrossRef]
- Kaczorek-Chrobak, K.; Fangrat, J. PVC-based copper electric wires under various fire conditions: Toxicity of fire effluents. Materials 2020, 13, 1111. [Google Scholar] [CrossRef] [PubMed]
- Jang, H.-Y.; Hwang, C.-H. Obscuration threshold database construction of smoke detectors for various combustibles. Sensors 2020, 20, 6272. [Google Scholar] [CrossRef] [PubMed]
- Yoon, G.Y.; Han, H.S.; Mun, S.Y.; Park, C.H.; Hwang, C.H. DB construction of activation temperature and response time index for domestic fixed-temperature heat detectors in ceiling jet flow. Fire Sci. Eng. 2020, 34, 35–42. [Google Scholar] [CrossRef]
- Peacock, R.D.; McGrattan, K.; Forney, G.P.; Reneke, P.A. CFAST Consolidated Fire and Smoke Transport: Technical Reference Guide, NIST TN 1889v1, 7th ed.; National Institute of Standards and Technology: Gaithersburg, MD, USA, 2021; Volume 1. [Google Scholar]
- Williamson, J.; Beyler, C.; Floyd, J. Validation of numerical simulations of compartment fires with forced or natural ventilation using the fire and smoke simulator (FSSIM), CFAST and FDS. Fire Saf. Sci. 2011, 10, 1277–1288. [Google Scholar] [CrossRef]
- Floyd, J. Comparison of CFAST and FDS for Fire Simulation with the HDR T51 and T52 Tests; United States Department of Commerce, Technology Administration, National Institute of Standards and Technology: Gaithersburg, MD, USA, 2002. [Google Scholar]
- Patterson, N.M. Assessing the Feasibility of Reducing the Grid Resolution in FDS Field Modelling; University of Canterbury: Christchurch, New Zealand, 2002. [Google Scholar]
- Oliva, D.; Somerkoski, B.; Tarkkanen, K.; Lehto, A.; Luimula, M. Virtual reality as a communication tool for fire safety—Experiences from the VirPa project. In Proceedings of the GamiFIN Conference 2019, Levi, Finland, 8–10 April 2019; pp. 241–252. [Google Scholar]
- Yun, H.S.; Hwang, C.H.; Choi, J.H. Evaluation of Predictive Performance of CFAST for Fire Characteristics in Single and Multi-storey Buildings. Trans. Korean Soc. Mech. Eng. B 2022, 46, 441–451. [Google Scholar] [CrossRef]
- Jang, H.-Y.; Hwang, C.-H. Configuration approaches of CFAST for prediction of smoke and heat detector activation times in corridor fires. Appl. Sci. 2023, 13, 13161. [Google Scholar] [CrossRef]
- National Fire Protection Association. NFPA 92 Standard for Smoke Control System; National Fire Protection Association: Quincy, MA, USA, 2012. [Google Scholar]
- Tewarson, A. Generation of heat and chemical compounds in fires. In SFPE Handbook of Fire Protection Engineering, 3rd ed.; DiNenno, P.J., Ed.; National Fire Protection Association: Quincy, MA, USA, 2002. [Google Scholar]
- Mulholland, G.W.; Croarkin, C. Specific extinction coefficient of flame generated smoke. Fire Mater. 2000, 24, 227–230. [Google Scholar] [CrossRef]
- Jin, T.; Yamada, T. Irritating effects of fire smoke on visibility. Fire Sci. Technol. 1985, 5, 79–90. [Google Scholar] [CrossRef]
Figure 1.
(a) Fire and evacuation simulation timeline for performance-based design (PBD) in building fires [8]; (b) Statistical proportions of the evaluation factors that determine the available safety egress time (ASET) [10].

Figure 2.
Schematic of the computational domain for the prediction of physical quantities related to the ASET. (a) FDS; (b) CFAST.
Figure 2.
Schematic of the computational domain for the prediction of physical quantities related to the ASET. (a) FDS; (b) CFAST.

Figure 3.
Fire conditions considered for the predictive performance comparison of the FDS and CFAST: (a) Fire growth rate (slow, medium, fast, and ultrafast); (b) Maximum heat release rate (HRRmax).
Figure 3.
Fire conditions considered for the predictive performance comparison of the FDS and CFAST: (a) Fire growth rate (slow, medium, fast, and ultrafast); (b) Maximum heat release rate (HRRmax).

Figure 4.
Comparison of gas temperatures for different fire models according to the (a) fire growth rate and (b) maximum heat release rate.
Figure 4.
Comparison of gas temperatures for different fire models according to the (a) fire growth rate and (b) maximum heat release rate.

Figure 5.
Comparison of O2, CO2, and CO concentrations for different fire models against the fire growth rate. (a) O2 concentration; (b) CO2 concentration; (c) CO concentration.
Figure 5.
Comparison of O2, CO2, and CO concentrations for different fire models against the fire growth rate. (a) O2 concentration; (b) CO2 concentration; (c) CO concentration.

Figure 6.
Comparison of O2, CO2, and CO concentrations based on the maximum HRR. (a) O2 concentration; (b) CO2 concentration; (c) CO concentration.
Figure 6.
Comparison of O2, CO2, and CO concentrations based on the maximum HRR. (a) O2 concentration; (b) CO2 concentration; (c) CO concentration.

Figure 7.
Comparison of visibility for the different fire models based on the fire growth rate and maximum HRR. (a) Fire growth rate; (b) HRRmax.
Figure 7.
Comparison of visibility for the different fire models based on the fire growth rate and maximum HRR. (a) Fire growth rate; (b) HRRmax.

Figure 8.
Comparison of the gas temperature using FDS and CFAST in terms of changes in the fire growth rate and maximum HRR. (a) Fire growth rate; (b) HRRmax.
Figure 8.
Comparison of the gas temperature using FDS and CFAST in terms of changes in the fire growth rate and maximum HRR. (a) Fire growth rate; (b) HRRmax.

Figure 9.
Comparison of visibility using FDS and CFAST regarding changes in the fire growth rate and maximum HRR. (a) Fire growth rate; (b) HRRmax.
Figure 9.
Comparison of visibility using FDS and CFAST regarding changes in the fire growth rate and maximum HRR. (a) Fire growth rate; (b) HRRmax.

Figure 10.
Comparison of the times needed to reach the critical value by FDS and CFAST. (a) Gas temperature; (b) Visibility.
Figure 10.
Comparison of the times needed to reach the critical value by FDS and CFAST. (a) Gas temperature; (b) Visibility.


Table 1.
Performance Criteria of Life Safety in the Domestic PBD Standard at 1.8 m.
| Parameter | Value |
|---|---|
| Gas temperature | Over 60 °C |
| O2 volume fraction | Under 15% |
| CO2 volume fraction | Over 5% |
| CO volume fraction | Over 1400 ppm |
| Visibility (for a light-reflecting object) | Under 5 m (other facility) |
Disclaimer/Publisher’s Note: The statements, opinions and data contained in all publications are solely those of the individual author(s) and contributor(s) and not of MDPI and/or the editor(s). MDPI and/or the editor(s) disclaim responsibility for any injury to people or property resulting from any ideas, methods, instructions or products referred to in the content. |
© 2024 by the authors. Licensee MDPI, Basel, Switzerland. This article is an open access article distributed under the terms and conditions of the Creative Commons Attribution (CC BY) license (https://creativecommons.org/licenses/by/4.0/).
Share and Cite
MDPI and ACS Style
Jang, H.-Y.; Hwang, C.-H. Evaluation of Available Safety Egress Time (ASET) in Performance-Based Design (PBD) Using CFAST. Fire 2024, 7, 108. https://0-doi-org.brum.beds.ac.uk/10.3390/fire7040108
AMA Style
Jang H-Y, Hwang C-H. Evaluation of Available Safety Egress Time (ASET) in Performance-Based Design (PBD) Using CFAST. Fire. 2024; 7(4):108. https://0-doi-org.brum.beds.ac.uk/10.3390/fire7040108
Chicago/Turabian StyleJang, Hyo-Yeon, and Cheol-Hong Hwang. 2024. "Evaluation of Available Safety Egress Time (ASET) in Performance-Based Design (PBD) Using CFAST" Fire 7, no. 4: 108. https://0-doi-org.brum.beds.ac.uk/10.3390/fire7040108