
Probabilistic Forecasting of Lightning Strikes over the Continental USA and Alaska: Model Development and Verification

1
USDA Forest Service Rocky Mountain Research Station, Fort Collins, CO 80526, USA
2
Cooperative Institute for Research in the Atmosphere, Colorado State University, Fort Collins, CO 80521, USA
*
Author to whom correspondence should be addressed.
Fire 2024, 7(4), 111; https://0-doi-org.brum.beds.ac.uk/10.3390/fire7040111
Submission received: 16 January 2024
/
Revised: 22 March 2024
/
Accepted: 26 March 2024
/
Published: 28 March 2024
(This article belongs to the Special Issue Probabilistic Risk Assessments in Fire Protection Engineering)
Abstract
:Lightning is responsible for the most area annually burned by wildfires in the extratropical region of the Northern Hemisphere. Hence, predicting the occurrence of wildfires requires reliable forecasting of the chance of cloud-to-ground lightning strikes during storms. Here, we describe the development and verification of a probabilistic lightning-strike algorithm running on a uniform 20 km grid over the continental USA and Alaska. This is the first and only high-resolution lightning forecasting model for North America derived from 29-year-long data records. The algorithm consists of a large set of regional logistic equations parameterized on the long-term data records of observed lightning strikes and meteorological reanalysis fields from NOAA. Principal Component Analysis was employed to extract 13 principal components from a list of 611 potential predictors. Our analysis revealed that the occurrence of cloud-to-ground lightning strikes primarily depends on three factors: the temperature and geopotential heights across vertical pressure levels, the amount of low-level atmospheric moisture, and wind vectors. These physical variables isolate the conditions that are favorable for the development of thunderstorms and impact the vertical separation of electric charges in the lower troposphere during storms, which causes the voltage potential between the ground and the cloud deck to increase to a level that triggers electrical discharges. The results from a forecast verification using independent data showed excellent model performance, thus making this algorithm suitable for incorporation into models designed to forecast the chance of wildfire ignitions.
1. Introduction
Lightning has been an increasing cause of wildfires in recent decades. Although, historically, lightning has only caused 15–20% of wildfire occurrences in the USA, lightning-ignited wildfires account for about 60% of the annually burned acreage. In the extratropical portion of the Northern Hemisphere, lighting is responsible for 77% of the burned wildfire area every year [1]. Hence, the capability to predict lightning 7–10 days in advance on a continental scale, at a high spatial resolution using operational, numerical weather forecasts as drivers, is a key prerequisite for any modeling efforts aimed at quantifying the chances of wildfire ignition over large regions.
Attempts to model lightning date back to 1980s [2,3]. These early studies recognized the importance of lightning in wildfire occurrences and that lightning’s frequency was correlated with the low-level moisture flux induced by strong upward vertical motions in the boundary layer during storms [3]. With the advancement of numerical weather prediction (NWP) models, an effort was made to incorporate lightning into operational forecasts based on “first principles” using simulated thunderstorm parameters and the microphysical properties of clouds as drivers [4,5,6]. These studies found promising relationships between lightning’s frequency and the depth of convective clouds as well as between a parameter called the Potential Electrical Energy (PEE) of clouds and noninductive charge separation, which involves collisions of graupel and ice particles in the presence of supercooled liquid water. PEE was assumed to dissipate when it exceeds preassigned threshold values, causing lightning to be generated. The Lightning Potential Index (LPI) was introduced as a new parameter in weather forecast models to measure the potential for the generation and separation of the electrical charges leading to lightning flashes in convective thunderstorms [5]. The LPI is calculated within the charge separation region of clouds between 0 °C and −20 °C, where the noninductive mechanism involving the collisions of ice and graupel particles in the presence of supercooled water is most effective. Studies have shown that the LPI is well correlated with observed lightning. Wong et al. [7] found that the Price and Rind lightning parameterization scheme [4] did not produce correct distributions for lightning flashes in the context of convection-resolving forecasts produced by the Weather Research and Forecasting (WRF) model. Recently, satellite observations have revealed a strong correlation between the number of lightning strokes and the vertical distribution of ice particles, as depicted by the 94 GHz products of the Cloud Profiling Radar on board the CloudSat (a polar satellite of NASA’s Earth System Science Pathfinder) [8]. These data could help improve the existing mechanistic schemes of cloud electrification to predict lightning that are employed by modern NWP models.
When the goal is the generation of accurate lightning forecasts over a limited domain, the best approach is to derive region- and season/time-specific lightning activity models using multivariate statistical methods that relate the observed probability of lightning flashes/strikes to a large number of atmospheric parameters describing the vertical structure of thunderstorms. This approach typically involves machine learning algorithms such as random forest or a combination of a stepwise regression analysis, Principal Component Analysis (PCA), and logistic regression [9,10,11,12,13]. Our study elected to apply PCA and logistic regression to a large archive of historical lightning and meteorological data spanning 29 years over the USA (see the Section 2 for details).
In the USA, the National Predictive Services (NPS) is an interagency group tasked with the operational delivery of 7-Day Wildfire Potential Outlooks for fire management operations. The NPS asked the Rocky Mountain Center (RMC), an applied research unit at the US Forest Service Rocky Mountain Research Station (RMRS), for Fire–Weather Intelligence to develop a system of statistical models for predicting wildfire ignition probabilities on a national grid using numerical weather forecasts by the National Weather Service as input. As a first step in the project, the RMC built a lightning forecast model. This paper describes the methodology employed by the RMC to derive a suite of regional, monthly, logistic equations capable of estimating the probability of cloud-to-ground (CG) lightning strikes, using forecast weather fields, on a 20 km grid over the continental USA (ConUS) and Alaska (AK), and the verification of these equations against independent data.
2. Materials and Methods
The overall approach of this study followed the original methodology proposed by Bothwell [14], which was later also adopted by Buckey [15] and Richardson [16]. We used datasets of much longer durations to derive new and improved lightning prediction equations for the ConUS and AK.
2.1. Georeferenced Datasets
Table 1 lists the datasets utilized for the ConUS. The developmental database included two 29-year-long climatological records of weather reanalysis fields and observed lightning strikes over the ConUS. These were used to derive lightning forecast regression equations. The NOAA North American Regional Reanalysis (NARR) [17], containing 3D fields from 00:00, 03:00, 06:00, 09:00, 12:00, 15:00, 18:00, and 21:00 UTC for the period from January 1990 to 2018, were downloaded and archived in GRIB2 format. The lightning data for the lower 48 states (ConUS) were provided by Vaisala [18] through a Federal Contract with the Bureau of Land Management (BLM) at the US Department of the Interior. Vaisala’s historical lightning dataset, covering the period from January 1990 to December 2018, was delivered to our team by the Western Regional Climate Center at the Desert Research Institute in Reno, NV, USA. According to the signed contract between Vaisala and BLM, only US Government Agencies may use the lightning dataset free of charge for scientific research. Three-hour forecast-gridded fields extending over 10 days, produced by the NOAA Global Forecast System (GFS) [19], were also downloaded and archived in GRIB2 format (0.25 × 0.25 degree) for the core fire season (April–September) of 2018 in order to verify our lightning forecast equations against independent data.
The development of the lightning forecast model for AK used similar datasets as the ConUS model but covered a shorter time period. NARR was used as a source of observed gridded weather fields and the Alaska Lightning Detection Network (ALDN) [20], owned and maintained by the Alaska Fire Service (AFS) [21], was utilized as a source of geo-referenced lightning-strike data. The training datasets for AK spanned a period of 10 years (from 2012 to 2021). The reason for this was that, during the summer of 2012, ALDN replaced Vaisala’s Impact sensors, which detect lighting flashes, with Time-Of-Arrival (TOA) sensors (provided by TOA Systems, Inc. Melbourne, FL, USA), which record lightning strikes. A comparison study conducted by the AFS, reported online (at https://oasishub.co/dataset/alaska-historical-lightning-from-1986-to-2017-alaska-interagency-coordination-centre accessed on 25 March 2024), found that the new TOA ALDN detects about 2.25 times more lightning events than the older Vaisala sensors. About 60% of this increase is attributable to the difference in detecting strikes vs. flashes (a flash can contain multiple strikes), with the remaining 40% increase resulting from an improved detection efficiency, expanded spatial sensor coverage, and a longer detection range. Since the TOA sensors will continue to be used in the future, we decided to exclude from our analysis all lightning flash data collected by the Vaisala Impact sensors prior to 2012.
2.2. Statistical Methods and Procedures of Model Development
Lightning strikes are binomially distributed events, meaning that lightning’s occurrence is a variable with only two possible outcomes, 0 or 1 (i.e., absent or present). The probability of binary variables can be described by logistic equations or sigmoid functions. Our model employs logistic regression, which uses a supervised machine learning algorithm that performs binary classification tasks by predicting the probability of the occurrence of an event [22]. The model development proceeded in four stages.
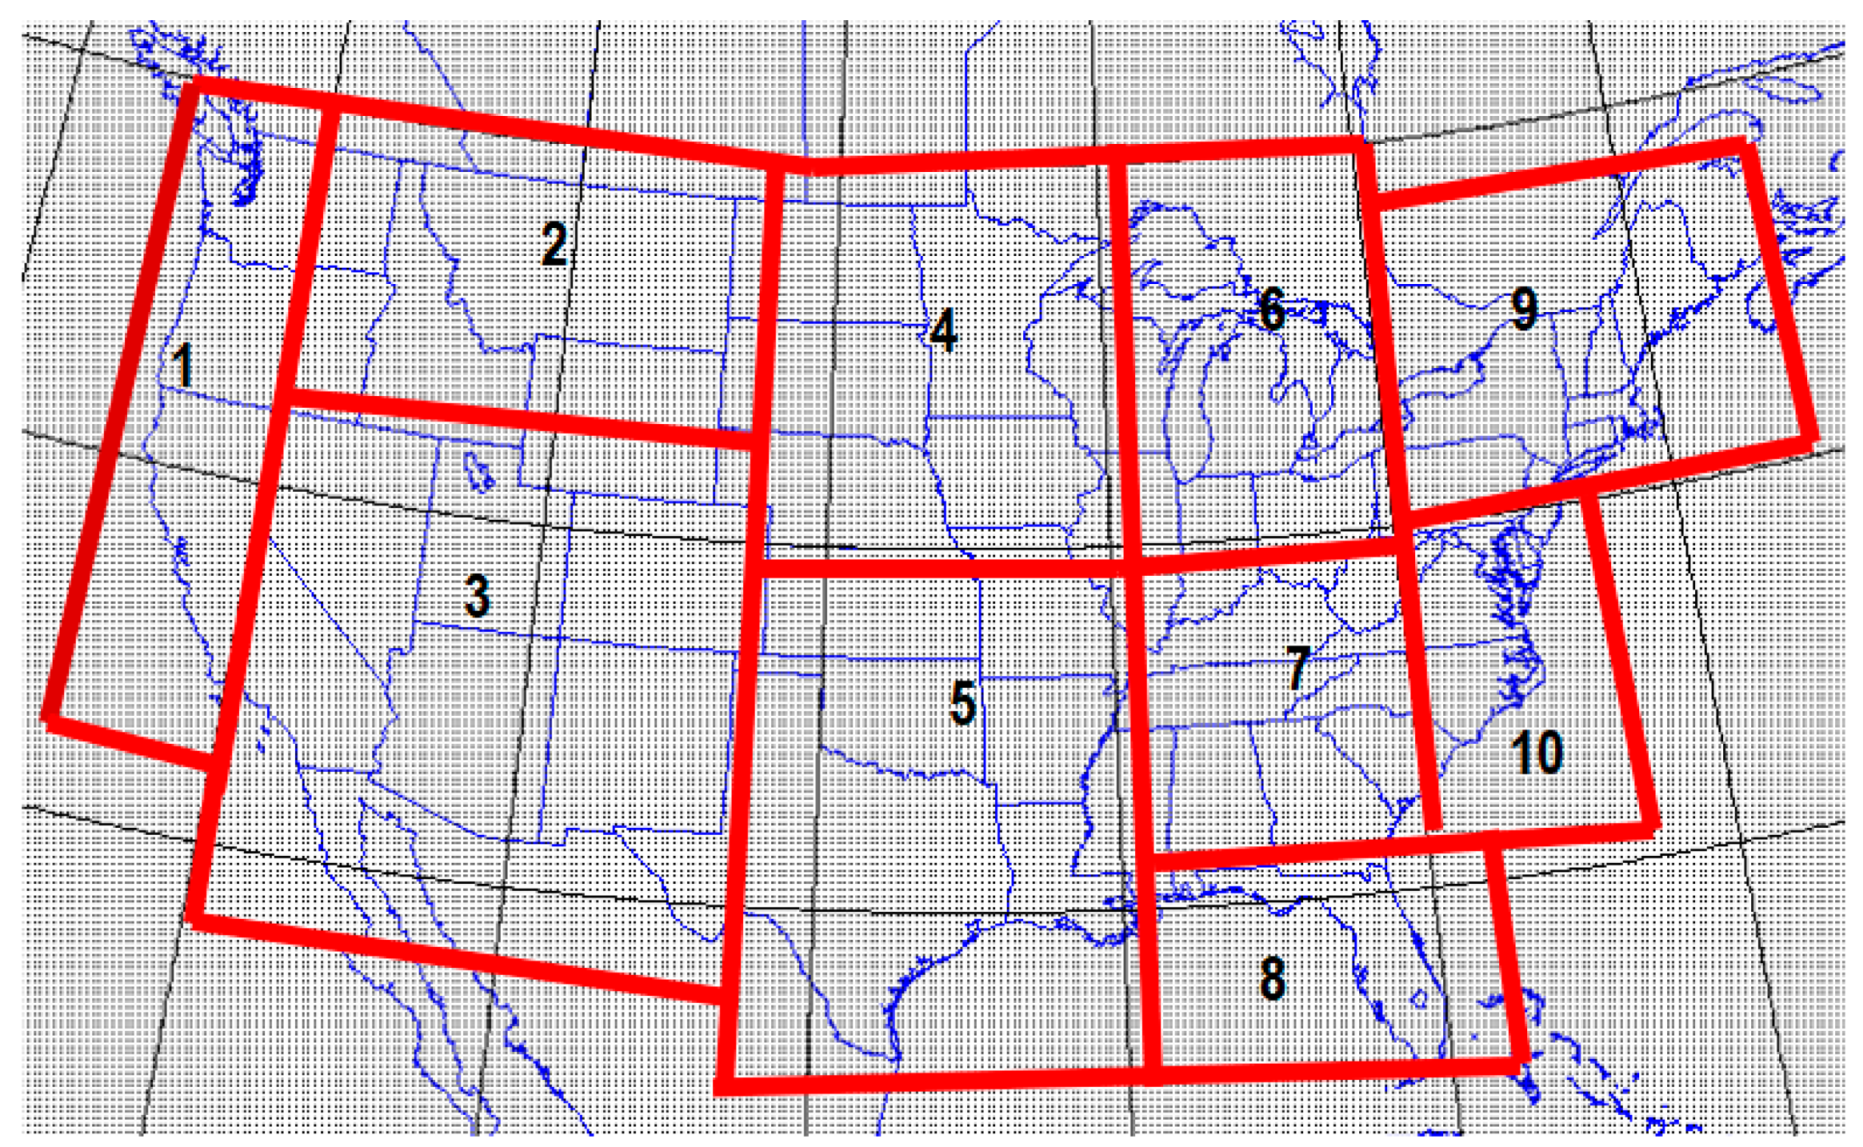
First, lightning data and NARR weather fields were aggregated and re-projected on a 20 km resolution grid. For NARR data, each month over the ConUS, and May through to September over AK, was represented by an average diurnal cycle with a 3 h resolution containing 8 temporal bins. Logistic equations for the probability of lightning strikes were derived for each temporal bin of every fire season month. Since AK has virtually no lightning events during the cold fall–winter season, we did not derive lightning forecast equations for the period from the 1 October to the 30 April for this area. In an effort to improve the overall skill of the lightning forecast model, given the large geographic extent of the lower 48 states, the ConUS domain was divided into 10 subregions by taking into account the differences in its latitude, topography, fuels, climate, and soil moisture regimes (Figure 1). A single region was employed for AK to allow sufficient lightning events to be included in the analysis.
The second step of data processing involved the creation of weather and lightning climatologies for each temporal bin in every respective month, using 27-year-long data records for the ConUS and 10-year records for AK.
Thirdly, a PCA process known as “varimax/orthogonal rotation” [23] was applied to the gridded NARR and lightning climatological datasets to analyze 611 potential meteorological drivers (predictors). The PCA reduced the large cohort of 3D meteorological drivers to a smaller subset of 13 statistically significant lightning predictors (principal components).
Finally, logistic regressions were performed using the first 13 PCs along with the lightning climatologies from every region and temporal bin to derive predictive equations for calculating the probabilities of “one or more” and “10 or more” strikes. The logistic equations have the following general form:
where is the probability of a lightning strike, is the ith predictor (PC), and is the estimated regression coefficient (weight) for that predictor. The “R” statistical package [24], an open source software, was utilized to perform both the PCA and the logistic regressions.
The above statistical procedure, combining PCA with logistic regression to predict lightning, was chosen instead of building a detailed process-oriented model using cloud microphysics for two reasons: (a) the current mechanistic understanding of lightning’s generation is not detailed enough to allow for the development of accurate lightning-prediction models from “first principles”; and (b) the historical, climatological datasets of coarse spatial resolution (20–32 km), such as NARR, available for model parameterizations do not contain information about cloud microphysical properties, which typically vary on spatial scales of tens of meters. Furthermore, our statistical procedure was found by previous research to be among the most successful techniques available for operational lightning forecasting [12].
2.3. Model Verification Procedure
The model’s performance was evaluated using independent meteorological and lightning data from 2018 for the ConUS and from 2022 for AK. These were data not included in the statistical parametrization of the logistic lightning equations. The meteorological drivers for the verification came from two sources: NARR reanalysis fields and GFS grids. To avoid the biases introduced by forecast weather fields and allow a comparison between the NARR-driven 0–3 h forecast and GFS-driven lightning forecasts, we used GFS data from the same 0–3 h initialization period. Since GFS is an operational model run every 6 h that produces 7-day forecasts, it was ideal for incorporation into a 7-day forecast product. For this reason, the skill of the lightning model was also evaluated under forecast weather conditions, where projected GFS fields of up to 7 days were used.
The model verification procedure employed two primary statistical metrics: (a) reliability diagrams (RDs), comparing model-forecast probabilities to the observed relative frequencies of lightning strikes [25]; and (b) Receiver Operating Characteristic (ROC) curves, quantifying the relationship between the False Positive Rates (on the X axis) and True Positive Rates (on the Y axis) at different classification thresholds [26]. A key feature of the ROC diagrams is the Area Under the Curve (AUC), which provides an aggregate measure of the model’s performance across all possible classification thresholds. The closer the AUC is to 1.0, the higher the spatial accuracy of the model’s forecasts. RDs and ROC curves were calculated for the model predictions driven by observed weather fields from NARR and GFS (0–3 h initialization) and forecast GFS weather fields extending over 7 days.
As a means of qualitative assessment, we generated maps overlaying the forecast lightning probabilities with the observed number of lightning strikes in each 20 km grid cell. Specifically, we plotted the 24 h maximum lightning forecast probabilities against the observed lightning strikes in the same time period.
3. Results
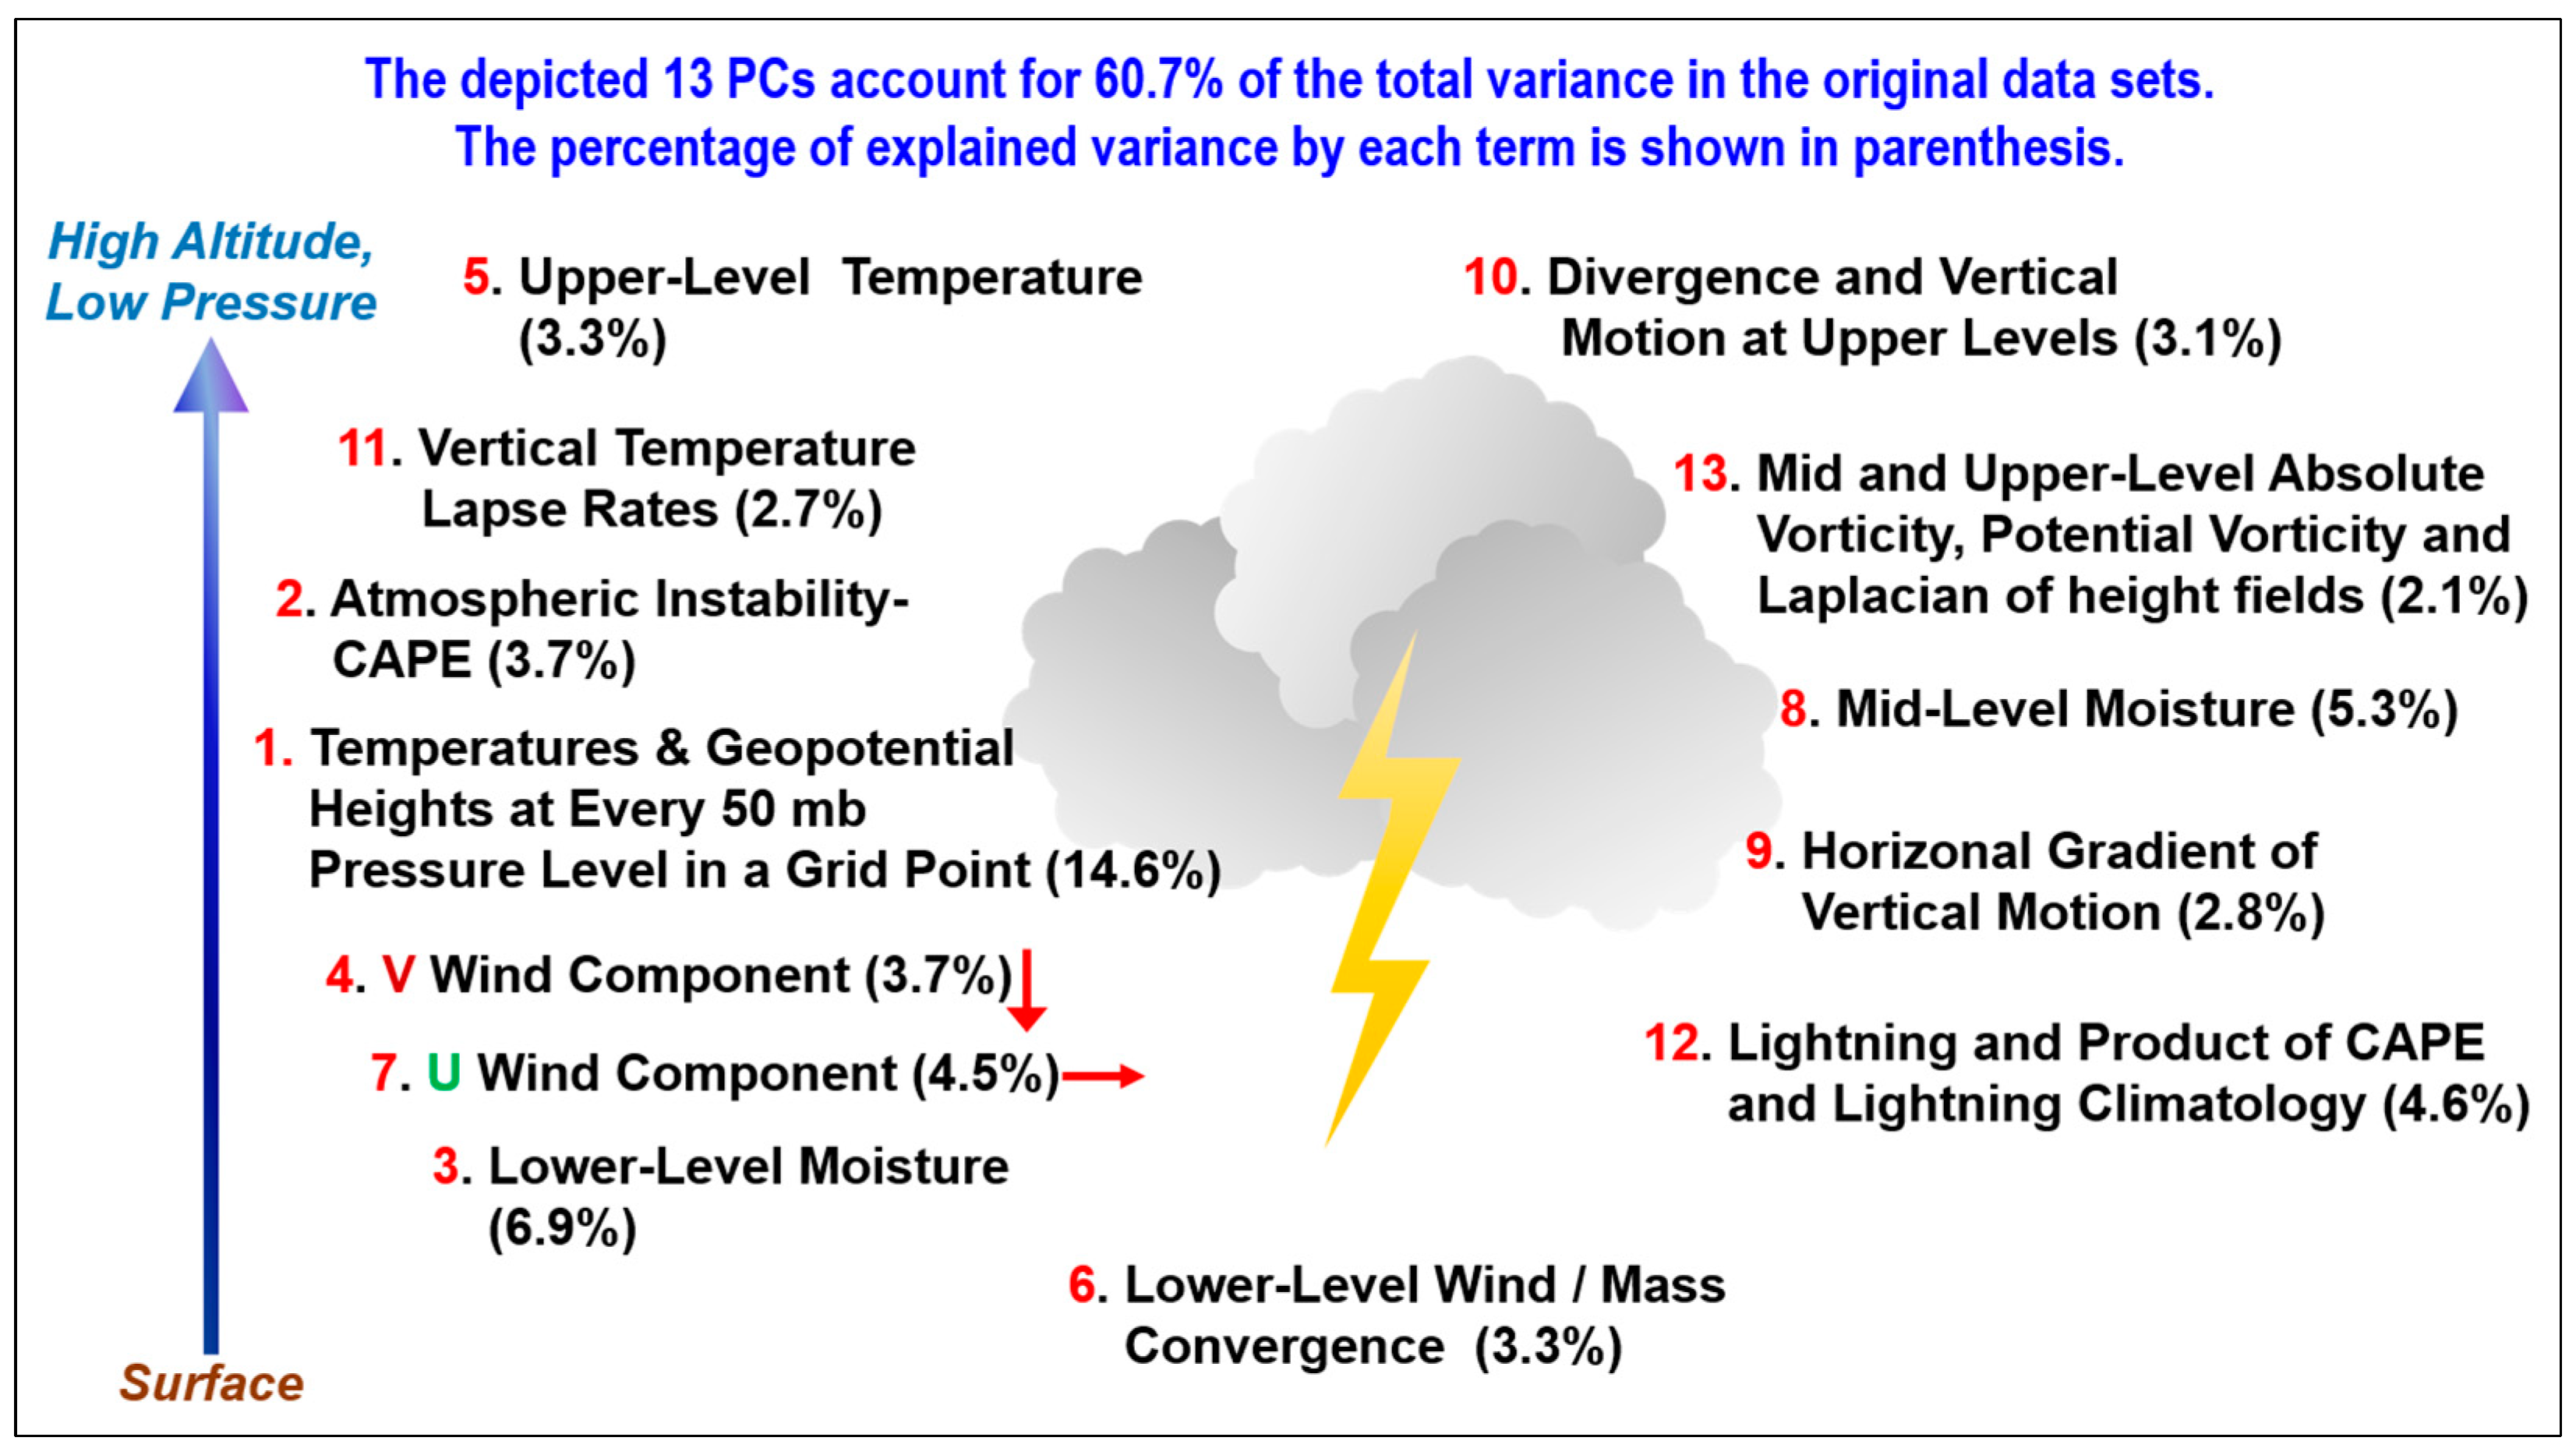
The PCA yielded 13 principal components (PCs) that were employed as predictors for the 10 ConUS regions depicted in Figure 1, for AK, and for all 3 h bins in every month. Each PC represents a linear combination of participating base variables. The components covered variables near the surface as well as at vertical pressure levels from 700 mb to 100 mb, in 50 mb increments (Figure 2). Our PCA method with orthogonal rotation found similar terms and grouped them together into individual components. Note that CAPE (the Convective Available Potential Energy) was singled out as a separate PC despite the fact that it is derived from the variables in components 1, 3, 5, 8, and 11. This is because CAPE experiences a non-stationary relationship with these variables depending on the vertical temperature and moisture profiles. Hence, these components do not have a persistent, one-way correlation with CAPE and can either increase or decrease the value of CAPE.
The 13 PCs collectively explained nearly 61% of the total variance of CG strikes in all regions and time periods over the ConUS (Figure 2). The temperatures and geopotential heights at every 50 mb vertical pressure level at a grid point emerged as the strongest predictor among the 13 PCs, accounting for 14.6% of the observed variance in CG strikes.
Logistic equations quantifying the probabilities of CG strikes were derived using the multi-year climatologies from each 3 h diurnal bin of every month and region, employing the 27-year-long records of NARR and lightning grids for the ConUS and 10-year long data records for AK. Each month of the year was described using eight logistic equations per region, i.e., one equation for every 3 h bin of the average 24 h diurnal cycle for that month. This produced 960 equations for the ConUS and 40 equations for AK.
The output files from the “R” software (Version 4.2.2) containing the lightning prediction equations were combined with the 3D meteorological fields generated by the GFS to produce operational lightning probability forecasts at 20 km resolution over 7 days for the ConUS and AK. The forecasts were delivered in a graphic format to field users through a customized website [27].
Model Verification
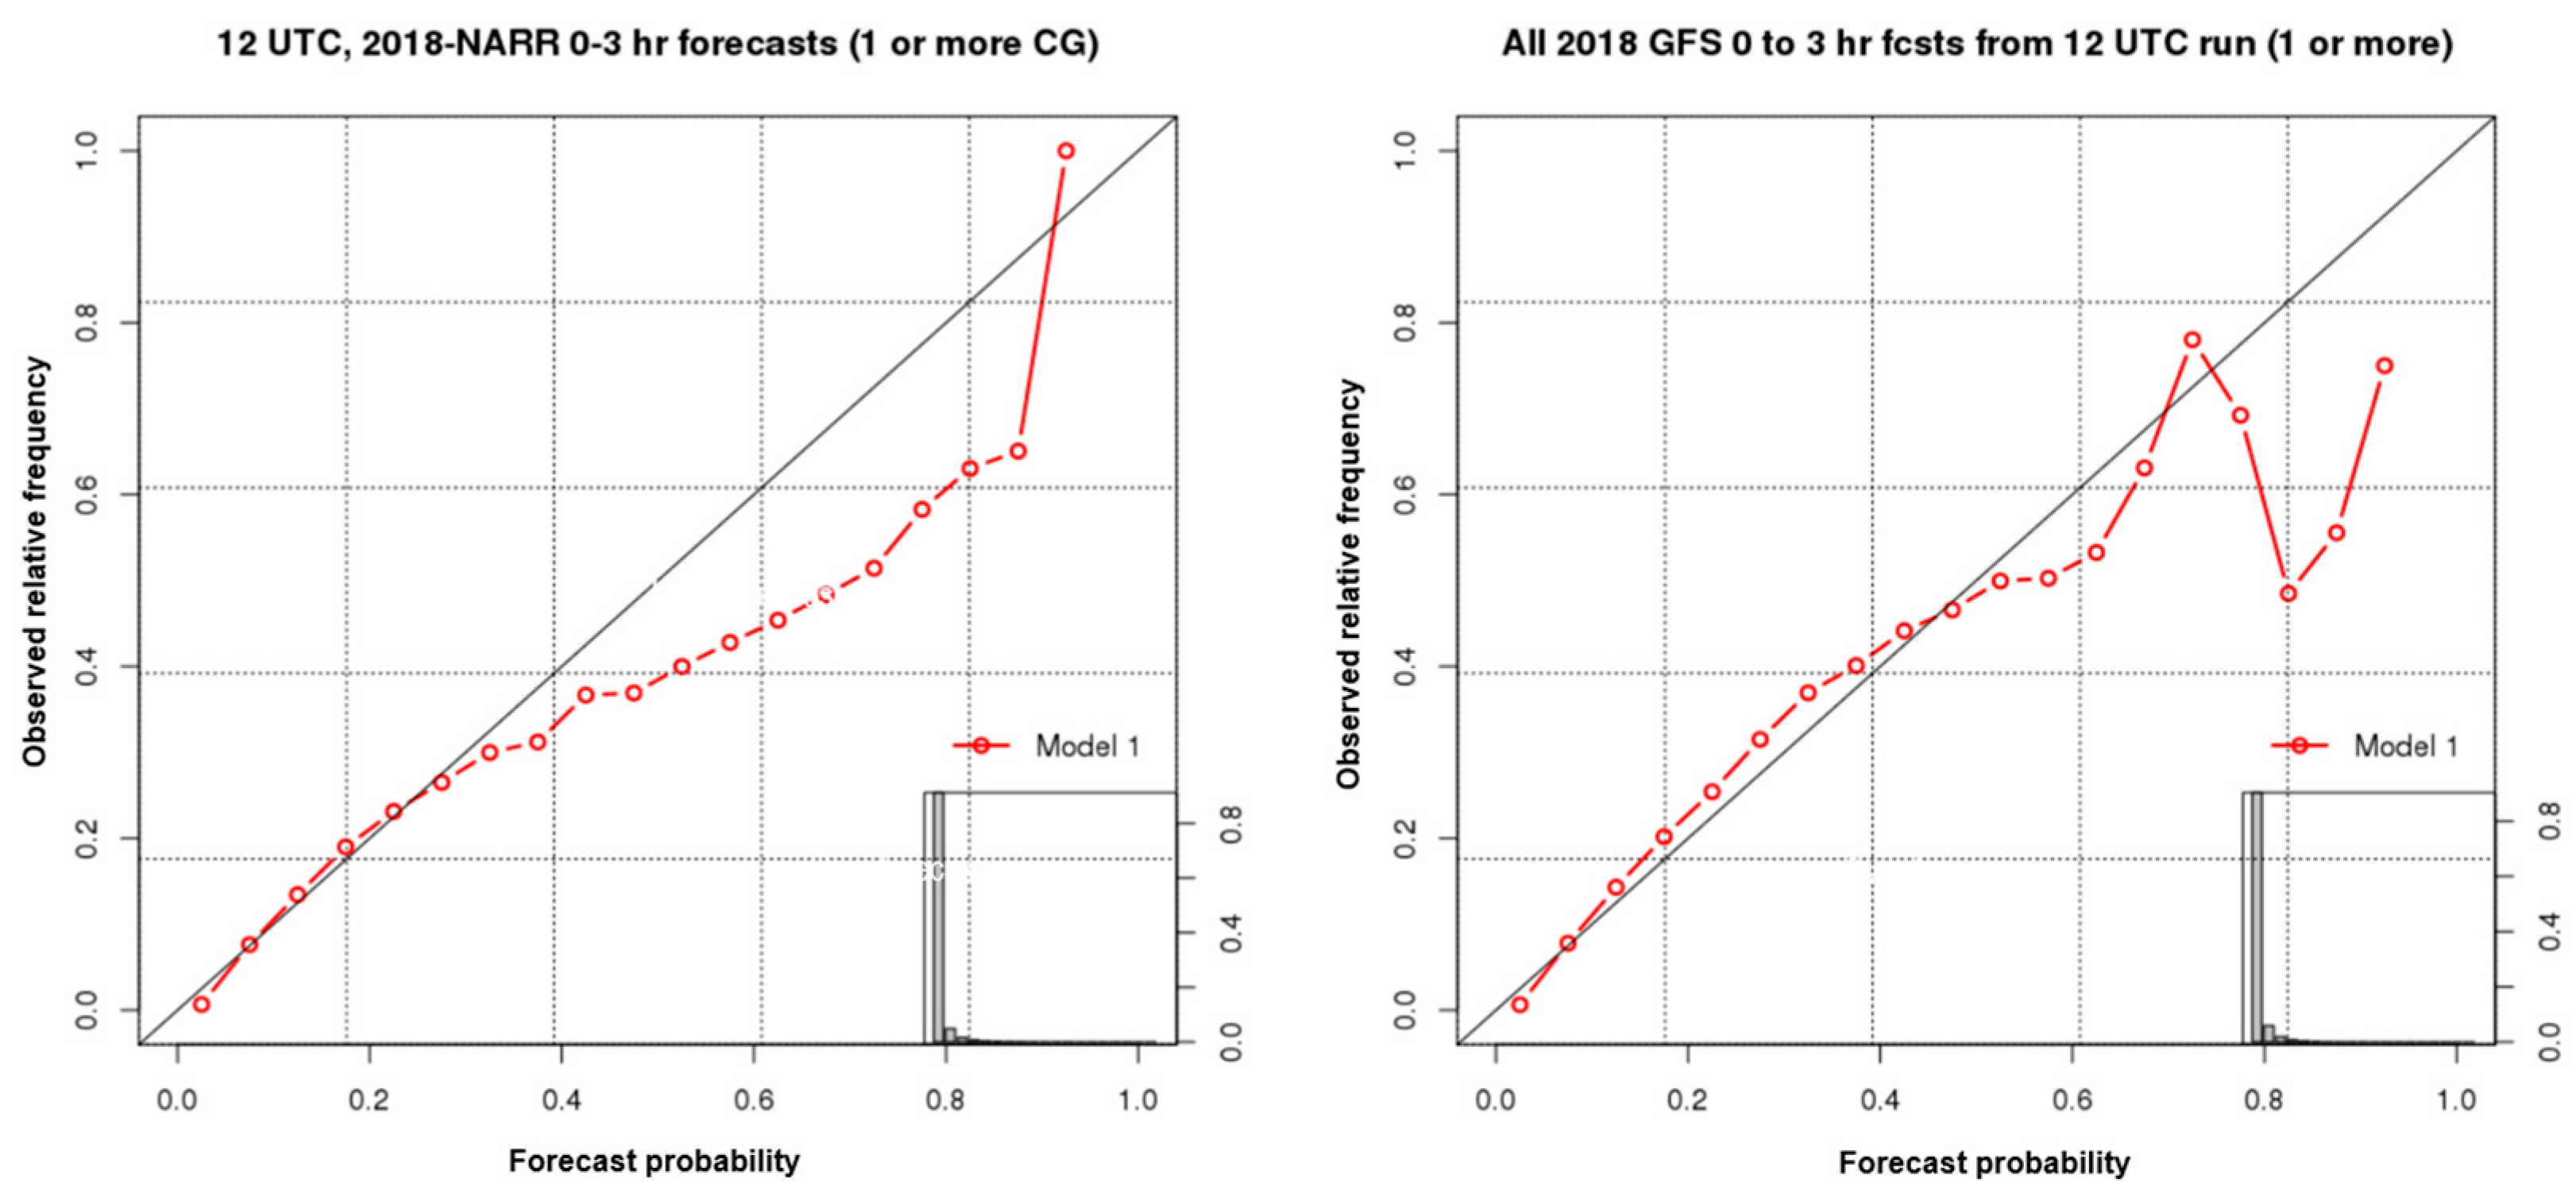
Figure 3 compares side-by-side reliability diagrams of NARR- and GFS-driven 3 h forecasts for June, July, and August of 2018 over the ConUS, employing independent meteorological and lightning data. The histograms visible in the lower right corner of the reliability diagrams depict the areal fraction of the forecasts in each probability “bin”, represented by the open circles on the diagrams. These histograms reveal that the vast majority of forecasts refer to lower probabilities, with large areas having a near-zero chance of lightning. Figure 4 shows the ROC curves and corresponding AUCs for the same data. The decimal values on the ROC curves represent the sample’s forecast probabilities of lightning and show where such probabilities fall with respect to the Hit Rate (the fraction of grid points with a correct prediction) and False-Alarm Rate (the fraction of grid points with an incorrect prediction). For example, in Figure 4, 0.1 refers to a 10% forecast chance of lightning, which has a Hit Rate of ~48% and a False-Alarm Rate of ~7%. The lower the False-Alarm Rate is for any given Hit Rate, the larger the AUC and the better the forecast. AUC values that are close to or slightly higher than 0.9 indicate excellent-to-outstanding model accuracy in predicting the probabilities of one or more CG lightning strikes over the ConUS [28]. Surprisingly, the GFS-driven forecasts (using the initial 3 h) performed slightly better than those driven by NARR data. This might be a result of recent code upgrades made to the GFS model by NOAA.
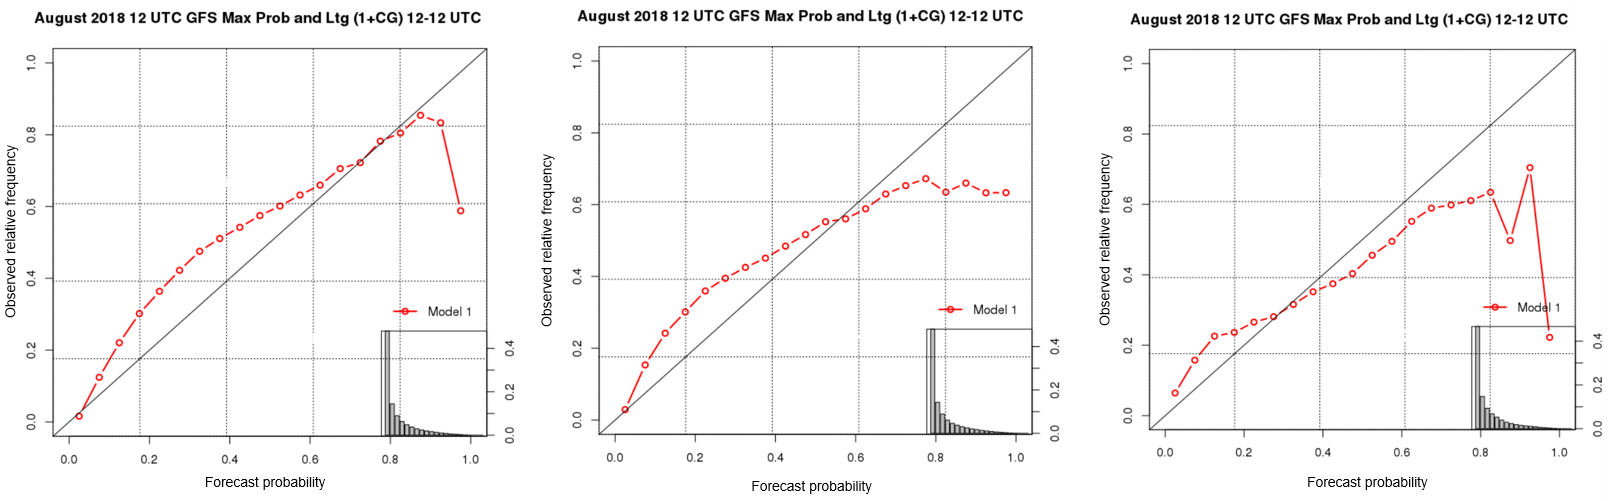
Figure 5 depicts the RDs of the 24 h maximum lightning probabilities for forecast days 1, 3, and 7 in August of 2018 over the ConUS. It is important to note that forecast probabilities greater than 0.7 only occur in less than 0.1% of grid points and that 99.9% of the ConUS area exhibits a chance of lightning strikes less than 0.7 (70%). Thus, the larger deviations of the red curves from the 1:1 line for probabilities greater than 0.7 which are visible in Figure 3 and Figure 5 are essentially immaterial with regard to the actual model’s performance. Figure 5 illustrates that the model also yielded reliable predictions up to 7 days in advance when using the forecast GFS weather fields as drivers.
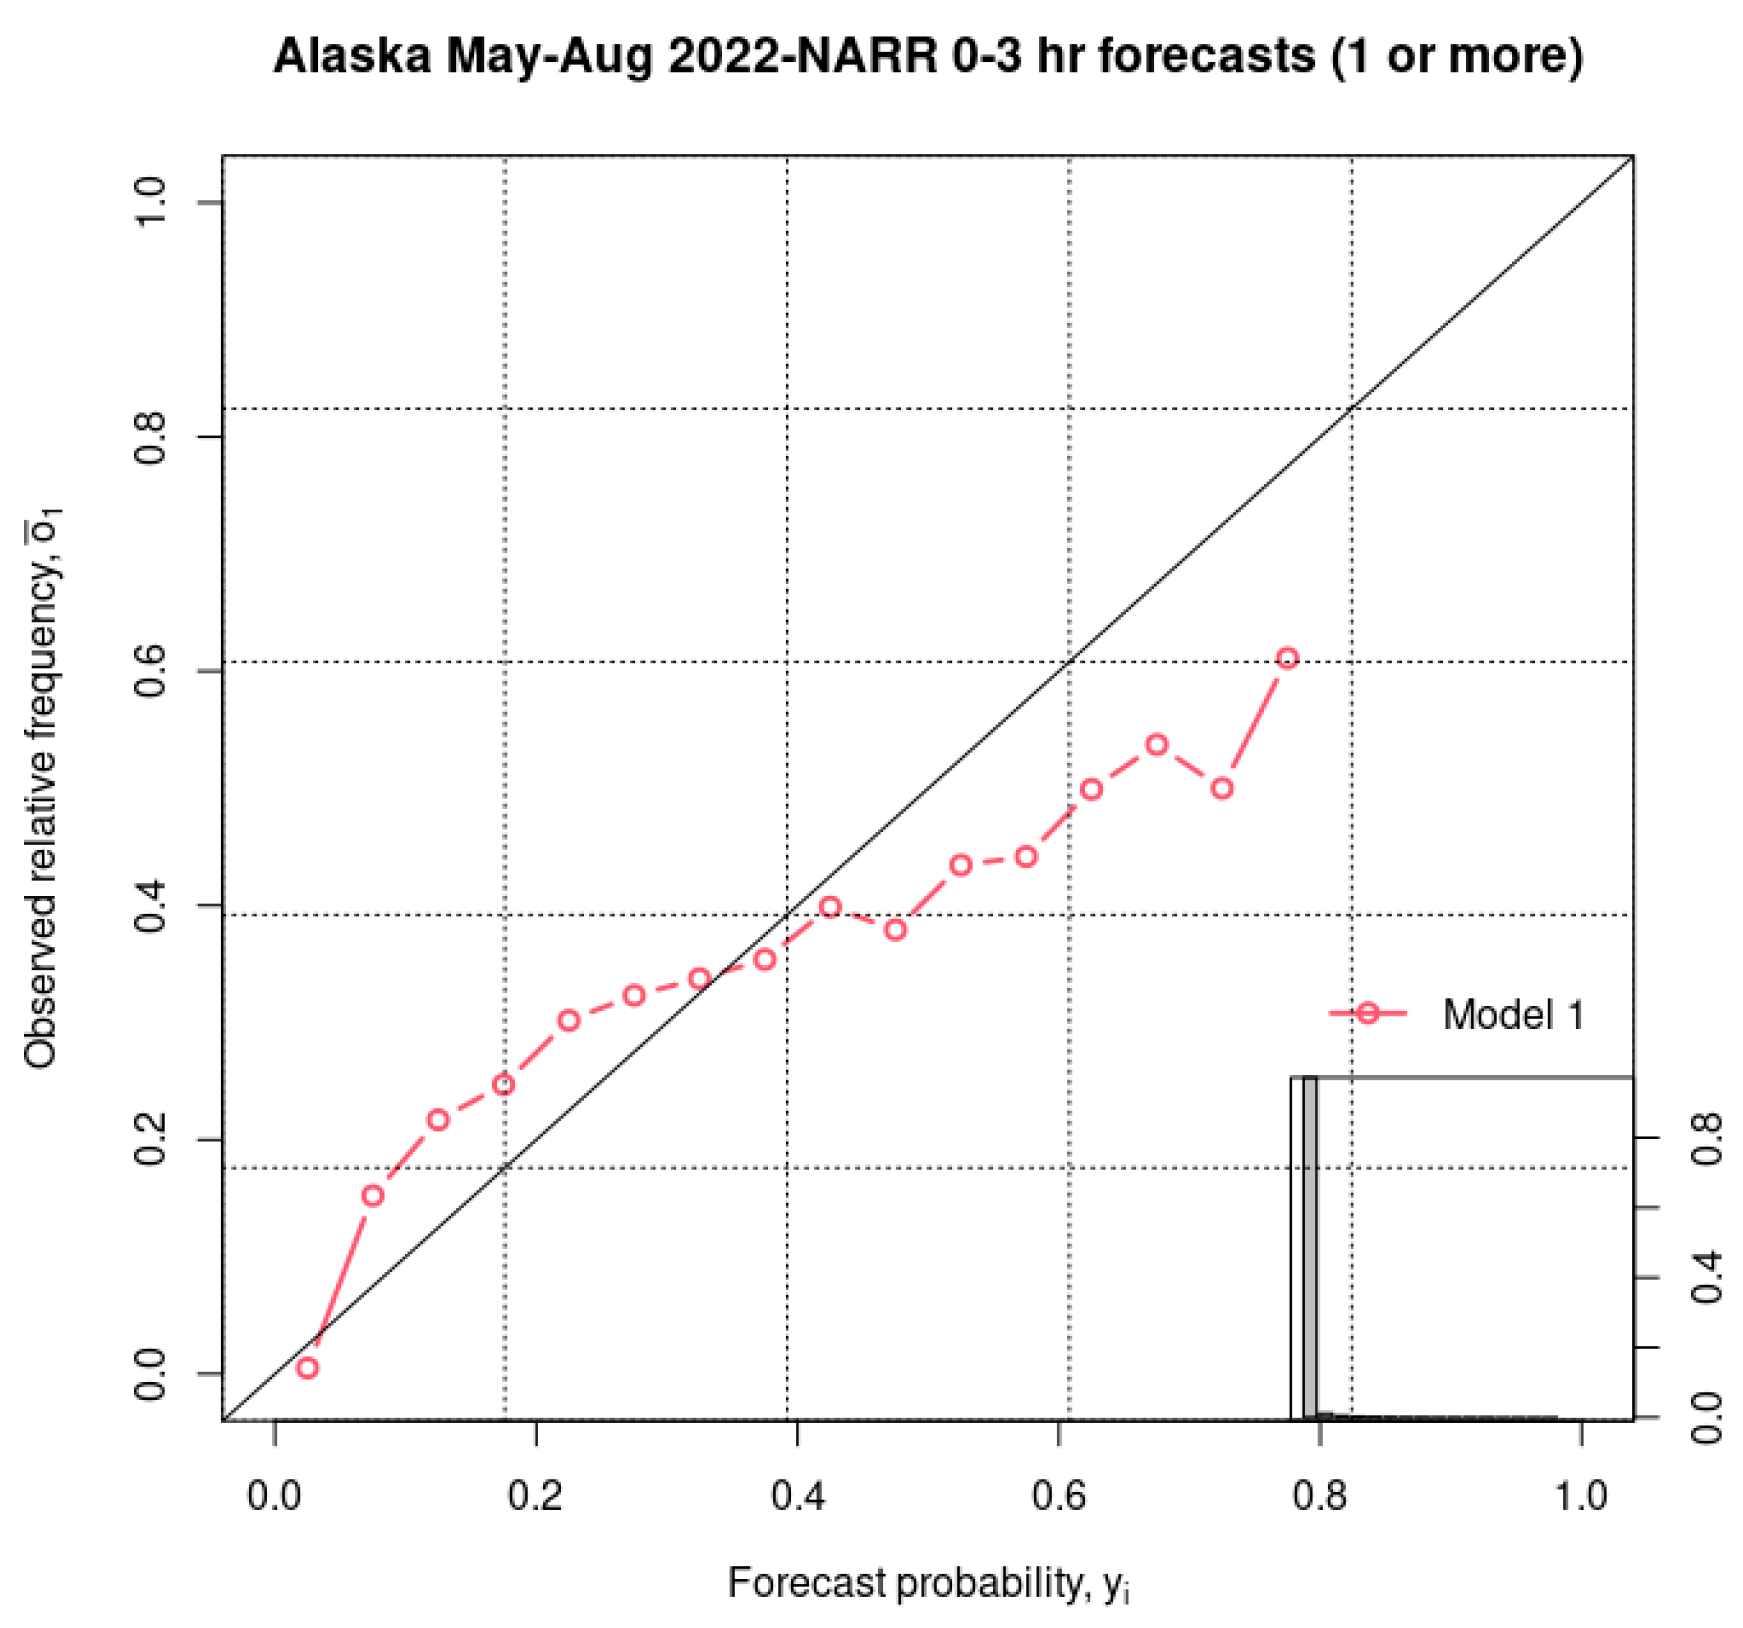
Figure 6 depicts a reliability diagram of the NARR-based lightning forecasts for Alaska, covering the entire fire season (1 May–31 August) of 2022. Once again, the red curve is very close to a perfect model data match (the 1:1 line) for all probabilities that are meaningfully represented over the AK domain.
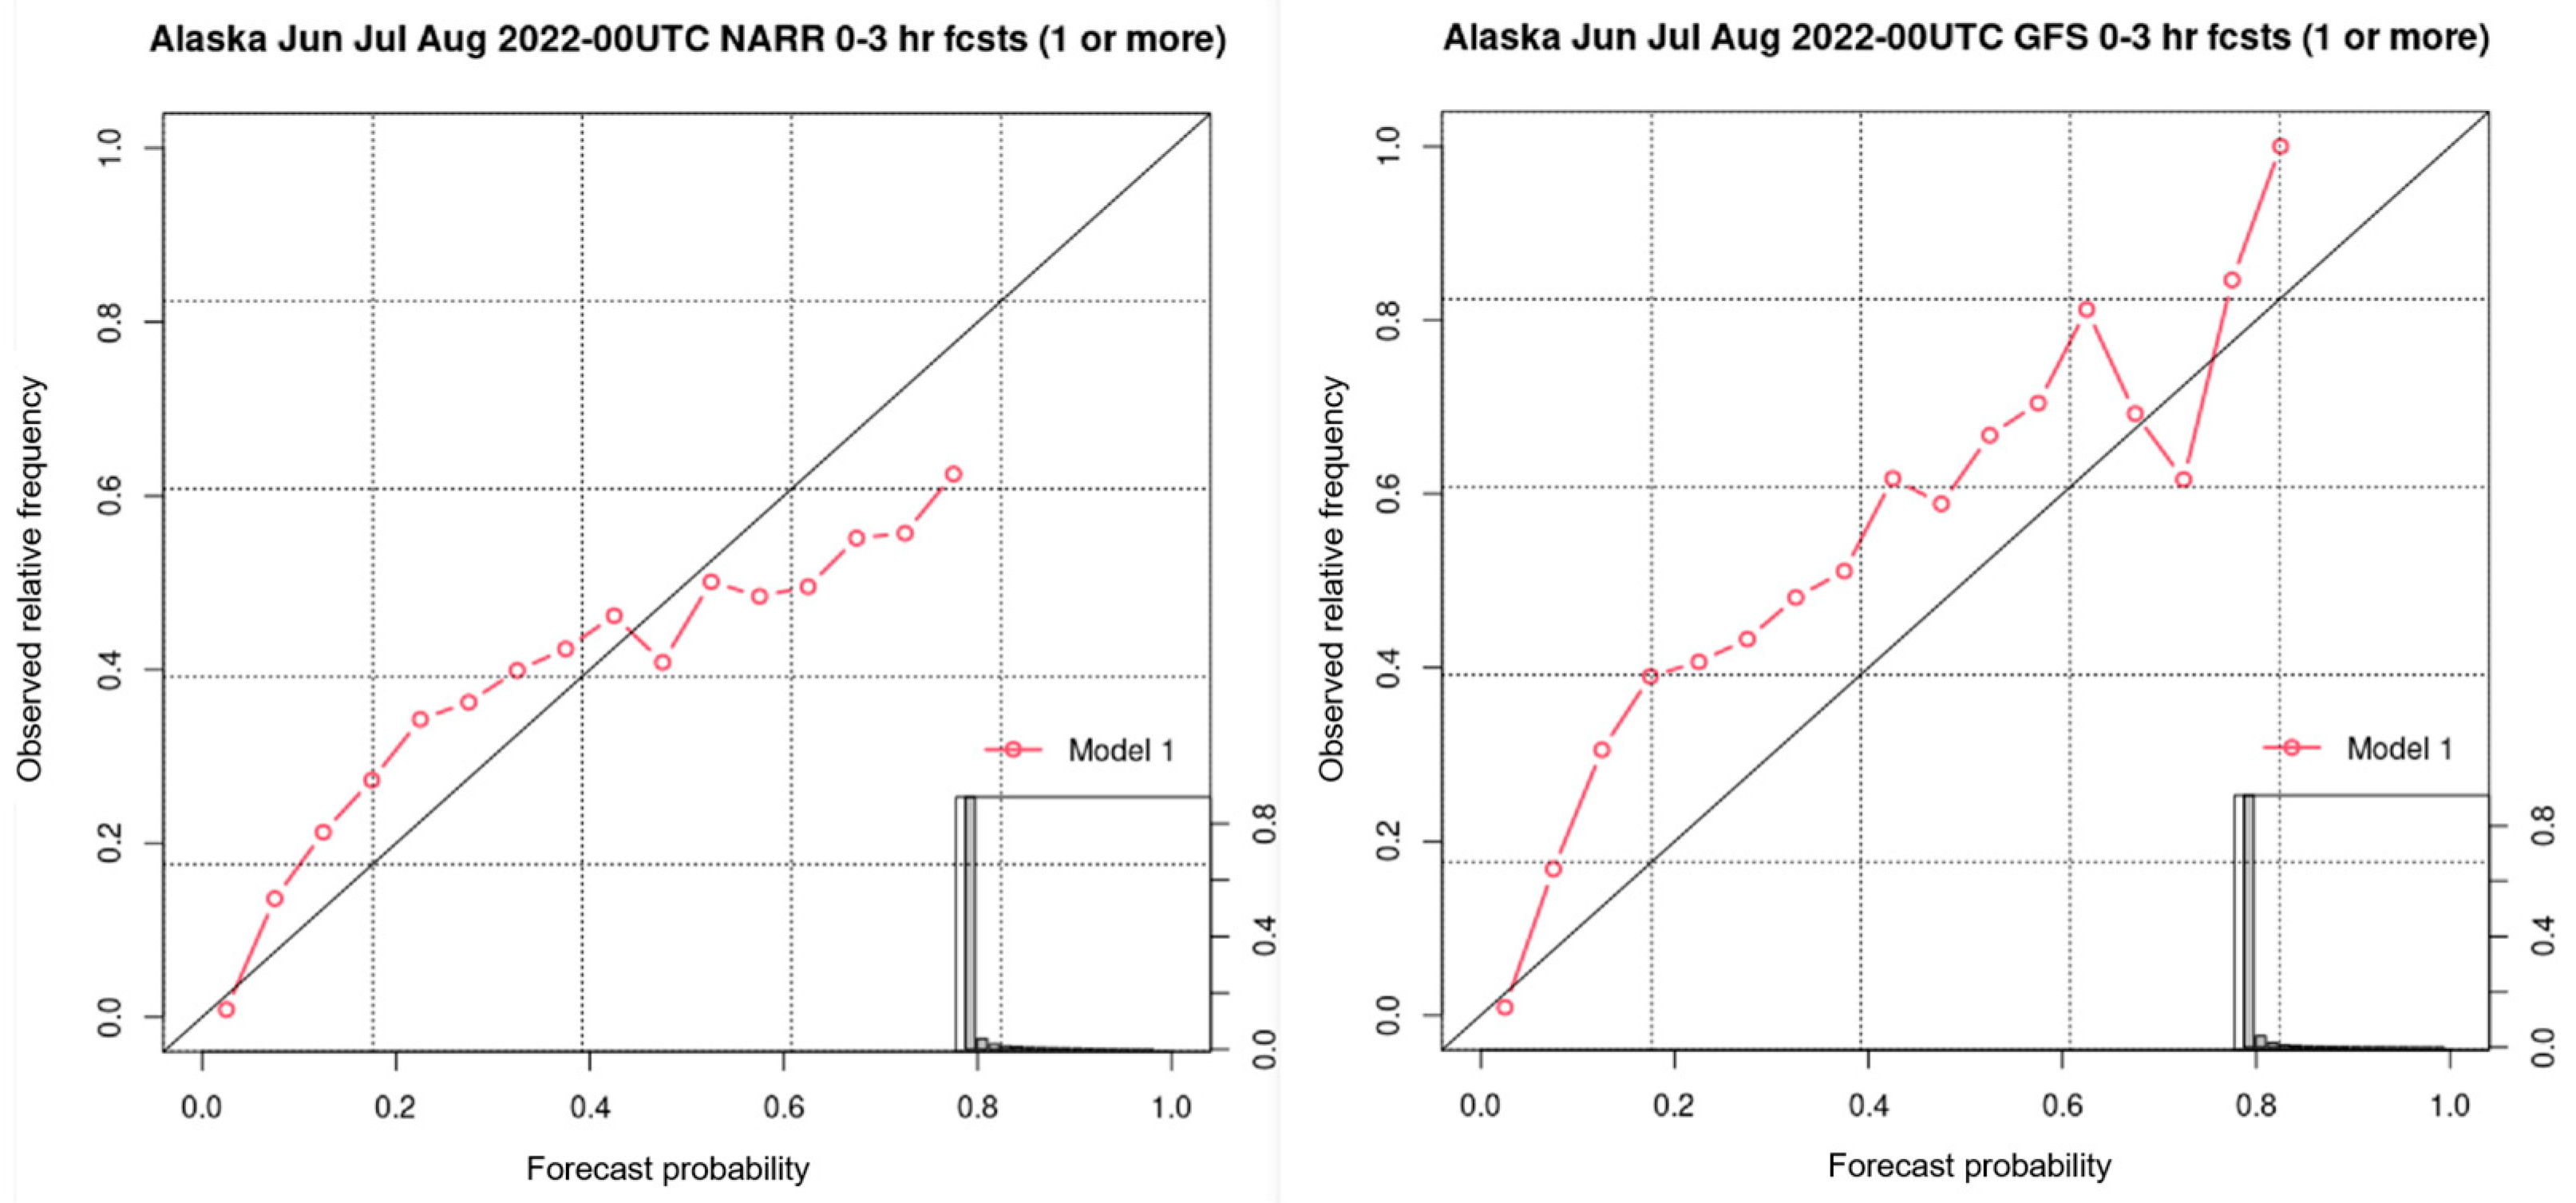
Figure 7 compares the reliability diagrams of lightning predictions driven by either NARR data (left panel) or GFS initialization fields (right panel) during the most active portion of the 2022 fire season (1 June–31 August) in AK. Overall, the NARR-based lightning forecasts display better accuracy than those based on GFS initialization fields, considering that the ROC AUC values for the two drivers are almost identical.
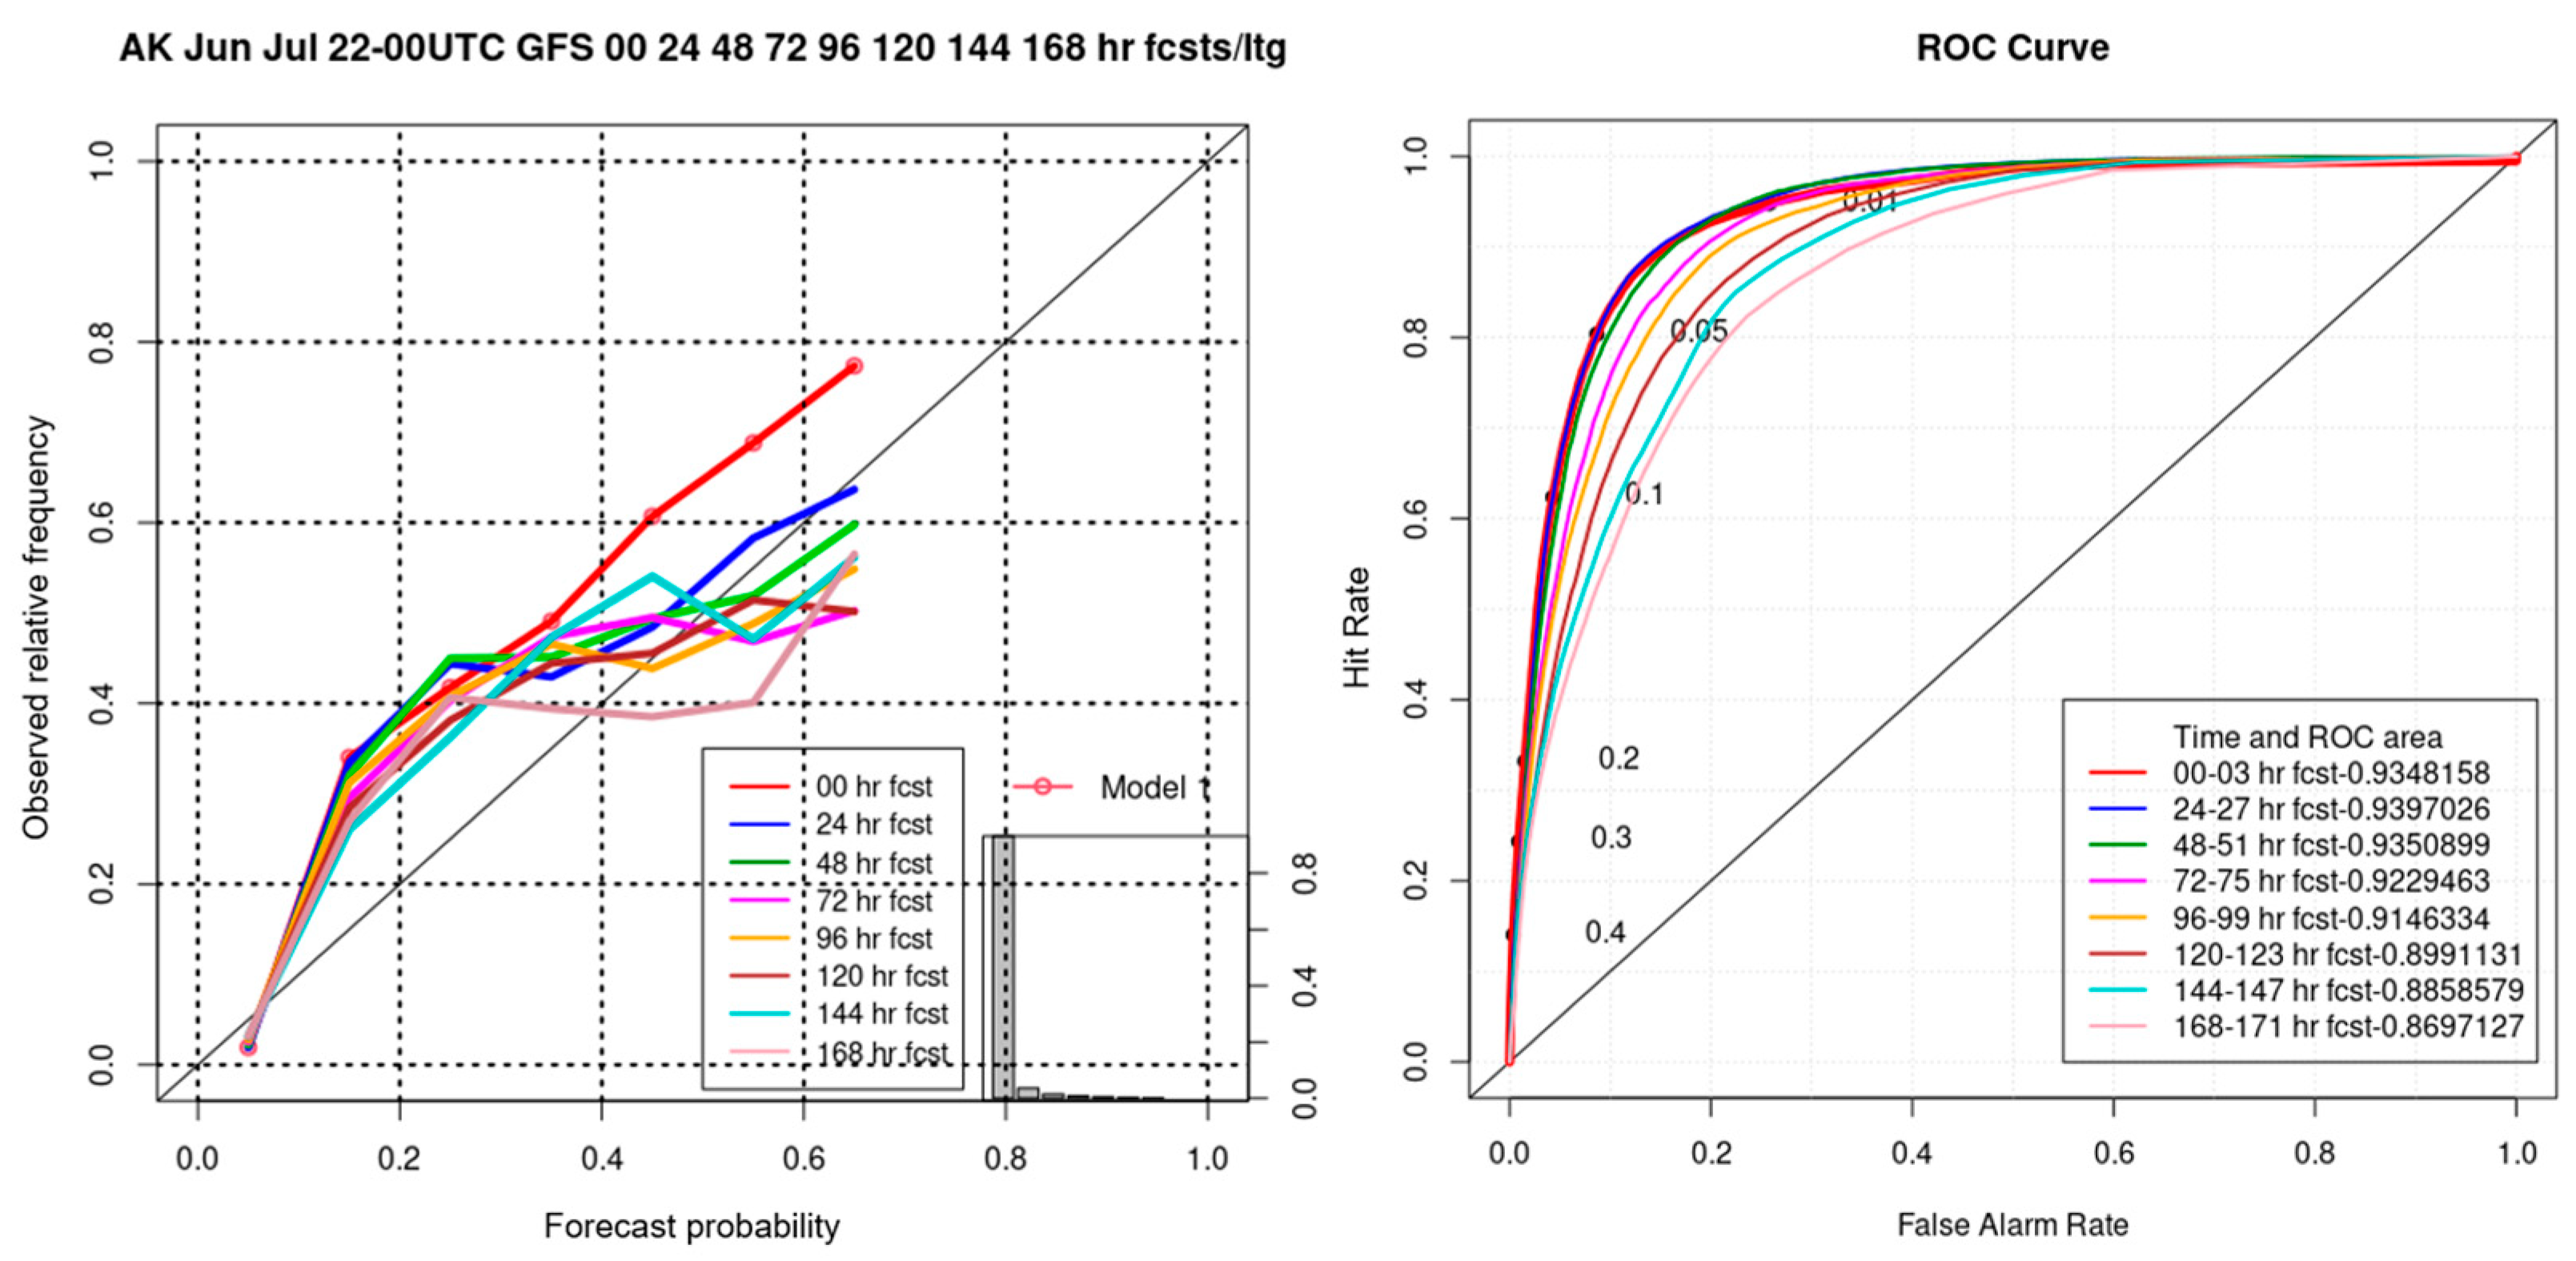
Figure 8 shows the RDs and ROC curves for lightning predictions over AK, extending over 168 h and driven by the GFS forecast weather fields in June and July of 2022. Although more distant forecast periods might appear closer to the 1:1 “perfect” line in the RDs, the ROC curves show a gradual decrease in forecast accuracy (measured by the relationship between the Hit Rate and False-Alarm Rate), as each curve for later forecast periods has a smaller AUC value compared to earlier forecast periods. The AUC values decrease from 0.9328158 at forecast hours 0–3 to 0.8697127 at forecast hours 168–171. This indicates that the accuracy of lightning predictions deteriorates somewhat with the increasing uncertainty of numerical weather forecasts over time. Still, the AUC values indicate an outstanding model performance up to forecast hour 99 and excellent accuracy up to hour 147.
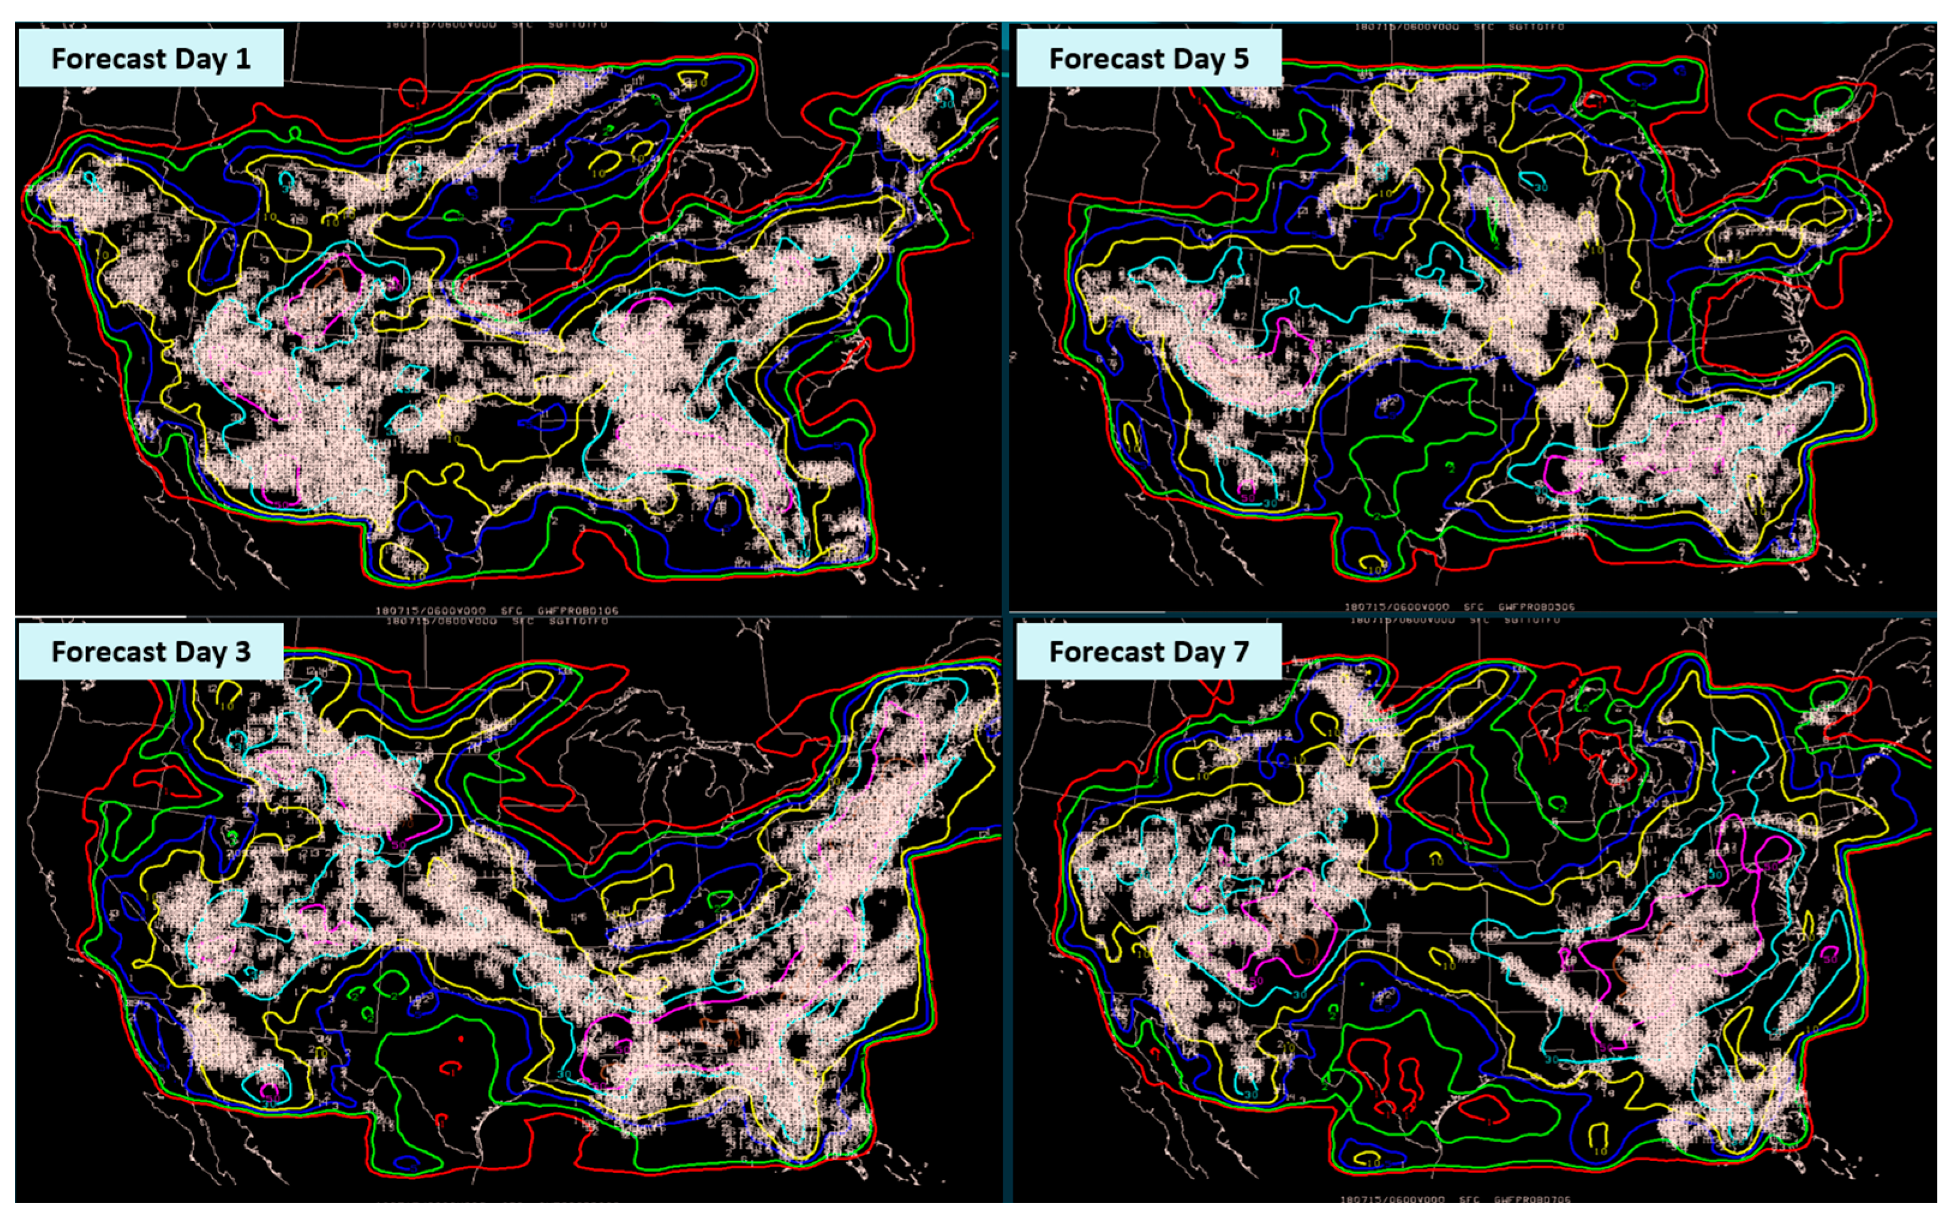
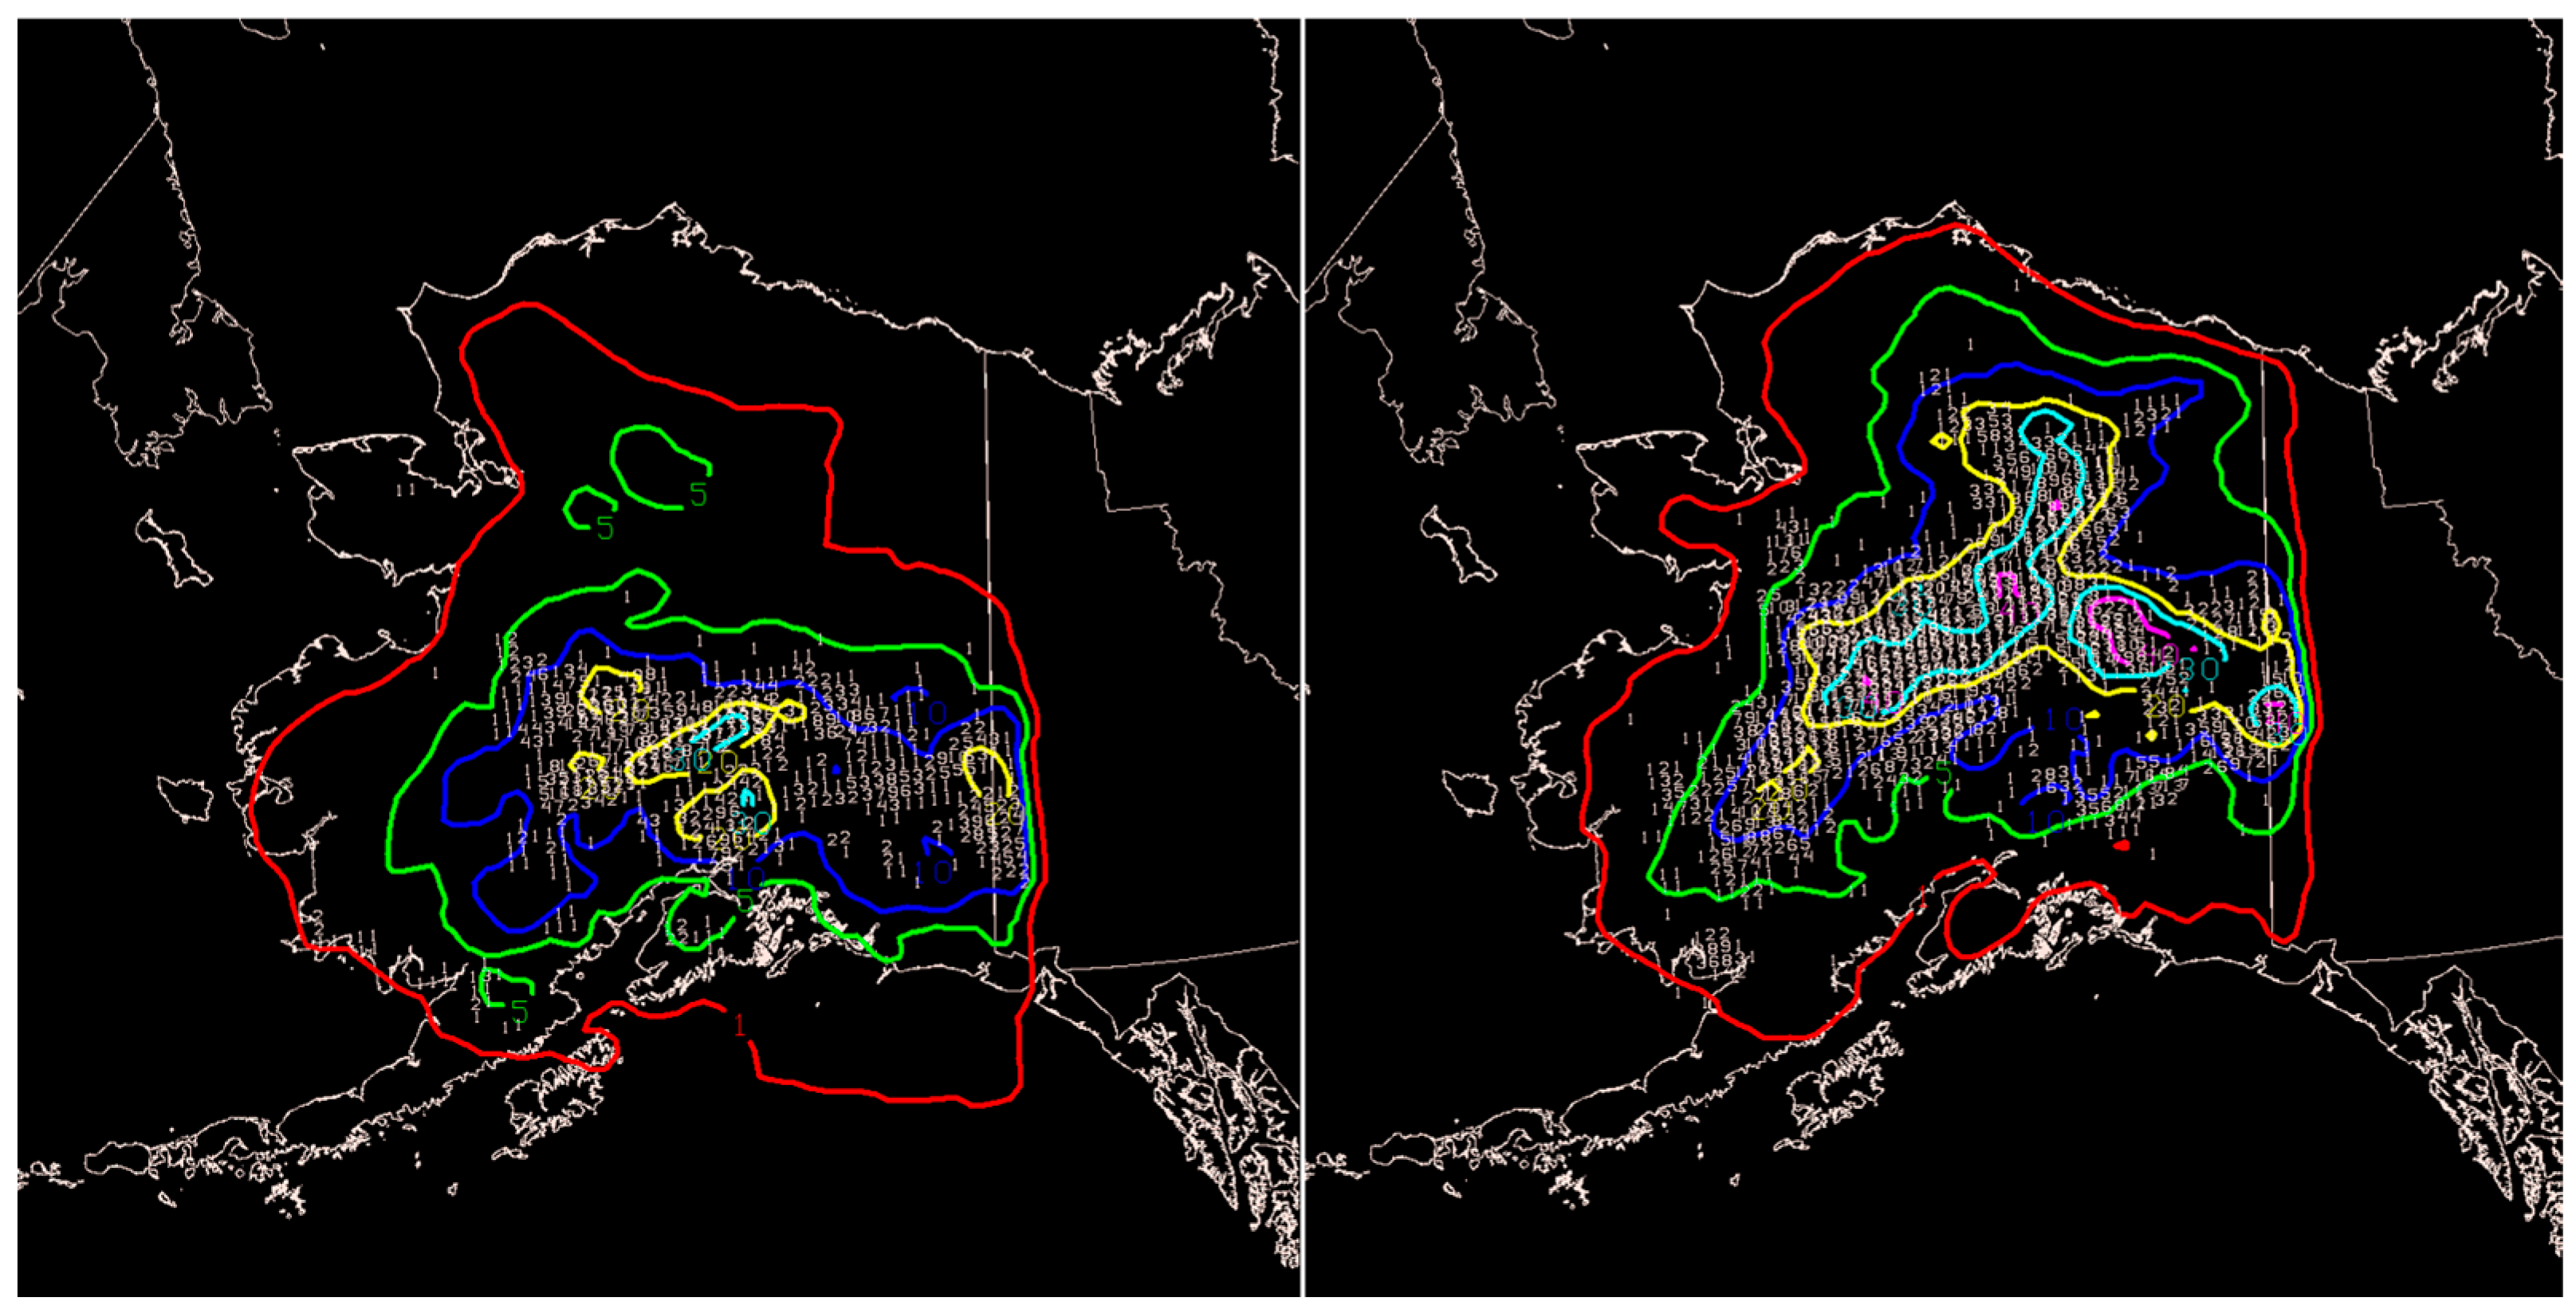
Figure 9 displays the observed lightning data overlaid on predicted 24 h maximum lightning probabilities for the ConUS for forecast days 1, 3, 5, and 7, beginning on 15 July 2018. Figure 10 shows similar overlays for AK during two high-intensity lightning events that occurred on 4 June and 20 June in 2022. These overlay maps visually illustrate the ability of the lightning prediction model to successfully capture regions of intense lightning.
4. Conclusions
We presented here the first and only operational, gridded lightning probability forecast algorithm for the continental USA and Alaska, derived from 29-year-long data records, that runs on a uniform 20 km continental grid. The statistical procedure of model derivation revealed that the occurrence of lightning strikes primarily depends on three factors: the temperatures and geopotential heights across the pressure levels at a grid point, the amount of low-level atmospheric moisture, and the wind speed/wind direction. These physical variables apparently aid in controlling the vertical separation of electric charges in the lower troposphere during thunderstorms, at a 20 km resolution, increasing the voltage potential between the cloud deck and the ground to a level that triggers electrical discharges.
The results obtained from the model verification performed employing independent data indicate that probabilistic predictions of CG lightning strikes are feasible and can be statistically reliable up to 7 days in advance when driven by output from operational, numerical weather forecast models such as the GFS. Hence, this new lightning prediction algorithm can be incorporated into future forecasting systems of fire ignition probabilities to quantify the risk of naturally occurring wildfires at a national level.
Author Contributions
Conceptualization, N.N. and P.B.; Methodology, P.B.; Software, P.B. and J.S.; Validation, P.B. and N.N.; Formal Analysis, P.B.; Investigation, N.N.; Resources, J.S.; Data Curation, P.B. and J.S.; Writing—original draft preparation, N.N.; Writing—review and editing, P.B. and J.S.; Visualization, P.B. and N.N.; Supervision, N.N.; Project Administration, N.N.; Funding Acquisition, N.N. All authors have read and agreed to the published version of the manuscript.
Funding
This study was supported by a Joint Venture Agreement (19-JV-11221637-188) between the USFS Rocky Mountain Research Station (funder) and the Cooperative Institute for Research in the Atmosphere (CIRA) at Colorado State University (CSU) in Fort Collins, CO. The early stages of this project were also partially supported by the US Bureau of Land Management.
Data Availability Statement
Publicly available datasets were analyzed in this study. These data can be found at the following links: NARR (https://rda.ucar.edu/datasets/ds608-0/ accessed on 22 February 2023); lightning observations over the ConUS (https://www.vaisala.com/en accessed on 22 February 2023); lightning observations over Alaska (https://fire.ak.blm.gov/predsvcs/maps.php accessed on 22 February 2023).
Acknowledgments
The authors thank Edward D. Delgado, a former Program Manager of the National Predictive Services in Boise, ID, for his vision in launching this project and his ability to secure partial, initial interagency funding for it. The authors acknowledge the critical administrative role played in this project by Kyle Hilburn at CSU CIRA and the indispensable IT assistance provided to the RMC team by Steven Finley, also at CSU CIRA.
Conflicts of Interest
The authors declare no conflicts of interest. The funders had no role in the design of the study; in the collection, analyses, or interpretation of data; in the writing of the manuscript; or in the decision to publish the results.
References
- Janssen, T.A.; Jones, M.W.; Finney, D.; van der Werf, G.R.; van Wees, D.; Xu, W.; Veraverbeke, S. Extratropical forests increasingly at risk due to lightning fires. Nat. Geosci. 2023, 16, 1136–1144. [Google Scholar] [CrossRef]
- Fuquay, D.M. Forecasting Lightning Activity Level and Associated Weather; US Department of Agriculture: Washington, DC, USA, 1980. [Google Scholar]
- Reap, R.M.; Macgorman, D.R. Cloud-to-ground lightning: Climatological characteristics and relationships to model fields, radar observations, and severe local storms. Mon. Weather Rev. 1989, 117, 518–535. [Google Scholar] [CrossRef]
- Price, C.; Rind, D. Modeling global lightning distributions in a general circulation model Mon. Weather Rev. 1994, 122, 1930–1939. [Google Scholar] [CrossRef]
- Yair, Y.; Lynn, B.; Price, C.; Kotroni, V.; Lagouvardos, K.; Morin, E.; Mugnai, A.; Llasat, M.D. Predicting the potential for lightning activity in Mediterranean storms based on the Weather Research and Forecasting (WRF) model dynamic and microphysical fields. J. Geophys. Res. Atmos. 2010, 115, D04205. [Google Scholar] [CrossRef]
- Lynn, B.H.; Yair, Y.; Price, C.; Kelman, G.; Clark, A.J. Predicting cloud-to-ground and intracloud lightning in weather forecast models. Weather Forecast. 2012, 27, 1470–1478. [Google Scholar] [CrossRef]
- Wong, J.; Barth, M.C.; Noone, D. Evaluating a lightning parameterization based on cloud-top height for mesoscale numerical model simulations. Geosci. Model Dev. 2013, 6, 429–443. [Google Scholar] [CrossRef]
- Buiat, M.; Porcù, F.; Dietrich, S. Observing relationships between lightning and cloud profiles by means of a satellite-borne cloud radar. Atmos. Meas. Tech. 2017, 10, 221–230. [Google Scholar] [CrossRef]
- Sousa, J.F.; Fragoso, M.; Mendes, S.; Corte-Real, J.; Santos, J.A. Statistical-dynamical modeling of the cloud-to-ground lightning activity in Portugal. Atmos. Res. 2013, 132–133, 46–64. [Google Scholar] [CrossRef]
- Blouin, K.D.; Flannigan, M.D.; Wang, X.; Kochtubajda, B. Ensemble lightning prediction models for the province of Alberta, Canada. Int. J. Wildl. Fire 2016, 25, 421–432. [Google Scholar] [CrossRef]
- Gijben, M.; Dyson, L.L.; Loots, M.T. A statistical scheme to forecast the daily lightning threat over southern Africa using the Unified Model. Atmos. Res. 2017, 194, 78–88. [Google Scholar] [CrossRef]
- Bates, B.C.; Dowdy, A.J.; Chandler, R.E. Lightning prediction for Australia using multivariate analyses of large-scale atmospheric variables. J. Appl. Meteorol. Climatol. 2018, 57, 525–534. [Google Scholar] [CrossRef]
- He, J.; Loboda, T.V. Modeling cloud-to-ground lightning probability in Alaskan tundra through the integration of Weather Research and Forecast (WRF) model and machine learning method. Environ. Res. Lett. 2020, 15, 115009. [Google Scholar] [CrossRef]
- Bothwell, P.D. Prediction of Cloud-to-Ground Lightning in the Western United States. Ph.D. Thesis, University of Oklahoma, Norman, OK, USA, 2002; p. 178. [Google Scholar]
- Buckey, D. Using the Perfect Prognosis Method to Forecast Cloud to Ground Lightning in Alaska. Master’s Thesis, Department of Meteorology, University of Oklahoma, Norman, OK, USA, 2009; p. 82. [Google Scholar]
- Richardson, L.M. A Perfect Prog Approach to Forecasting Dry Thunderstorms over the CONUS and Alaska. Master’s Thesis, School of Meteorology, University of Oklahoma, Norman, OK, USA, 2013; p. 85. [Google Scholar]
- North American Regional Reanalysis (NARR). Available online: https://rda.ucar.edu/datasets/ds608-0/ (accessed on 22 February 2023).
- Vaisala. Available online: https://www.vaisala.com/en (accessed on 22 February 2023).
- NOAA Global Forecast System (GFS). Available online: https://www.ncei.noaa.gov/products/weather-climate-models/global-forecast (accessed on 22 February 2023).
- Fronterhouse, B.A. Alaska Lightning Detection Network (ALDN) Briefing Document. Ft. Wainwright, AK: Bureau of Land Management, Alaska Fire Service. 2012; p. 4. Available online: https://www.frames.gov/catalog/22348 (accessed on 22 February 2023).
- Alaska Fire Service (AFS). Available online: https://www.blm.gov/programs/fire-and-aviation/regional-info/alaska-fire-service (accessed on 22 February 2023).
- Rymarczyk, T.; Kozłowski, E.; Kłosowski, G.; Niderla, K. Logistic regression for machine learning in process tomography. Sensors 2019, 19, 3400. [Google Scholar] [CrossRef] [PubMed]
- Bloomfield, P.; Davis, J. Orthogonal rotation of complex principal components. Int. J. Climatology. 1994, 4, 759–775. [Google Scholar] [CrossRef]
- The R Project for Statistical Computing. Available online: https://www.r-project.org/ (accessed on 22 February 2023).
- Bröcker, J.; Smith, L.A. Increasing the reliability of Reliability Diagrams. Weather Forecast. 2007, 22, 651–661. [Google Scholar] [CrossRef]
- Fawcett, T. An introduction to ROC analysis. Pattern Recog. Lett. 2006, 27, 861–874. [Google Scholar] [CrossRef]
- USFS. Rocky Mountain Center Website. Available online: https://fireweather.cira.colostate.edu/index8.php?usr=wfdss_gusr&page=rmc (accessed on 22 February 2023).
- Mandrekar, J.N. Receiver Operating Characteristic curve in diagnostic test assessment. J. Thorac. Oncol. 2010, 5, 1315–1316. [Google Scholar] [CrossRef] [PubMed]
Figure 1.
Climatological subregions employed in the derivation of logistic lightning forecast equations for ConUS. The gray background mesh depicts the 20 km grid used in this study.
Figure 1.
Climatological subregions employed in the derivation of logistic lightning forecast equations for ConUS. The gray background mesh depicts the 20 km grid used in this study.

Figure 2.
The 13 main lightning predictors (principal components) produced by the PCA and the amount of the variance in CG strikes explained by them over the ConUS.
Figure 2.
The 13 main lightning predictors (principal components) produced by the PCA and the amount of the variance in CG strikes explained by them over the ConUS.

Figure 3.
Reliability diagrams of NARR-based (left panel) and GFS-based (right panel) lightning forecasts for June, July, and August of 2018 (3 h forecasts based on 12 UTC data) over ConUS.
Figure 3.
Reliability diagrams of NARR-based (left panel) and GFS-based (right panel) lightning forecasts for June, July, and August of 2018 (3 h forecasts based on 12 UTC data) over ConUS.

Figure 4.
ROC curves with the AUC shown in the upper right corner for lightning probability forecasts driven by NARR data (left panel) and GFS initialization fields (right panel), covering the same time period as in Figure 3.
Figure 4.
ROC curves with the AUC shown in the upper right corner for lightning probability forecasts driven by NARR data (left panel) and GFS initialization fields (right panel), covering the same time period as in Figure 3.

Figure 5.
Reliability diagrams of GFS-driven daily maximum probability lightning forecasts for days 1, 3, and 7 over ConUS.
Figure 5.
Reliability diagrams of GFS-driven daily maximum probability lightning forecasts for days 1, 3, and 7 over ConUS.

Figure 6.
Reliability diagram of the modeled probabilities of one or more lightning strikes occurring over AK for all 3 h periods from 1 May through 31 August 2022. The lightning model was driven by NARR weather fields.
Figure 6.
Reliability diagram of the modeled probabilities of one or more lightning strikes occurring over AK for all 3 h periods from 1 May through 31 August 2022. The lightning model was driven by NARR weather fields.

Figure 7.
Reliability diagram of the modeled probabilities of 1 or more lightning strikes occurring over AK for all 3 h periods between 1 June and 31 August 2022. Left panel: model driven by NARR data (ROC AUC = 0.9398); Right panel: model driven by GFS initialization fields (ROC AUC = 0.9444).
Figure 7.
Reliability diagram of the modeled probabilities of 1 or more lightning strikes occurring over AK for all 3 h periods between 1 June and 31 August 2022. Left panel: model driven by NARR data (ROC AUC = 0.9398); Right panel: model driven by GFS initialization fields (ROC AUC = 0.9444).

Figure 8.
Reliability diagrams (left panel) and ROC curves (right panel) of predicted probabilities of 1 or more lightning strikes occurring over Alaska for all 3 h periods between 1 June and 31 July 2022 based on forecast weather fields provided by the GFS. The AUC values are shown inside the color legend in the right panel.

Figure 9.
Maximum probability of lightning (color contours) predicted by the model over 24 h periods (12:00 to 12:00 UTC) for forecast days 1, 3, 5, and 7, beginning on 15 July 2018, overlayed onto observed lightning strikes (numbers in white). Contours delineate: 1%—red, 2%—green, 5%—blue, 10%—yellow, 30%—cyan, 50%—magenta, and 70%—brown.

Figure 10.
Lightning observations (number of strikes per grid cell in white) overlaid onto the first 24 h maximum probability forecast over AK, shown as color contours of the strike probabilities for 4 June (left panel) and 20 June (right panel), 2022: 1% (red); 5% (green); 10% (blue); 20% (yellow); 30% (cyan); and 50% (magenta).


Table 1.
Datasets utilized in the lightning forecast model’s development and testing for the ConUS.
| Dataset Name and Description | Record Length (Years) | Binary Size (Gbit) |
|---|---|---|
| North American Regional Reanalysis (NARR) [17]: 3D gridded historical weather dataset provided by NOAA. Horizontal resolution of 32 km interpolated to a 20 km resolution for the ConUS with a 3 h time step. | 29 | 3000 |
| Lightning dataset: provided by Vaisala [18] (through the Western Regional Climate Center) gridded to 3 h time steps at a 20 km resolution. | 29 | 400 |
| NCEP GFS Forecast Fields [19]: 3 h time steps from 0 to 240 h/10 days; 3D grids of 0.25 × 0.25-degree resolution interpolated to a 20 km resolution used for forecast testing and verification purposes and 2019 forecasts. | 1 | 8000 |
Disclaimer/Publisher’s Note: The statements, opinions and data contained in all publications are solely those of the individual author(s) and contributor(s) and not of MDPI and/or the editor(s). MDPI and/or the editor(s) disclaim responsibility for any injury to people or property resulting from any ideas, methods, instructions or products referred to in the content. |
© 2024 by the authors. Licensee MDPI, Basel, Switzerland. This article is an open access article distributed under the terms and conditions of the Creative Commons Attribution (CC BY) license (https://creativecommons.org/licenses/by/4.0/).
Share and Cite
MDPI and ACS Style
Nikolov, N.; Bothwell, P.; Snook, J. Probabilistic Forecasting of Lightning Strikes over the Continental USA and Alaska: Model Development and Verification. Fire 2024, 7, 111. https://0-doi-org.brum.beds.ac.uk/10.3390/fire7040111
AMA Style
Nikolov N, Bothwell P, Snook J. Probabilistic Forecasting of Lightning Strikes over the Continental USA and Alaska: Model Development and Verification. Fire. 2024; 7(4):111. https://0-doi-org.brum.beds.ac.uk/10.3390/fire7040111
Chicago/Turabian StyleNikolov, Ned, Phillip Bothwell, and John Snook. 2024. "Probabilistic Forecasting of Lightning Strikes over the Continental USA and Alaska: Model Development and Verification" Fire 7, no. 4: 111. https://0-doi-org.brum.beds.ac.uk/10.3390/fire7040111