
Experimental Validation of Finite Element Models for Reinforced Concrete Beams with Discontinuities That Form Dowel-Type Joints


Abstract
:1. Introduction
2. Experimental Work
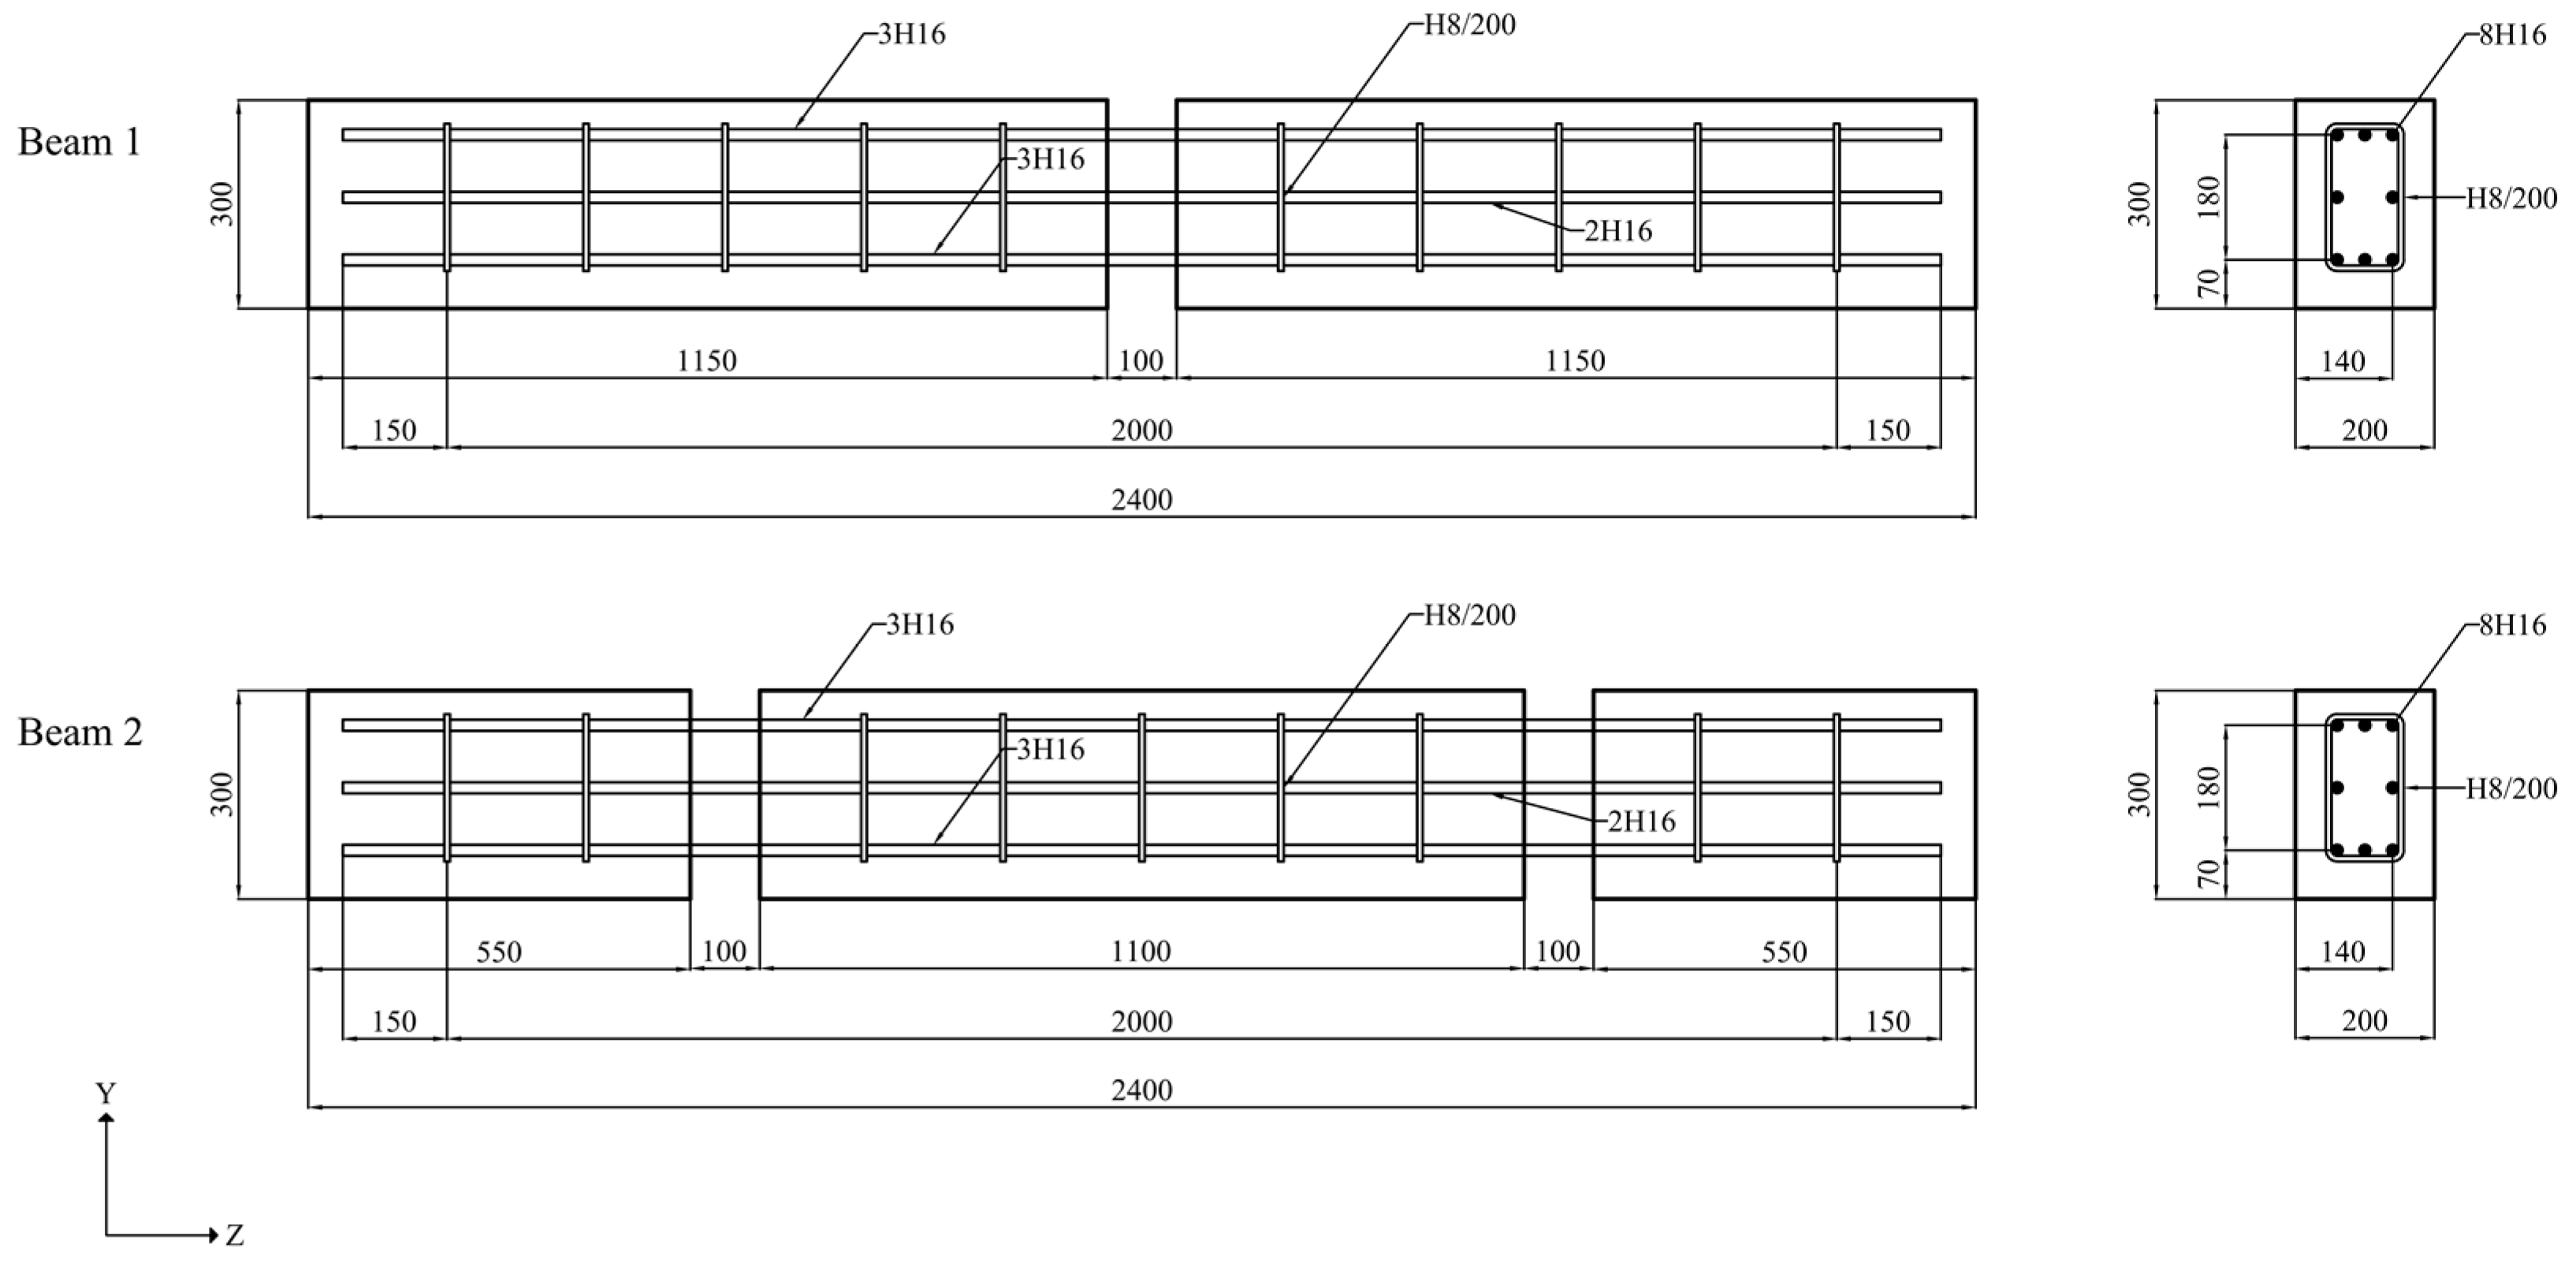
2.1. Test Specimens
2.2. Material Properties
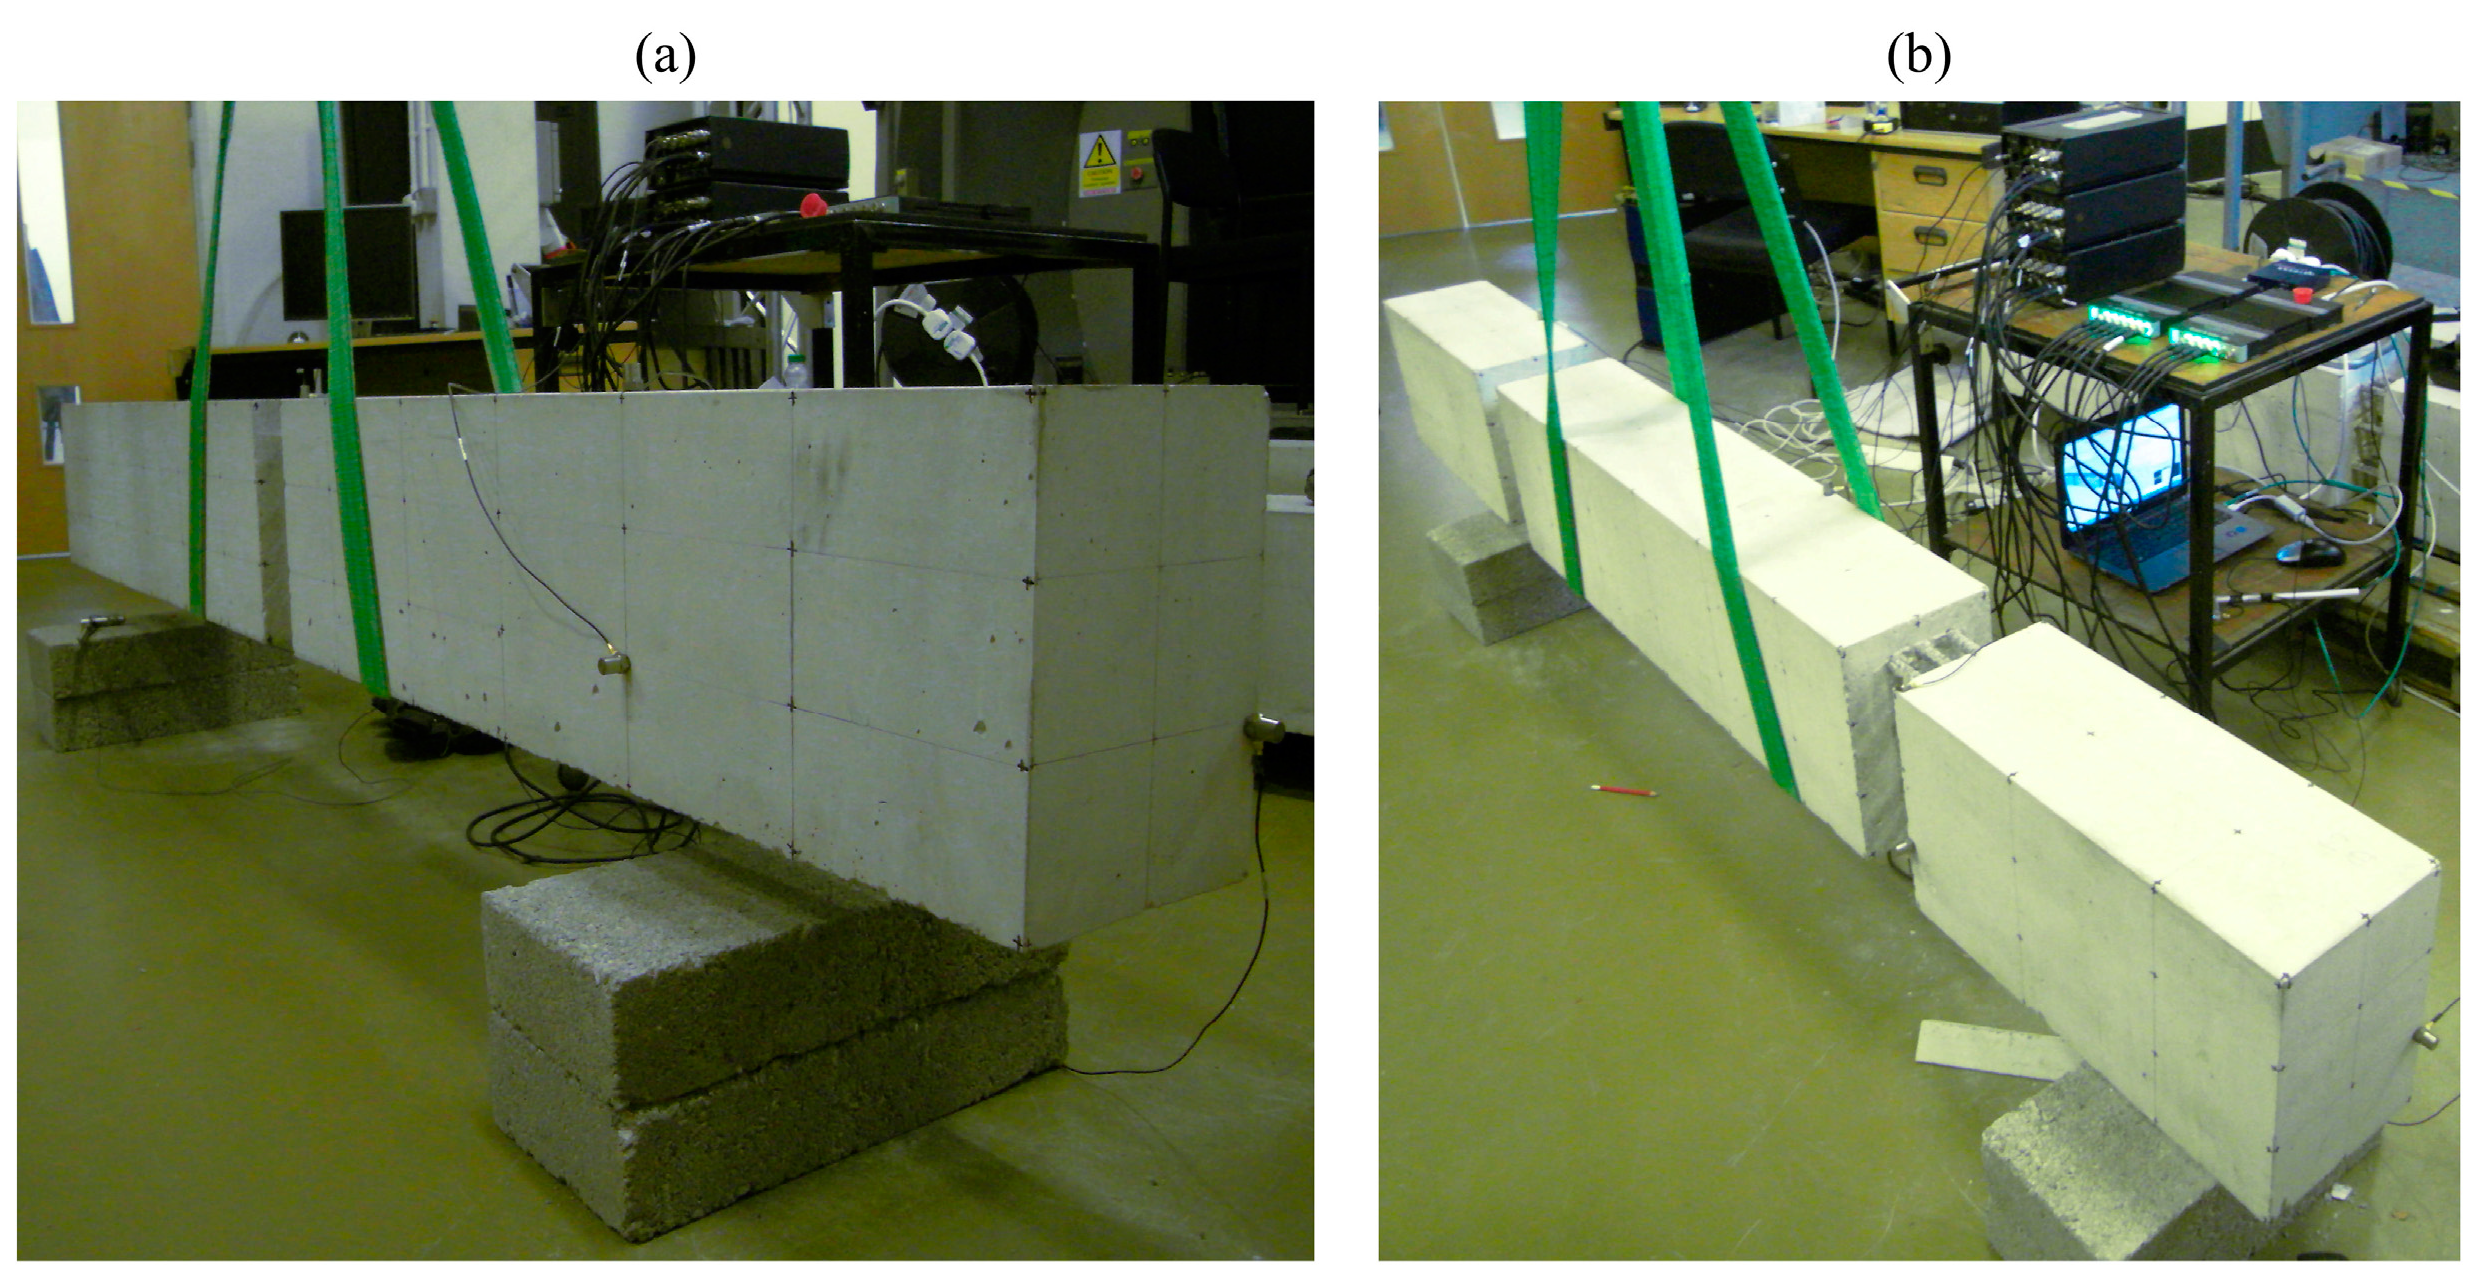
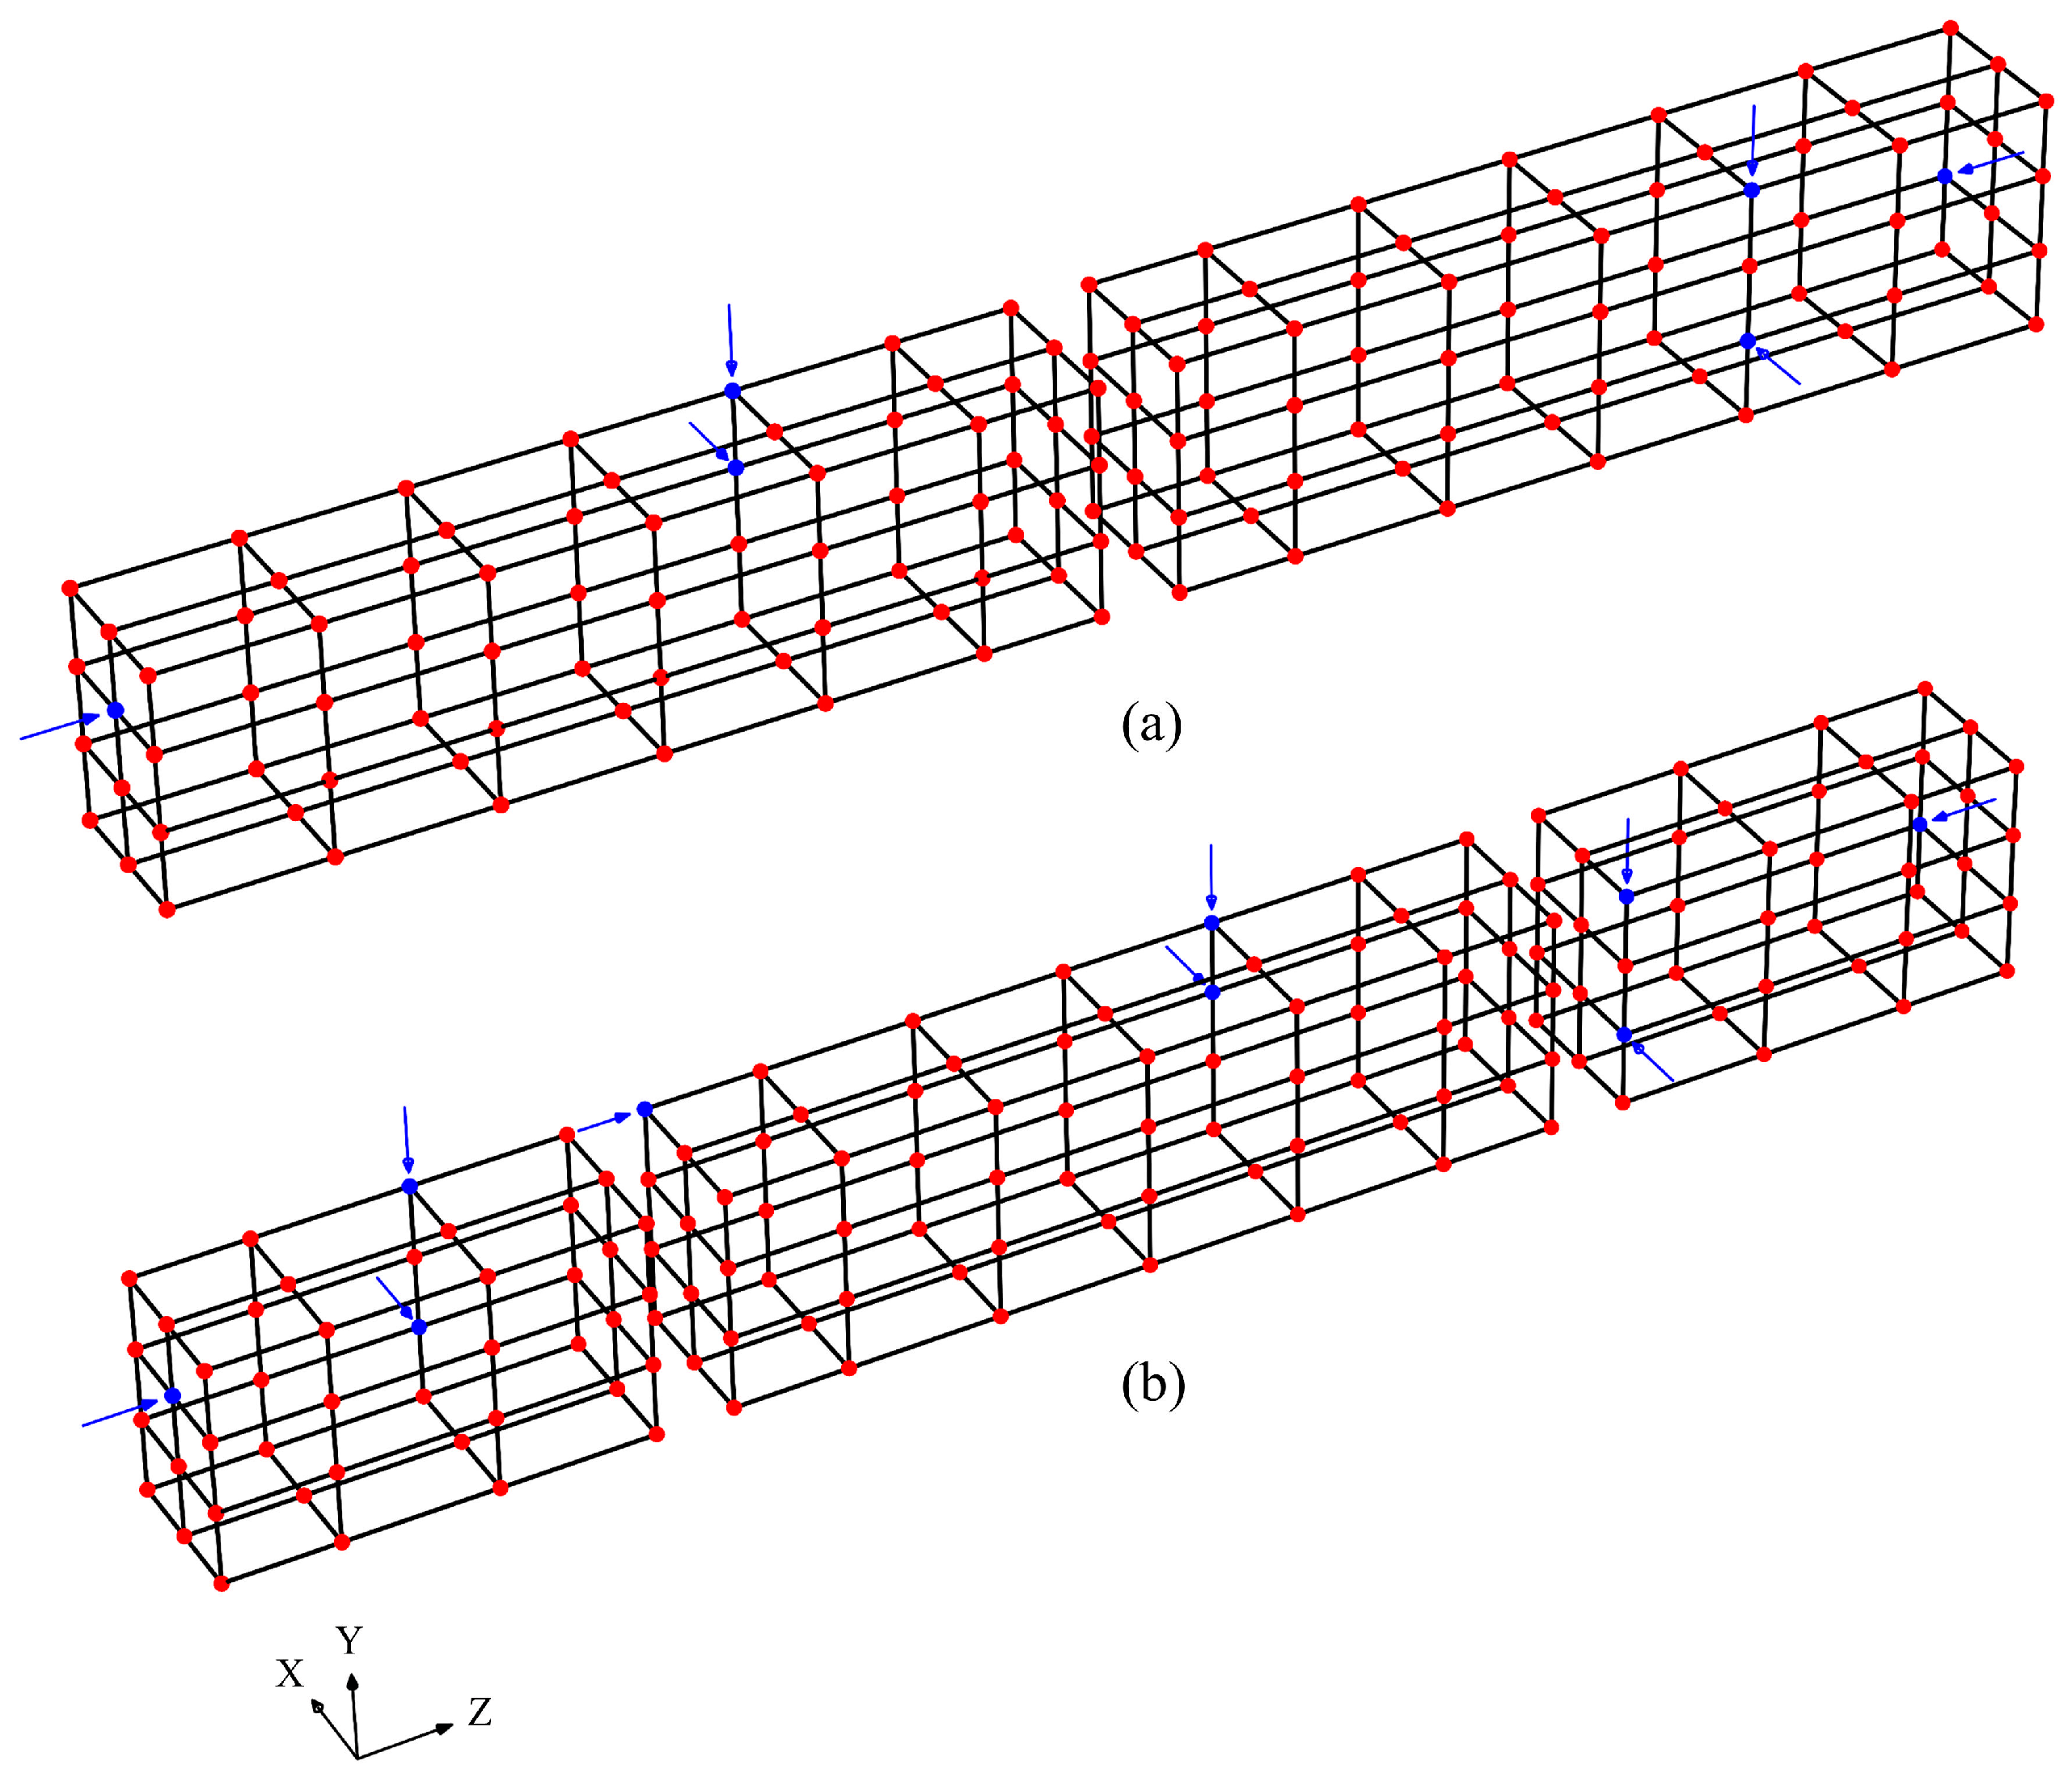
2.3. Test Setups
2.4. Modal Analysis
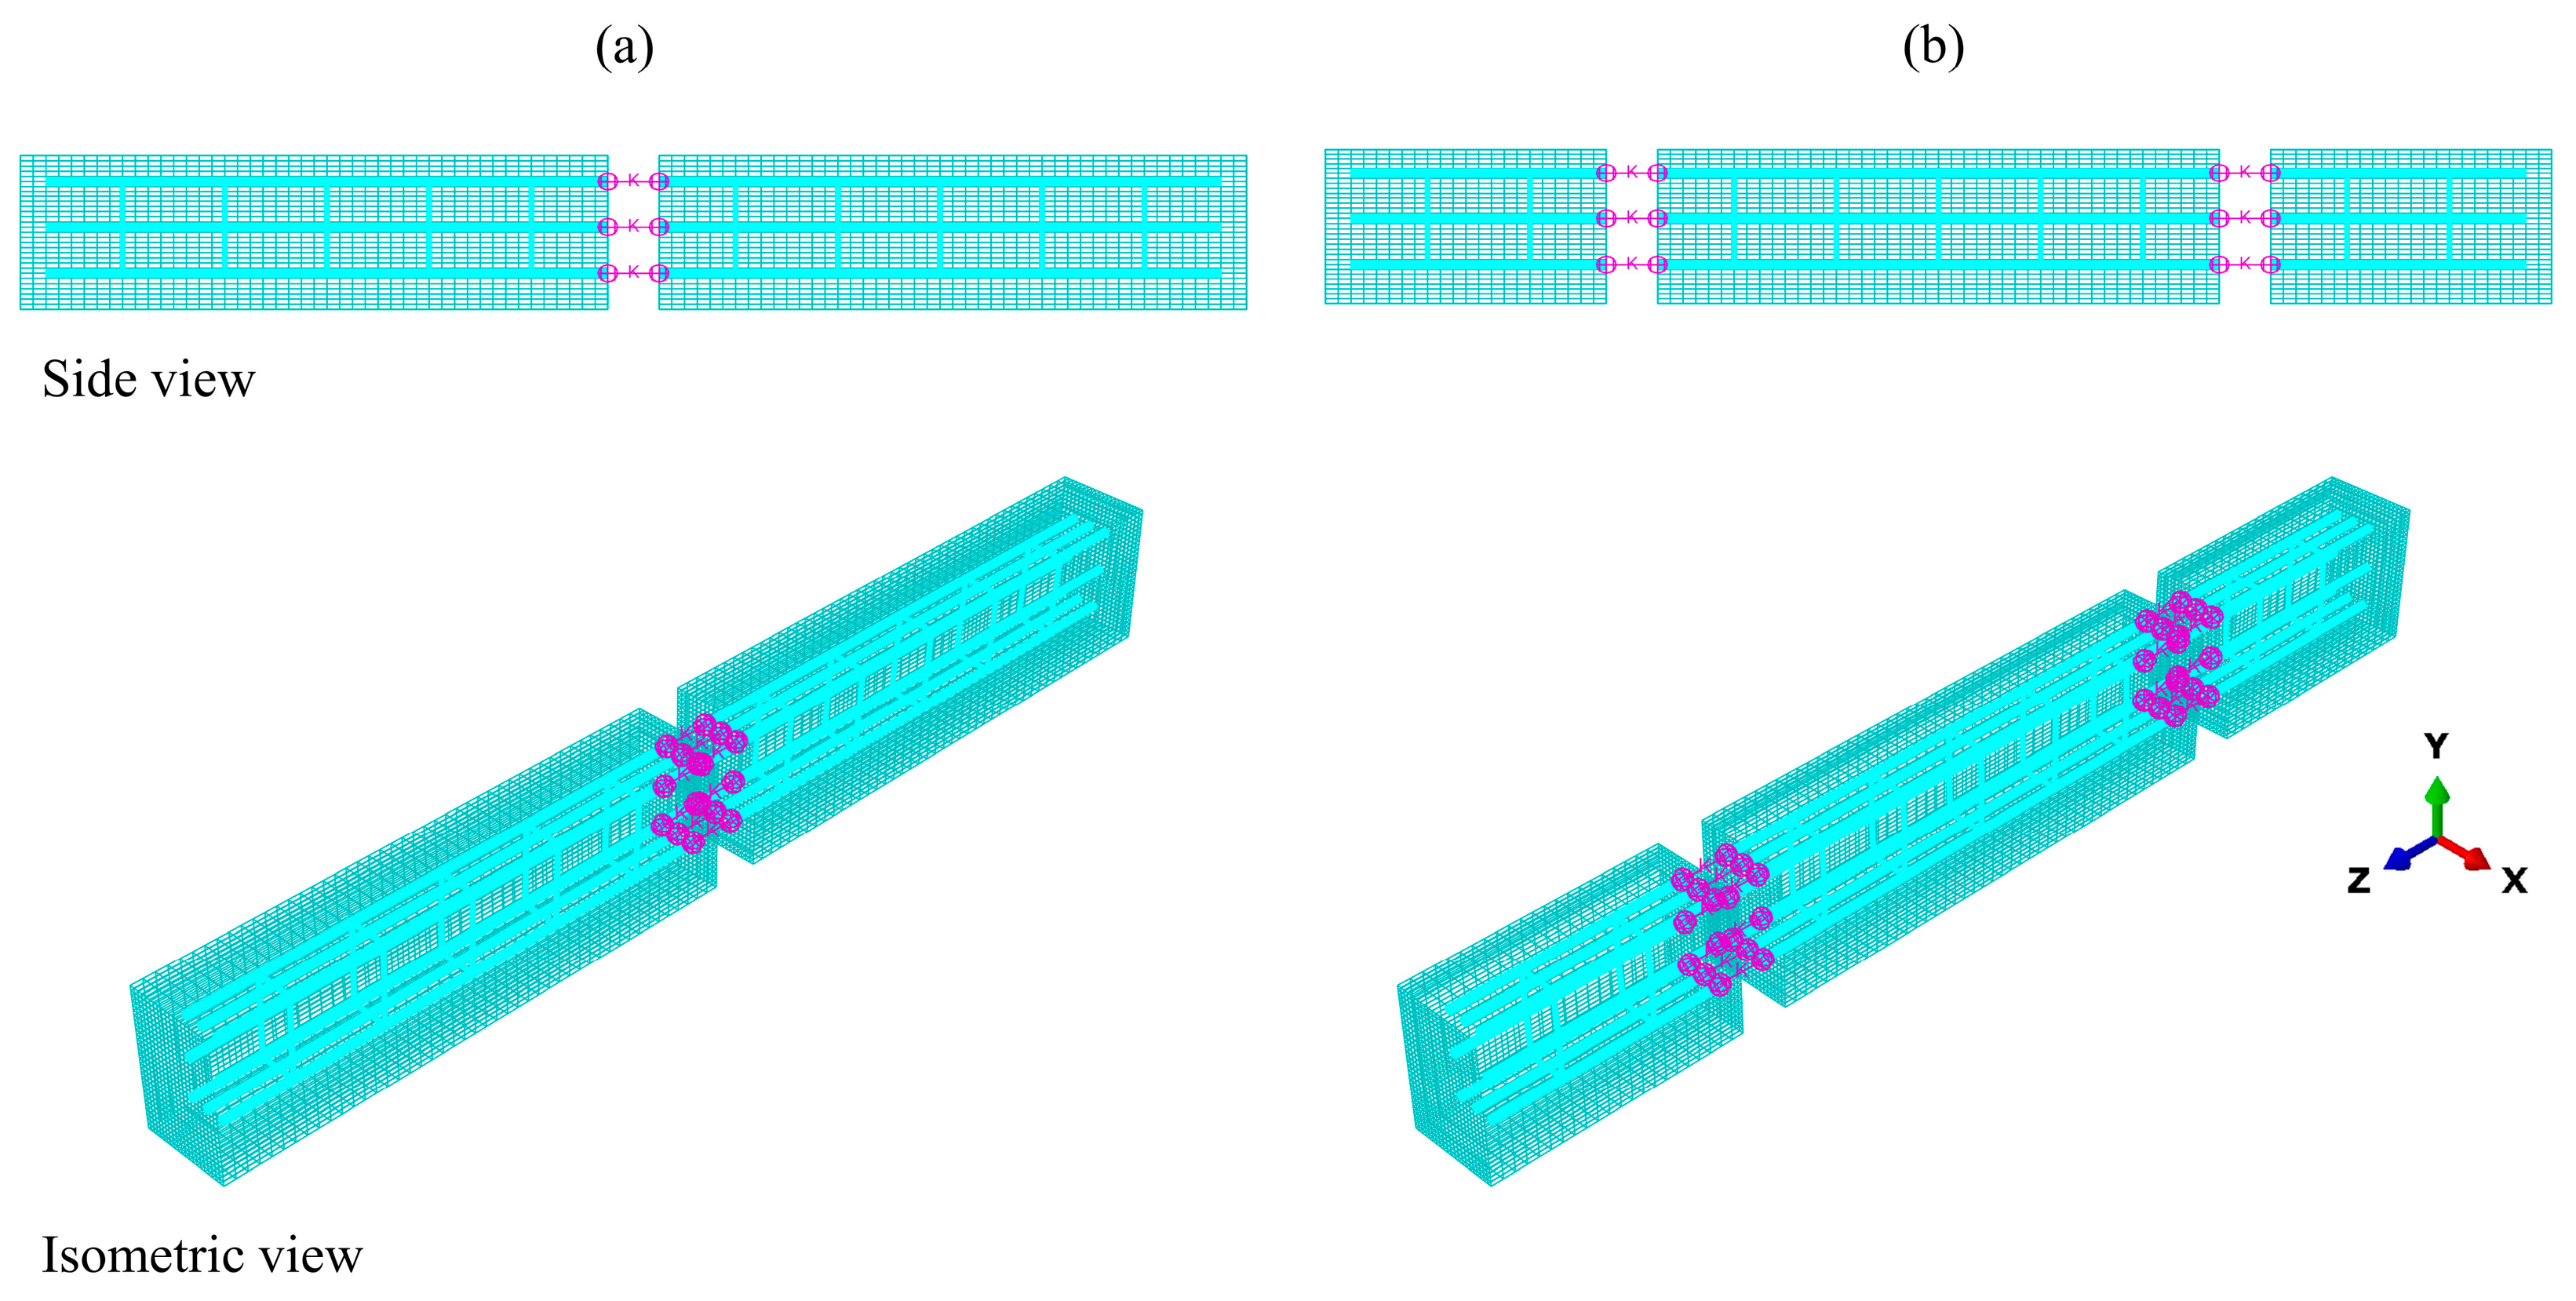
3. FEM Modelling
3.1. Reinforced Concrete Beams with Dowel-Type Joints
3.2. Validation Criteria
4. Results and Discussion
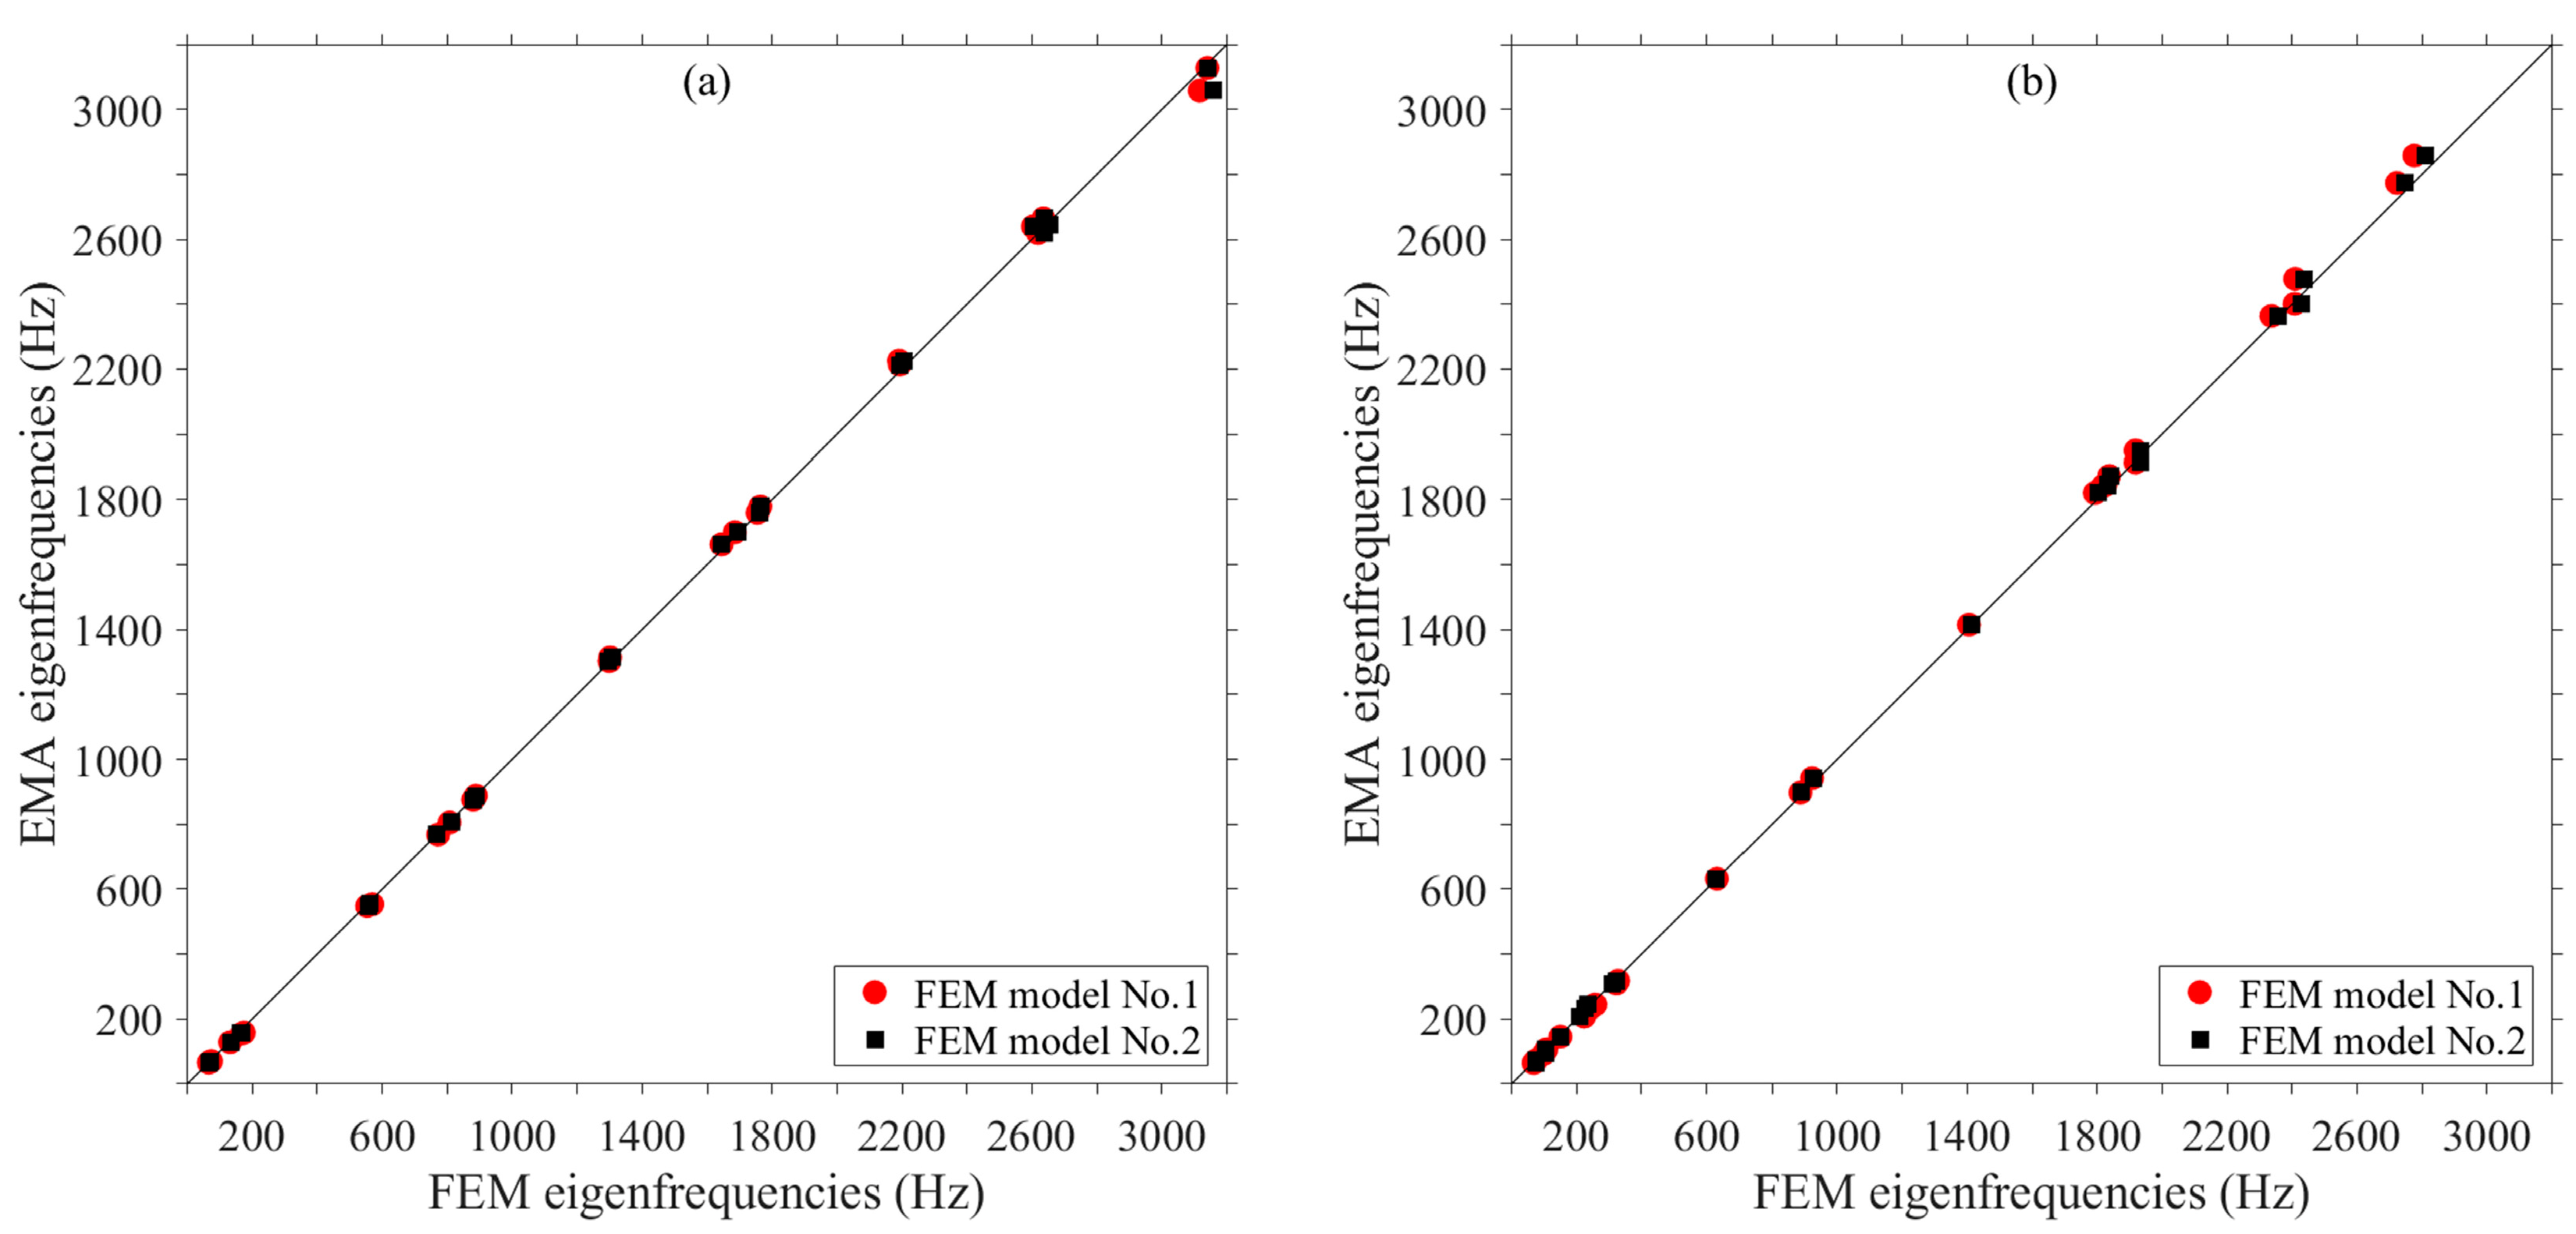
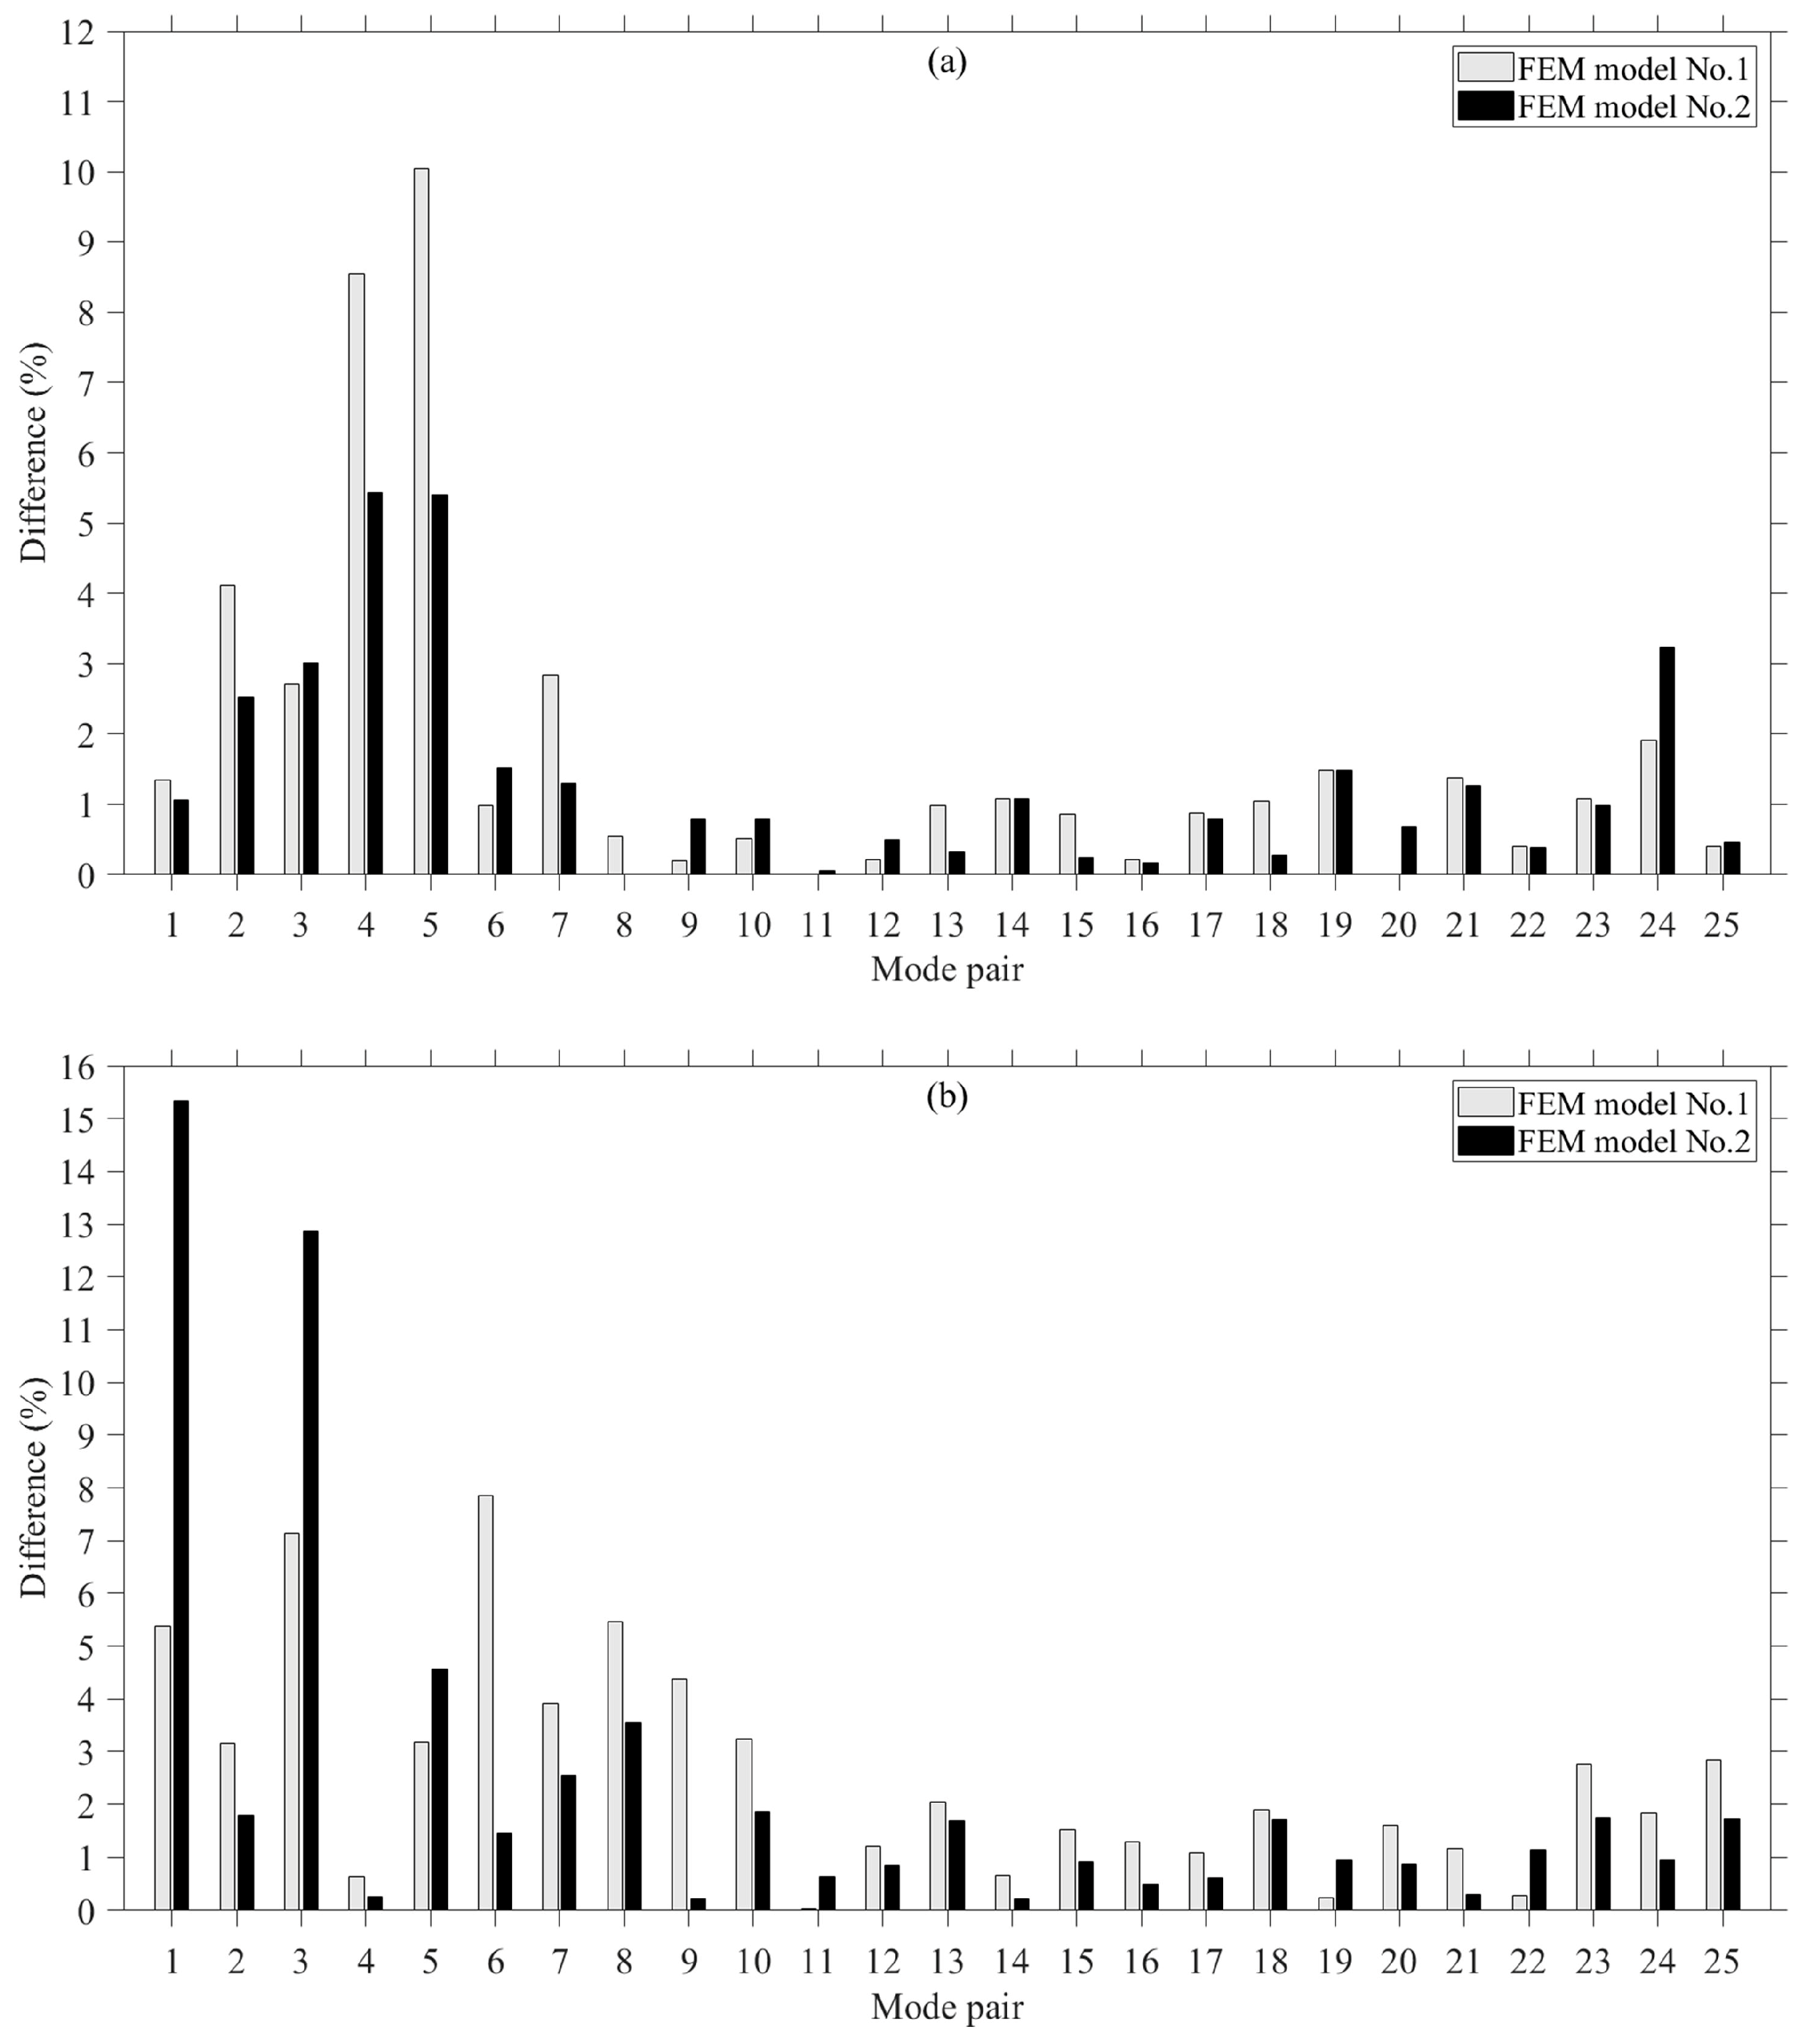
4.1. Eigenfrequencies
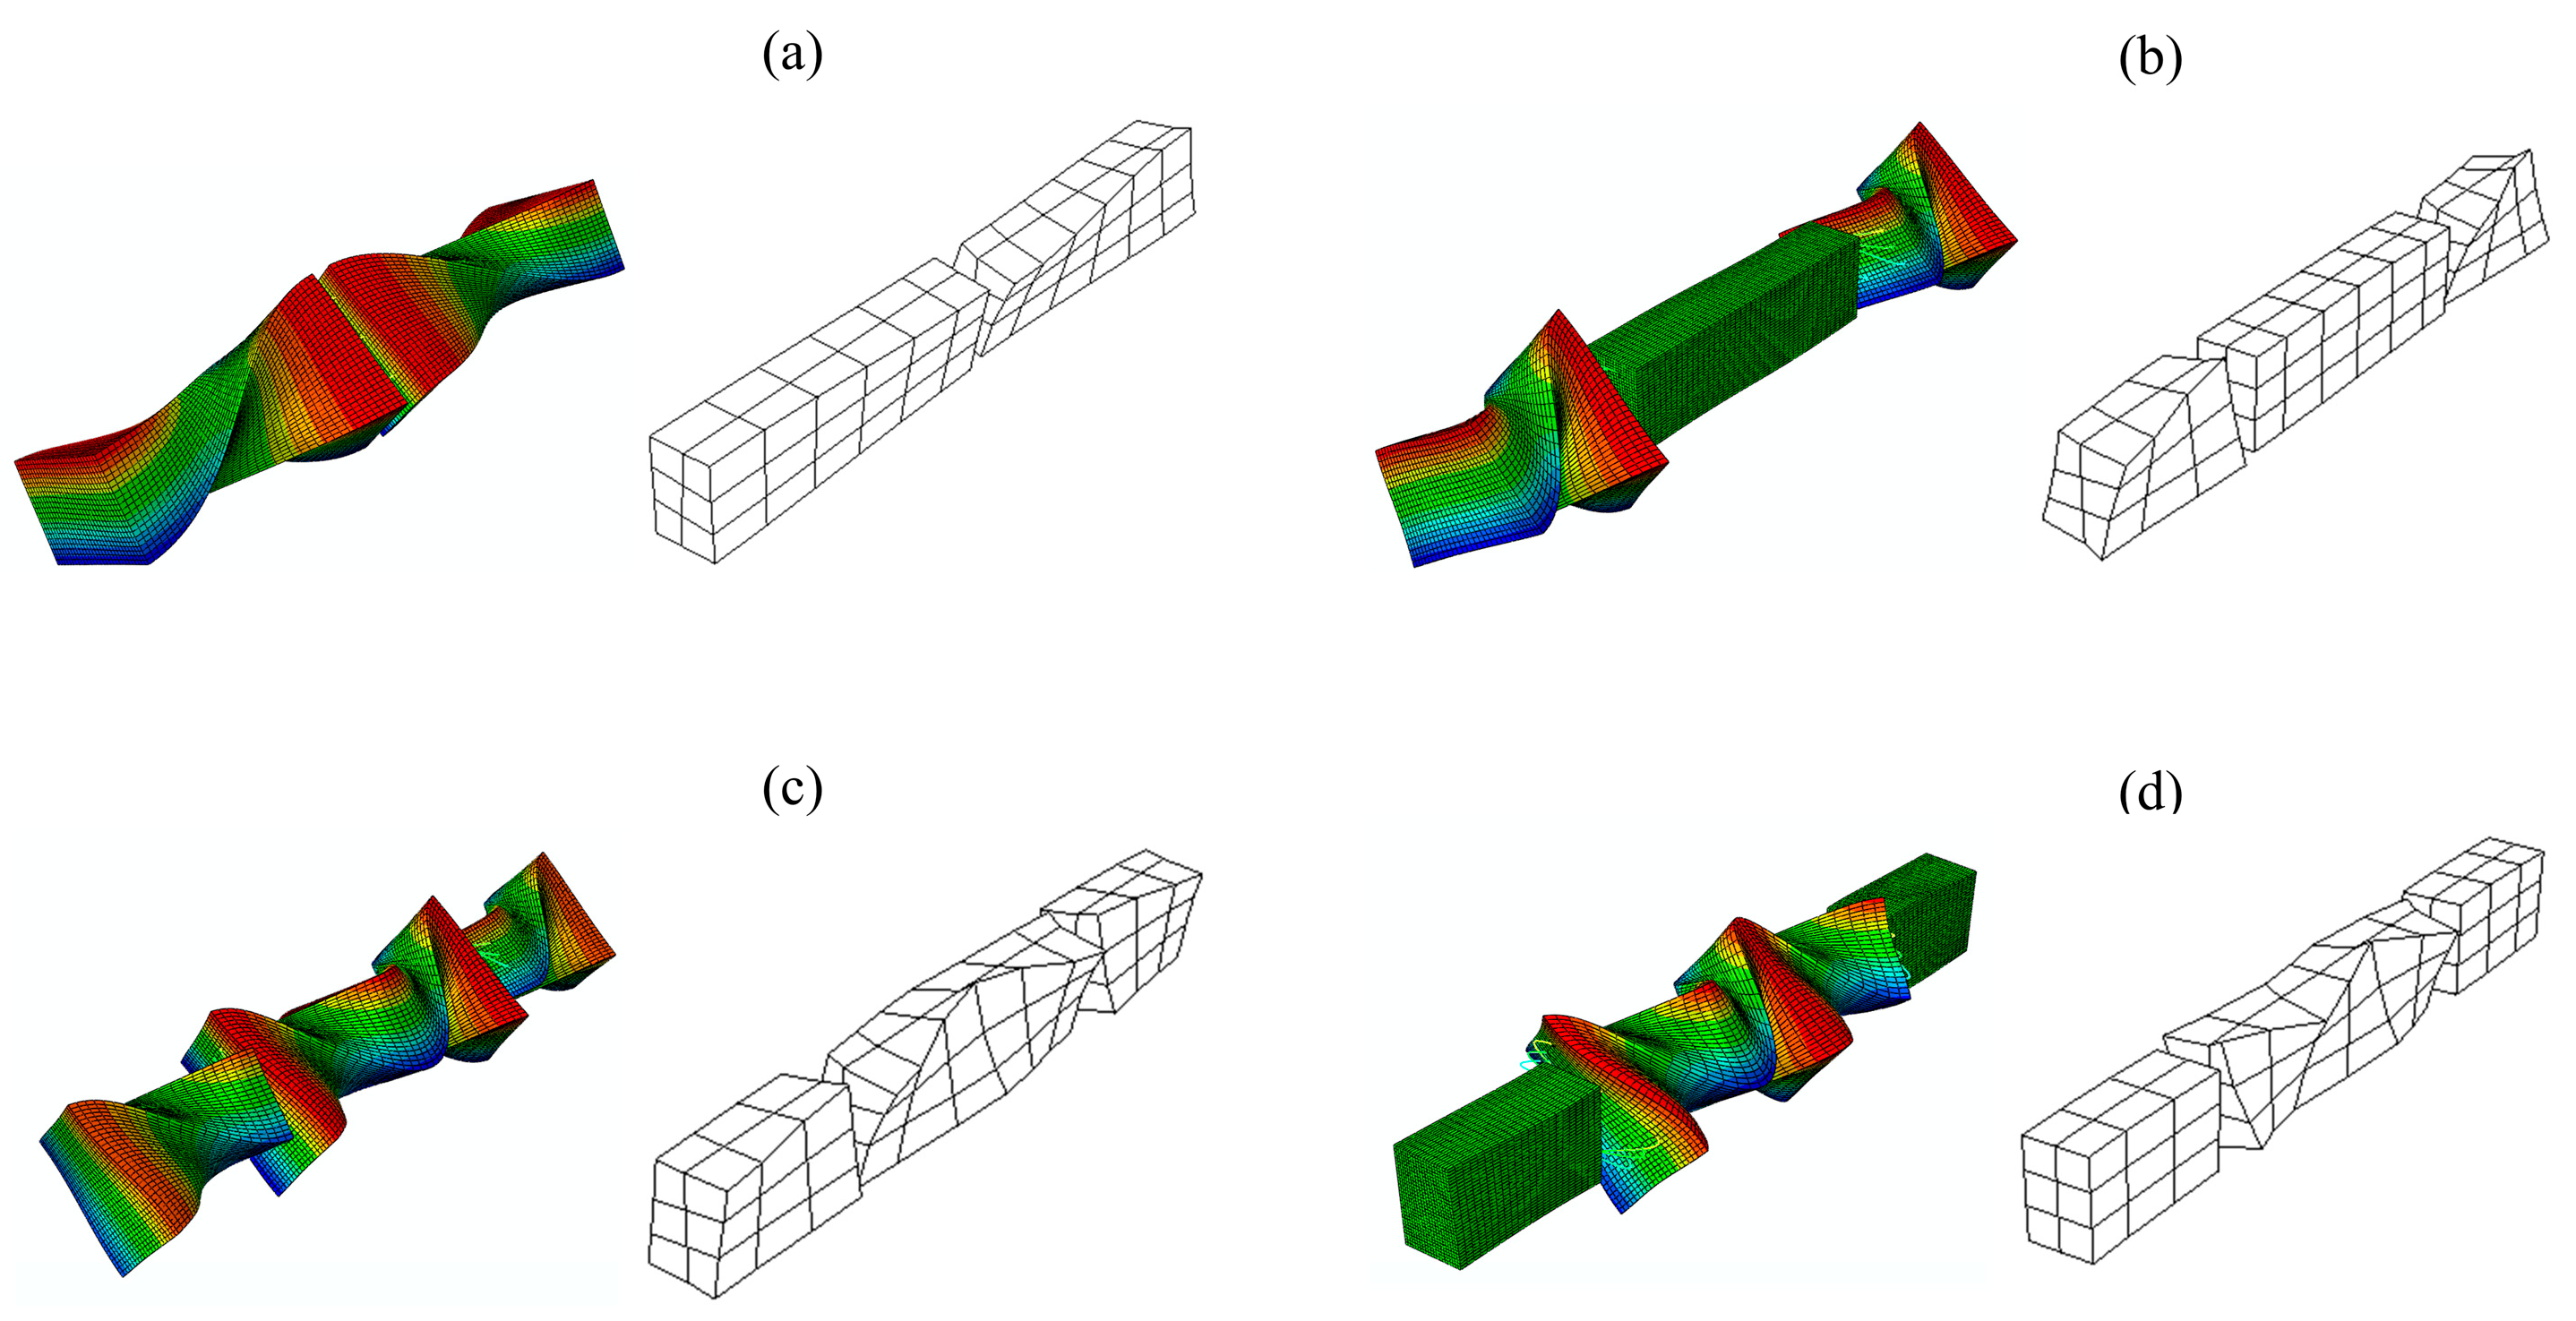
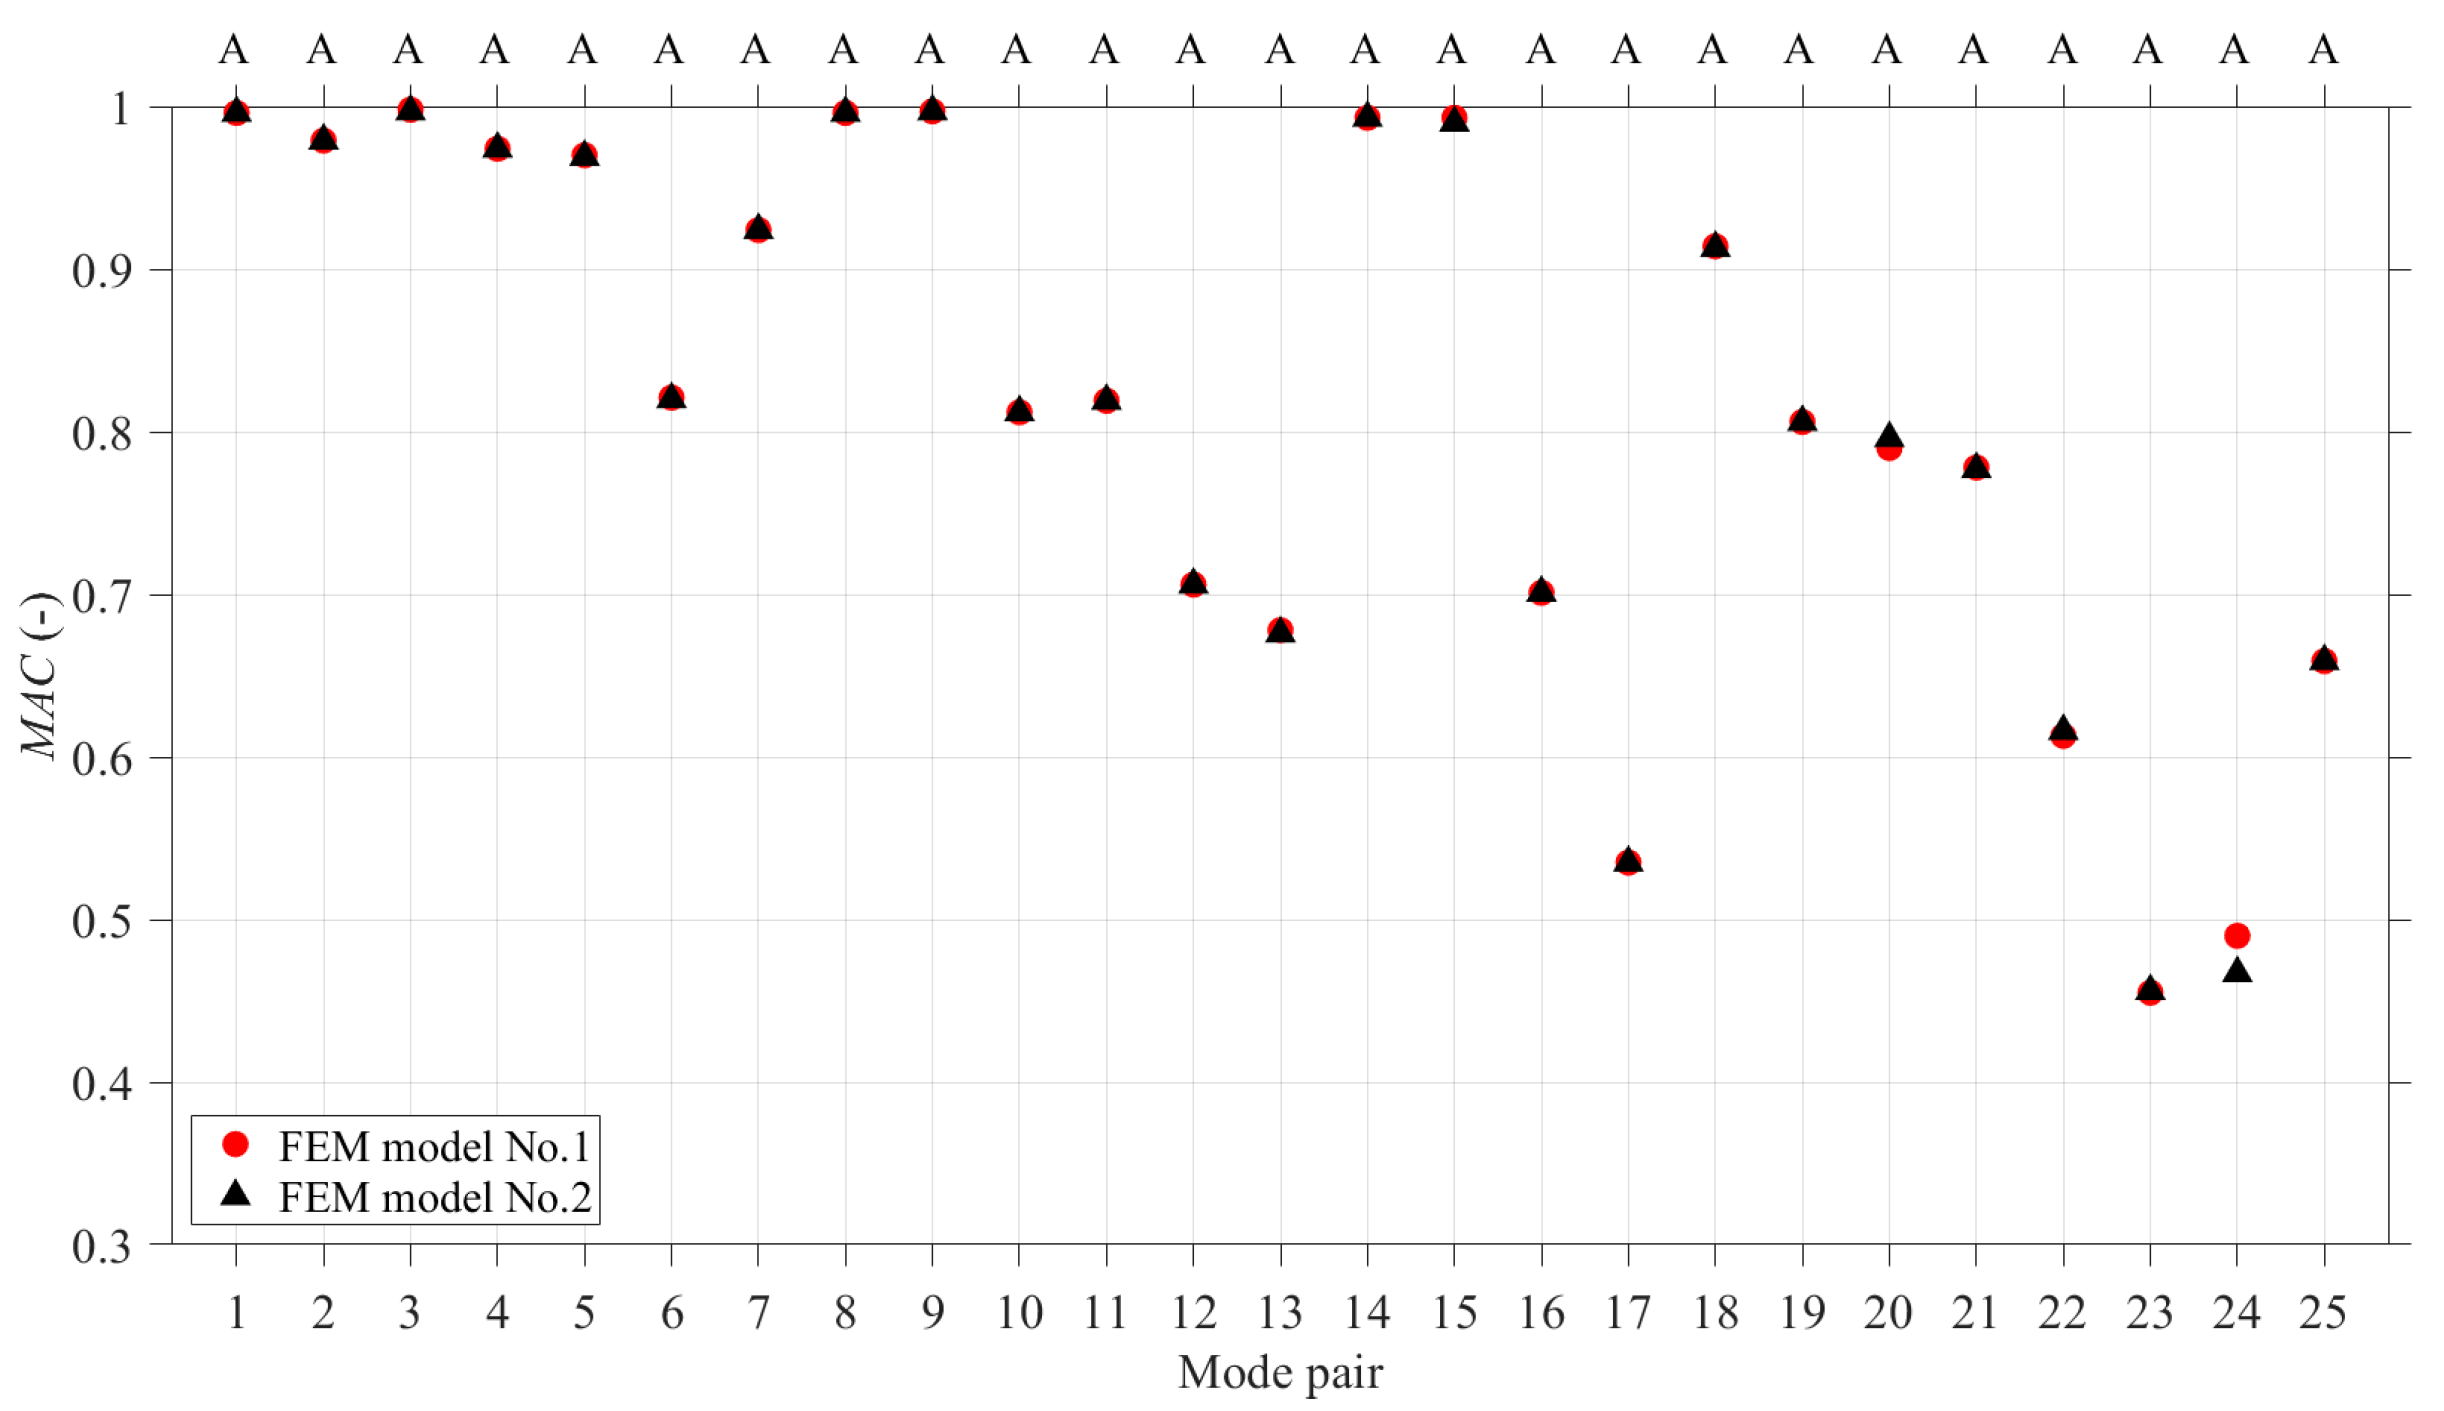
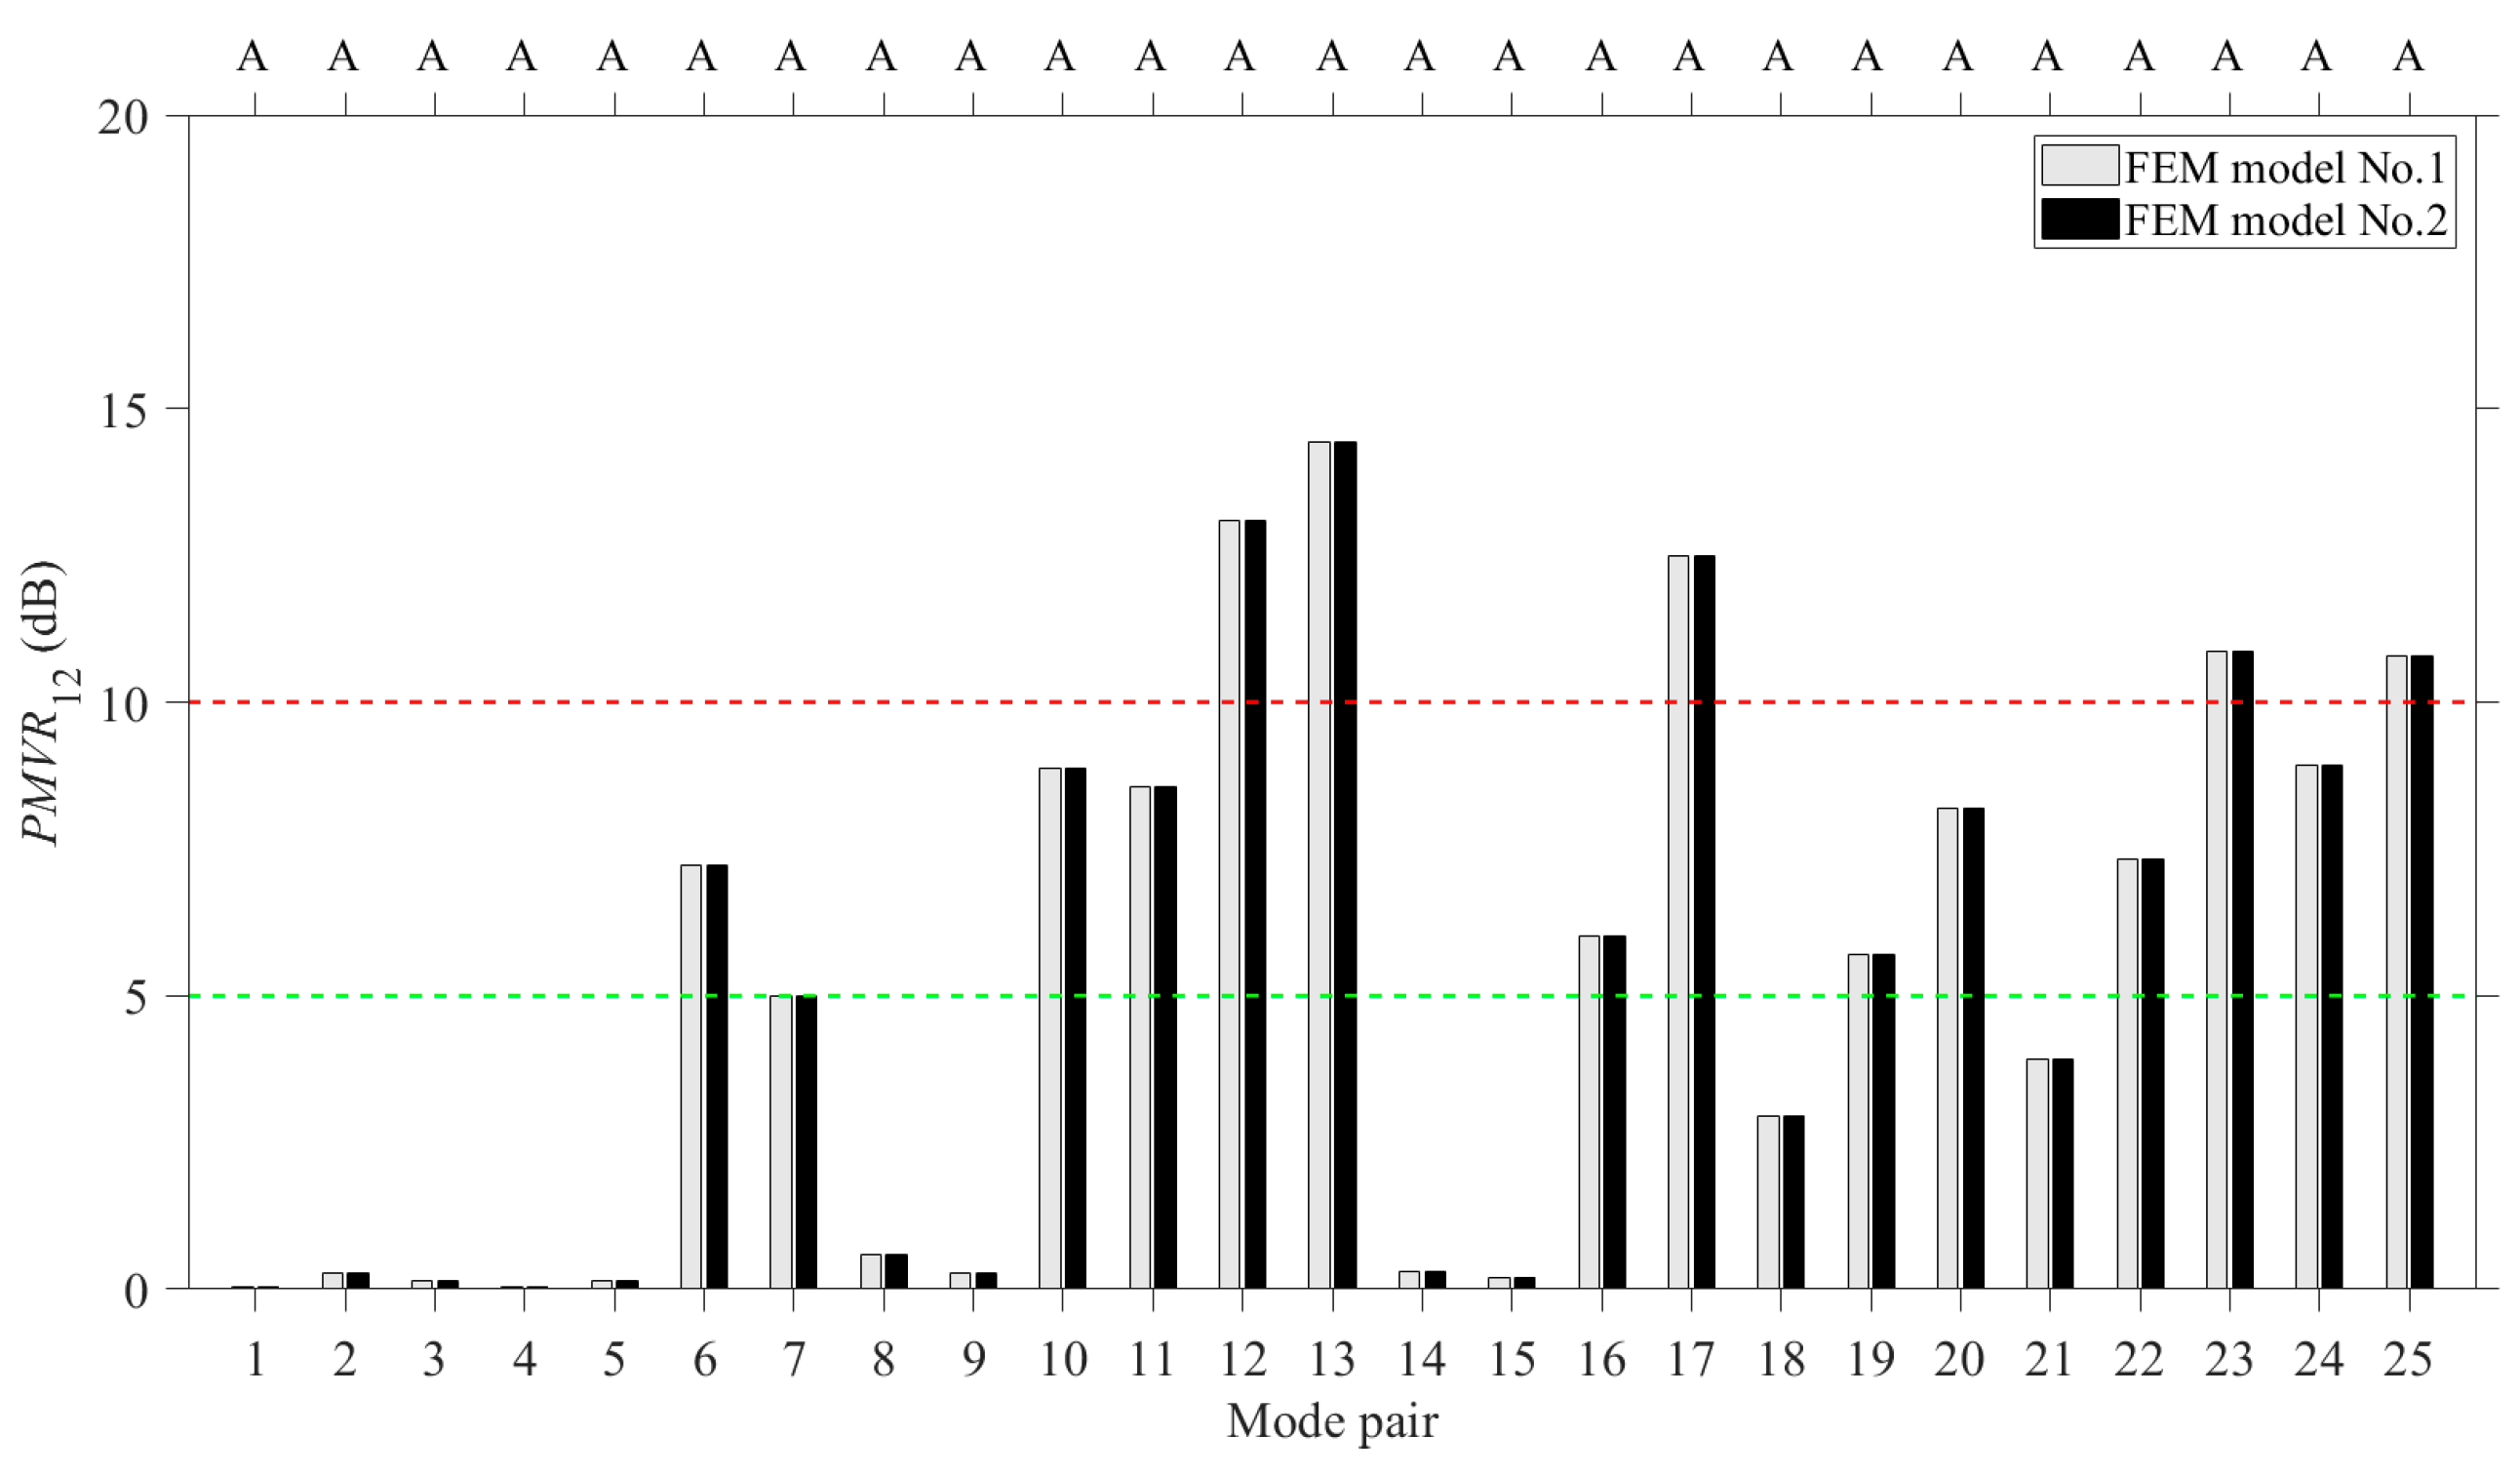
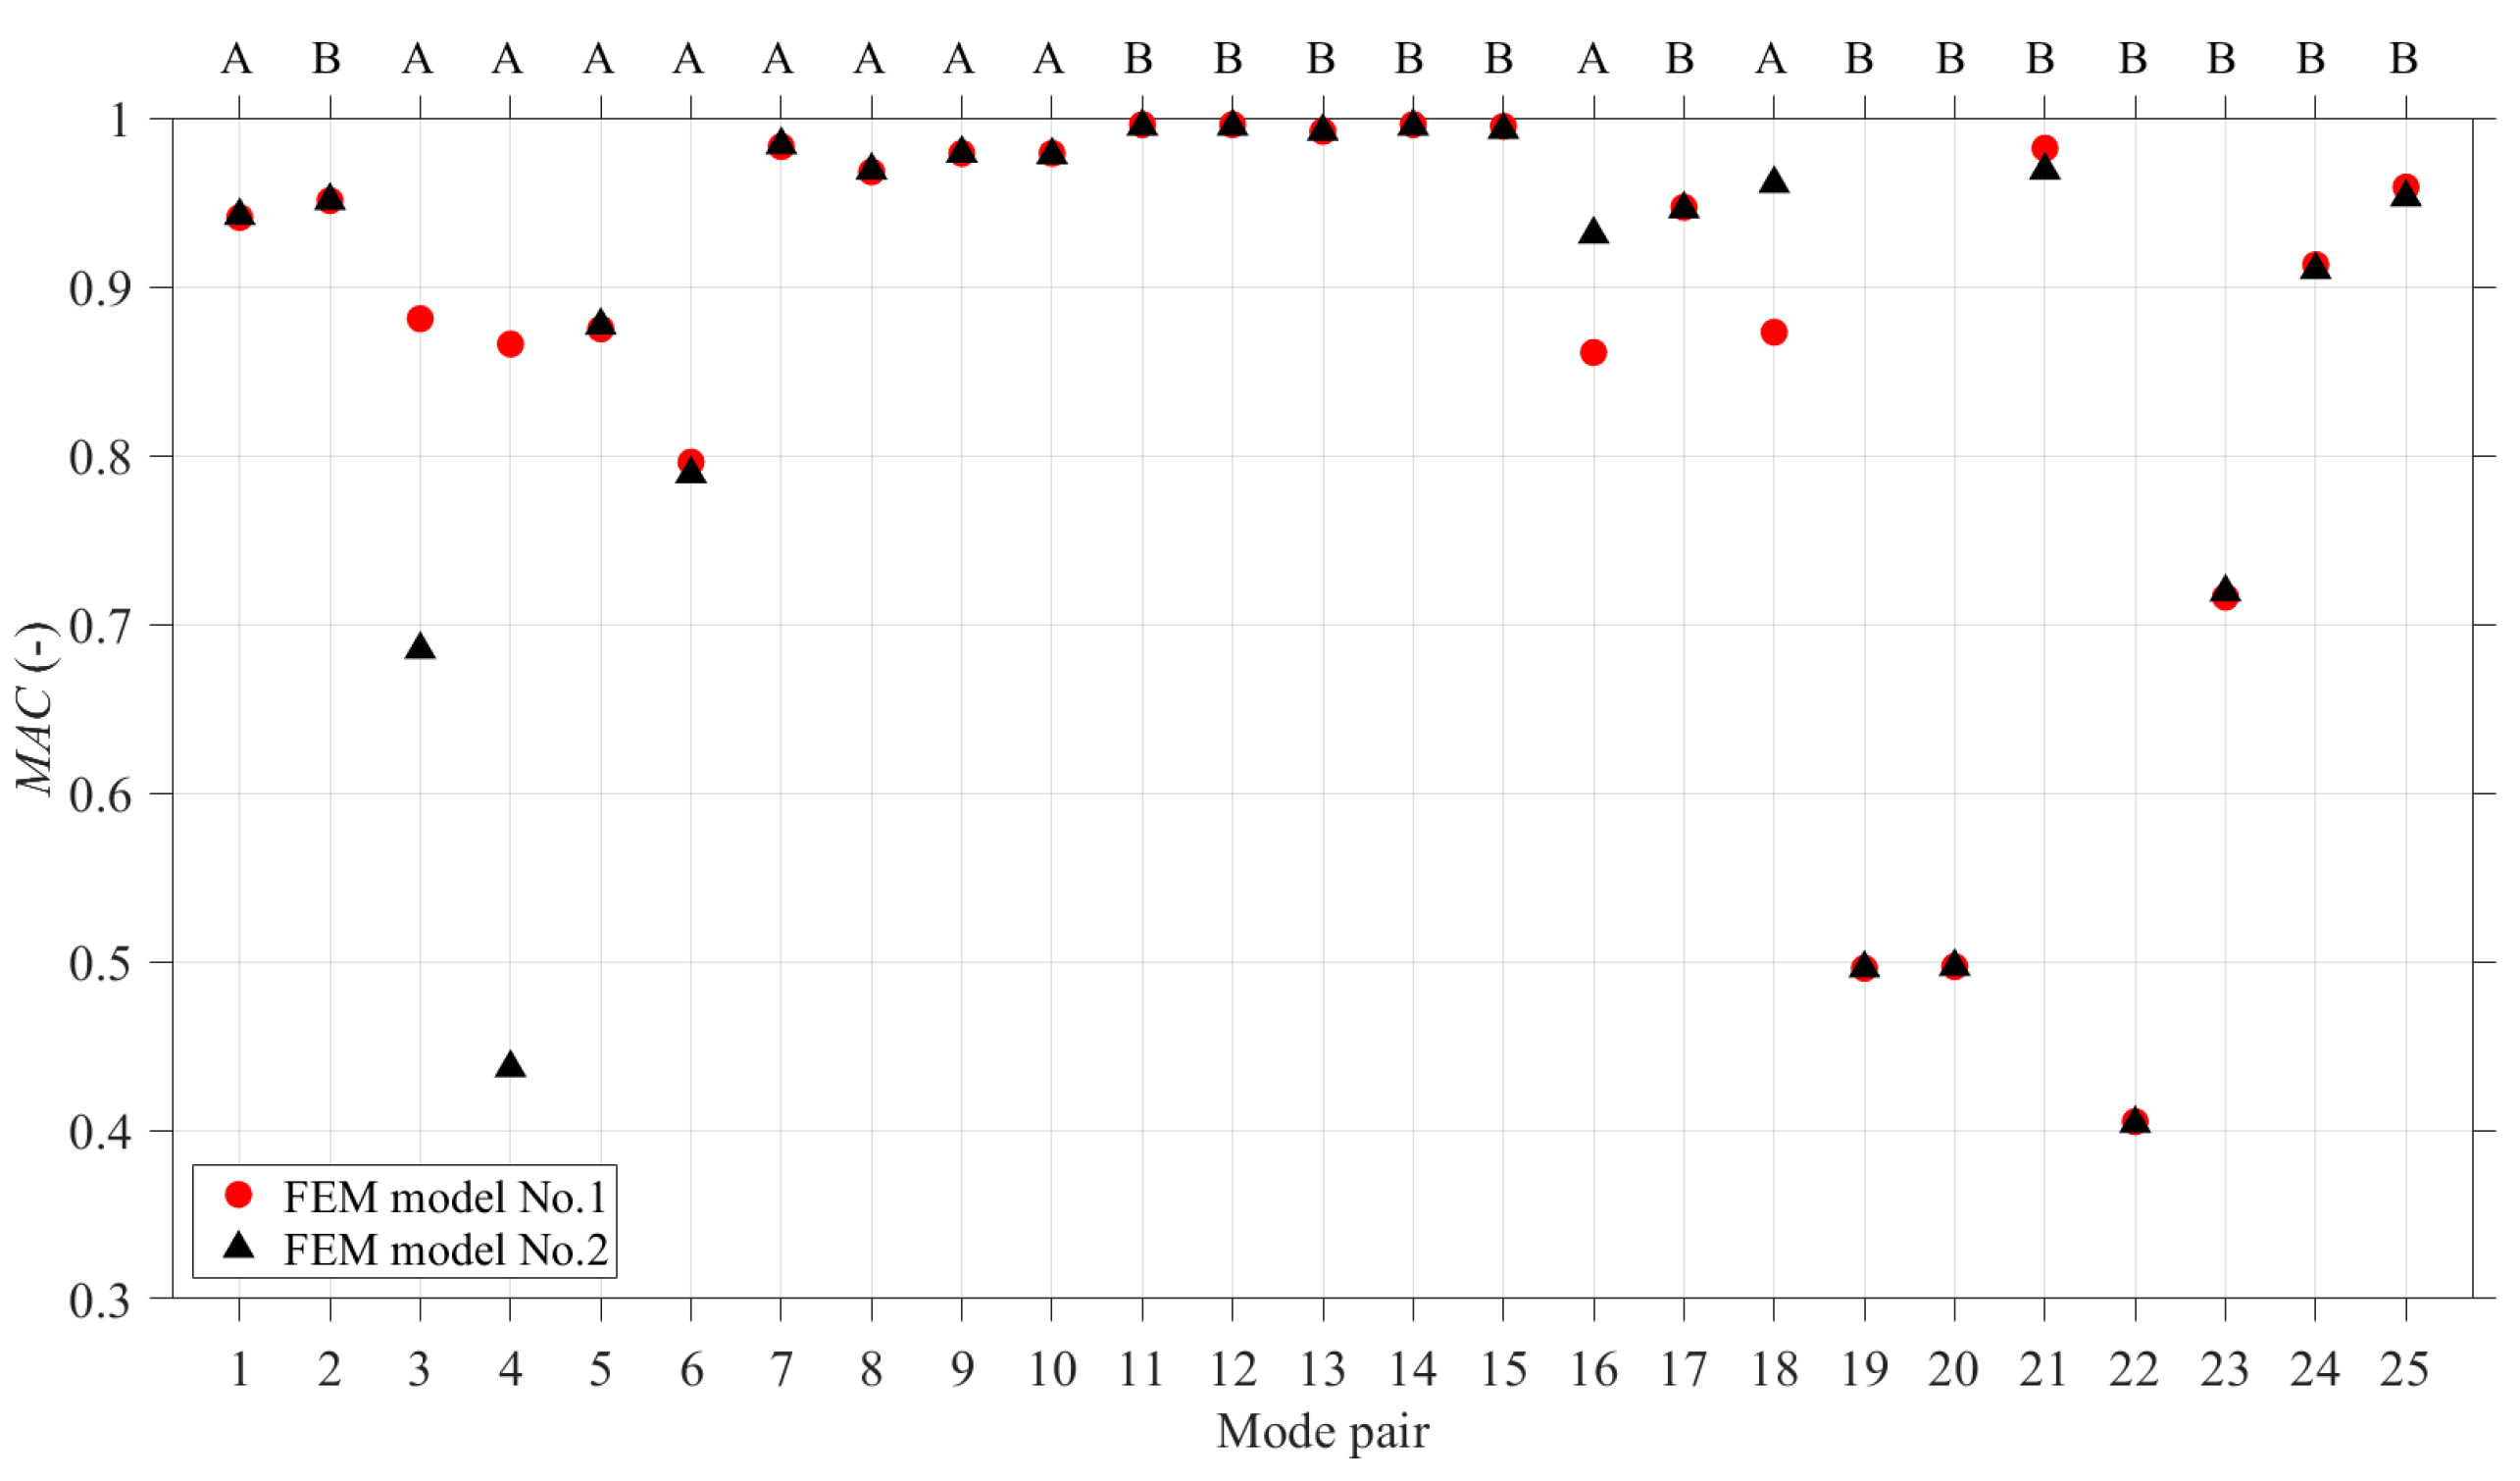
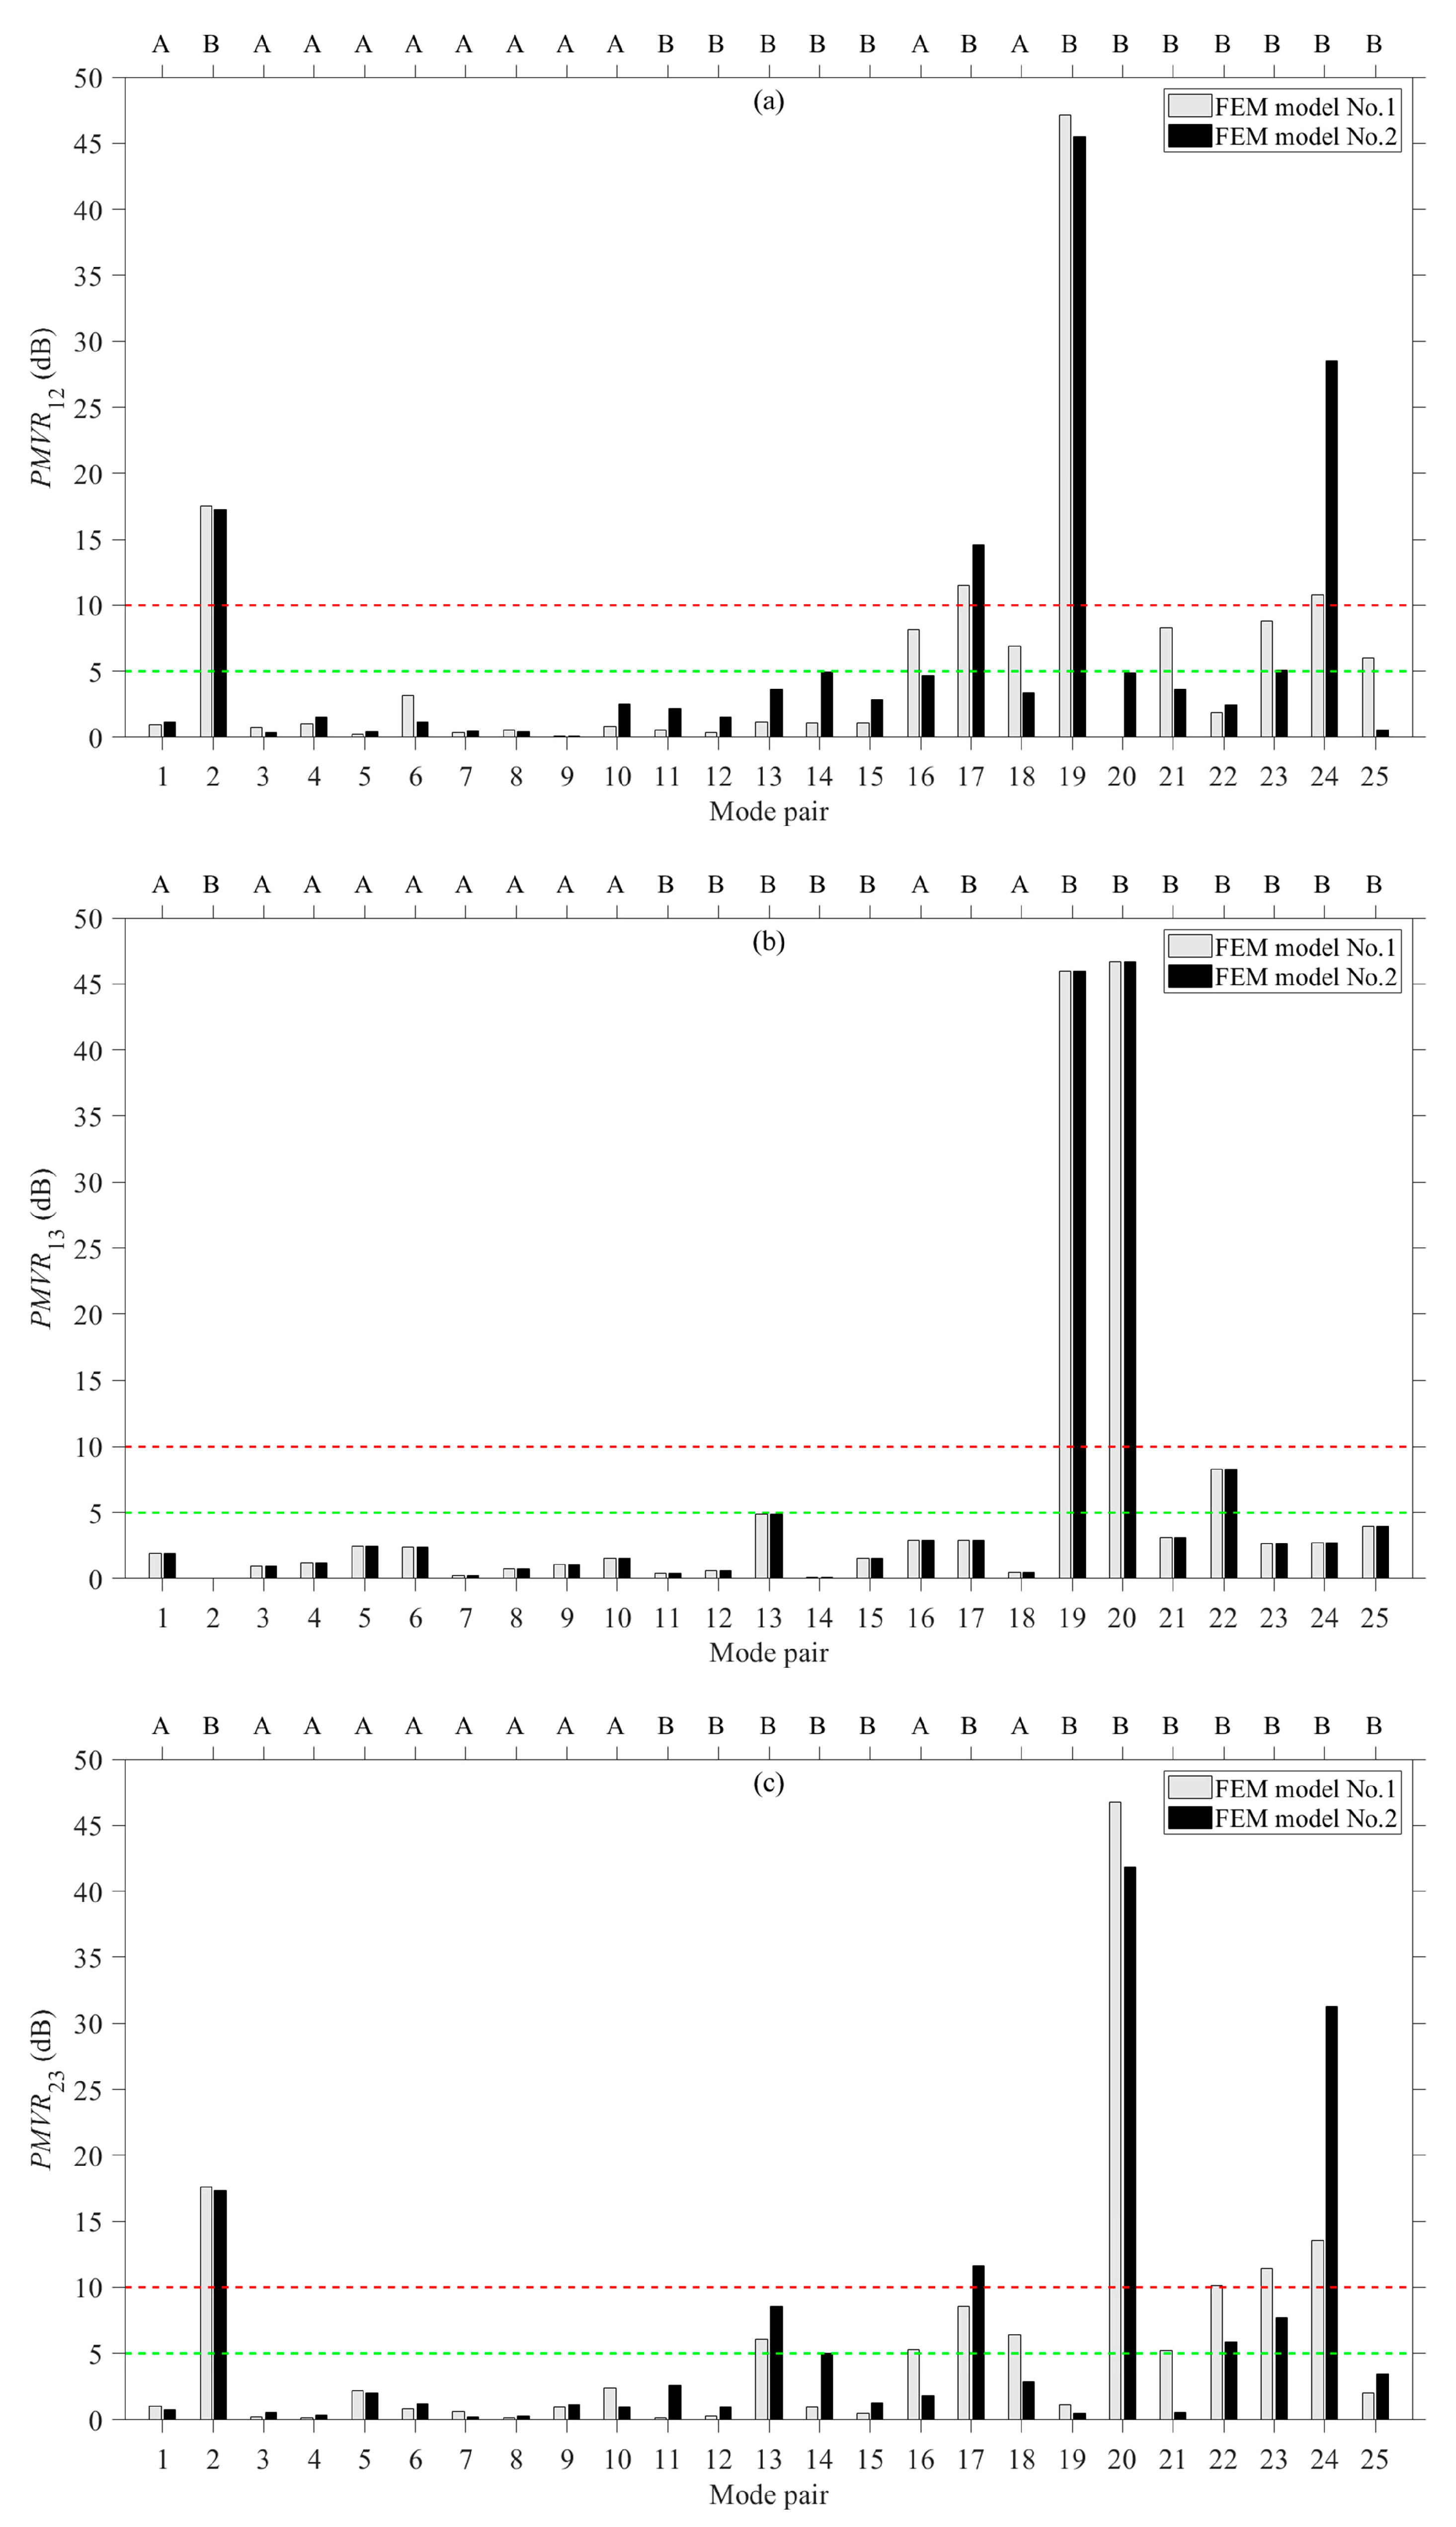
4.2. Mode Shapes
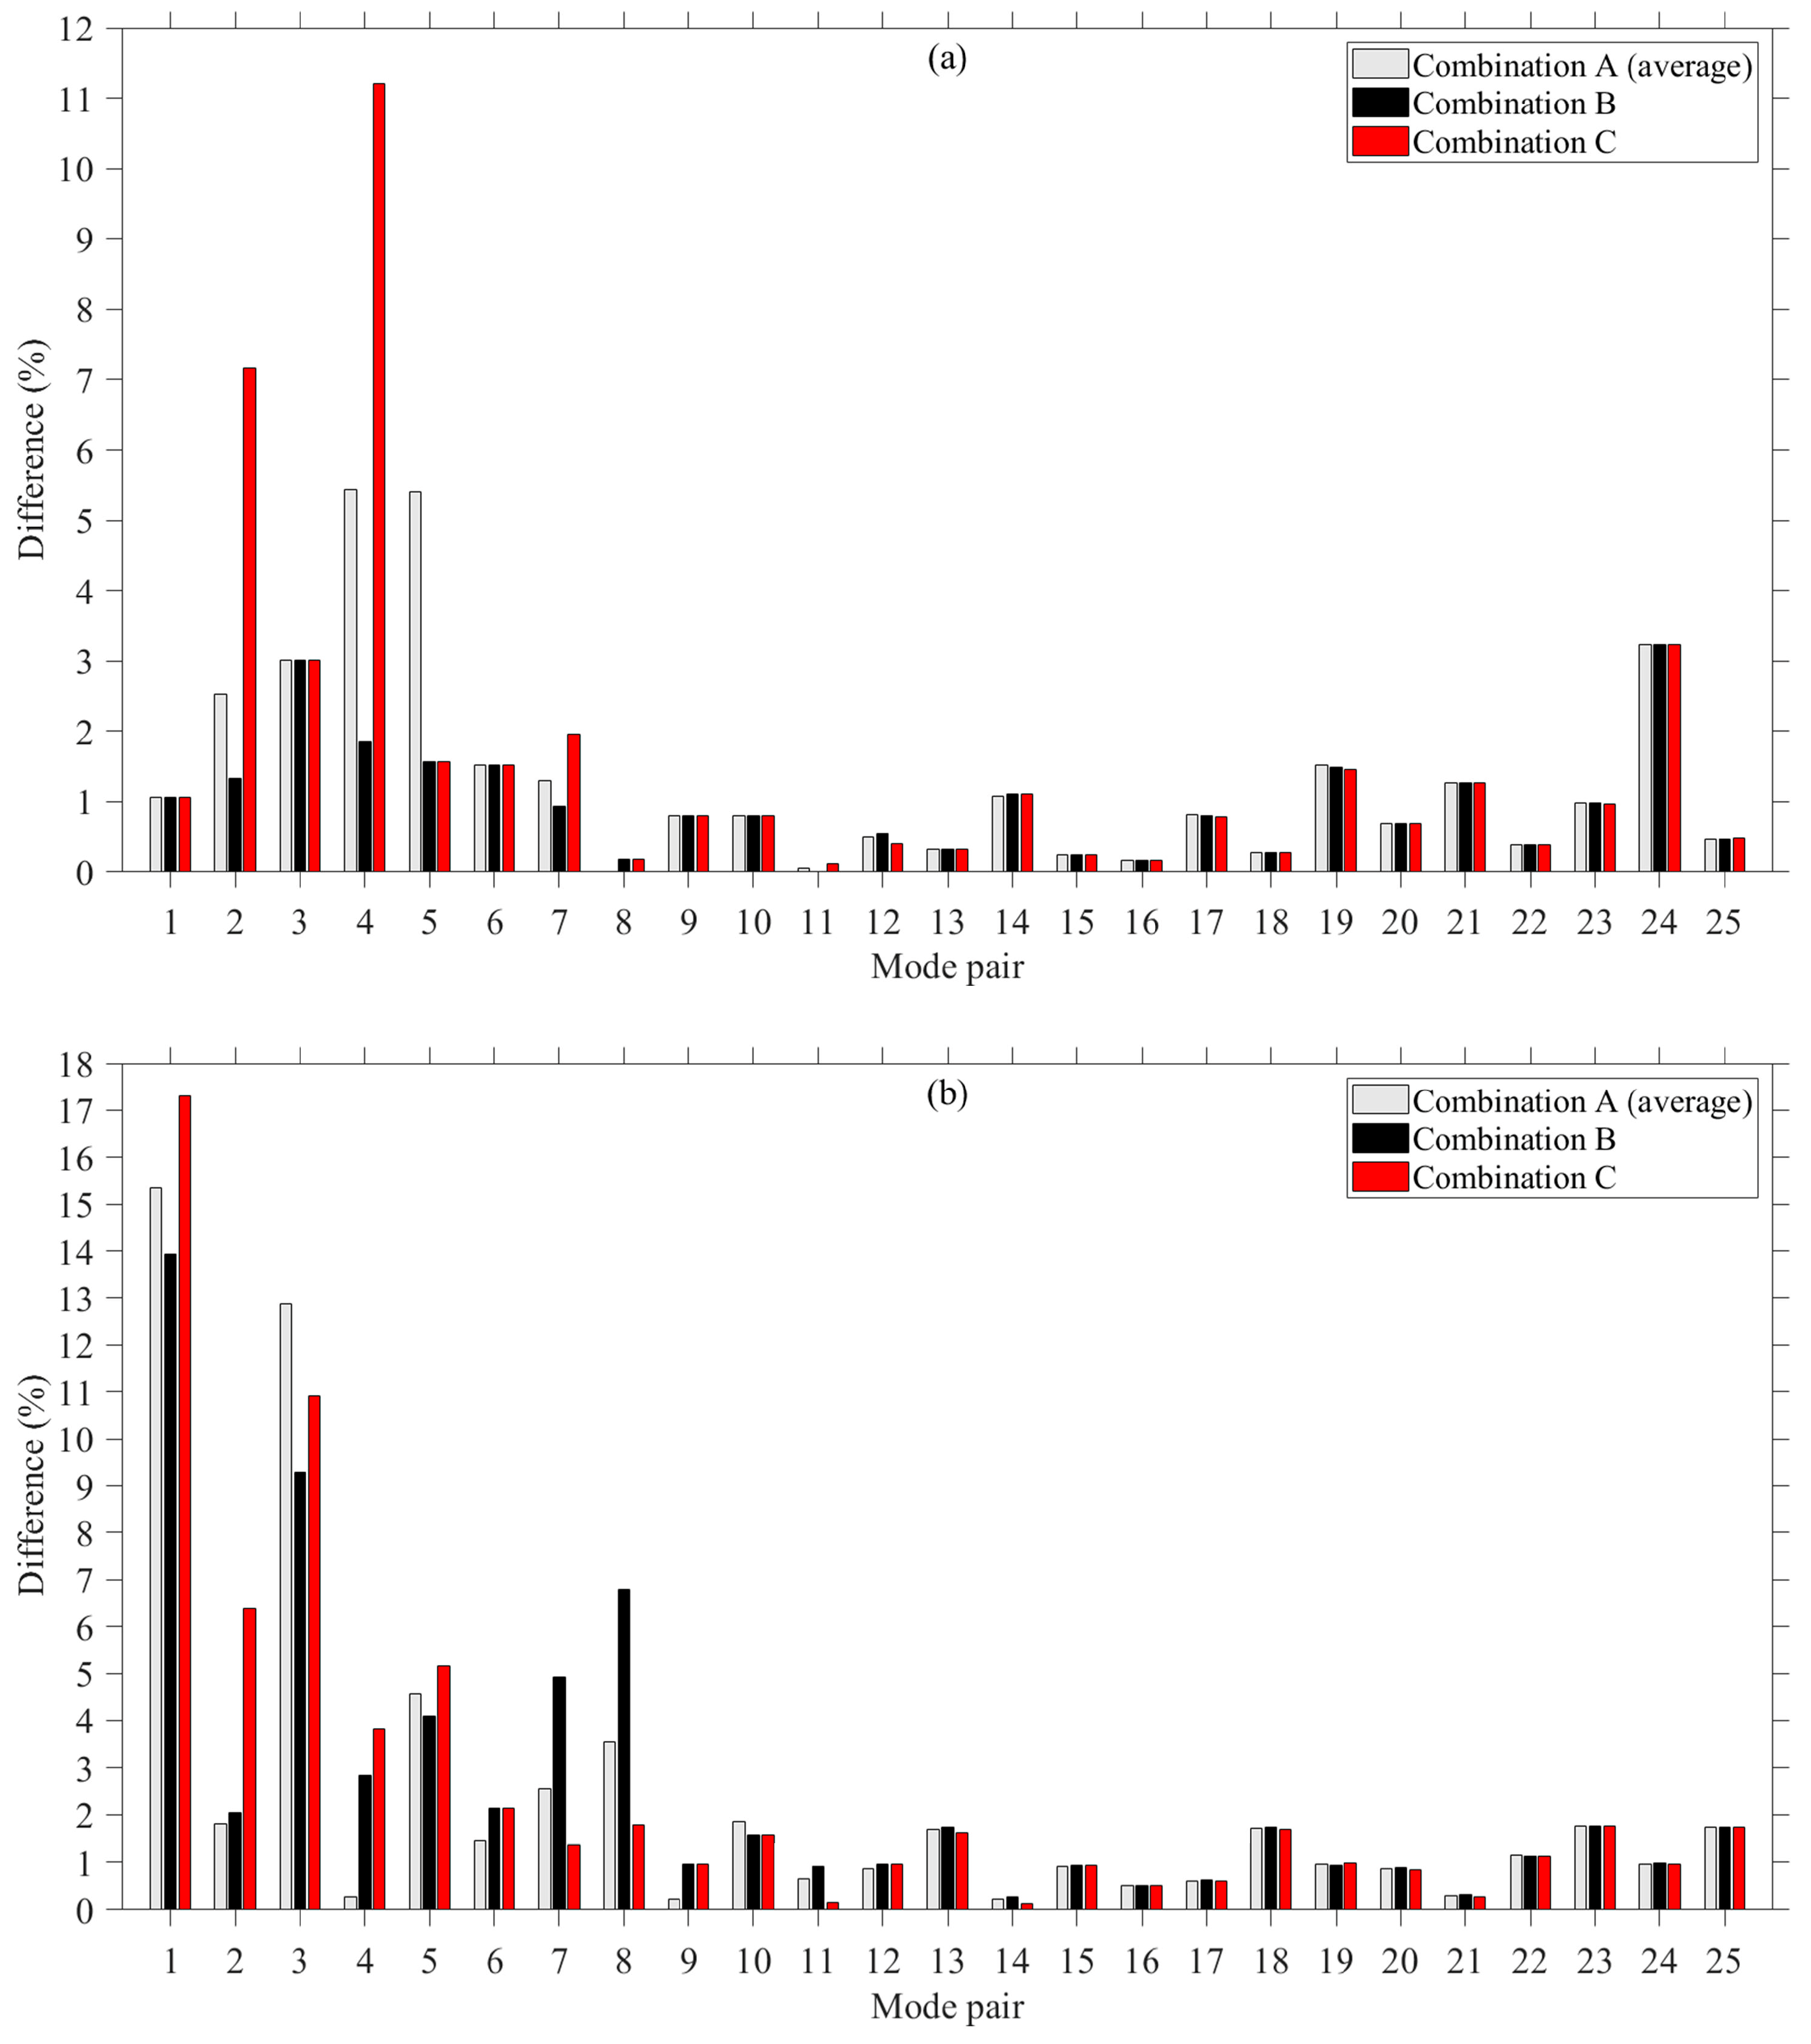
4.3. Sensitivity Analysis for FEM Model No.2
5. Conclusions
Author Contributions
Funding
Acknowledgments
Conflicts of Interest
References
- Bartels, S.A.; Van Rooyen, M.J. Medical complications associated with earthquakes. Lancet 2012, 379, 748–757. [Google Scholar] [CrossRef]
- Rom, A.; Kelman, I. Search without rescue? Evaluating the international search and rescue response to earthquake disasters. BMG Glob. Health 2020, 5, 002398. [Google Scholar]
- Cogurcu, M.T. Construction and design defects in the residential buildings and observed earthquake damage types in Turkey. Nat. Hazards Earth Syst. Sci. 2015, 15, 931–945. [Google Scholar] [CrossRef] [Green Version]
- Ates, S.; Kahya, V.; Yurdakul, M.; Adanur, S. Damages on reinforced concrete buildings due to consecutive earthquakes in Van. Soil Dyn. Earthq. Eng. 2013, 53, 109–118. [Google Scholar] [CrossRef]
- Kam, W.Y.; Pampanin, S.; Elwood, K. Seismic performance of reinforced concrete buildings in the 22 February Christchurch (Lyttelton) earthquake. Bull. N. Z. Soc. Earthq. Eng. 2011, 44, 239–278. [Google Scholar] [CrossRef] [Green Version]
- Huo, R.; Agapiou, A.; Bocos-Bintintant, V.; Brown, L.J.; Burns, C.; Creaser, C.S.; Devenport, N.A.; Gao-Lau, B.; Guallar-Hoyas, C.; Hildebrand, L.; et al. The trapped human experiment. J. Breath Res. 2011, 5, 046006. [Google Scholar] [CrossRef] [PubMed]
- Friedman, M.; Haddad, Y.; Blekhman, A. ACOUFIND: Acoustic Ad-Hoc Network System for Trapped Person Detection. In Proceedings of the IEEE International Conference on Microwaves, Communications, Antennas and Electronic Systems, Tel Aviv, Israel, 2–4 November 2015. [Google Scholar]
- Bäckström, C.J.; Christofferson, N. Urban Search and Rescue—An Evaluation of Technical Search Equipment and Methods. Master’s Thesis, Lund University, Lund, Sverige, 2006. [Google Scholar]
- Filippoupolitis, M.; Hopkins, C. Experimental validation of finite element models representing stacked concrete beams with unbonded surface contacts. Eng. Struct. 2021, 227, 111421. [Google Scholar] [CrossRef]
- He, X.G.; Kwan, A.K.H. Modelling dowel action of reinforcement bars for finite element analysis of concrete structures. Comput. Struct. 2001, 79, 595–604. [Google Scholar] [CrossRef]
- Kwan, A.K.H.; Ng, P.L. Modelling dowel action of discrete reinforcing bars for finite element analysis of concrete structures. Comput. Concr. 2013, 12, 19–36. [Google Scholar] [CrossRef]
- Chung, W.; Kwon, K.; Jang, S.Y. Deflection-based load transfer efficiency of floating slab track. KSCE J. Civ. Eng. 2014, 18, 616–624. [Google Scholar] [CrossRef]
- Figueira, D.; Sousa, C.; Neves, A.S. Winkler spring behavior in FE analyses of dowel action in statically loaded RC cracks. Comput. Concr. 2018, 21, 593–605. [Google Scholar]
- Xu, B.; Gong, X. Damage detection of reinforced concrete columns based on vibration tests. In Proceedings of the 12th International Conference on Earth and Space 2010: Engineering, Science, Construction, and Operations in Challenging Environments, Honolulu, HI, USA, 14–17 March 2010. [Google Scholar]
- Jaishi, B.; Ren, W.X. Damage detection by finite element model updating using modal flexibility residual. J. Sound Vib. 2006, 290, 369–387. [Google Scholar] [CrossRef]
- Pešić, N.; Živanović, S.; Dennis, J.; Hargreaves, J. Experimental and finite element dynamic analysis of incrementally loaded reinforced concrete structures. Eng. Struct. 2015, 103, 15–27. [Google Scholar] [CrossRef] [Green Version]
- Earij, A.; Alfano, G.; Cashell, K.; Zhou, X. Nonlinear three–dimensional finite–element modelling of reinforced–concrete beams: Computational challenges and experimental validation. Eng. Fail. Anal. 2017, 82, 92–115. [Google Scholar] [CrossRef]
- Ožbolt, J.; Sharma, A. Numerical simulation of reinforced concrete beams with different shear reinforcements under dynamic impact loads. Int. J. Impact Eng. 2011, 38, 940–950. [Google Scholar] [CrossRef]
- Tahenni, T.; Bouziardi, F.; Boulekbache, B.; Amziane, S. Experimental and nonlinear finite element analysis of shear behaviour of reinforced concrete beams. Structures 2021, 29, 1582–1596. [Google Scholar] [CrossRef]
- Hutton, D.V. Fundamentals of Finite Element Analysis, 1st ed.; McGraw-Hill: New York, NY, USA, 2004. [Google Scholar]
- Bamforth, P.; Chisholm, J.; Gibbs, J.; Harrison, T. Properties of Concrete for Use in Eurocode 2; The Concrete Centre: Surrey, UK, 2008; ISBN 978-1-904482-39-0. [Google Scholar]
- Mosley, B.; Bungey, J.; Hulse, R. Reinforced Concrete Design to Eurocode 2, 7th ed.; Palgrave Macmillan: Basingstoke, UK, 2012; ISBN 978-0-230-30285-3. [Google Scholar]
- Abaqus 6.14 Documentation and User Manual; Dassault Systèmes Simulia Corporation: Providence, RI, USA, 2014.
- Atalla, N.; Sgard, F. Finite Element and Boundary Methods on Structural Acoustics and Vibration; CRC Press: Boca Raton, FL, USA; Taylor & Francis Group: Boca Raton, FL, USA, 2015. [Google Scholar]
- Porter, M.; Pierson, N. Laboratory evaluation of alternative dowel bars for use in Portland cement concrete pavement construction. Transp. Res. Rec. J. Transp. Res. Board 2007, 2040, 80–87. [Google Scholar] [CrossRef]
- Soroushian, P.; Obaseki, K.; Rojas, M.C. Bearing strength and stiffness of concrete under reinforcing bars. ACI Mater. J. 1987, 84, 179–184. [Google Scholar]
- Ewins, D.J. Modal Testing: Theory, Practice and Application, 2nd ed.; Research Studies Press Ltd.: Baldock, UK, 2000; ISBN 0-86380-218-4. [Google Scholar]
- Allemang, R.J. The modal assurance criterion—Twenty years of use and abuse. Sound Vib. 2003, 37, 14–21. [Google Scholar]


| Material | Density, ρ (kg/m3) | Young’s Modulus, E (N/m2) | Poisson’s Ratio, ν (-) | |
|---|---|---|---|---|
| Concrete (C25/30) | Beam 1 | 2235 | 3.2475 × 10¹⁰ | 0.2 |
| Beam 2 | 2234 | |||
| Steel (S500) | 7800 | 2 × 10¹¹ | 0.3 | |
| Beam | No. of Accelerometers | No. of Excitation Positions | ||
|---|---|---|---|---|
| In-Plane | Out-of-Plane | In-Plane | Out-of-Plane | |
| 1 | 4 | 2 | 160 | 84 |
| 2 | 6 | 3 | 192 | 90 |
| Combination | cf (-) | |
|---|---|---|
| X-Direction | Y-Direction | |
| A (average) | 0.725 | 0.725 |
| B | 0.6 | 0.6 |
| C | 1.0 | 0.6 |
Publisher’s Note: MDPI stays neutral with regard to jurisdictional claims in published maps and institutional affiliations. |
© 2021 by the authors. Licensee MDPI, Basel, Switzerland. This article is an open access article distributed under the terms and conditions of the Creative Commons Attribution (CC BY) license (https://creativecommons.org/licenses/by/4.0/).
Share and Cite
Filippoupolitis, M.; Hopkins, C. Experimental Validation of Finite Element Models for Reinforced Concrete Beams with Discontinuities That Form Dowel-Type Joints. Vibration 2021, 4, 537-550. https://0-doi-org.brum.beds.ac.uk/10.3390/vibration4030032
Filippoupolitis M, Hopkins C. Experimental Validation of Finite Element Models for Reinforced Concrete Beams with Discontinuities That Form Dowel-Type Joints. Vibration. 2021; 4(3):537-550. https://0-doi-org.brum.beds.ac.uk/10.3390/vibration4030032
Chicago/Turabian StyleFilippoupolitis, Marios, and Carl Hopkins. 2021. "Experimental Validation of Finite Element Models for Reinforced Concrete Beams with Discontinuities That Form Dowel-Type Joints" Vibration 4, no. 3: 537-550. https://0-doi-org.brum.beds.ac.uk/10.3390/vibration4030032