Article

Deep Learning Methods to Reveal Important X-ray Features in COVID-19 Detection: Investigation of Explainability and Feature Reproducibility

by
Ioannis D. Apostolopoulos
1,*,
Dimitris J. Apostolopoulos
2 and
Nikolaos D. Papathanasiou
2
1
Department of Medical Physics, School of Medicine, University of Patras, 265-00 Patras, Greece
2
Laboratory of Nuclear Medicine, University Hospital of Patras, 265-00 Patras, Greece
*
Author to whom correspondence should be addressed.
Submission received: 21 April 2022 / Revised: 20 May 2022 / Accepted: 27 May 2022 / Published: 31 May 2022
(This article belongs to the Special Issue Novel Aspects of COVID-19 after a Two-Year Pandemic)

Abstract

:
X-ray technology has been recently employed for the detection of the lethal human coronavirus disease 2019 (COVID-19) as a timely, cheap, and helpful ancillary method for diagnosis. The scientific community evaluated deep learning methods to aid in the automatic detection of the disease, utilizing publicly available small samples of X-ray images. In the majority of cases, the results demonstrate the effectiveness of deep learning and suggest valid detection of the disease from X-ray scans. However, little has been investigated regarding the actual findings of deep learning through the image process. In the present study, a large-scale dataset of pulmonary diseases, including COVID-19, was utilized for experiments, aiming to shed light on this issue. For the detection task, MobileNet (v2) was employed, which has been proven very effective in our previous works. Through analytical experiments utilizing feature visualization techniques and altering the input dataset classes, it was suggested that MobileNet (v2) discovers important image findings and not only features. It was demonstrated that MobileNet (v2) is an effective, accurate, and low-computational-cost solution for distinguishing COVID-19 from 12 various other pulmonary abnormalities and normal subjects. This study offers an analysis of image features extracted from MobileNet (v2), aiming to investigate the validity of those features and their medical importance. The pipeline can detect abnormal X-rays with an accuracy of 95.45 ± 1.54% and can distinguish COVID-19 with an accuracy of 89.88 ± 3.66%. The visualized results of the Grad-CAM algorithm provide evidence that the methodology identifies meaningful areas on the images. Finally, the detected image features were reproducible in 98% of the times after repeating the experiment for three times.

1. Introduction

Deep learning has already demonstrated superiority to conventional methods in a variety of medical imaging tasks, including the classification of important diseases using different imaging modalities, such as Computed Tomography (CT), Positron Emission Tomography (PET), and X-ray [1]. The recent human coronavirus disease (COVID-19) poses new challenges for deep learning experts, such as the automatic segmentation and classification of CT or X-ray images that can lead to a timely, accurate, and cost-effective diagnosis. Limitations related to data scarcity have been a major obstacle in designing deep and robust frameworks [2]. Since March 2020, the available X-ray image datasets included no more than 500 images of COVID-19 disease.
Typical imaging findings of COVID-19 lung infection include bilateral, patchy, lower-lobe-predominant, and peripheral ground-glass opacities and/or consolidation. These are mainly identified on CT imaging rather than X-ray, which has lower sensitivity for COVID-19 diagnosis at the level of ≈67–100% [3]. Nevertheless, the scientific community has responded to the aforementioned challenge and has provided first answers as to whether this disease can indeed be detected solely from X-ray images. Several works suggest the utilization of deep learning models, such as Convolutional Neural Networks (CNNs) for diagnosis [4,5,6,7,8,9,10]. In most cases, either handcrafted CNNs, or established CNNs in other domains, yield precise and promising results, at least in cases where the COVID-19 disease is adequately visualized in the particular imaging modality. All those networks have been evaluated utilizing approximately the same image sources.
Deep learning has already demonstrated its effectiveness in distinguishing COVID-19 using the particular image datasets. However, the assumption that through deep learning it is possible to diagnose COVID-19 solely on the basis of X-ray images is not valid yet. This is because the available datasets are heavily incomplete due to the following reasons:
  • The samples are too few for deep model training
  • The image information is not accompanied by clinical outcomes.
  • There are few multicenter studies to support the conclusions.
  • The samples commonly illustrate COVID-19 disease of patients showing disease symptoms. Asymptomatic cases are under-represented.
The above issues motivated the scientific community towards applying data augmentation techniques to expand the training sets, add diversity to the data distributions, and enable their models to become robust to transformations.. Nevertheless, the data scarcity issue is not circumvented completely. The question arising at this point is the following: “Besides their undeniably strong predictive power, are the developed deep learning models capable of providing explanations regarding their decisions, informing the actual user of their image findings so as to be trustworthy and accountable?”.
Motivated by our previous studies on the automatic identification of COVID-19 from X-rays [5,9] and aiming to shed light on the explainability of deep learning, we performed a deeper analysis on the decision mechanisms of mobile network, a state-of-the-art CNN, that exhibited promising results in our recent study [5]. In previous work of our group [9], the effectiveness of training from scratch strategy against transfer learning is demonstrated, showing that training from scratch may discover potential image biomarkers extracted from X-ray images. This conclusion is based on the comparison of transfer learning with training from scratch. The reader should note that with transfer learning, the classification is mainly based on pre-learned feature extraction knowledge of a particular CNN. This knowledge is obtained by performing an independent training on large-scale datasets of a completely different domain task. Although transfer learning also yields good results, training from scratch improves the classification accuracy. This led the authors to the conclusion that novel and vital image features were extracted from the latter strategy.
In the present work, the feature extraction capabilities of MobileNet (v2) were further analyzed by performing extensive experiments and visualizing the output feature maps. The Grad-CAM algorithm [11] was utilized to reveal the regions where MobileNet (v2) seeks for important features. In this way, a better understanding of the decision mechanism of the network is achieved.
The contributions of this paper can be summarized as follows:
  • The successful state-of-the-art network (MobileNet v2) was extensively evaluated in performing multi-class and two-class classification of X-ray images with the aim of identifying images related to the coronavirus disease. Further, the consistency of the reported metrics was assessed by running a 25-times 10-fold cross-validation
  • The explainability algorithm (Grad-CAM) was employed to inspect the consistency of the suggested areas of interest across a three-run experiment.
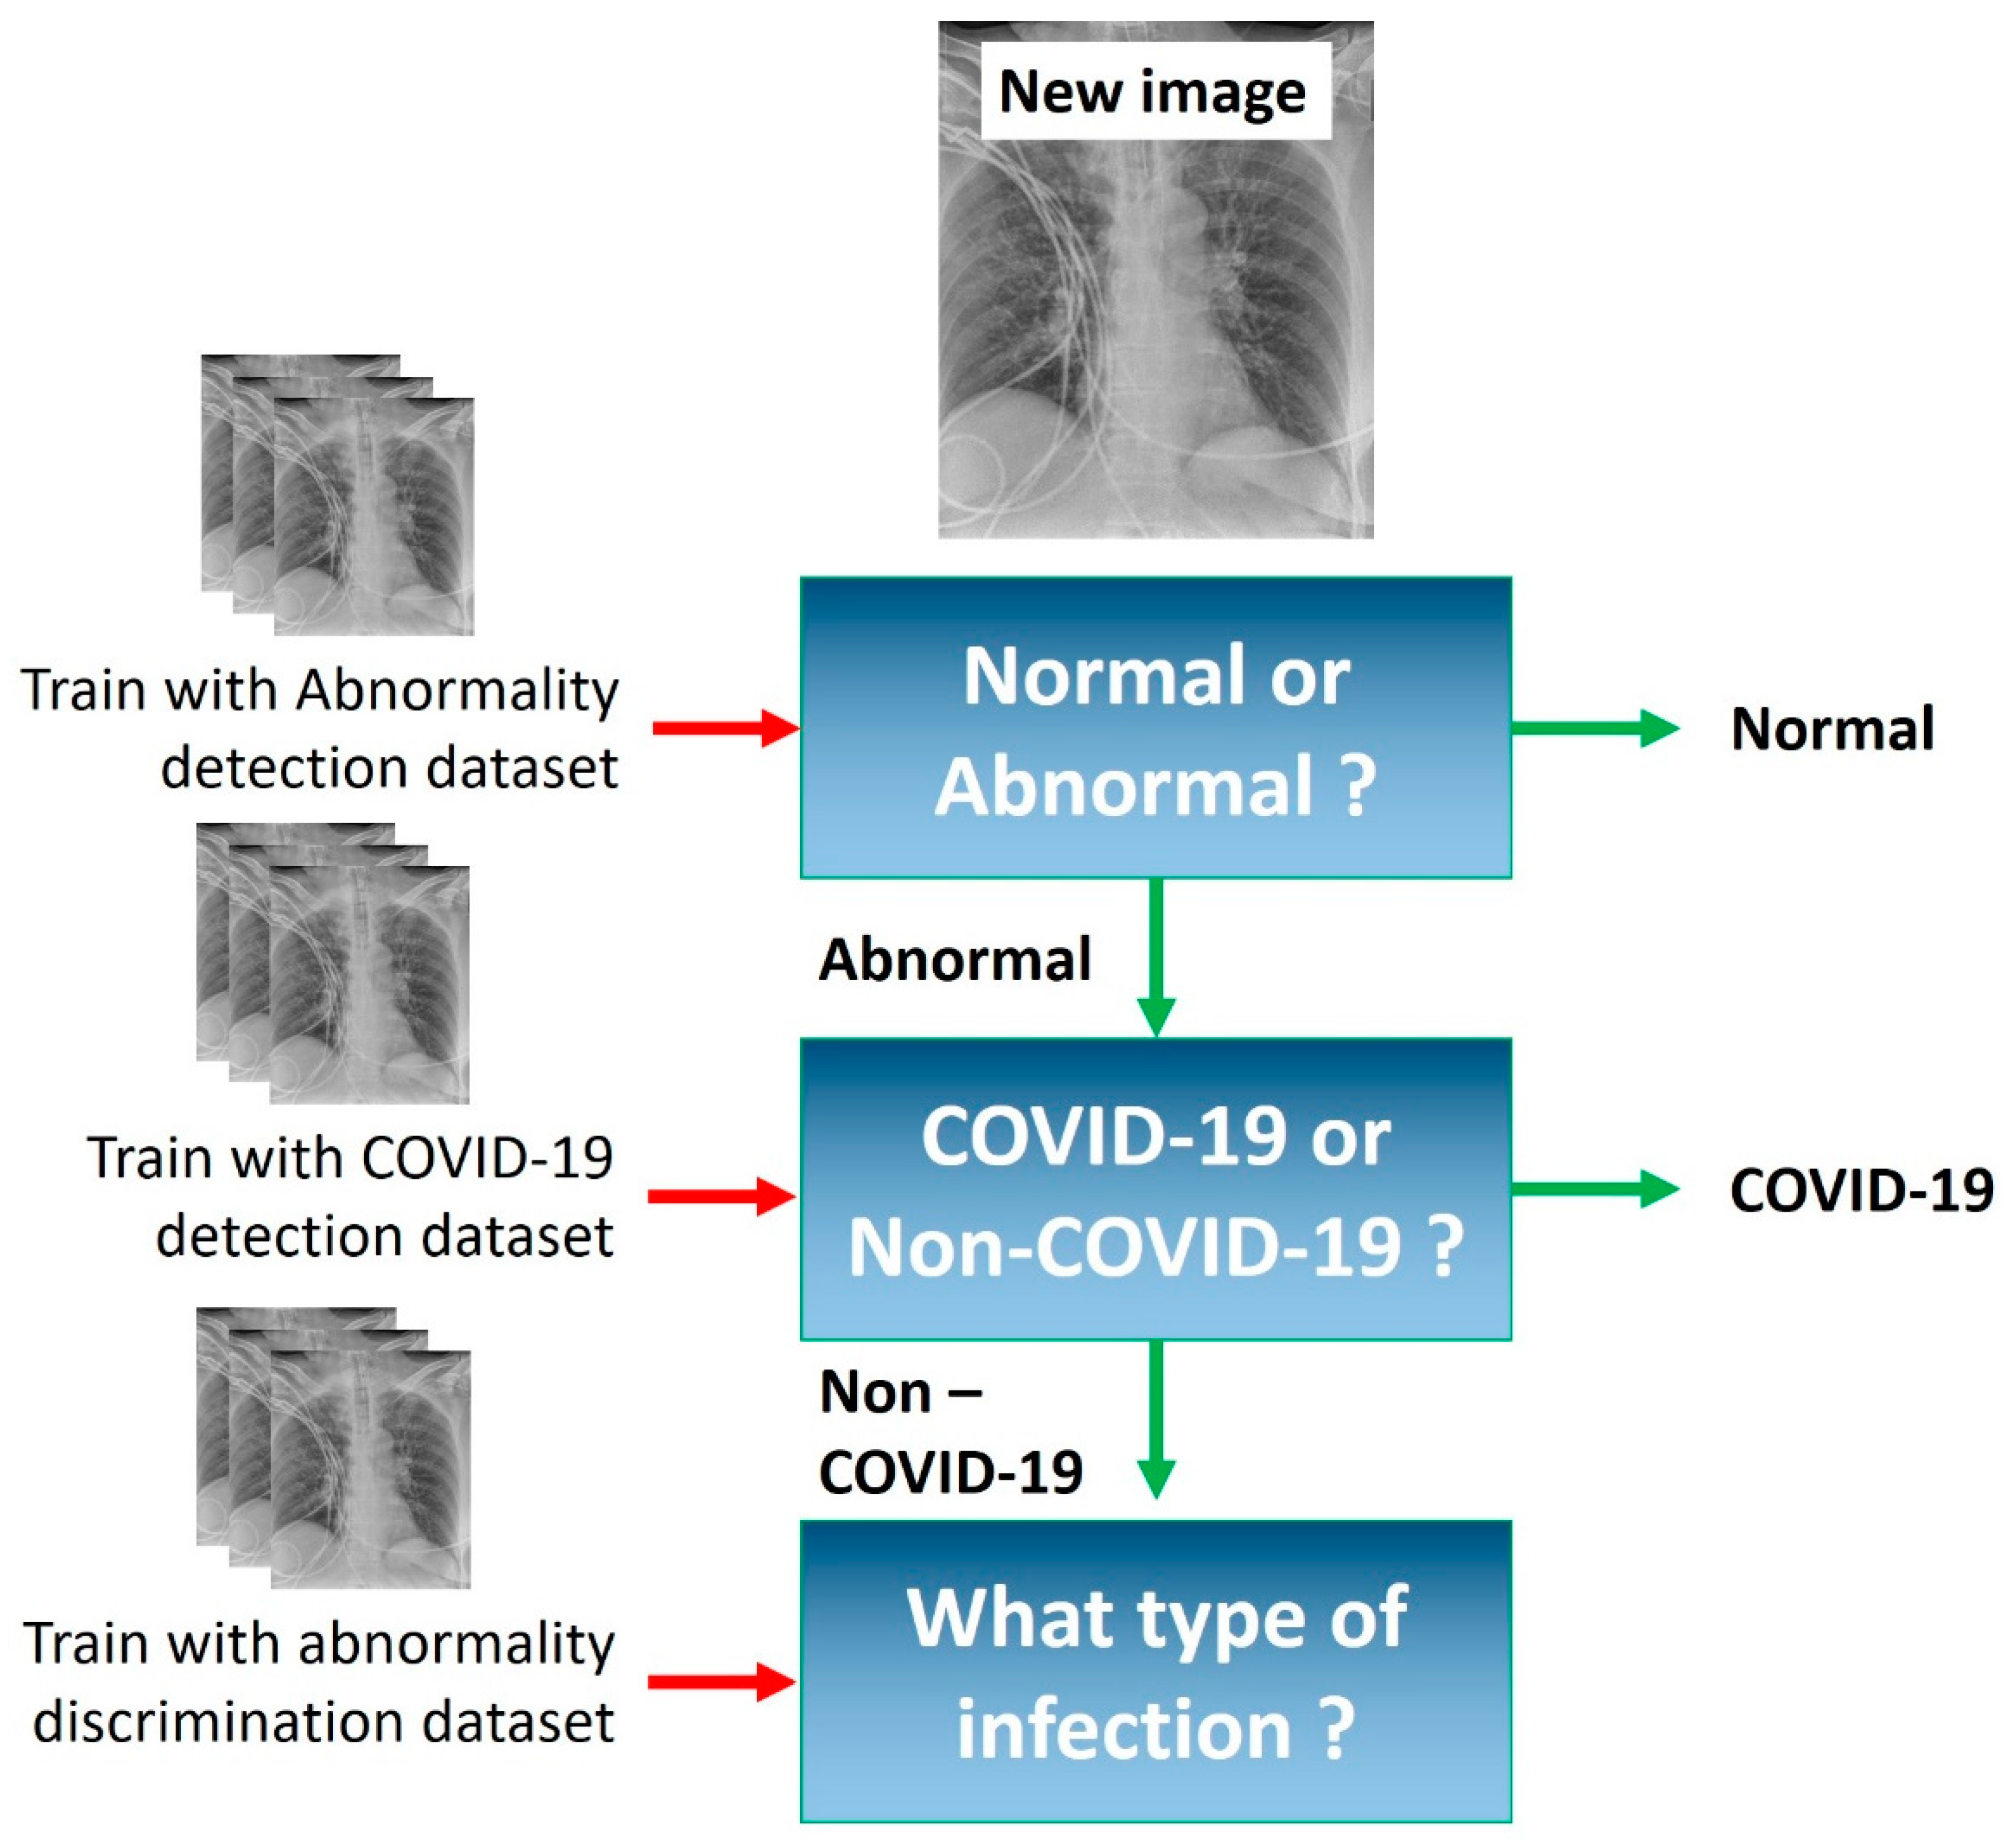
  • We present a staged approach for the detection of COVID-19 from X-ray images that exhibited an accuracy of 89.88 ± 3.66%.

2. COVID-19 Detection Based on X-ray Imaging: Recent Studies

The research community has put an enormous effort in developing deep learning pipelines for COVID-19 detection from either computed tomography (CT) scans or X-ray scans. In addition, a large amount of attention has been paid to leveraging explainability methods to visualize the suggested areas of interest as proposed by the models. Hence, model assessment can be based not only on quantitative metrics (such as the accuracy, the sensitivity, and the specificity scores), but also on qualitative evaluation. In this section, we briefly describe major findings and trends found in the latest literature.
Hou and Gao [12] proposed a deep CNN-based platform for COVID-19 detection that could identify COVID-19 cases with an accuracy of 96%. Their model has been trained using a dataset of 1400 chest X-ray images, which includes 400 normal images, 400 images of pneumonia infection from bacteria, 400 images of pneumonia infection by other viruses, and 200 images of pneumonia infection by COVID-19. The authors used the Grad-CAM algorithm to visualize the suggested areas of interest.
Ahsan et al. [13] proposed the utilization of the state-of-the-art networks named Virtual Geometry Group (VGG) and MobileNet (v2) to distinguish between COVID-19 and non-COVID-19 X-rays from an imbalanced dataset of 2191 X-rays. The networks achieved remarkable accuracy, stretching between 91% and 96% and an AUC score of approximately 0.82. The authors used the local interpretable model-agnostic explanations (LIME) [14] method for the visualization of important image areas.
Brunese et al. [4] analyzed 6523 X-ray scans and developed a pipeline for an incremental detection of COVID-19. Their framework identifies pulmonary-disease-related X-rays and then further distinguishes between COVID-19 cases and non-COVID-19 cases. Their model reached an accuracy of 97%. The authors adopted the Grad-CAM algorithm to visualize the feature maps and verified that their model did not focus on irrelevant locations of the image.
In [9], which is a previous study by the authors of this study, a first attempt to evaluate the extracted features of deep learning methods for COVID-19 detection from X-rays revealed evidence that training MobileNets from scratch can extract problem-specific features that could be if medical importance. In addition, an accuracy of 99% in distinguishing between COVID-19 and non-COVID-19 cases from an imbalanced dataset of 3905 scans.
Wang et al. [15] proposed COVID-Net, a tailored CNN trained on a dataset of 13,975 X-ray scans. They achieved an accuracy of 93.3% in distinguishing between normal, common pneumonia, and COVID-19-related pneumonia images. The authors employed the GSInquire method [16] to plot the associated critical factors on the image. COVID-Net primarily leveraged areas in the lungs in the X-ray images as the main critical factors in determining whether an X-ray image is of a patient with COVID-19.
Thorough interpretation and examination of the explainability methods is missing from the majority of the related studies, although particular explainability methods have been employed.

3. Materials and Methods

3.1. Deep Learning with Mobile Networks

The main advantage of CNNs lies in extracting new features from the input data distributions (i.e., images), thereby bypassing the manual feature extraction process, which is traditionally performed in image analysis task with machine learning methods [17].
Each convolution layer in a CNN is processing the output of the previous layer by applying new filters and extracting new features. Due to the fact that the convolutional layers are hierarchically ordered, features directly from the original image are only extracted by the first convolutional layer, whereas the other layers process the outputs of each other [18]. In this way, a slow introduction to large amounts of filters is achieved, whilst underlying features may be revealed during the later layers. The general rule of thumb relates the effectiveness of the network with the number of convolutional layers. This is why deep networks are generally superior, provided that adequate amounts of image data are present. In cases where the dataset’s size is not large enough to feed a deep network, three solutions are commonly proposed:
(a)
The selection of a simpler CNN, which contains less trainable parameters and fits in the particular data well.
(b)
Transfer learning [19], utilizing deep and complex CNNs, but freezing their layers, thereby decreasing the trainable parameters and allowing for knowledge transfer, following their training on large image datasets.
(c)
Data augmentation methods to increase the training set size, such as geometric transformation (rotation, sheer) and pixel-level transformations (equalizations, grey-level alterations) [20].
In this study, MobileNet (v2) [21] was selected for the classification task, which is a state-of-the-art CNN and has been recently employed and evaluated by the authors [9]. In that particular study, MobileNet (v2) was found to be superior for false negative reduction in COVID-19 detection, in comparison with a variety of famous CNNs, including Inception (v3) [22] and Xception [23].
The superiority of MobileNet (v2) in reducing the false negatives for the detection of COVID-19, compared to other famous CNNs, is demonstrated in [5,9]. Moreover, this CNN introduces a smaller number of parameters compared to other CNNs, which makes it appropriate for swift training and portable applications. The inventors of this network made use of depth-wise separable convolution [22] to drastically reduce the number of learnable parameters in CNNs, thereby reducing the computational cost.
MobileNet (v2) is employed and trained from scratch, letting it fit in the training set completely and without making any adjustments to its structure. Every parameter is made trainable. In essence, the obtained weights from its training on ImageNet challenge dataset [24] are erased. This methodology is selected to allow for problem-specific feature extraction. At the top of the network, wherein the final feature maps are produced, a global average pooling [25] layer is applied to reduce overfitting. This layer connects the final feature map directly to the dense layer at the top of the CNN, which consists of 2500 nodes. Another dense layer of two outputs is inserted for the binary classification of the inputs. Batch normalization and dropout layers aid in the reduction of overfitting and are part of the densely connected layers at the top of the network.

3.2. Image Dataset

3.2.1. COVID-19, Common Bacterial and Viral Pneumonia X-ray Scans

X-ray images corresponding to confirmed cases infected by the virus SARS-CoV-2 were selected. Through extensive research, a collection of 1281 well-visualized, confirmed pathological X-ray images was created. The final collection included X-rays from a publicly available repository [26]. Contributing institutions of this repository include the Indian Institute of Science, the PES University, the M. S. Ramaiah Institute of Technology, and Concordia University. The publishers of this data did not include important clinical information, which could be useful for a more robust analysis.

3.2.2. Pulmonary Diseases Detected from X-ray Scans

The National Institutes of Health (NIH) X-ray repository was accessed and analyzed. It comprises 112.120 frontal-view X-ray images of 30.805 unique patients with the text-mined 14 disease image labels [27].
Those images were extracted from the clinical PACS database at the National Institutes of Health Clinical Center in USA. The contents of this archive contained 14 common thoracic pathologies, namely, atelectasis, consolidation, infiltration, pneumothorax, edema, emphysema, fibrosis, effusion, pneumonia, pleural thickening, cardiomegaly, nodule, mass, and hernia. This dataset is significantly more representative of the real patient population distributions and realistic clinical diagnosis challenges than any previous chest X-ray datasets. The medical reports were analyzed by an automatic text-mining model that assigned the corresponding labels according to its text-mining procedure. This method has been initially adopted by the creators of the dataset and is not part of this work.
The final dataset characteristics are summarized in Table 1. In Figure 1, selected samples from major classes are presented.
For the normal class in the abnormality detection dataset, we added some more images to make the classes approximately even in terms of number of images included. All image sizes were adjusted to 400 × 400 pixels (height, width). The resolution of the images varied from 72 to 150 pixels/inch, and the bit depth if the image was 8 bits.

3.3. Data Augmentation Techniques

Data augmentation is an important method in deep learning applications and research, mainly utilized for two reasons. The first reason is the data scarcity, which impedes deep learning models adoption to the domain of interest. Few images are usually not enough for a deep learning framework to train on [28], especially in cases where the classification should be based on deep features and not obvious and low-level characteristics (e.g., colors). With data augmentation, the initial training set can be broadly expanded by applying a variety of transformations on the original images. In this way, the model learns to ignore irrelevant characteristics and improves its spatial capabilities [29]. For example, applying random rotations directs the model towards seeking for patterns in moving positions.
In the present research, the following augmentations to the training sets to expand the available data and to increase the generalization capabilities of the experimental deep learning network were applied:
  • Random rotations;
  • Horizontal flips;
  • Height and width shifts.
The reader should note that data augmentation was performed on-line. During each 10-fold repetition, the augmented images were supplied to the classification model, whilst the test sets remained untouched. In this way, each training image was augmented to produce contextual images by performing the abovementioned augmentations.
Random rotations were restricted to −20 to 20 degrees, and height and width shifts were restricted to ±20 pixels. The ±20 degree of rotation was empirically selected to avoid excessive rotations, whilst letting the model develop robustness to spatial discrepancies between the image findings, for example, the position of the lungs.

3.4. Experiments

The initial dataset included 14 classes. On the basis of this dataset, subsets were created according to Figure 2 and Table 2. The intention of the experimental phases and the methods utilized are summarized in Table 2.
For all the experiments, the parameters of the model were retained. The batch size was 16 and the number of epochs varied from 30 to 40 according to the validation loss. All experiments were performed in a Python programming language environment making use of the Tensorflow library. An Intel Core i5-9400F CPU at 2.90 GHz computer equipped with 64 Gb RAM and a GeForce RTX 2060 Super was the main infrastructure for the experiments. In Figure 2, an overview of the study is presented.

4. Results

4.1. Results of Multiclass Classification

For the multiclass classification, MobileNet (v2) achieved sub-optimal performance, as presented in Table 3. The model achieved good classification for the bacterial pneumonia, normal, mass, COVID-19, and consolidation classes (confusion matrix is available in the Supplementary Material). Especially for COVID-19, 1095 true positives were recorded (out of 1281), corresponding to 85.48% accuracy. Moreover, only 12 false negatives were reported. This observation indicates that, despite the overall sub-optimal performance, the model correctly captured COVID-19 image characteristics that distinguish these images from the rest. Moreover, the normal class was adequately predicted, with 2439 true normal predictions and 36 predictions that were mistakenly identified as normal.
Figure 3 illustrates the results of the multiclass classification and selected samples from the outputs of the Grad-CAM algorithm. The red areas of the image suggest the region where the model has captured significant features. Blue areas are considered neutral regions, where no features, or insignificant features, are found. The reader can observe that COVID-19 features were mainly discovered in the center of the respiratory system and that those regions indeed contained COVID-19 findings. Moreover, Figure 3 illustrates misclassified instances. For COVID-19, it was observed that the misclassified image did not contain any information in the center of the respiratory system, perhaps leading the model to falsely recognize specific patterns. In fact, it was observed that the model looked for patterns in the upper right of the image, which was a completely irrelevant region. This issue highlights the flaws of the model and its decision mechanism.
Taking into consideration both the good classification accuracy in distinguishing the COVID-19 class from the other classes and the Grad-CAM visualizations, it can be assumed that in the majority of COVID-19 X-rays, potential biomarkers are discovered. However, this assumption requires further investigation.

4.2. Results of Abnormality Detection (Two-Class)

Abnormality detection tests produce excellent results. As observed in Table 3, 95.45% accuracy was achieved. The total number of false negatives was 211, as the confusion matrix of Figure 4 suggests. It is clearly concluded that the model achieved great capability in distinguishing normal from abnormal X-ray scans. In Figure 4, it is observed that the Grad-CAM results confirmed the assumption that the model seeks for patterns in the correct regions of the respiratory system.
Due to the fact that all types of infections were grouped together in one class (abnormal), the model learned global features explaining the presence of any disease and did not learn the visual differences that each disease may display in the image. However, there are still images were the Grad-CAM exposed some limitations and flaws of the model. In essence, there were images where the model was unable to locate the region of interest correctly, despite the correct classification.

4.3. Results of Abnormality Discrimination

The abnormality discrimination experiment produced poor performance due to the presence of many respiratory diseases, many of which produce overlapping X-ray results. Specifically, 62.26% accuracy was achieved. In the Supplementary Material, the confusion matrix is provided. It is observed that MobileNet (v2) achieved good classification results for COVID-19 (1110 true positives, 171 false negatives, 168 false positives), mass (2427 true positives, 78 false negatives, 14 false positives), and bacterial pneumonia (1108 true positives, 25 false negatives, 14 false positives). For the rest of the diseases, the discrimination task performed sub-optimally. As is observed in Figure 5, the validation accuracy did not improve, despite the improvement in the training accuracy. The same phenomenon applied to the validation loss. Those results highlighted the inability of the model to capture and learn discriminant features. Data augmentation has not been beneficial enough to improve its discrimination ability for the majority of the diseases. However, due to the fact that the aim of this study was focused on COVID-19, the reason behind the sub-optimal performance for multi-class classification was not further investigated in terms of the type of the extracted features. Moreover, the imbalance of the dataset hindered thorough and extensive evaluation. Several classes were underrepresented. As a result, a deep analysis on the extracted features of those classes would yield negligible outcomes.

4.4. Results of COVID-19 Detection

For the COVID-19 detection experiment, top performance was observed, with the classification accuracy reaching 89.88%. Specifically, as the confusion matrix of Figure 6 suggests, 1154 COVID-19 X-ray images were correctly identified out of 1281. The total number of false negatives was 127, whilst the total number of false positives was 170. The Grad-CAM output suggested that the model looked for COVID-19 related features, focusing on the upper respiratory system. For the non-COVID-19 class, the model based its predictions on the collection of different features found in various regions of the image.
A significant observation is that in every experiment, COVID-19 images were correctly classified, either as part of a multiclass dataset or as the major class in a two-class dataset. There is significant evidence that this stability derives from unique image features discovered by the model in those processes. The results of the upcoming reproducibility test favor this assumption.

4.5. Results of Feature Reproducibility in COVID-19 Detection

The two-class classification routine has been repeated for 25 times, and the reported accuracy is assessed for statistical significance. A one-sample t-test was performed, assuming that there is no difference in the mean accuracy score between the 25 runs (i.e., setting the second variable equal to the first obtained accuracy). Table 4 presents the accuracy of each run. As can be observed from Table 5, the p-value was greater than 0.05. Hence, there is no evidence that the mean accuracy obtained from the 25 runs deviated from the expected values. To summarize, the t-test results suggest that the model is stable in reproducing the particular results in terms of accuracy.
It was observed that there was no significant variation of the accuracy over the 25 runs. As a result, the comparison between the Grad-CAM visualization outputs of the 25 runs was performed using the outputs of three runs. We performed a case-to-case examination of the similarity of the produced Grad-CAM images to inspect whether the suggested areas of interest remained consistent across the three independent trainings. The evaluation was conducted by two of the authors (J.A. and N.P.) by visually inspecting the suggested areas in terms of their relative position inside the image. The methodology of this experiment is better understood in Figure 7. Figure 8 illustrates the Grad-CAM outputs obtained by three independent trainings of MobileNet (v2). All parameters, hyper-parameters, and image sets were retained during the three separate trainings.
In approximately 98% of the visualized Grad-CAM maps, the features were reproduced and the suggested areas remained the same. It was noted that there was a disagreement between the three independent training–testing results for 2% of the images. The reader should note that Figure 8 illustrates only true positive (true COVID-19) images, aiming to investigate whether the features were reproduced for the specific examples and not for the incorrectly classified instances.
It was observed that a few discovered features are not always reproducible (2%). Figure 8 provides regions of specific images where the discovered features in the first training were not re-discovered during the second or third training. The classification accuracy remained top-level (approximately 90%) for each repetition. This is a conflicting situation. The reasons behind this phenomenon can vary:
(a)
Some of the COVID-19 images may contain annotations that are recognized by the model as features. Although the data were tested, the non-official nature of the dataset source led us to not be completely sure about the origin of the images and the pre-processing that may have taken place.
(b)
The learning capacity of MobileNet (v2) is not enough to capture all significant features, leading to the exclusion of some of them.
(c)
Data augmentation fails to improve the model’s capability in capturing global and important features completely, thereby allowing for irrelevant feature discovery.

5. Discussion

Deep Learning enabled the extraction of a massive amount of low- and high-level features from medical images. Those features may represent important biomarkers, closely related to the corresponding diseases. However, deep learning methods lack the ability to specifically assess these features. The extracted features are not well-defined and usually refer to combinations of findings inside the image. This issue derives from the millions of complex mathematical procedures incorporated into deep models. Tracking the extracted features is not an easy task. The above issue raises concern about the trustfulness of such models for medical image classification tasks. For the recent COVID-19 disease, deep learning has been proven to be helpful in early detection, utilizing only X-ray scans. Little has been yet investigated as to why all deep learning models yield top results in a variety of scientific papers.
This study was focused on revealing evidence supporting the assumption that COVID-19 imprints specific pattern-stamps on the X-rays, which testify to its existence. The results provide strong evidence that MobileNet (v2) can capture those underlying signatures and reveal them. However, in many occasions, the MobileNet (v2) model was unable to locate the proper regions of interest, even if the classification was correct. In essence, the decision outcome was not verified on a correct basis. It is fair to assume that the model was deceived, and the associated features were irrelevant. This behavior raises many questions and mandates future research. Nevertheless, the majority of samples demonstrated a correct model reasoning and require further attention.
The experiments were based on the recently introduced Grad-CAM algorithm, which kept track of the learned weights in a way similar to backpropagation of a trained model. The experimental tests have been repeated three times to investigate the reproducibility of those regions, which contained the suggested features. It was found that in 98% of the samples, the suggested areas remained consistent. Moreover, the model insists on suggesting specific regions of the image that helped in distinguishing COVID-19 from both normal X-rays and X-rays corresponding to other respiratory and lung diseases. With the aid of those experiments, it is fair to assume that, out of the millions of extracted image features, there are potential features of medical importance.
Besides the demonstrated effectiveness of MobileNet (v2), this network is also suitable for mobile applications due to its inherently low computational requirements [21]. In the present work, it took approximately 70 min for a complete 40-epoch training of MobileNet (v2) using a dataset of 11,984 images (of size 400 × 400) and whilst performing online data augmentation. The reader shall recall that the experiments were performed using an ordinary computer. The trained model can process a new image input and provide both classification and Grad-CAM generation in less than one second. The latter boosts the significance of our work because limited computational costs and low model complexity are highly desirable in modern medical technology solutions, which can operate in real time.
This study has a number of limitations. Firstly, due to COVID-19 data scarcity, every publicly available image dataset related to COVID-19 is incomplete it terms of clinical data, verification, specific annotations, demographic details, and more. Those issues hinder the development of models that will approach the problem holistically. For example, Tartaglione et al. [30] highlight that either missing or imbalanced demographic information can result in biased models. Moreover, real-life evaluation is mandatory to verify the validity of the results, due to the above issue. Secondly, the experts’ opinion regarding each sample of the image involved in this study was also missing from the image datasets. Hence, it is not possible to compare the model’s decisions with that of the medical experts. This is an important limitation of the study, and we intend to suggest solutions in future research. Thirdly, this study used only the Grad-CAM algorithm for visualizing the suggested areas of interest. Although Grad-CAM is extensively used in related works, its performance can sometimes be sub-optimal [31]. Future studies can consider employing more explainability tools, such as saliency maps visualization [31] and the LIME [14] and the Shapley Additive explanations (SHAP) methods [32]. Moreover, the reader shall recall that the model underperformed in abnormality discrimination, failing to provide acceptable classification metrics for a number of pulmonary defects and diseases. Although this study is focused on COVID-19 detection rather than abnormality discrimination, the inability of the model to discriminate other pulmonary diseases is a limitation that cannot be overlooked.
During the experiments, it has also been revealed that a more accurate diagnosis of COVID-19 involves a two-stage approach (Figure 9). During the first stage, the input X-ray is analyzed for pathological findings, with 95.45% certainty. If the image is abnormal, the second stage takes place. The X-ray is further analyzed for COVID-19 detection, with 89.89% certainty. If the corresponding X-ray is not identified as COVID-19 class, an optional third stage may take place, where the image is analyzed for other abnormalities. The latter stage was not further explored in the particular research study.
The scope of the study is not to present a framework that exhibits classification metrics superior to the related works but to investigate the extracted image features as to their validity and importance. Nevertheless, the classification accuracy of the presented framework competes with the recent literature (Table 6). The reader shall recall that this work utilizes a large collection of X-ray images that belong to many classes. This poses additional challenges to the classification model.

6. Conclusions

For the present study, a collection of 11,984 images corresponding to 12 different respiratory–lung abnormalities, including COVID-19 and normal X-ray scans, was utilized. Five independent experiments were performed. In the first experiment, the 14-class dataset is used to evaluate MobileNet (v2) in distinguishing between the complete dataset classes. MobileNet (v2) was found to be superior to other relative state-of-the-art CNNs in previous studies conducted by the authoring team [4,8]. In the second experiment, two-class (normal vs. abnormal) classification was performed. In the third experiment, a 13-class dataset was utilized to distinguish between abnormal classes. In the fourth experiment, two-class (COVID-19 vs. non-COVID-19) classification was performed. Finally, the last experiment was repeated three times in order to investigate the reproducibility of the extracted features and to assess the explainability of the model. Grad-CAM visualizations and accuracy metrics yielded strong evidence that COVID-19 image features can be detected with the deep learning approach, specifically with MobileNet v2. Moreover, it was demonstrated that MobileNet (v2) is an effective CNN for automatic COVID-19 detection, which could even be embedded in portable diagnostic systems due to its inherent low computational cost and its ability to process a new image in less than a second, at least in this particular study. Finally, a staged classification approach is suggested for diagnosing COVID-19, which exhibits an accuracy of 89.89%.

Supplementary Materials

The following supporting information can be downloaded at https://0-www-mdpi-com.brum.beds.ac.uk/article/10.3390/reports5020020/s1, Figure S1: Confusion Matrix for the Multiclass dataset; Figure S2: Confusion Matrix for the Abnormality discrimination dataset; Table S1: MobileNet (v2) parameters and hyper-parameters.

Author Contributions

Conceptualization, D.J.A. and N.D.P.; methodology, D.J.A.; software, D.J.A.; validation, D.J.A., N.D.P. and I.D.A.; writing—original draft preparation, I.D.A.; writing—review and editing, D.J.A., N.D.P. and I.D.A.; supervision, I.D.A. All authors have read and agreed to the published version of the manuscript.

Funding

This research received no external funding.

Institutional Review Board Statement

Not applicable.

Informed Consent Statement

Not applicable.

Data Availability Statement

All relative datasets are publicly available.

Conflicts of Interest

The authors declare no conflict of interest.

References

  1. Sahiner, B.; Pezeshk, A.; Hadjiiski, L.M.; Wang, X.; Drukker, K.; Cha, K.H.; Summers, R.M.; Giger, M.L. Deep learning in medical imaging and radiation therapy. Med. Phys. 2019, 46, e1–e36. [Google Scholar] [CrossRef] [PubMed] [Green Version]
  2. Sedik, A.; Iliyasu, A.M.; El-Rahiem, A.; Abdel Samea, M.E.; Abdel-Raheem, A.; Hammad, M.; Peng, J.; El-Samie, A.; Fathi, E.; El-Latif, A.A.A.; et al. Deploying machine and deep learning models for efficient data-augmented detection of COVID-19 infections. Viruses 2020, 12, 769. [Google Scholar] [CrossRef] [PubMed]
  3. Kovács, A.; Palásti, P.; Veréb, D.; Bozsik, B.; Palkó, A.; Kincses, Z.T. The Sensitivity and Specificity of Chest CT in the Diagnosis of COVID-19. Eur. Radiol. 2021, 31, 2819–2824. [Google Scholar] [CrossRef] [PubMed]
  4. Brunese, L.; Mercaldo, F.; Reginelli, A.; Santone, A. Explainable deep learning for pulmonary disease and coronavirus COVID-19 detection from X-rays. Comput. Methods Progr. Biomed. 2020, 196, 105608. [Google Scholar] [CrossRef]
  5. Apostolopoulos, I.D.; Mpesiana, T.A. COVID-19: Automatic Detection from X-Ray Images Utilizing Transfer Learning with Convolutional Neural Networks. Phys. Eng. Sci. Med. 2020, 43, 635–640. [Google Scholar] [CrossRef] [Green Version]
  6. Das, N.N.; Kumar, N.; Kaur, M.; Kumar, V.; Singh, D. Automated deep transfer learning-based approach for detection of COVID-19 infection in chest X-rays. IRBM 2020, 43, 114–119. [Google Scholar]
  7. Gozes, O.; Frid-Adar, M.; Greenspan, H.; Browning, P.D.; Zhang, H.; Ji, W.; Bernheim, A.; Siegel, E. Rapid ai development cycle for the coronavirus (COVID-19) pandemic: Initial results for automated detection & patient monitoring using deep learning ct image analysis. arXiv 2020, arXiv:2003.05037. [Google Scholar]
  8. Afshar, P.; Heidarian, S.; Naderkhani, F.; Oikonomou, A.; Plataniotis, K.N.; Mohammadi, A. Covid-caps: A capsule network-based framework for identification of COVID-19 cases from X-ray images. arXiv 2020, arXiv:2004.02696. [Google Scholar] [CrossRef]
  9. Apostolopoulos, I.D.; Aznaouridis, S.I.; Tzani, M.A. Extracting Possibly Representative COVID-19 Biomarkers from X-ray Images with Deep Learning Approach and Image Data Related to Pulmonary Diseases. J. Med. Biol. Eng. 2020, 40, 462–469. [Google Scholar] [CrossRef]
  10. Ozturk, T.; Talo, M.; Yildirim, E.A.; Baloglu, U.B.; Yildirim, O.; Acharya, U.R. Automated detection of COVID-19 cases using deep neural networks with X-ray images. Comput. Biol. Med. 2020, 121, 103792. [Google Scholar] [CrossRef]
  11. Selvaraju, R.R.; Cogswell, M.; Das, A.; Vedantam, R.; Parikh, D.; Batra, D. Grad-CAM: Visual Explanations from Deep Networks via Gradient-Based Localization. Int. J. Comput. Vis. 2020, 128, 336–359. [Google Scholar] [CrossRef] [Green Version]
  12. Hou, J.; Gao, T. Explainable DCNN Based Chest X-ray Image Analysis and Classification for COVID-19 Pneumonia Detection. Sci. Rep. 2021, 11, 16071. [Google Scholar] [CrossRef] [PubMed]
  13. Ahsan, M.M.; Nazim, R.; Siddique, Z.; Huebner, P. Detection of COVID-19 Patients from CT Scan and Chest X-ray Data Using Modified MobileNetV2 and LIME. Healthcare 2021, 9, 1099. [Google Scholar] [CrossRef] [PubMed]
  14. Palatnik de Sousa, I.; Maria Bernardes Rebuzzi Vellasco, M.; Costa da Silva, E. Local Interpretable Model-Agnostic Explanations for Classification of Lymph Node Metastases. Sensors 2019, 19, 2969. [Google Scholar] [CrossRef] [Green Version]
  15. Wang, L.; Lin, Z.Q.; Wong, A. COVID-Net: A Tailored Deep Convolutional Neural Network Design for Detection of COVID-19 Cases from Chest X-ray Images. Sci. Rep. 2020, 10, 19549. [Google Scholar] [CrossRef] [PubMed]
  16. Lin, Z.Q.; Shafiee, M.J.; Bochkarev, S.; Jules, M.S.; Wang, X.Y.; Wong, A. Do Explanations Reflect Decisions? A Machine-Centric Strategy to Quantify the Performance of Explainability Algorithms. arXiv 2019, arXiv:1910.07387. [Google Scholar]
  17. van Ginneken, B. Fifty years of computer analysis in chest imaging: Rule-based, machine learning, deep learning. Radiol. Phys. Technol. 2017, 10, 23–32. [Google Scholar] [CrossRef] [PubMed] [Green Version]
  18. LeCun, Y.; Bengio, Y.; Hinton, G. Deep Learning. Nature 2015, 521, 436–444. [Google Scholar] [CrossRef]
  19. Huh, M.; Agrawal, P.; Efros, A.A. What makes ImageNet good for transfer learning? arXiv 2016, arXiv:1608.08614. [Google Scholar]
  20. Chlap, P.; Min, H.; Vandenberg, N.; Dowling, J.; Holloway, L.; Haworth, A. A Review of Medical Image Data Augmentation Techniques for Deep Learning Applications. J. Med. Imaging Radiat. Oncol. 2021, 65, 545–563. [Google Scholar] [CrossRef]
  21. Howard, A.G.; Zhu, M.; Chen, B.; Kalenichenko, D.; Wang, W.; Weyand, T.; Andreetto, M.; Adam, H. MobileNets: Efficient Convolutional Neural Networks for Mobile Vision Applications. arXiv 2017, arXiv:1704.04861. [Google Scholar]
  22. Szegedy, C.; Ioffe, S.; Vanhoucke, V.; Alemi, A.A. Inception-v4, inception-resnet and the impact of residual connections on learning. In Proceedings of the Thirty-First AAAI Conference on Artificial Intelligence, San Francisco, CA, USA, 4–9 February 2017. [Google Scholar]
  23. Chollet, F. Xception: Deep learning with depthwise separable convolutions. In Proceedings of the IEEE Conference on Computer Vision and Pattern Recognition, Honolulu, HI, USA, 21–26 July 2017; pp. 1251–1258. [Google Scholar]
  24. Deng, J.; Dong, W.; Socher, R.; Li, L.-J.; Li, K.; Fei-Fei, L. Imagenet: A large-scale hierarchical image database. In Proceedings of the 2009 IEEE Conference on Computer Vision and Pattern Recognition, Miami, FL, USA; 2009; pp. 248–255. [Google Scholar]
  25. Lin, M.; Chen, Q.; Yan, S. Network in Network. arXiv 2013, arXiv:1312.4400. [Google Scholar]
  26. Sait, U. Curated Dataset for COVID-19 Posterior-Anterior Chest Radiography Images (X-rays); Mendeley Data: London, UK, 2020. [Google Scholar]
  27. Wang, X.; Peng, Y.; Lu, L.; Lu, Z.; Bagheri, M.; Summers, R.M. Chestx-ray8: Hospital-scale chest x-ray database and benchmarks on weakly-supervised classification and localization of common thorax diseases. In Proceedings of the IEEE Conference on Computer Vision and Pattern Recognition, Honolulu, HI, USA, 21–26 July 2017; pp. 2097–2106. [Google Scholar]
  28. Wang, J.; Perez, L. The effectiveness of data augmentation in image classification using deep learning. arXiv 2017, arXiv:1712.04621. [Google Scholar]
  29. Shorten, C.; Khoshgoftaar, T.M. A survey on image data augmentation for deep learning. J. Big Data 2019, 6, 60. [Google Scholar] [CrossRef]
  30. Tartaglione, E.; Barbano, C.A.; Berzovini, C.; Calandri, M.; Grangetto, M. Unveiling COVID-19 from CHEST X-ray with Deep Learning: A Hurdles Race with Small Data. Int. J. Environ. Res. Public Health 2020, 17, 6933. [Google Scholar] [CrossRef]
  31. Adebayo, J.; Gilmer, J.; Muelly, M.; Goodfellow, I.; Hardt, M.; Kim, B. Sanity Checks for Saliency Maps. Adv. Neural Inf. Process. Syst. 2018, 31, 9505–9515. [Google Scholar]
  32. Binder, A.; Montavon, G.; Lapuschkin, S.; Müller, K.-R.; Samek, W. Layer-Wise Relevance Propagation for Neural Networks with Local Renormalization Layers. In Proceedings of the International Conference on Artificial Neural Networks, Barcelona, Spain, 6–9 September 2016; Springer: Cham, Switzerland, 2016; pp. 63–71. [Google Scholar]
Figure 1. Samples of some classes belonging to abnormalities.
Reports 05 00020 g001
Figure 2. Overview of the experiments of this study.
Reports 05 00020 g002
Figure 3. Visualized results for the multiclass classification. Train-validation accuracy and loss over the training epochs and AUC scores for the classes are presented in the top graph. Selected output images of the Grad-CAM implementation are visualized. Each dashed-line box presents a true class, while the green and red boxes distinguish between correctly classified samples and mistakes, respectively.
Reports 05 00020 g003
Figure 4. Visualized results for the abnormality detection. Train-validation accuracy and loss over the training epochs and AUC scores for the classes are presented in the top graph. Selected output images of the Grad-CAM implementation are visualized. Each dashed-line box presents a true class, while the green and red boxes distinguish between correctly classified samples and mistakes, respectively.
Reports 05 00020 g004
Figure 5. Visualized results for the abnormality discrimination. Train-validation accuracy and loss over the training epochs and AUC scores for the classes are presented in the top graph. Selected output images of the Grad-CAM implementation are visualized. Each dashed-line box presents a true class, while the green and red boxes distinguish between correctly classified samples and mistakes, respectively.
Reports 05 00020 g005
Figure 6. Visualized results for COVID-19 detection. Train-validation accuracy and loss over the training epochs and AUC scores for the classes are presented in the top graph. Selected output images of the Grad-CAM implementation are visualized. Each dashed-line box presents a true class, while the green and red boxes distinguish between correctly classified samples and mistakes, respectively.
Reports 05 00020 g006
Figure 7. Reproducibility of test methodology.
Reports 05 00020 g007
Figure 8. Results of the reproducibility tests. Each dashed-line box presents Grad-CAM results for 10 images of COVID-19 infection. The visualized maps correspond to the same images for each group. The green tick mark suggests feature reproducibility and the red arrow suggests failure to reproduce specific features, leading to misclassification.
Reports 05 00020 g008
Figure 9. Suggestion for more accurate classification based on the results of the study.
Reports 05 00020 g009
Table 1. Characteristics of the dataset.
Dataset NameClassesDescriptionTotal Number of Images
Multiclass14Huge dataset including normal, COVID-19, and 12 categories of abnormal X-ray scans.11,984
Abnormality detection2Huge dataset consisting of normal and abnormal X-ray scans. In the abnormal class, X-rays corresponding to COVID-19 were also included.13,320
Abnormality discrimination13Dataset containing 13 classes corresponding to 13 abnormalities, including COVID-19.8714
COVID-19 detection2Dataset containing COVID-19 X-ray scans and a second class of both normal and abnormal X-ray scans (selected samples).2935
Table 2. Overview of the experiments.
Experiment NameAimClasses Utilized
MulticlassEvaluate the effectiveness of MobileNet (v2) in multiclass discrimination13 respiratory infections and the class normal.
Abnormality detectionEvaluate the effectiveness of MobileNet (v2) in abnormality detectionAll respiratory infection classes, including COVID-19, were joined together into a big class. Normal X-ray scans constituted the second class.
Abnormality discriminationEvaluate the effectiveness of MobileNet (v2) in distinguishing between various diseases, including COVID-1913 classes of X-rays corresponding to 13 respiratory infections
COVID-19 detectionEvaluate the effectiveness of MobileNet (v2) in distinguishing between COVID-19 and
non-COVID-19 X-ray scans
Selected samples from the 12 respiratory diseases constituted the first class, whereas the second class referred to COVID-19.
ReproducibilityEvaluate the reproducibility of features when MobileNet is trained distinguishing between COVID-19 and non-COVID-19 X-ray scansSelected samples from the 12 respiratory diseases constituted the first class, whereas the second class referred to COVID-19.
Table 3. Classification results. The mean accuracy for the complete 10-fold and standard deviation for the performance between the 10-fold are also reported.
DatasetAccuracy (%)AUC Score (%)
Multiclass73.11 ± 2.2194.07 ± 1.45
Abnormality detection95.45 ± 1.5498.92 ± 0.83
Abnormality discrimination62.26 ± 4.2190.93 ± 1.57
COVID-19 detection89.88 ± 3.6696.26 ± 2.14
Table 4. Classification results of 25-run 10-fold cross-validation when training and testing MobileNet (v2) using the COVID-19 detection dataset (two classes).
RunMean Accuracy (%)
189.88
291.23
388.54
492.14
589.24
689.36
788.53
888.86
990.76
1088.86
1191.23
1290.37
1392.43
1489.02
1589.67
1688.54
1790.79
1889.36
1987.13
2091.23
2186.98
2288.86
2492.41
2490.66
2591.23
Overall89.89
Std±1.49
Table 5. Statistical significance results of 25-run 10-fold cross-validation when training and testing MobileNet (v2) using the COVID-19 detection dataset (two classes).
FactorResult for Accuracy
Mean89.89
Variance2.24
Observations25
T-statistic0.0413
p-value0.4836
Table 6. Comparison with related studies.
StudyMethodTest Data SizeClassesAccuracy
Hou and Gao [12]Deep CNN4004 (normal, bacterial pneumonia, viral pneumonia, COVID-19)96% (COVID-19 vs. ALL)
Ahsan et al. [13]VGG, MobilNet (v2)5182 (COVID-19, non-COVID-19)95%
Brunese et al. [4]VGG-1611002 (COVID-19, other disease)97%
Apostolopoulos et al. [5]MobileNet (v2)14283 (normal, pneumonia, COVID-19)93%
Apostolopoulos et al. [5]MobileNet (v2)14282 (COVID-19, non-COVID-19)93%
Apostolopoulos et al. [9]MobileNet (v2)39052 (COVID-19, non-COVID-19)99%
Apostolopoulos et al. [9]MobileNet (v2)39057 (COVID-19, normal, 6 abnormal classes)87%
Wang et al. [15]tailored CNN (COVID-Net)3003 (normal, pneumonia, COVID-19)93%
This studyMobileNet (v2)13,3202 (COVID-19, other abnormal X-ray)90%
This studyMobileNet (v2)11,9847 (normal, COVID-19, 5 abnormal classes)73%
Publisher’s Note: MDPI stays neutral with regard to jurisdictional claims in published maps and institutional affiliations.

