
Tea Bag Index to Assess Carbon Decomposition Rate in Cranberry Agroecosystems
by
 , , and
Wilfried Dossou-Yovo
1,2,*, 
Serge-Étienne Parent
1,
Noura Ziadi
2,
Élizabeth Parent
1 and
Léon-Étienne Parent
1 1
Department of Soils and Agri-Food Engineering, Université Laval, Quebec, QC G1V 0A6, Canada
2
Agriculture and Agri-Food Canada, Quebec Research and Development Center, 2560 Hochelaga Boulevard, Quebec, QC G1V 2J3, Canada
*
Author to whom correspondence should be addressed.
Soil Syst. 2021, 5(3), 44; https://0-doi-org.brum.beds.ac.uk/10.3390/soilsystems5030044
Submission received: 1 July 2021
/
Revised: 25 July 2021
/
Accepted: 5 August 2021
/
Published: 11 August 2021
Abstract
:In cranberry production systems, stands are covered by 1–5 cm of sand every 2–5 years to stimulate plant growth, resulting in alternate layers of sand and litter in soil upper layers. However, almost intact twigs and leaves remain in subsurface layers, indicating a slow decomposition rate. The Tea Bag Index (TBI) provides an internationally standardized methodology to compare litter decomposition rates (k) and stabilization (S) among terrestrial ecosystems. However, TBI parameters may be altered by time-dependent changes in the contact between litter and their immediate environment. The aims of this study were to determine the TBI of cranberry agroecosystems and compare it to the TBI of other terrestrial ecosystems. Litters were standardized green tea, standardized rooibos tea, and cranberry residues collected on the plantation floor. Litter decomposition was monitored during two consecutive years. Added N did not affect TBI parameters (k and S) due to possible N leaching and strong acidic soil condition. Decomposition rates (k) averaged (mean ± SD) 9.7 × 10⁻³ day−1 ± 1.6 × 10⁻³ for green tea, 3.3 × 10⁻³ day−1 ± 0.8 × 10⁻⁵ for rooibos tea, and 0.4 × 10⁻³ day−1 ± 0.86 × 10⁻³ for cranberry residues due to large differences in biochemical composition and tissue structure. The TBI decomposition rate (k) was 0.006 day−1 ± 0.002 in the low range among terrestrial ecosystems, and the stabilization factor (S) was 0.28 ± 0.08, indicating high potential for carbon accumulation in cranberry agroecosystems. Decomposition rates of tea litters were reduced by fractal coefficients of 0.6 for green tea and 0.4 for rooibos tea, indicating protection mechanisms building up with time in the tea bags. While the computation of the TBI stabilization factor may be biased because the green tea was not fully decomposed, fractal kinetics could be used as additional index to compare agroecosystems.
1. Introduction
Soil is the largest pool of terrestrial organic carbon (C) in the biosphere, storing more carbon than plants and the atmosphere combined [1]. Increasing soil organic carbon content plays a key role in enhancing soil quality and mitigating greenhouse gases [2,3,4]. Soil carbon storage capacity depends on temperature, rainfall, decomposing organisms, substrate quality [5,6,7,8,9,10], and cultural practices [11,12,13,14,15].
Wisconsin, USA; Quebec, Canada; and Massachusetts, USA, are the world leaders in cranberry production [16]. Most cranberry stands are established on constructed anthropogenic acidic sandy soils [17,18]. Cranberry is a low growing, trailing, broadleaf and leathery, woody, non-deciduous vine [19]. Stolons or runners range from one to two meters long and the uprights originating from stolons are 5–20 cm long. Stolons and uprights form a thick and tough mat covering the whole surface of the field. Nitrogen, applied at rates that may vary in the range of 15 to 60 kg N ha−1, is the nutrient impacting the most vegetative growth, sometimes reaching excessive biomass production [20]. Cranberry beds are covered every two to five years by 1–5 cm of sand to stimulate or maintain crop productivity [19], resulting in alternate thin sublayers of sand and organic matter in the root zone [18,21,22]. Cranberry twigs and leaf residues appear almost intact at depth [21], indicating a slow decomposition rate. Similar to natural depositional processes [23], burying activities can, thus, contribute to soil carbon storage in cranberry agroecosystems.
Biochemical quality of the litter is the main driver of litter decomposition under comparable climate conditions [24,25,26]. The carbon sink from ligneous plants is large per unit of nitrogen deposited [12,27]. The C:N ratio is the most frequent index of decomposability of organic substrates [28]. While nitrogen is added in amounts generally ranging from 30 to 50 kg N ha−1 in cranberry production systems [29,30] to reach tissue nitrogen levels of 0.90–1.10% [31], excessive nitrogen fertilization may lead to vegetative overgrowth [30], possibly impacting litter quality, C:N ratio, decomposition rate, and carbon accumulation. The C:N ratio of fruiting and vegetative uprights varies between 50 and 80 at mid-fruit development depending on N fertilization [32].
Litterbags [33,34,35] and cotton strips [36,37,38,39] have been used to monitor litter decomposition and assess carbon decomposition rates [40,41,42,43]. While cotton strips are less representative of litter biochemical compositions [39,43], bags of native plant litter and standardized substrates allow for comparing litter decomposition rates at regional and global scales [44,45]. The Tea Bag Index (TBI) has been designed to collect litter decomposition data uniformly across ecosystems. The TBI is a standard measure of mass loss of green (Camellia sinensis) and rooibos (Aspalathus linearis) teas after 90 days of incubation in the soil [44]. The green tea, a labile litter, and the rooibos, a more recalcitrant litter, show contrasting decomposition rates. The TBI is determined after 90 days of incubation from decomposition rate (k) by mass loss and a stabilization factor (S) depending on environmental conditions during the conversion of labile to recalcitrant compounds.
Organic matter decomposition is generally assessed by first-order kinetics assuming that the reaction rate is constant through time [46]. However, the reactive surfaces of organic matter may become less accessible to enzymes and soil microorganisms as protection mechanisms build up during decomposition, leading to departure from first-order kinetics, a process known as fractal-like kinetics [2,47,48]. Fractal kinetics has been used to describe the complex kinetic of enzymatic saccharification of cellulose, and the elimination of lignin [49,50]. Fractal kinetics of green and rooibos decomposition may differ among ecosystems, possibly impacting their TBI classification.
We hypothesized that (1) the decomposition rate of cranberry residues is low compared to decompositions rates of green and rooibos teas, (2) the TBI of the cranberry agroecosystems is stable across years, (3) the TBI of the cranberry agroecosystems is low compared to those of other ecosystems whatever the nitrogen fertilization regime, and (4) decomposition rates of tea litters follow fractal-like kinetics. The aim of this study was to assess the carbon decomposition rate in cranberry agroecosystems compared to other terrestrial ecosystems.
2. Materials and Methods
2.1. Study Area
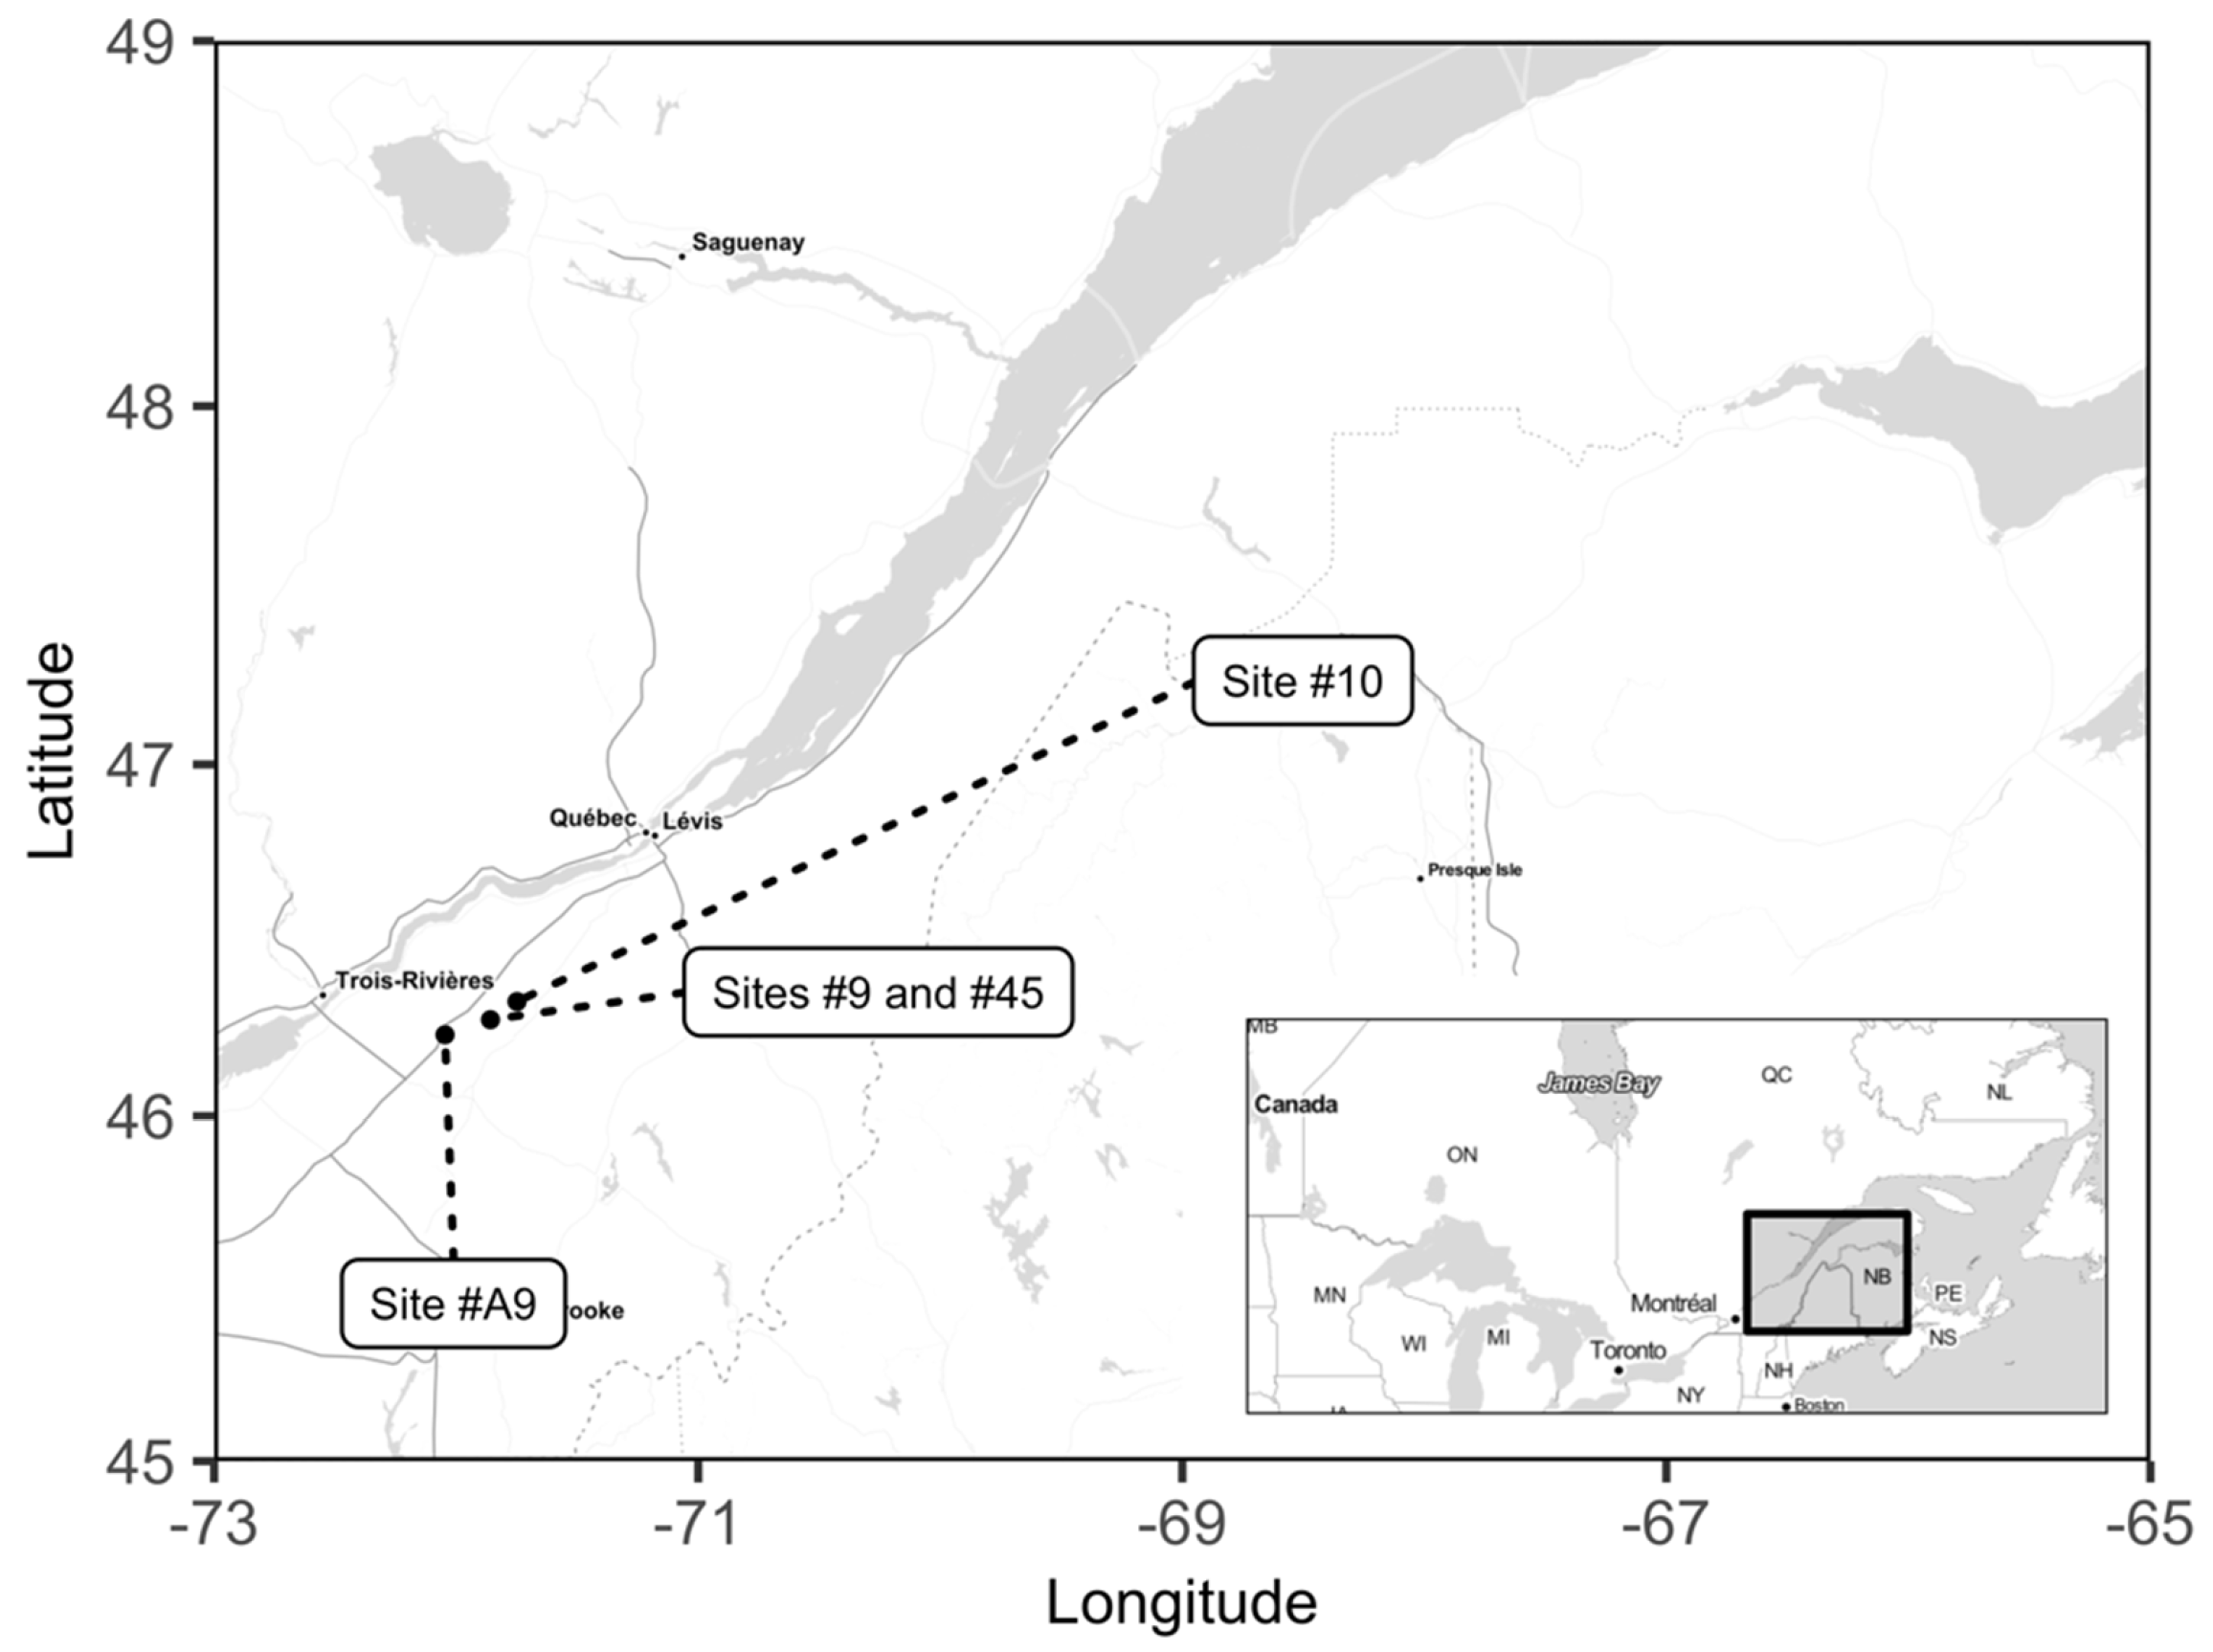
This study was conducted at four sites during growing seasons 2017 and 2018 in Southern Quebec, Canada (Figure 1), providing eight site × year combinations. There were three conventionally managed cranberry sites, site #45 (46°16′34.7′′ N; 71°51′30.0′′ W), site #9 (46°16′39.4′′; 71°52′14.2′′ W), site #10 (46°19′28.7′′ N; 71°44′41.6′′ W), and one organically managed cranberry site, site #A9 (46°14′16.5′′ N; 72°02′13.4′′ W). Sites #9, #45, #A9, and #10 have been planted with the “Stevens” cultivar in 1995, 1999, 2004, and 2007, respectively. At the establishment phase, the soils had been capped by 60–75 cm of fine to coarse sand over the sandy floor after removing the upper layers (Horizons A and B, and part of the C horizon). Soil series on sites #A9, #45, and #9 were Saint-Jude and Sainte-Sophie (Humo-Ferric Podzol in the Canadian System, Haplorthods in the U.S. Soil Taxonomy, Orthic Podzol in the World Reference Base for Soil Resources), and Saint-Samuel (Humic Gleysol in the Canadian System; Humaquepts in the U.S. Soil Taxonomy; Umbric Gleysol in the World Reference Base for Soil Resources) on site #10 [51].
2.2. Soil Analysis
Soils were sampled in the 0–15 cm layer in spring 2017. Samples were air-dried and passed through a 2-mm sieve. Soil pH was measured in 0.01 M CaCl2 (soil to solution ratio of 1:2 v:v). The total carbon, nitrogen, and sulfur were quantified by combustion [54] using the Leco CNS model 630-300-200 (Leco Corporation, Saint-Joseph, MI). Soil texture was measured by sedimentation [55] followed by hand-sieving sand particles. The soil’s nutrient contents were extracted using the Mehlich-3 method [56] and quantified by inductively coupled plasma—optical emission spectrometry (Perkin Elmer, Waltham, MA, USA). Soil properties are presented in Table 1.
2.3. Litter Bags
Green tea (EAN 87 22700 05552 5) and rooibos tea (EAN 87 22700 18843 8) are two commercially available teas type (Lipton, Westervoort, The Netherlands) used to measure TBI (http://www.teatime4science.org/) (accessed on 4 August 2021). For comparison, we also used cranberry residues made of a mixture of vegetative and fruiting uprights collected on the plantation floor and cut to a particle size less than 5 mm. Hence, cranberry litter composition (stems and leaves from vegetative and fruiting uprights) varied between years. Particle-size distribution of the litters (Table 2) was determined by wet sieving [57]. At the onset of the experiments, the C:N ratios (mean ± SD) were 11.1 ± 1.3 and 54.01 ± 9.1 for green tea and rooibos tea, respectively. The C:N ratios for the teas differed slightly from those reported by Keuskamp et al. [44]. The C:N ratio of the cranberry residues was 66.7 ± 5.3 in the experiments, within the range of the C:N ratios reported by [32] for cranberry uprights. Cranberry residues were used for comparison only and were not considered in the computation of the TBI.
Litters were oven-dried at 65 °C for 48, and then ground in a coffee mill to <2 mm for biochemical analysis, using the Ankom200/220 fiber analyzer [58,59]. The biochemical fractions analyzed were the soluble, hemicellulose, cellulose, and lignin+cutin fractions. The holocellulose fraction is the sum of the hemicellulose and cellulose fractions. The hydrolyzable fraction is the sum of the soluble and holocellulose fractions.
In total, 3792 bags were buried at a depth of 8 cm in cranberry beds in 2017 and 2018. The number of bags was much larger than the 110 to 234 bags used for within one-year ecological [60,61] and laboratory [62] experiments due to the bags being damaged during unearthing or not being found in the tough cranberry mat, the high requirement for model testing, and the need to composite samples to run biochemical analyses.
2.4. Experimental Designs
The trials were conducted during two consecutive years to test the constancy of the TBI parameters through time. Because fertilization regimes may vary among cranberry production sites depending on the cultivar and soil conditions and impact the C:N ratio of cranberry residues [32], in the first year, we also tested whether nitrogen regimes established in 2014 could influence the TBI. The nitrogen was applied at rates of 30, 45, and 60 kg N ha−1 within the range for cranberry [32]. Nitrogen sources were ammonium sulfate in the conventional sites or fish emulsions (6-1-1) in the organic site. Nitrogen was applied at four occasions during the season: 15% at early flowering (29 June to 2 July), 35% at 50% flowering (8 to 11 July), 35% at 50% fruit set (16 to 19 July), and 15% at 1 to 2 weeks after the third application. Other nutrients were applied according to local fertilization trials or regional fertilizer recommendations. In the second year, we tested whether litter decomposition rate could be fractal-like because green tea was not fully decomposed, as suggested by Keuskamp et al. [44], and compacted through time, indicating reduced contact between substrates and their immediate environment.
2.4.1. Year 1 Experiment to Test TBI Stability across Fertilization Regimes
Samples of 1.7–1.9 g of litter were introduced into tetrahedral polyethylene tea bags (5 cm × 5 cm; 0.25 mm mesh size) and sealed with an impulse heat sealer. Each bag and litter were weighed and tagged. The setup was a complete random design with three (03) nitrogen fertilization doses replicated four (04) times. There were three (03) litter types (green and rooibos teas and cranberry residues) replicated three (03) times in each plot. There was a total of 108 bags per site, and 432 bags across the four (04) sites. Plot size was 12 m2 (3 m × 4 m). Bags were buried at a depth of 8 cm on 15 June 2017, and collected 90 days later, as prescribed by Keuskamp et al. [44], on 15 September 2017. Cranberry stands form tough terrain. We collected 271 bags because 161 bags were not found in the ground or were torn during unearthing. The tea bags were dried at 65 °C for 48 h. Adhering soil particles were gently removed from the bag surfaces with a brush. Litter was weighed, ground in a coffee mill to <2 mm, and analyzed for total carbon by Dumas combustion (Kowalenko, 2001) to measure carbon loss during the season.
2.4.2. Year 2 Experiment to Validate TBI across Years and Test Fractal Behavior
Bags of tea and cranberry residues were buried from 14 May to 8 October 2018, at the four sites. The design was a combination of four sites, three litter types (green and rooibos teas and cranberry residues) repeated 40 times and collected at 21, 42, 63, 84, 105, 126, and 147 days (3360 bags in total) at each of the four sites. We collected 2613 bags because 747 bags were not found in the ground or were torn upon unearthing. After bag collection, litter samples were dried at 65 °C, and ground in a coffee mill to pass through 2-mm sieve. The ground litter was analyzed for total carbon by Dumas combustion [54]. Bags were composited for each combination of litter type and period to provide enough material to perform biochemical analyses by Fourier-transformed near-infrared spectroscopy (Nicolet Antaris FT-NIR analyzer, Thermo Electron Corp., Ann Arbor, MI, USA) at each site [63].
2.4.3. Reaction Kinetics
Decomposition rates of litter materials (cranberry residues, green and rooibos tea) were estimated from two points (initial and final mass), as follows:
where M0 is the initial litter biomass, Mt is the litter biomass that remained after incubation time t = 90 days, and k is the decomposition rate.
ln(Mt/M0) = −kt
Depending on the nature of the materials being processed and the immediate environment, the reaction rate (k) may decrease through time, as follows [48]:
kt = k1 t−h
Hence,
log(kt) = −h log(t) + log(k1)
The first order kinetic becomes fractal-like, as follows:
where k1 is the reaction rate at time t = 1 and h is the fractal coefficient (0 ≤ h ≤ 1, t ≥ 1) that accounts for the reaction rate decelerating with time.
ln(Mt/M0) = − k1 t 1 − h
2.4.4. TBI
The TBI assumes that the decomposition rate follows an exponential decay from the remaining rooibos biomass after 90 days of incubation. The TBI was computed as follows (Keuskamp et al., 2013):
where Mt is the fraction of the rooibos biomass that remains after incubation time t, ar is the decomposable fraction of the rooibos tea estimated from its hydrolyzable fraction and the stabilization factor assessed for green tea decomposition, k1 is the decomposition rate of the labile fraction, and k2 is the decomposition rate of the recalcitrant fraction, considered to be very low compared to k1, hence neglected,
Mt = ar e−k1 t + (1 − ar) × (e−k2 t)
k1 = ln(ar/Mt − (1 − ar))/t)
The stabilization factor (S) was computed as follows:
where ag and Hg are the decomposable (after 90 days) and the van Soest hydrolyzable fractions of green tea, respectively. The decomposable fraction of rooibos tea (ar) was predicted from the van Soest hydrolyzable fraction of rooibos tea (Hr) and S as follows:
S = 1 − ag/Hg
ar = Hr × (1 − S)
2.4.5. Statistical Analysis
3. Results
3.1. Organic Matter Decomposition
The biochemical fractions of litters are presented in Table 3. Rooibos and green teas contained similar amounts of the hydrolyzable fraction, which was much higher compared to cranberry litter. Green tea decomposed fastest due to the high proportion of soluble materials. Rooibos tea contained the largest proportion of holocellulose and showed intermediate decomposition rates. Cranberry litter showed the highest lignin+cutin content, and the slowest decomposition rate. Decomposition rates for rooibos tea and cranberry litter were, respectively, 0.34 and 0.04 times that of green tea. Mass loss averaged 59% for green tea, 26% for rooibos tea, and 5% for cranberry litter after 90 d of incubation.
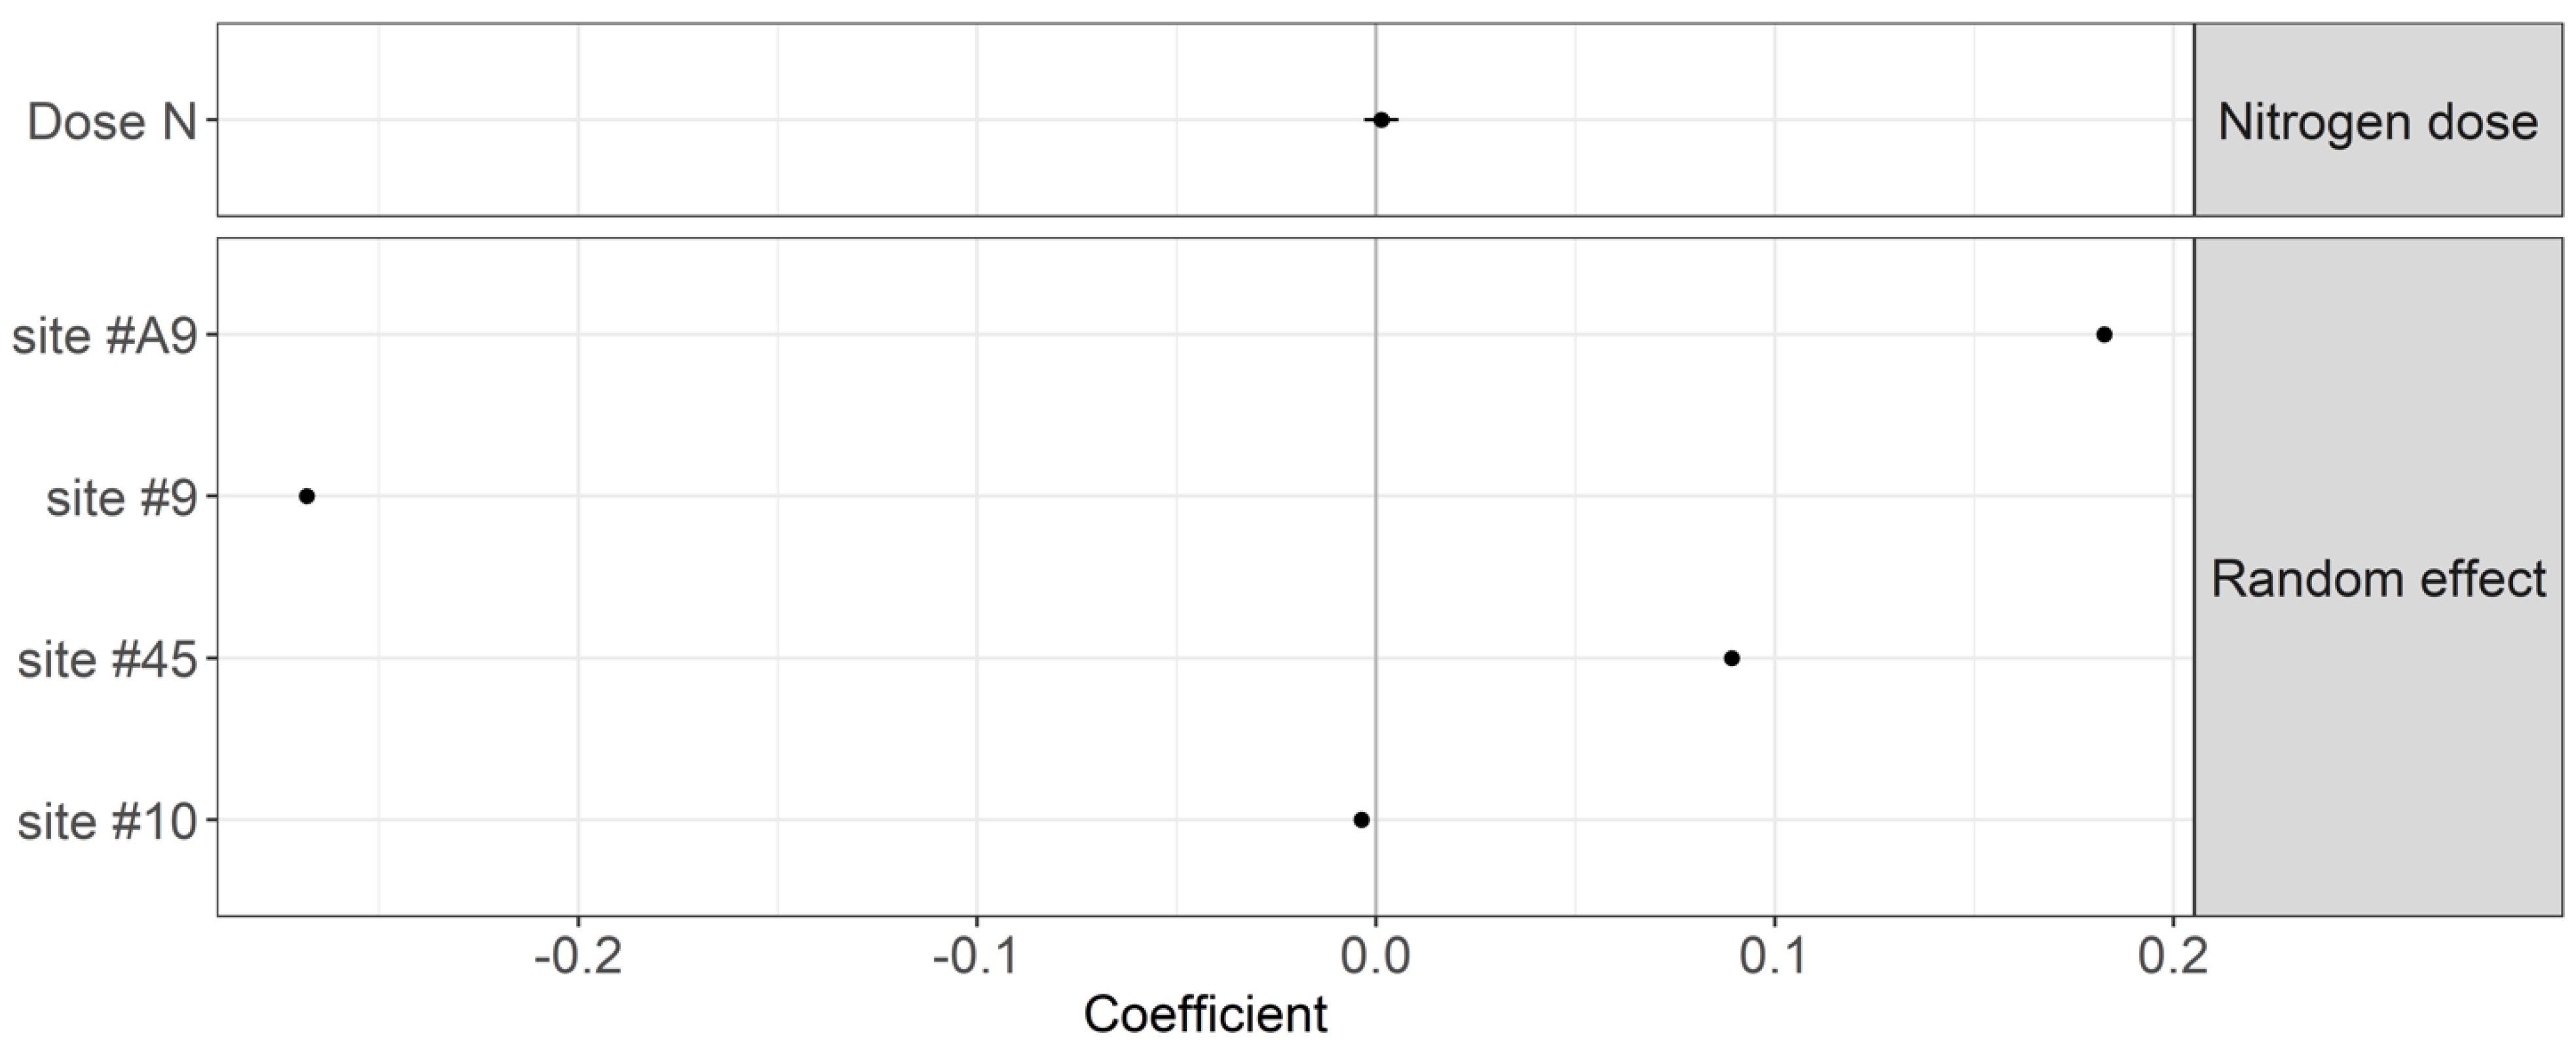
The nitrogen dosage showed negligible effects on the TBI decomposition rates (p-value = 0.149) and stabilization factor (p-value = 0.530) (Figure 3 and Figure 4). Site #10 showed the lowest litter decomposition rate. Site #9 showed the lowest stabilization factor. As a result, differences in the TBI among sites are attributable to local factors other than N fertilization.
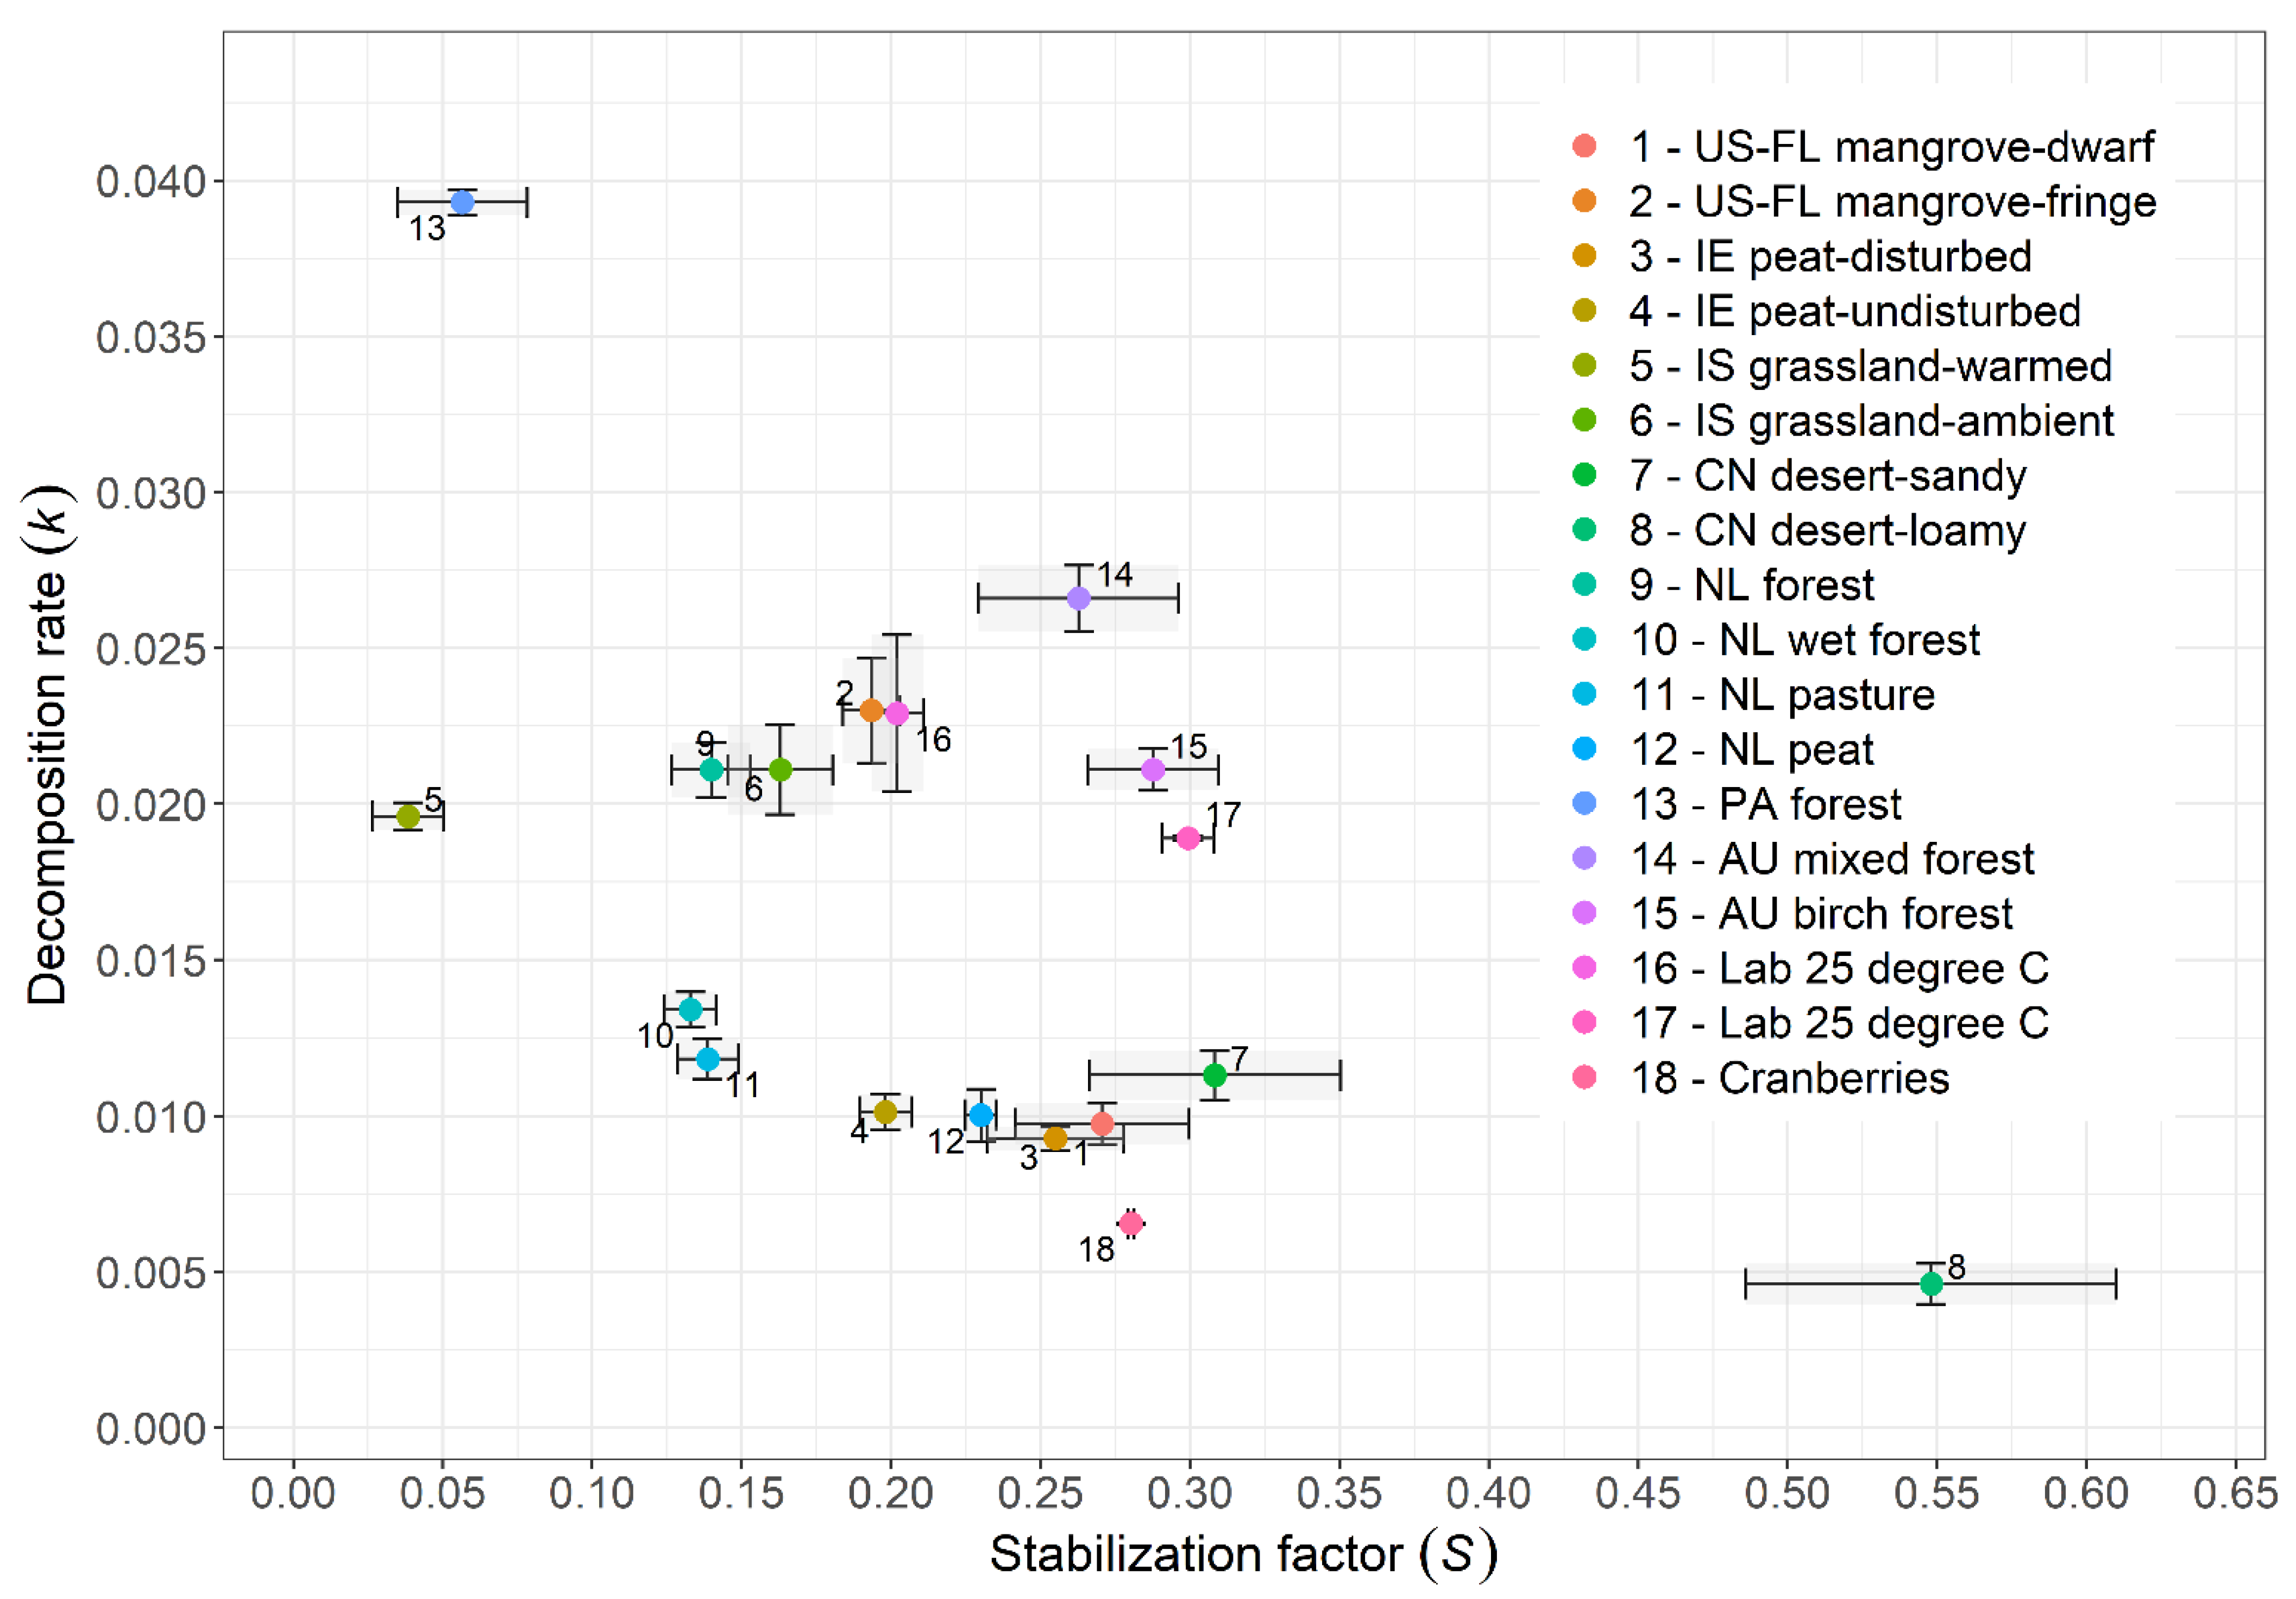
In 2018, two-point decomposition rates between 0 and 90 days of incubation were (mean ± SD) as follows: 10.5 × 10⁻³ day−1 ± 5.5 × 10⁻³ for green tea, 3.9 × 10⁻³ day−1 ± 1.4 × 10⁻³ for rooibos tea, and 0.8 × 10⁻³ day−1 ± 0.9 × 10⁻³ for cranberry residues. The corresponding TBI parameters of the cranberry agroecosystems were high for S (0.287 ± 0.08) and very low for k (0.006 day−1 ± 0.002) compared to those of ecosystems documented by Keuskamp et al. [44] (Figure 5).
3.2. Fractal Kinetics of Litter Decomposition
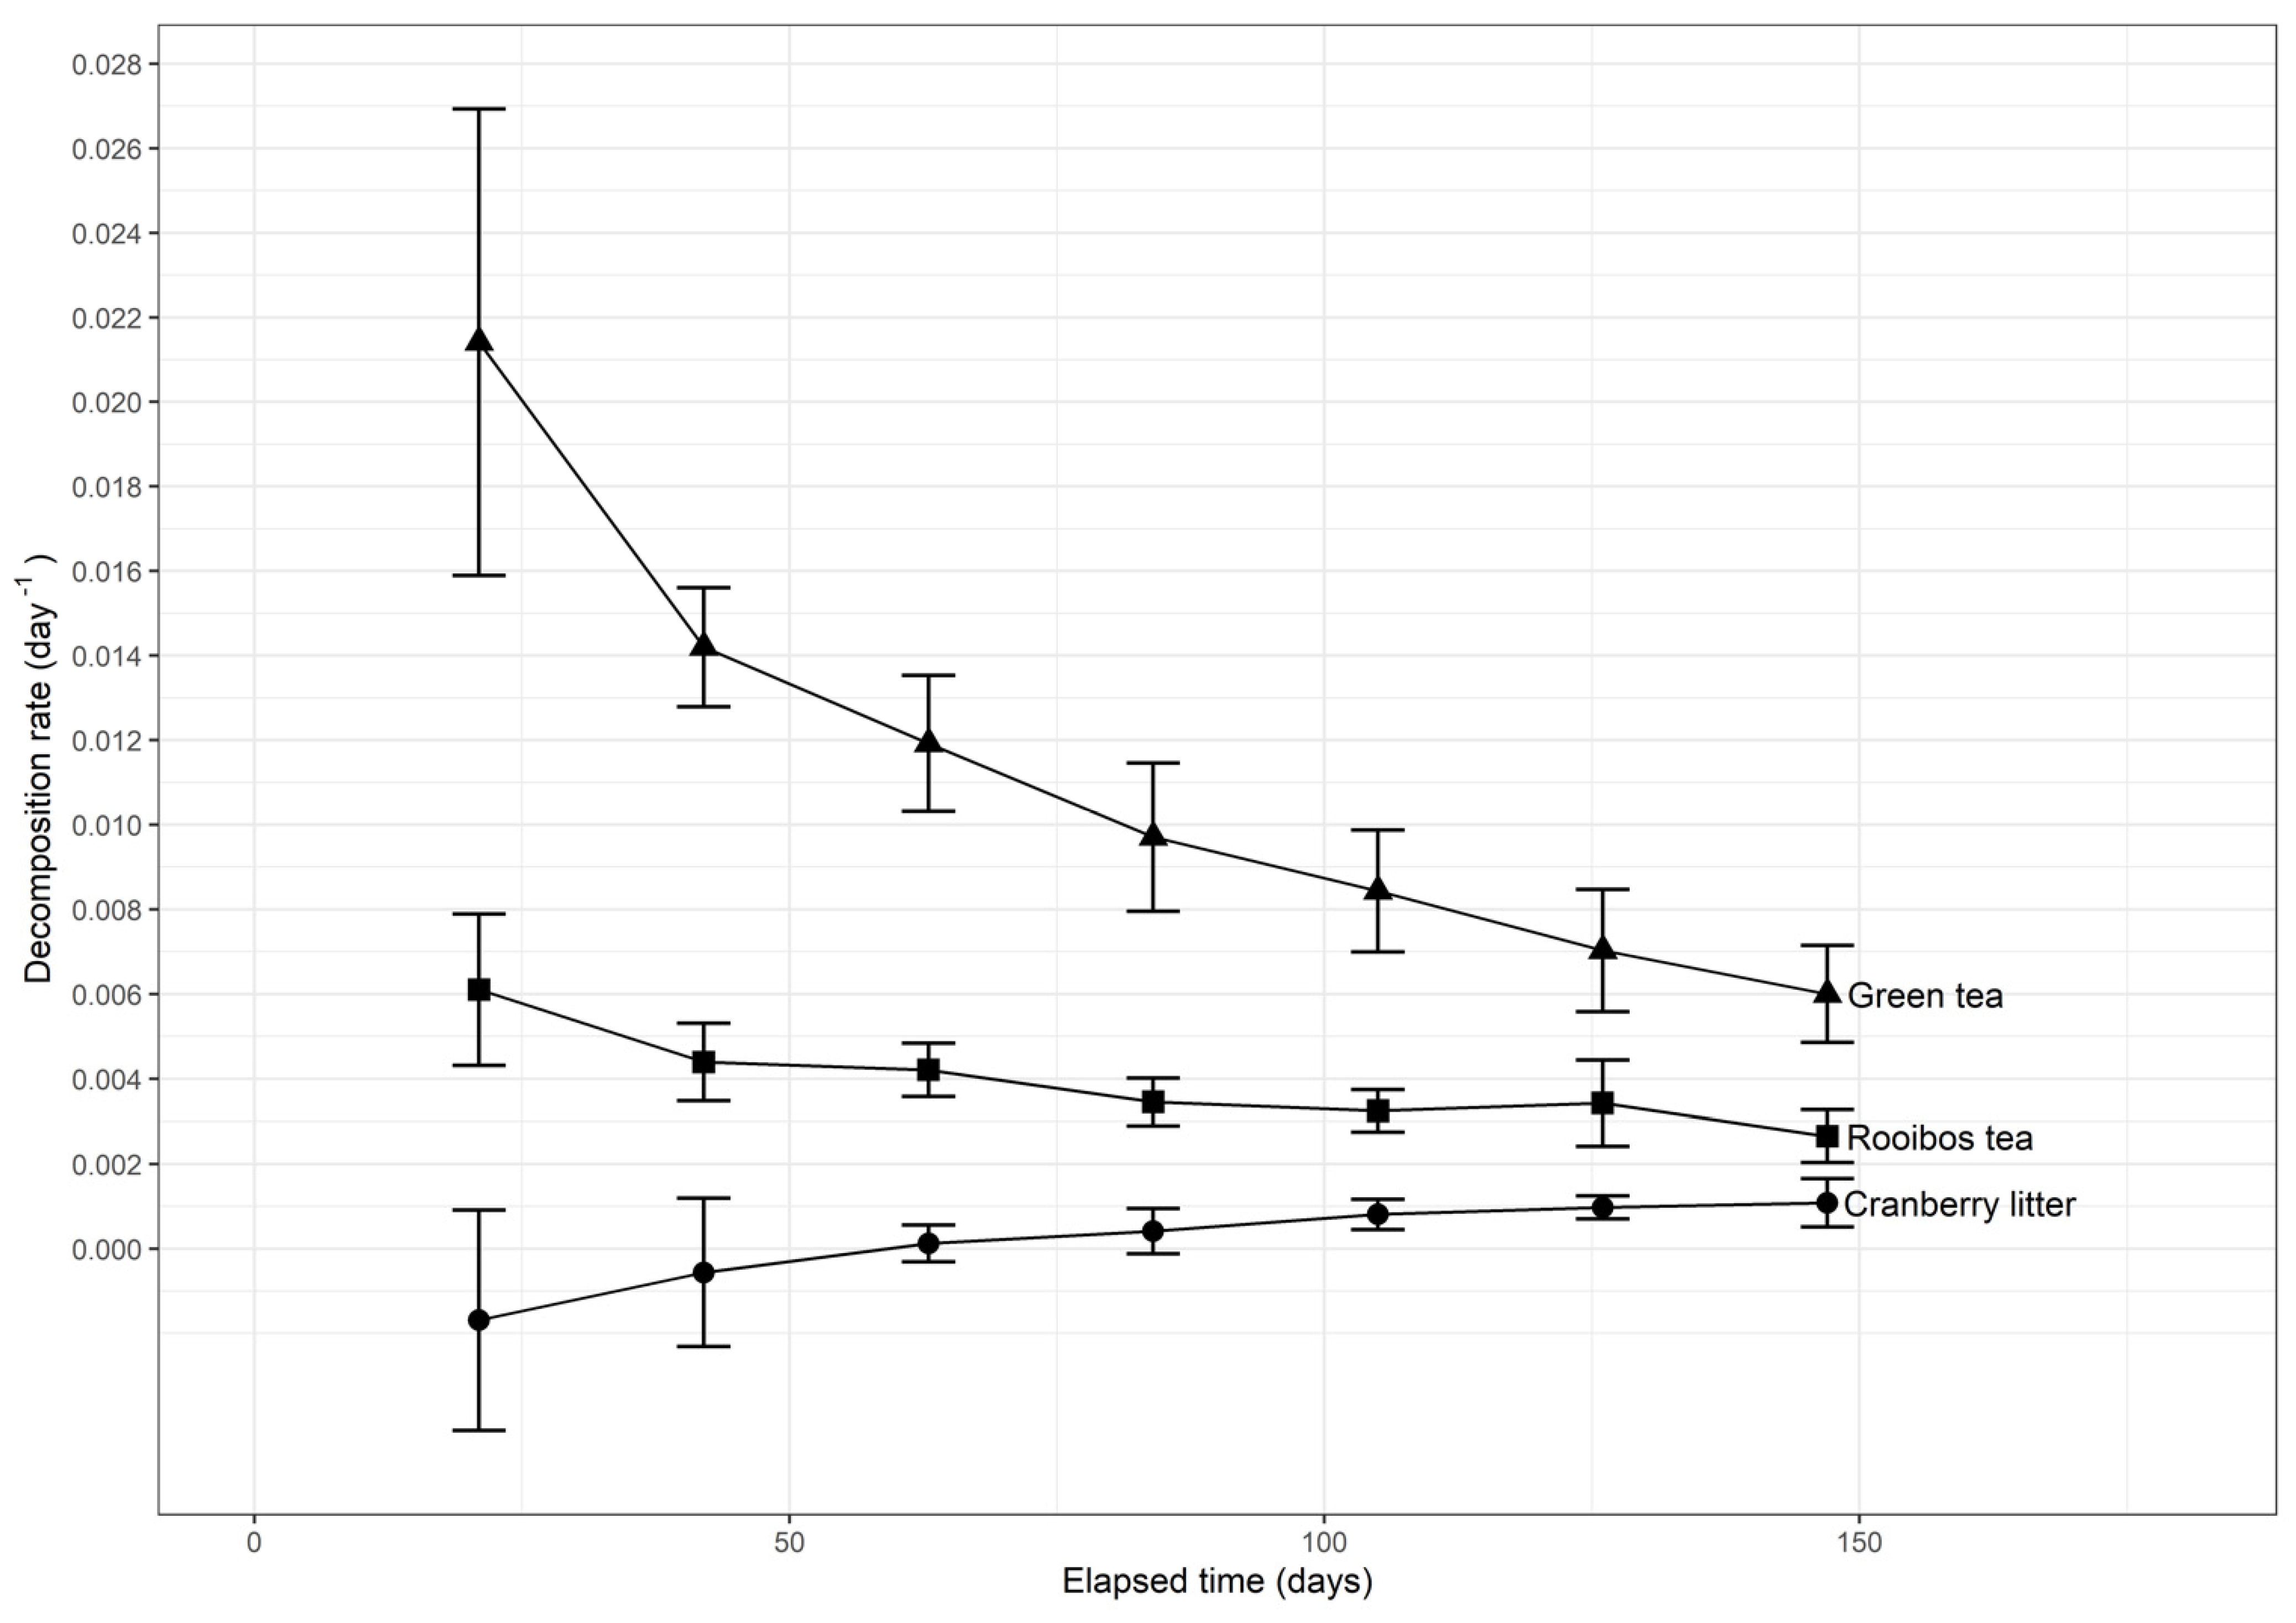
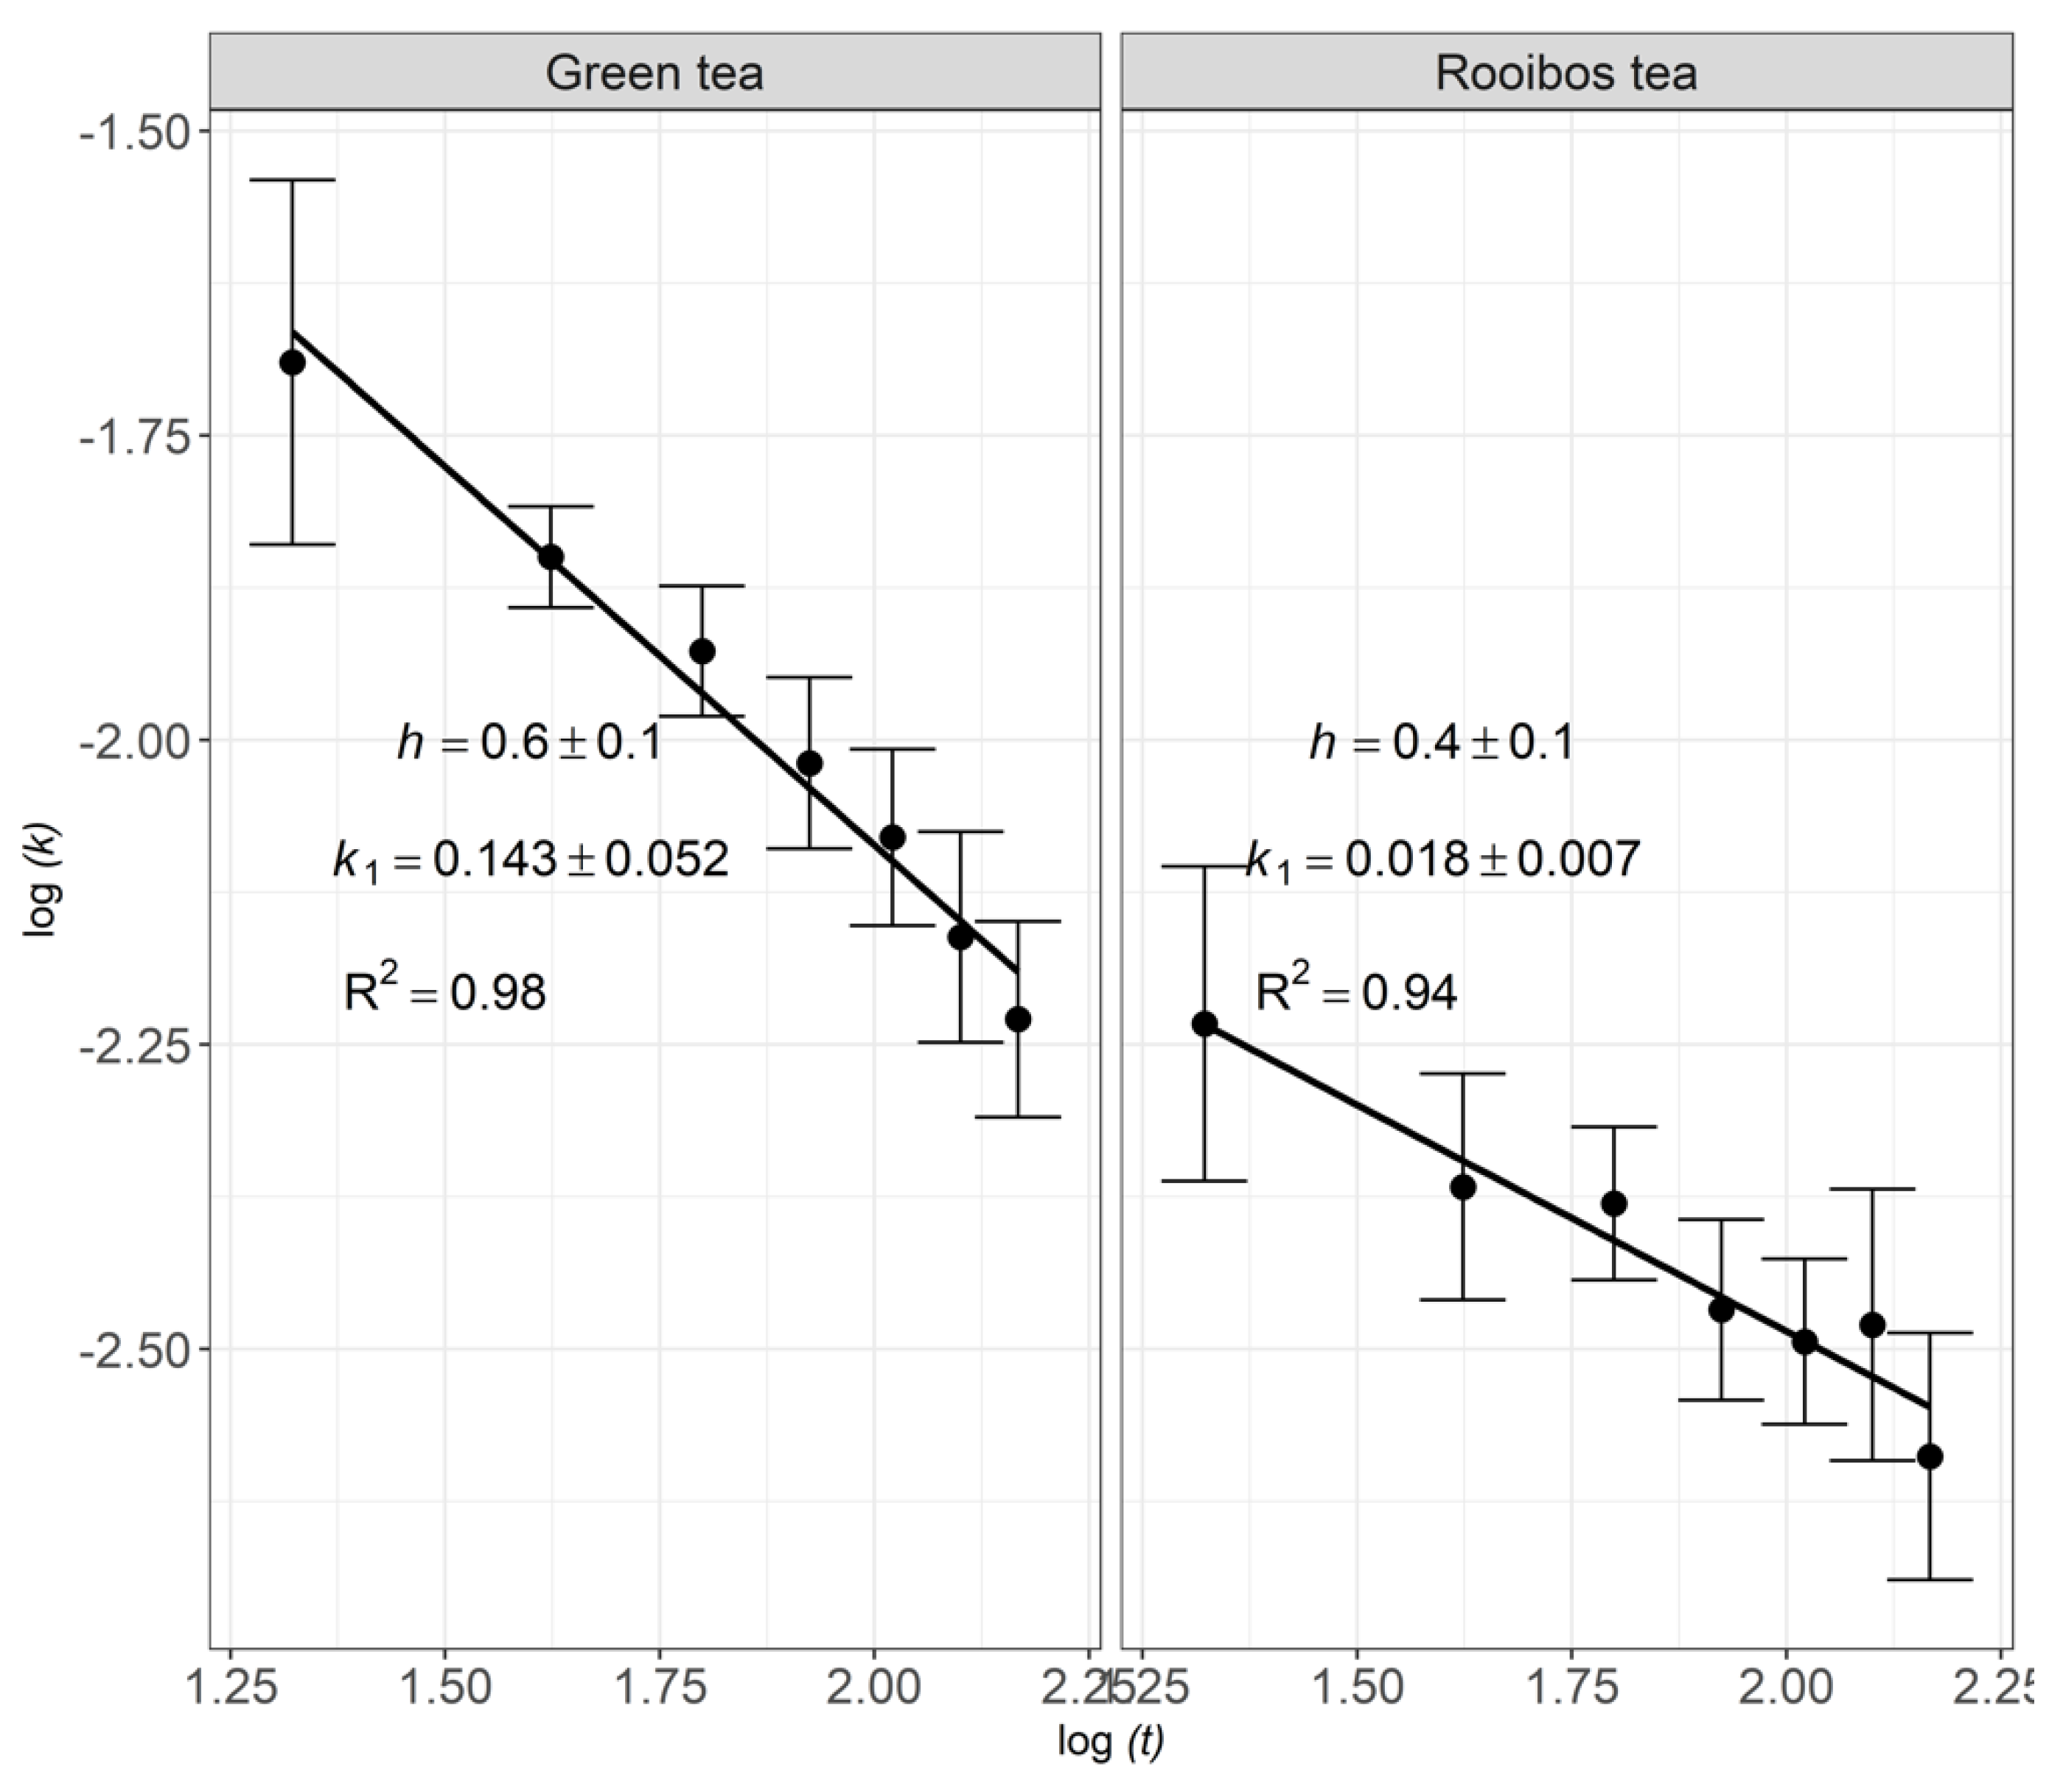
There was a small difference between litter decomposition rates recorded in 2017 (Table 3) and 2018 (Figure 6), indicating a consistent TBI across years. On the other hand, decomposition rates of green and rooibos teas were found to decrease non-linearly with time, indicating fractal-like kinetics (Figure 6). Decomposition rates of green and rooibos teas decelerated by factors of 2.7 and 1.6, respectively, at the end of 147 d of incubation, compared to the initial decomposition rate. The decomposition kinetics of green and rooibos teas were, thus, fractal-like, decreasing non-linearly with time, with fractal coefficients of 0.6 and 0.4, respectively (Figure 7). The decomposition rate of the cranberry litter tended to increase slightly after 63 days of incubation, indicating gradual opening of tissue internal structure by the microflora.
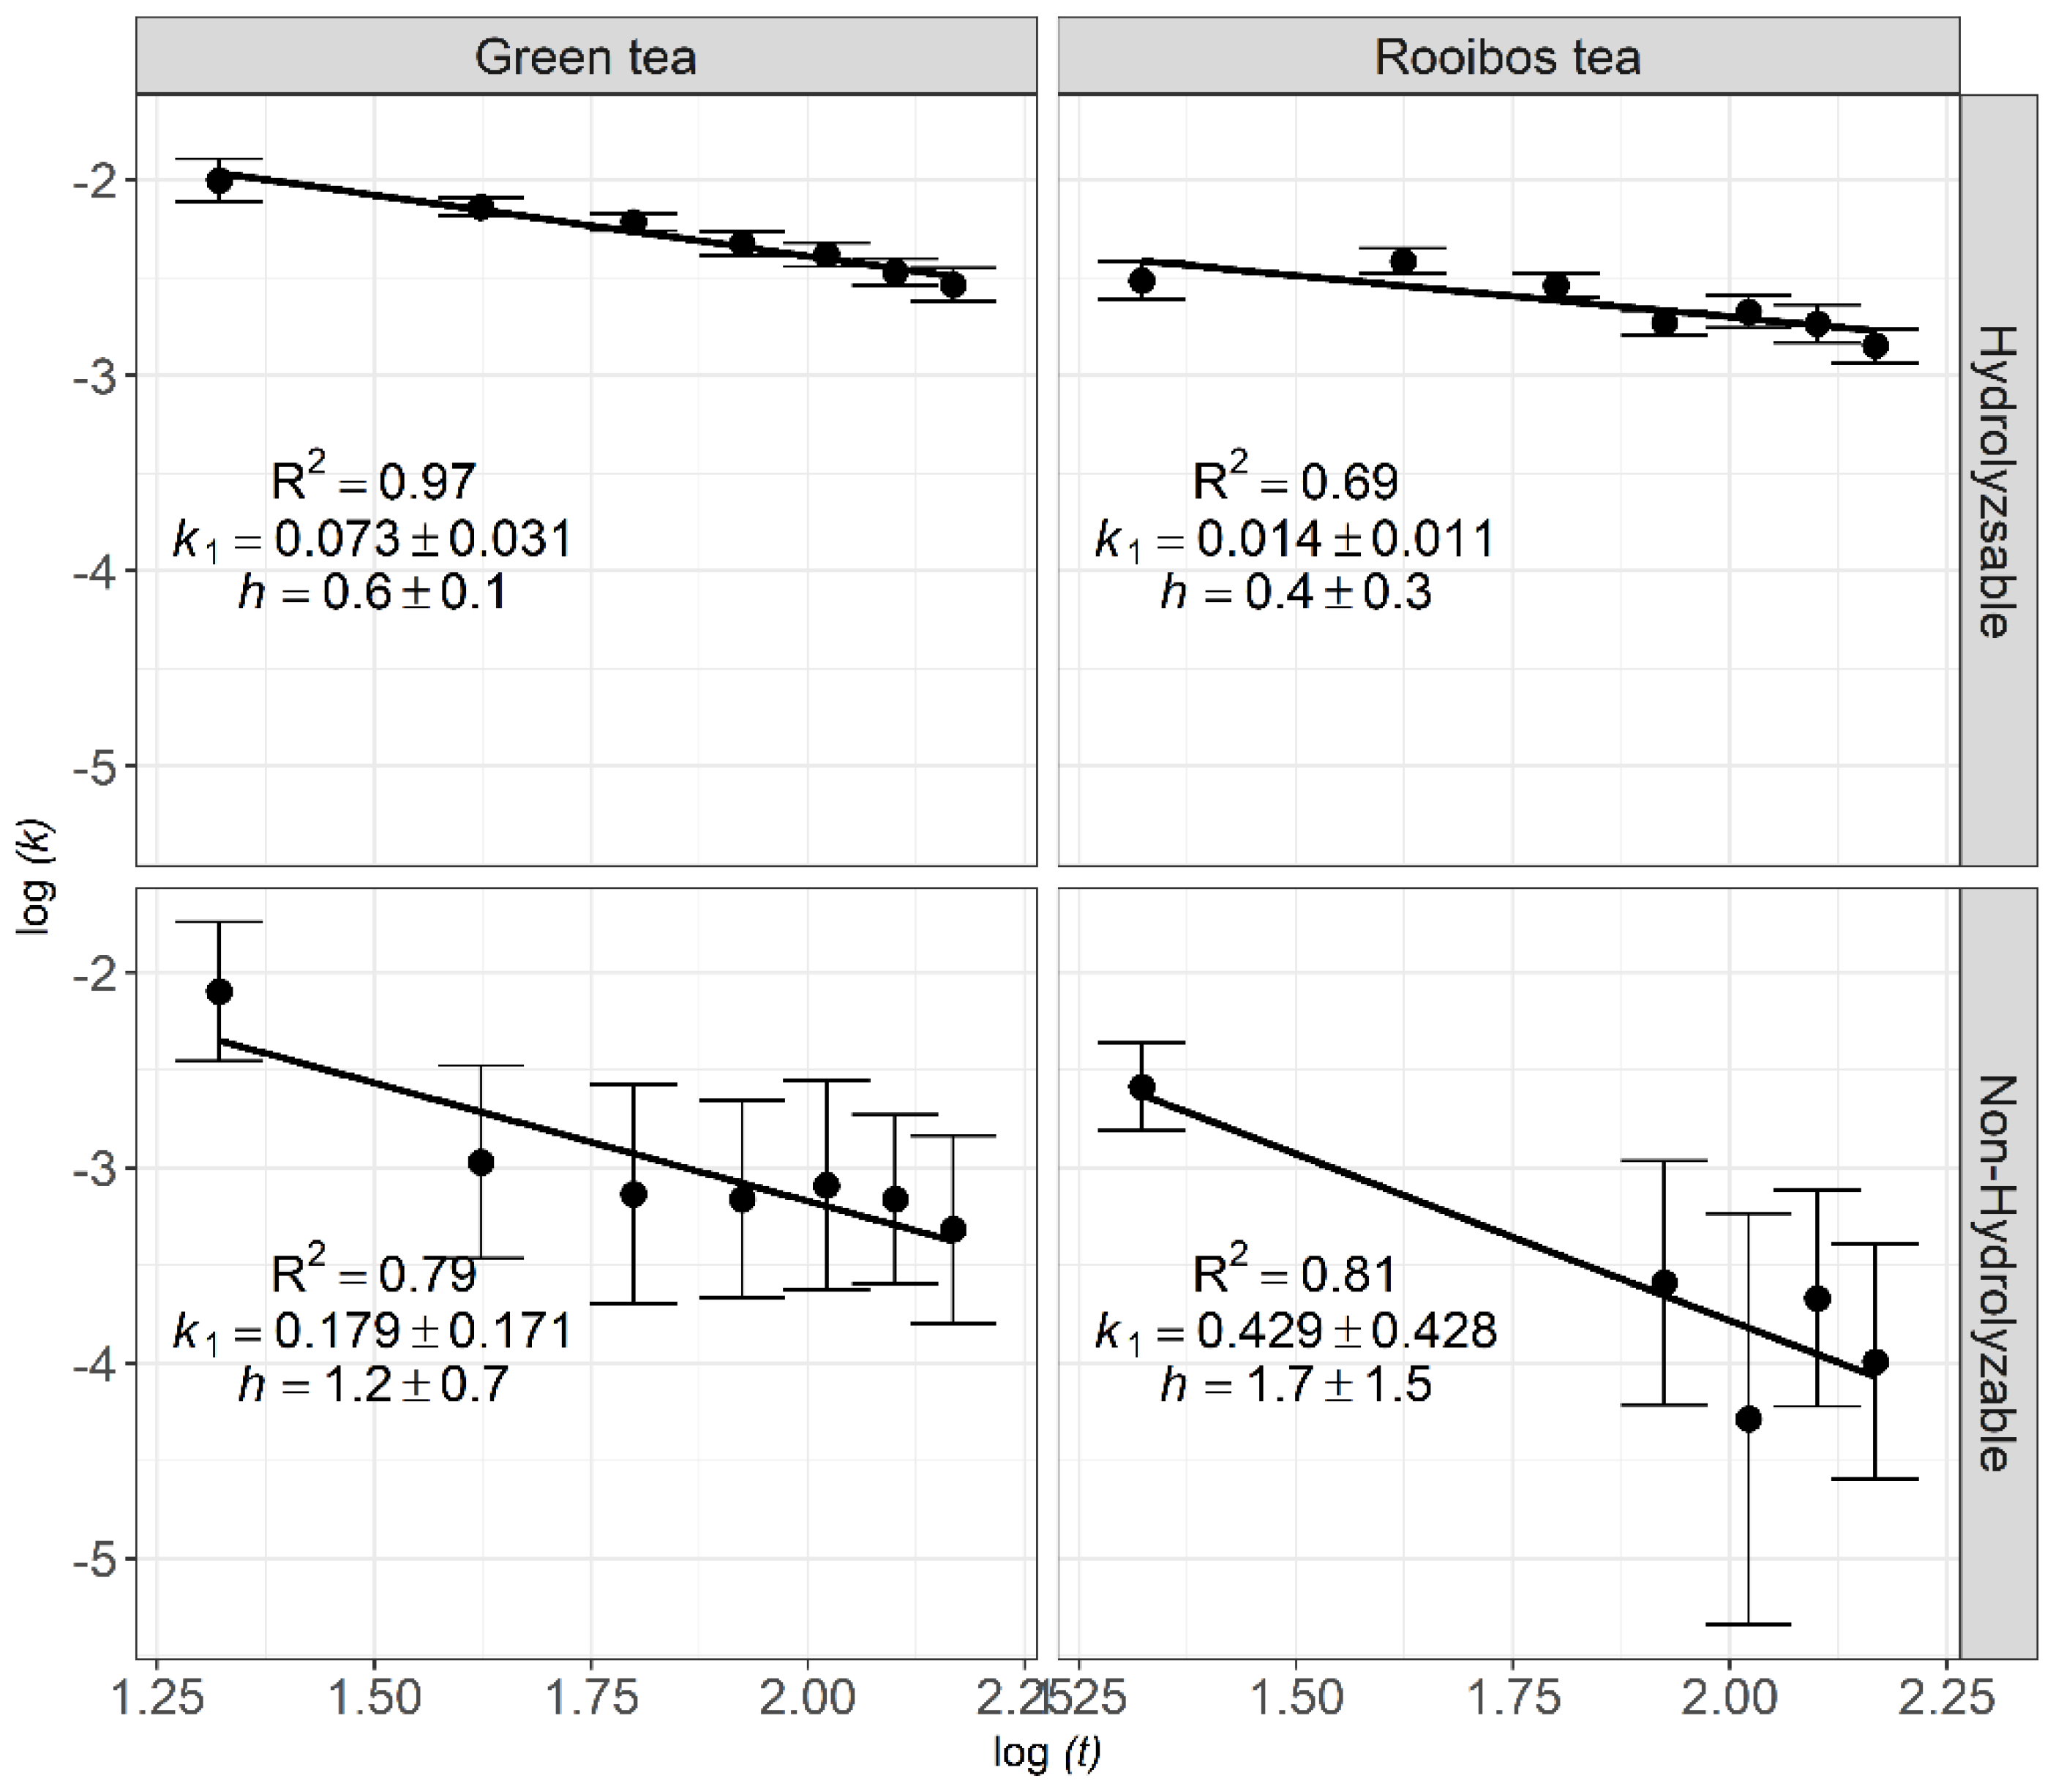
The decomposition patterns (initial decomposition rate k1 and fractal coefficient h) of the hydrolyzable (soluble matter and holocellulose) and non-hydrolyzable (lignin and cutin) fractions are presented in Figure 8. The hydrolyzable fraction of green tea showed higher fractal coefficients (h = 0.6) than that of rooibos tea (h = 0.4), with both different from zero. The fractal coefficient for the non-hydrolyzable fraction of green tea and rooibos tea was h = 1.2 and h = 1.7, respectively, but were not different from one, indicating considerable deceleration through time and great potential for carbon accumulation.
4. Discussion
4.1. Effect of Nitrogen Fertilization Regime on Organic Matter Decomposition
The nitrogen fertilization regime did not affect TBI decomposition rates in line with several studies showing little or no effect of nitrogen additions on the decomposition rate of organic matter in agroecosystems [26,68,69,70]. Increasing the nitrogen dosage may inhibit carbon turnover and decomposition of organic matter under annual cropping [71], especially during the last stage of decomposition [72]. Riggs and Hobbie [73] reported that nitrogen additions decreased the decomposition rate by 31% and microbial respiration by 21% in grassland soils. Laskowski and Berg [74] found an important impact of nitrogen on lignin decay: the higher the nitrogen dosage, the stronger the inhibition of ligninase.
On the other hand, the nitrogen regime impacts the vegetative growth of cranberry plants, possibly leading to overgrowth favorable to carbon accumulation at the expense of berry yield and quality [32,75]. Cranberry sandy soils are acidic and fertilized with acidifying ammonium sulfate in conventional farming systems [76], contributing to restrained microbial activity and carbon decomposition rates [12,70]. Indeed, Min et al. [77] found that ammonium-based fertilizers reduced CO2 fluxes in acid soils (pH = 5.7). Microbial activities are low in strongly acidic [78] and low-nutrient soils [79]. Bacteria are less active in acid soils near pH 6.0, while fungi are more tolerant to low pH, but generally less active at soil pH below 5.0 [76].
4.2. Tea Bag Index
The tested cranberry agroecosystems were in the low range of decomposition rates and in the high range of organic matter stabilization factors among terrestrial ecosystems [42]. Mass loss was 59% for green tea and 26% for rooibos tea after 90 days of incubation compared to 63% and 22%, over one year, respectively, in the slow-C decomposing restored peatland ecosystems studied by Macdonald et al. [60]. Mass loss of cranberry litter was 5% of initial mass over 90 days, which is much less than the 51% averaged over one year by Macdonald et al. [60] across four peatland grass species.
The hydrolyzable fractions of green tea (90.5 ± 2.4%) and rooibos tea (82.9 ± 1.7%) using the van Soest method [58] differed from those reported by Keuskamp et al. [44] (84.2% and 55.2%, respectively), who used the Ryan et al. [80] method (Table 3). Nevertheless, the biochemical composition was still closely related to litter decomposition rates. Cranberry litter contained by far the largest proportion of recalcitrant lignin-cutin materials and decomposed at a rate that was an order of magnitude lower compared to the tea litters (Table 3).
The litter C:N ratio is often thought to control litter decomposition in acid soils of conifer forest ecosystems [81] and other biomes [35]. Despite similar C:N ratios in the first experiment, the carbon decomposition rate of the cranberry litter was much lower compared to that of the rooibos tea due to differential van Soest biochemical compositions and differences in particle size distribution that controlled the contact between the substrate and catalytic agents.
4.3. Fractal Kinetics
Experimental studies on reaction kinetics may provide evidence for anomalous patterns showing time-dependent reaction rates [48]. Fractal coefficients of green and rooibos teas (Figure 7) where within the 0–1 range suggested by Kopelman [48]. We found fractal coefficients ranging from 0.5 to 0.7 for green tea and 0.0 to 0.4 for rooibos tea in results presented by Keuskamp et al. [44] and Duddigan et al. [62]. First-order kinetics also differed markedly between labile and recalcitrant carbon pools as reported elsewhere [82,83,84,85].
Soil and organic matter are fractal objects [86,87] of varying particle size distribution and biochemical composition [85,88]. Carbon accessibility to microbial attacks may change through time due to the initial “priming effect” of labile carbon compounds [89,90,91], and to the buildup of biological, chemical, and physical protection mechanisms developing in the soil through time [10]. While Keuskamp et al. [44] assumed that the stabilization factor was regulated by environmental conditions, fractal coefficients also provided additional evidence that the contact between the litters and their immediate environment regulated the tea decomposition rates. After 90 days incubation time, green tea was still not fully decomposed, possibly leading to biases in the estimation of the stabilization parameter. Fractal kinetics could make an additional parameter to account for the specific environmental conditions in slow-decomposing ecosystems.
Indeed, fractal patterns have allowed accounting for the non-linear decreasing rate of soil organic carbon decomposition through time in agricultural [2] and forest ecosystems [47]. At the time scale of TBI monitoring, the green and rooibos teas behave like fractal objects, limiting access to microbial and enzymatic attacks within a single growing season. The green tea particles tended to agglomerate and pack through time in tea bags. The contact between the organic material and its immediate environment was likely facilitated by non-polar extractable compounds [44], particle enmeshing, and microbial products synthesized during litter decomposition [92].
If fractal-like kinetics occur, then the decomposition rate k1 is maximum at the onset of the incubation where h = 0 (hence, . Indeed, if h → 0, then the reaction rate gets closer to the classical first-order kinetics [48]. If 0 ≤ h ≤ 1, then the reaction rate decreases with time. The decomposition rate decreases non-linearly with time as regulated by the fractal coefficient, which depends on tissue structure, biochemical composition, and protection mechanisms.
The fractal coefficient of the non-hydrolyzable fraction was h ≈ 1, indicating considerable deceleration of the decomposition rate through time for that fraction. Lignocellulose is a complex compact material made of chemically bound cellulose, lignin, and hemicellulose [93]. It is recalcitrant to decomposition, requiring the synergistic action of a broad spectrum of microorganisms and enzymes. For the green and rooibos tea non-hydrolyzable fraction, the fractal coefficients were 1.2 and 1.7, respectively (Figure 8), but did not differ significantly from one (95% compatibility interval). Few studies reported h ≥ 1 [50].
5. Conclusions
The nitrogen fertilization regime did not impact TBI, allowing us to derive TBI values specific to cranberry stands, whatever the nitrogen fertilization regime. The TBI of cranberry agroecosystems was in the low range among terrestrial ecosystems. Cranberry litter decomposed at much lower rate than rooibos tea due to higher content of recalcitrant biochemical fractions, larger particle size, and compact tissue structure. Fractal-like first-order kinetics was found to control the decomposition rate of green and rooibos teas under the environmental conditions of the cranberry production. There is a high potential for carbon accumulation in cranberry agroecosystems following the regular burial of cranberry litter recalcitrant to decomposition and to acidic soil conditions, confirming field observations on litter accumulation between sand layers.
Author Contributions
Conceived and designed the experiment: W.D.-Y., S.-É.P. and L.-É.P.; performed the experiment: W.D.-Y. and É.P.; analyzed the data: W.D.-Y. and S.-É.P.; wrote the first draft of the manuscript: W.D.-Y.; supervisors: S.-É.P. and N.Z.; All authors have read and agreed to the published version of the manuscript.
Funding
This collaborative research project was supported by Les Atocas de l’Érable Inc., Les Atocas Blandford Inc., La Cannebergière Inc., the Natural Sciences and Engineering Research Council of Canada (RDCPJ-469358-14) and Agriculture Agri-food Canada (AAFC-1555).
Institutional Review Board Statement
Not applicable.
Informed Consent Statement
Not applicable.
Data Availability Statement
Research Data Available at https://bit.ly/3fUZySk.
Conflicts of Interest
The authors declare that they have no known competing financial interests or personal relationships that could have appeared to influence the work reported in this paper.
References
- Jobbagy, E.G.; Jackson, R.B. The vertical distribution of soil organic carbon and its relation to climate and vegetation. Ecol. Appl. 2000, 10, 423–436. [Google Scholar] [CrossRef]
- Parent, L.E. Fractal kinetics parameters regulating carbon decomposition rate under contrasting soil management systems. Open J. Soil Sci. 2017, 7, 111–117. [Google Scholar] [CrossRef] [Green Version]
- Lal, R. Soil carbon sequestration impacts on global climate change and food security. Science 2004, 304, 1623–1628. [Google Scholar] [CrossRef] [Green Version]
- Barré, P.; Angers, D.A.; Basile-doelsch, I.; Bispo, A.; Cécillon, L.; Chevallier, T.; Derrien, D.; Eglin, T.K.; Pellerin, S. Ideas and perspectives: Can we use the soil carbon saturation deficit to quantitatively assess the soil carbon storage potential, or should we explore other strategies? Biogeosci. Discuss. 2017, 1–12. [Google Scholar] [CrossRef] [Green Version]
- Hassink, J. The capacity of soils to preserve organic C and N by their association with clay and silt particles. Plant Soil. 1997, 191, 77–87. [Google Scholar] [CrossRef]
- Wiesmeier, M.; Hubner, R.; Sporlein, P.; Geu, U.; Hangen, E.; Reischl, A.; Schilling, B.; von Lutzow, M.; Kogel-knabner, I. Carbon sequestration potential of soils in southeast Germany derived from stable soil organic carbon saturation. Glob. Chang. Biol. 2014, 20, 653–665. [Google Scholar] [CrossRef] [PubMed]
- Balesdent, J.; Besnard, E.; Arrouays, D.; Chenu, C. The dynamics of carbon in particle-size fractions of soil in a forest-cultivation sequence. Plant Soil 1998, 201, 49–57. [Google Scholar] [CrossRef]
- Barthès, B.G.; Kouakoua, E.; Larré-larrouy, M.; Razafimbelo, T.M.; De Luca, E.F.; Azontonde, A.; Neves, C.S.V.J.; De Freitas, P.L.; Feller, C.L. Texture and sesquioxide effects on water-stable aggregates and organic matter in some tropical soils. Geoderma 2008, 143, 14–25. [Google Scholar] [CrossRef]
- Gelaw, A.M.; Singh, B.R.; Lal, R. Organic carbon and nitrogen associated with soil aggregates and particle sizes under different land uses in tigray. Land Degrad. Dev. 2015, 26, 690–700. [Google Scholar] [CrossRef]
- Stewart, C.E.; Plante, A.F.; Conant, R.T.; Six, J. Soil carbon saturation: Linking concept and measurable carbon pools. Soil Sci. Soc. Am. 2008, 72, 379–392. [Google Scholar] [CrossRef]
- Angers, D.A.; Eriksen-Hamel, N.S. Full-inversion tillage and organic carbon distribution in soil profiles: A meta-analysis. Soil Sci. Soc. Am. J. 2008, 72, 1370–1374. [Google Scholar] [CrossRef]
- Stewart, C.E.; Follett, R.F.; Pruessner, E.G. Nitrogen and harvest effects on soil properties under rainfed switchgrass and no-till corn over 9 years: Implications for soil quality. GCB Bioenergy 2015, 7, 288–301. [Google Scholar] [CrossRef]
- Kenney, I.A.N.; Blanco-canqui, H.; Presley, D.R. Soil and crop response to stover removal from rainfed and irrigated corn. Glob. Chang. Biol. Bioenergy 2015, 7, 219–230. [Google Scholar] [CrossRef]
- Sartori, F.; Lal, R.; Ebinger, M.H.; Parrish, D.J. Potential soil carbon sequestration and CO2 offset by dedicated energy crops in the USA. Crit. Rev. Plant Sci. 2017, 25, 441–472. [Google Scholar] [CrossRef]
- Guo, L.B.; Gifford, R.M. Soil carbon stocks and land use change: A meta analysis. Glob. Chang. Biol. 2002, 8, 345–360. [Google Scholar] [CrossRef]
- Fitzpatrick, S. Cranberry: The Canadian Encyclopedia, Historica Canada. 2015. Available online: https://www.thecanadianencyclopedia.ca/en/article/cranberry (accessed on 17 February 2021).
- Parent, L.E. Classification, pédogénèse et dégradation des sols organiques. In Écologie des Tourbières du Québec-Labrador; Presses de l’Université Laval: Québec, QC, Canada, 2001; pp. 241–255. [Google Scholar]
- Kennedy, C.D.; Wilderotter, S.; Payne, M.; Buda, A.R.; Kleinman, P.J.A.; Bryant, R.B. A geospatial model to quantify mean thickness of peat in cranberry bogs. Geoderma 2018, 319, 122–131. [Google Scholar] [CrossRef]
- Sandler, H.; DeMoranville, C. Cranberry Production: A Guide for Massachusetts, Summary Edition; University of Massachusetts Cranberry Station: Amherst, MA, USA, 2008; pp. 1–198. [Google Scholar]
- Jamaly, R.; Parent, S.-É.; Parent, L.E. Fertilization and soil nutrients impact differentially cranberry yield and quality in eastern Canada. Horticulturae 2021, 7, 191. [Google Scholar] [CrossRef]
- Kosola, K.R.; Workmaster, B.A.A. Mycorrhizal colonization of cranberry: Effects of cultivar, soil type, and leaf litter composition. J. Am. Soc. Hortic. Sci. 2007, 132, 134–141. [Google Scholar] [CrossRef] [Green Version]
- Atucha, A.; Workmaster, B. Root growth patterns in cranberries: Why is it important and how can it affect yield and production efficiency. Wis. Cranberry Sch. 2016, 24, 35–40. [Google Scholar]
- Chaopricha, N.T.; Marín-Spiotta, E. Soil burial contributes to deep soil organic carbon storage. Soil Biol. Biochem. 2014, 69, 251–264. [Google Scholar] [CrossRef]
- Cornwell, W.K.; Cornelissen, H.C.; Dorrepaal, E.; Eviner, V.T.; Godoy, O.; Hobbie, S.E.; Hoorens, B.; Van Bodegom, P. Plant species traits are the predominant control on litter decomposition rates within biomes worldwide. Ecol. Lett. 2008, 11, 1065–1071. [Google Scholar] [CrossRef]
- Duboc, O.; Zehetner, F.; Djukic, I.; Tatzber, M.; Berger, T.W.; Gerzabek, M.H. Decomposition of European beech and black pine foliar litter along an Alpine elevation gradient: Mass loss and molecular characteristics. Geoderma 2012, 189, 522–531. [Google Scholar] [CrossRef]
- Bonan, G.B.; Hartman, M.D.; Parton, W.J.; Wieder, W.R. Evaluating litter decomposition in earth system models with long-term litterbag experiments: An example using the Community Land Model version 4 (CLM4). Glob. Chang. Biol. 2013, 19, 957–974. [Google Scholar] [CrossRef]
- Janssens, I.A.; Luyssaert, S. Nitrogen’s carbon bonus. Nat. Geosci. 2009, 2, 318–319. [Google Scholar] [CrossRef]
- Gagnon, B.; Parent, S.-É.; Abdi, D.; Ziadi, N.; Parent, L.-É. The use of isometric log ratios to classify phosphorus attributes in composts. Can. J. Soil Sci. 2018, 98, 448–457. [Google Scholar] [CrossRef]
- Davenport, J. The Effect of Nitrogen Fertilizer Rates and Timing on Cranberry Yield and Fruit Quality. J. Am. Soc. Hortic. Sci. 1996, 121, 1089–1094. [Google Scholar] [CrossRef] [Green Version]
- Davenport, J.; Vorsa, N. Cultivar fruiting and vegetative response to nitrogen fertilizer in cranberry. J. Am. Soc. Hortic. Sci. 1999, 124, 90–93. [Google Scholar] [CrossRef] [Green Version]
- Davenport, J.; Demoranville, C.; Hart, J.; Patten, K.; Peterson, L.; Planer, T.; Poole, A.; Roper, T.; Smith, J. Cranberry Tissue Testing for Producing Beds in North America; Oregon State University: Corvallis, OR, USA, 1995. [Google Scholar]
- Vanden Heuvel, J.E.; Davenport, J.R. Growth and carbon partitioning in cranberry uprights as influenced by nitrogen supply. HortScience 2006, 41, 1552–1558. [Google Scholar] [CrossRef] [Green Version]
- Berg, B.; Berg, M.P.; Bottner, P.; Box, E.; Breymeyer, A.; De Anta, R.C.; Couteaux, M.; Escudero, A.; Gallardo, A.; Kratz, W.; et al. Litter mass loss rates in pine forests of Europe and Eastern United States: Some relationships with climate and litter quality. Biogeochemistry 1993, 20, 127–159. [Google Scholar] [CrossRef]
- Trofymow, J.A.; Moore, T.R.; Titus, B.; Prescott, C.; Morrison, I.; Siltanen, M.; Smith, S.; Fyles, J.; Wein, R.; Camiré, C.; et al. Rates of litter decomposition over 6 years in Canadian forests: Influence of litter quality and climate. Can. J. For. Res. 2002, 32, 789–804. [Google Scholar] [CrossRef] [Green Version]
- Parton, W.; Silver, W.L.; Burke, I.C.; Grassens, L.; Harmon, M.E. Global-scale similarities in nitrogen release patterns during long-term decomposition. Science 2007, 315, 361. [Google Scholar] [CrossRef]
- Hildrew, A.; Townsend, C.; Francis, J.; Finch, K. Cellulolytic decomposition in streams of contrasting pH and its relationship with invertebrate community structure. Freshw. Biol. 1984, 14, 323–328. [Google Scholar] [CrossRef]
- Boulton, A.J.; Quinn, J.M. A simple and versatile technique for assessing cellulose decomposition potential in floodplain and riverine sediments. Arch. Für Hydrobiol. 2000, 150, 133–151. [Google Scholar] [CrossRef]
- Claret, A.; Boulton, J.; Marmonier, P. Functional processes versus state variables: Interstitial organic matter pathways in floodplain habitats. Can. J. Fish. Aquat. Sci. 2001, 58, 1594–1602. [Google Scholar] [CrossRef]
- Tiegs, S.; Langhans, S.; Tockner, K.; Gessner, M. Cotton strips as a leaf surrogate to measure decomposition in river floodplain habitats. J. N. Am. Benthol. Soc. 2007, 26, 70–77. [Google Scholar] [CrossRef]
- Harrison, A.F.; Latter, P.M.; Walton, D.W.H. Cotton strip assay: An index of decomposition in soil. ITE Symp. Ed. 1988, 24, 100–108. [Google Scholar]
- Correll, R.L.; Harch, B.D.; Kirkby, C.A.; Brien, K.O.; Pankhurst, C.E. Methods Statistical analysis of reduction in tensile strength of cotton strips as a measure of soil microbial activity. J. Microbiol. Methods 1997, 31, 9–17. [Google Scholar] [CrossRef]
- Slocum, M.G.; Roberts, J.; Mendelssohn, I.A. Artist canvas as a new standard for the cotton-strip assay. J. Plant Nutr. Soil Sci. 2009, 172, 71–74. [Google Scholar] [CrossRef]
- Fritz, K.M.; Fulton, S.; Johnson, B.R.; Barton, C.D.; Jack, J.D.; Word, D.A.; Burke, R.A. An assessment of cellulose filters as a standardized material for measuring litter breakdown in headwater streams. Ecohydrology 2011, 4, 469–476. [Google Scholar] [CrossRef]
- Keuskamp, J.A.; Dingemans, B.J.J.; Lehtinen, T.; Sarneel, J.M. Tea Bag Index: A novel approach to collect uniform decomposition data across ecosystems. Methods Ecol. Evol. 2013, 4, 1070–1075. [Google Scholar] [CrossRef]
- Didion, M.; Repo, A.; Liski, J.; Forsius, M.; Bierbaumer, M.; Djukic, I. Towards harmonizing leaf litter decomposition studies using standard Tea Bags—A field study and model application. Forests 2016, 7, 167. [Google Scholar] [CrossRef] [Green Version]
- Thuriès, L.; Pansu, M.; Larré-Larrouy, M.C.; Feller, C. Biochemical composition and mineralization kinetics of organic inputs in a sandy soil. Soil Biol. Biochem. 2002, 34, 239–250. [Google Scholar] [CrossRef]
- Bosatta, E.; Agren, G.I. Dynamics of carbon and nitrogen in the organic matter of the soil: A generic theory. Am. Nat. 1991, 138, 227–245. [Google Scholar] [CrossRef]
- Kopelman, R. Fractal reaction kinetics. Science 1988, 241, 1620–1626. [Google Scholar] [CrossRef] [PubMed]
- Wang, Z.; Xu, J.H.; Feng, H.; Qi, H. Fractal kinetic analysis of polymers/nonionic surfactants to eliminate lignin inhibition in enzymatic saccharification of cellulose. Bioresour. Technol. 2011, 102, 2890–2896. [Google Scholar] [CrossRef] [PubMed]
- Wang, Z.; Feng, H. Fractal kinetic analysis of the enzymatic saccharification of cellulose under different conditions. Bioresour. Technol. 2010, 101, 7995–8000. [Google Scholar] [CrossRef]
- Rompre, M.; Laflamme, G.; Ouellet, L.; Carrier, D.; Dubé, J.-C.; Pagé, F. Étude Pédologique du Comté d’Arthabaska; Ministère de l’agriculture, des pêcheries et de l’alimentation du Québec, Direction de la Recherche Agricole: Quebec, QC, Canada, 1984.
- Caron, J.; Pelletier, V.; Kennedy, C.D.; Gallichand, J.; Gumiere, S.; Bonin, S.; Bland, W.; Pepin, S. Guidelines of irrigation and drainage management strategies to enhance cranberry production and optimize water use in North America. Can. J. Soil Sci. 2017, 97, 82–91. [Google Scholar]
- Gouvernement du Canada. Météo, Climat et Catastrophes Naturelles. 2018. Available online: https://www.canada.ca/fr/services/environnement/meteo.html (accessed on 6 August 2021).
- Kowalenko, C.G. Assessment of Leco CNS-2000 analyzer for simultaneously measuring total carbon, nitrogen, and sulphur in soil. Commun. Soil Sci. Plant Anal. 2001, 32, 2065–2078. [Google Scholar] [CrossRef]
- Gee, G.W.; Bauder, J.W. Particle-size analysis. Methods Soil Anal. Part 1 Phys. Mineral. Methods 1986, 5, 383–411. [Google Scholar]
- Mehlich, A. Mehlich 3 Soil Test Extractant: A Modification of Mehlich 2 Extractant. Commun. Soil Sci. Plant Anal. 1984, 15, 1409–1416. [Google Scholar] [CrossRef]
- Kroetsch, D.; Wang, C. Particle size distribution. Soil Sampl. Methods Anal. 2008, 2, 713–725. [Google Scholar]
- Van Soest, P.J. Use of detergents in the analysis of fibrous feeds. II. A rapid method for the determination of fiber and lignin. J. Assoc. Off. Agric. Chem. 1963, 46, 829–835. [Google Scholar]
- Tremblay, M.E.; Nduwamungu, C.; Parent, L.É.; Tremblay, M.E. Biological stability of carbon and nitrogen in organic products and crop residues using Fourier- Transform Near-Infrared Reflectance Spectroscopy. Soil Sci. Plant Anal. 2010, 41, 917–934. [Google Scholar] [CrossRef]
- MacDonald, E.; Brummell, M.E.; Bieniada, A.; Elliot, J.; Engering, A.; Gauthier, T.L.; Saraswati, S.; Touchette, S.; Tourmel-Courchesne, L.; Strack, M. Using the Tea Bag Index to characterize decomposition rates in restored peatlands. Boreal Environ. Res. 2018, 2469, 221–235. [Google Scholar]
- Saint-Laurent, L. Arsenault-Boucher, Soil properties and rate of organic matter decomposition in riparian woodlands using the TBI protocol. Geoderma 2020, 358, 113976. [Google Scholar] [CrossRef]
- Duddigan, S.; Shaw, L.J.; Alexander, P.D.; Collins, C.D. Chemical underpinning of the Tea Bag Index: An examination of the decomposition of tea leaves. Appl. Environ. Soil Sci. 2020, 2020, 6085180. [Google Scholar] [CrossRef]
- Pande, R.; Mishra, H.N. Fourier Transform Near-Infrared Spectroscopy for rapid and simple determination of phytic acid content in green gram seeds (Vigna radiata). Food Chem. 2015, 172, 880–884. [Google Scholar] [CrossRef] [PubMed]
- Verzani, J. Using R for Introductory Statistics; Chapman and Hall/CRC: Boca Raton, FL, USA, 2018. [Google Scholar]
- Pinheiro, J.; Bates, D.; DebRoy, S.; Sarkar, D.; Authors, E.; Heisterkamp, S.; Van Willigen, B. nlme: Linear and Nonlinear Mixed Effects Models. R Package Version 2007, 3, 1–89. [Google Scholar]
- West, B.T.; Welch, K.B.; Galecki, A.T. Linear Mixed Models: A Practical Guide Using Statistical Software; Chapman and Hall/CRC: Boca Raton, FL, USA, 2014. [Google Scholar]
- Amrhein, V.; Greenland, S.; Mcshane, B. Retire statistical significance. Nature 2019, 567, 305–307. [Google Scholar] [CrossRef] [Green Version]
- Prescott, C.E. Does Nitrogen Availability Control Rates of Litter Decomposition in Forests? Plant Soil 1995, 168, 83–88. [Google Scholar] [CrossRef]
- Thomas, D.C.; Zak, D.R.; Filley, T.R. Chronic N deposition does not apparently alter the biochemical composition of forest floor and soil organic matter. Soil Biol. Biochem. 2012, 54, 7–13. [Google Scholar] [CrossRef]
- Fog, K. The effect of added nitrogen on the rate of decomposition of organic matter. Biol. Rev. 1988, 63, 433–462. [Google Scholar] [CrossRef]
- Tan, W.; Wang, G.; Huang, C.; Gao, R.; Xi, B.; Zhu, B. Physico-chemical protection, rather than biochemical composition, governs the responses of soil organic carbon decomposition to nitrogen addition in a temperate agroecosystem. Sci. Total Environ. 2017, 598, 282–288. [Google Scholar] [CrossRef] [PubMed]
- Berg, B.; Tamm, C.O. Decomposition and nutrient dynamics of litter in long-term optimum nutrition experiments. Scand. J. For. Res. 1991, 6, 305–321. [Google Scholar] [CrossRef]
- Riggs, C.E.; Hobbie, S.E. Mechanisms driving the soil organic matter decomposition response to nitrogen enrichment in grassland soils. Soil Biol. Biochem. 2016, 99, 54–65. [Google Scholar] [CrossRef] [Green Version]
- Berg, B.; Laskowski, R. Decomposers: Soil microorganisms and animals. Adv. Ecol. Res. 2005, 38, 73–100. [Google Scholar]
- Davenport, J.R.; Provost, J. Cranberry tissue nutrient levels as impacted by three levels of nitrogen fertilizer and their relationship to fruit yield and quality. J. Plant Nutr. 1994, 17, 1625–1634. [Google Scholar] [CrossRef]
- Davenport, J.R.; Demoranville, C.J.; Hart, J.; Roper, T. Nitrogen for Bearing Cranberries in North America; Oregon State University: Corvallis, OR, USA, 2000. [Google Scholar]
- Min, K.; Kang, H.; Lee, D. Effects of ammonium and nitrate additions on carbon mineralization in wetland soils. Soil Biol. Biochem. 2011, 43, 2461–2469. [Google Scholar] [CrossRef]
- Haynes, R.J.; Swift, R.S. Effects of lime and phosphate additions on changes in enzyme activities, microbial biomass and levels of extractable nitrogen, sulphur and phosphorus in an acid soil. Biol. Fertil. Soils 1988, 6, 153–158. [Google Scholar] [CrossRef]
- Stark, S.; Männistö, M.K.; Eskelinen, A. Nutrient availability and pH jointly constrain microbial extracellular enzyme activities in nutrient-poor tundra soils. Plant Soil 2014, 383, 373–385. [Google Scholar] [CrossRef]
- Ryan, M.G.; Melollo, J.M.; Ricca, A. A comparison of methods for determining proximate carbon fractions of forest litter. Can. J. For. Res. 1990, 20, 166–171. [Google Scholar] [CrossRef]
- Heim, A.; Frey, B. Early stage litter decomposition rates for Swiss forests. Biogeochemistry 2004, 70, 299–313. [Google Scholar] [CrossRef]
- Andrén, O.; Kätterer, T. ICBM: The introductory carbon balance model for exploration of soil carbon balances. Ecol. Soc. Am. 1997, 7, 1226–1236. [Google Scholar] [CrossRef]
- Coleman, K.; Jenkinson, D.S. RothC—A Model for the Turnover of Carbon in Soil. Model Description and Users Guide; Rothamsted Research: Harpenden, UK, 2014; Available online: https://www.rothamsted.ac.uk/sites/default/files/RothC_guide_WIN.pdf (accessed on 10 August 2021).
- Newton, L.S.J.; Lopes, A.; Spokas, K.; Archer, D.W.; Reicosky, D. First-order decay models to describe soil C-CO2 loss after rotary tillage. Sci. Agric. 2009, 66, 650–657. [Google Scholar]
- Thuriès, L.; Pansu, M.; Feller, C.; Herrman, P.; Rémy, J.C. Kinetics of added organic matter decomposition in a Mediterranean sandy soil. Soil Biol. Biochem. 2001, 33, 997–1010. [Google Scholar] [CrossRef]
- Perfecf, B.; Kay, D. Applications of fractals in soil and tillage research: A review. Soil Tillage Res. 1995, 36, 1–20. [Google Scholar] [CrossRef]
- Dolgonosov, B.M.; TGubernatorova, N. Kinetics of the enzymatic decomposition of macromolecules with a fractal structure. Theor. Found. Chem. Eng. 2007, 41, 868–877. [Google Scholar] [CrossRef]
- Parent, S.É.; Parent, L.É.; Parent, A.-C.; Leblanc, M.; Coulibaly, Z. Site-specific multilevel modeling of potato response to nitrogen fertilization. In Front. Environ. Sci.; 2017; Volume 5, p. 81. Available online: https://www.frontiersin.org/articles/10.3389/fenvs.2017.00081/full (accessed on 6 August 2021).
- Chen, R.; Senbayram, M.; Blagodatsky, S.; Myachina, O.; Dittert, K.; Lin, X.; Blago-datskaya, E.; Kuzyakov, Y. Soil C and N availability determine the priming effect: Microbial N mining and stoichiometric decomposition theories. Glob. Chang. Biol. 2014, 20, 2356–2367. [Google Scholar] [CrossRef]
- Kuzyakov, Y.; Blagodatskaya, E. Microbial hotspots and hot moments in soil: Concept & review. Soil Biol. Biochem. 2015, 83, 184–199. [Google Scholar]
- Kuzyakov, Y.; Friedel, J.K.; Stahr, K. Review of mechanisms and quantification of priming effect. Soil Biol. Biochem. 2000, 32, 1485–1498. [Google Scholar] [CrossRef]
- Costa, O.Y.; Raaijmakers, J.M.; Kuramae, E.E. Microbial extracellular polymeric substances: Ecological function and impact on soil aggregation. Front. Microbiol. 2018, 9, 1–14. [Google Scholar] [CrossRef] [PubMed] [Green Version]
- Andlar, M.; Rezić, T.; Marđetko, N.; Kracher, D.; Ludwig, R.; Šantek, B. Lignocellulose degradation: An overview of fungi and fungal enzymes involved in lignocellulose degradation. Eng. Life Sci. 2018, 18, 768–778. [Google Scholar] [CrossRef] [PubMed]
Figure 1.
Map of the cranberry experimental sites in Southern Quebec, Canada.

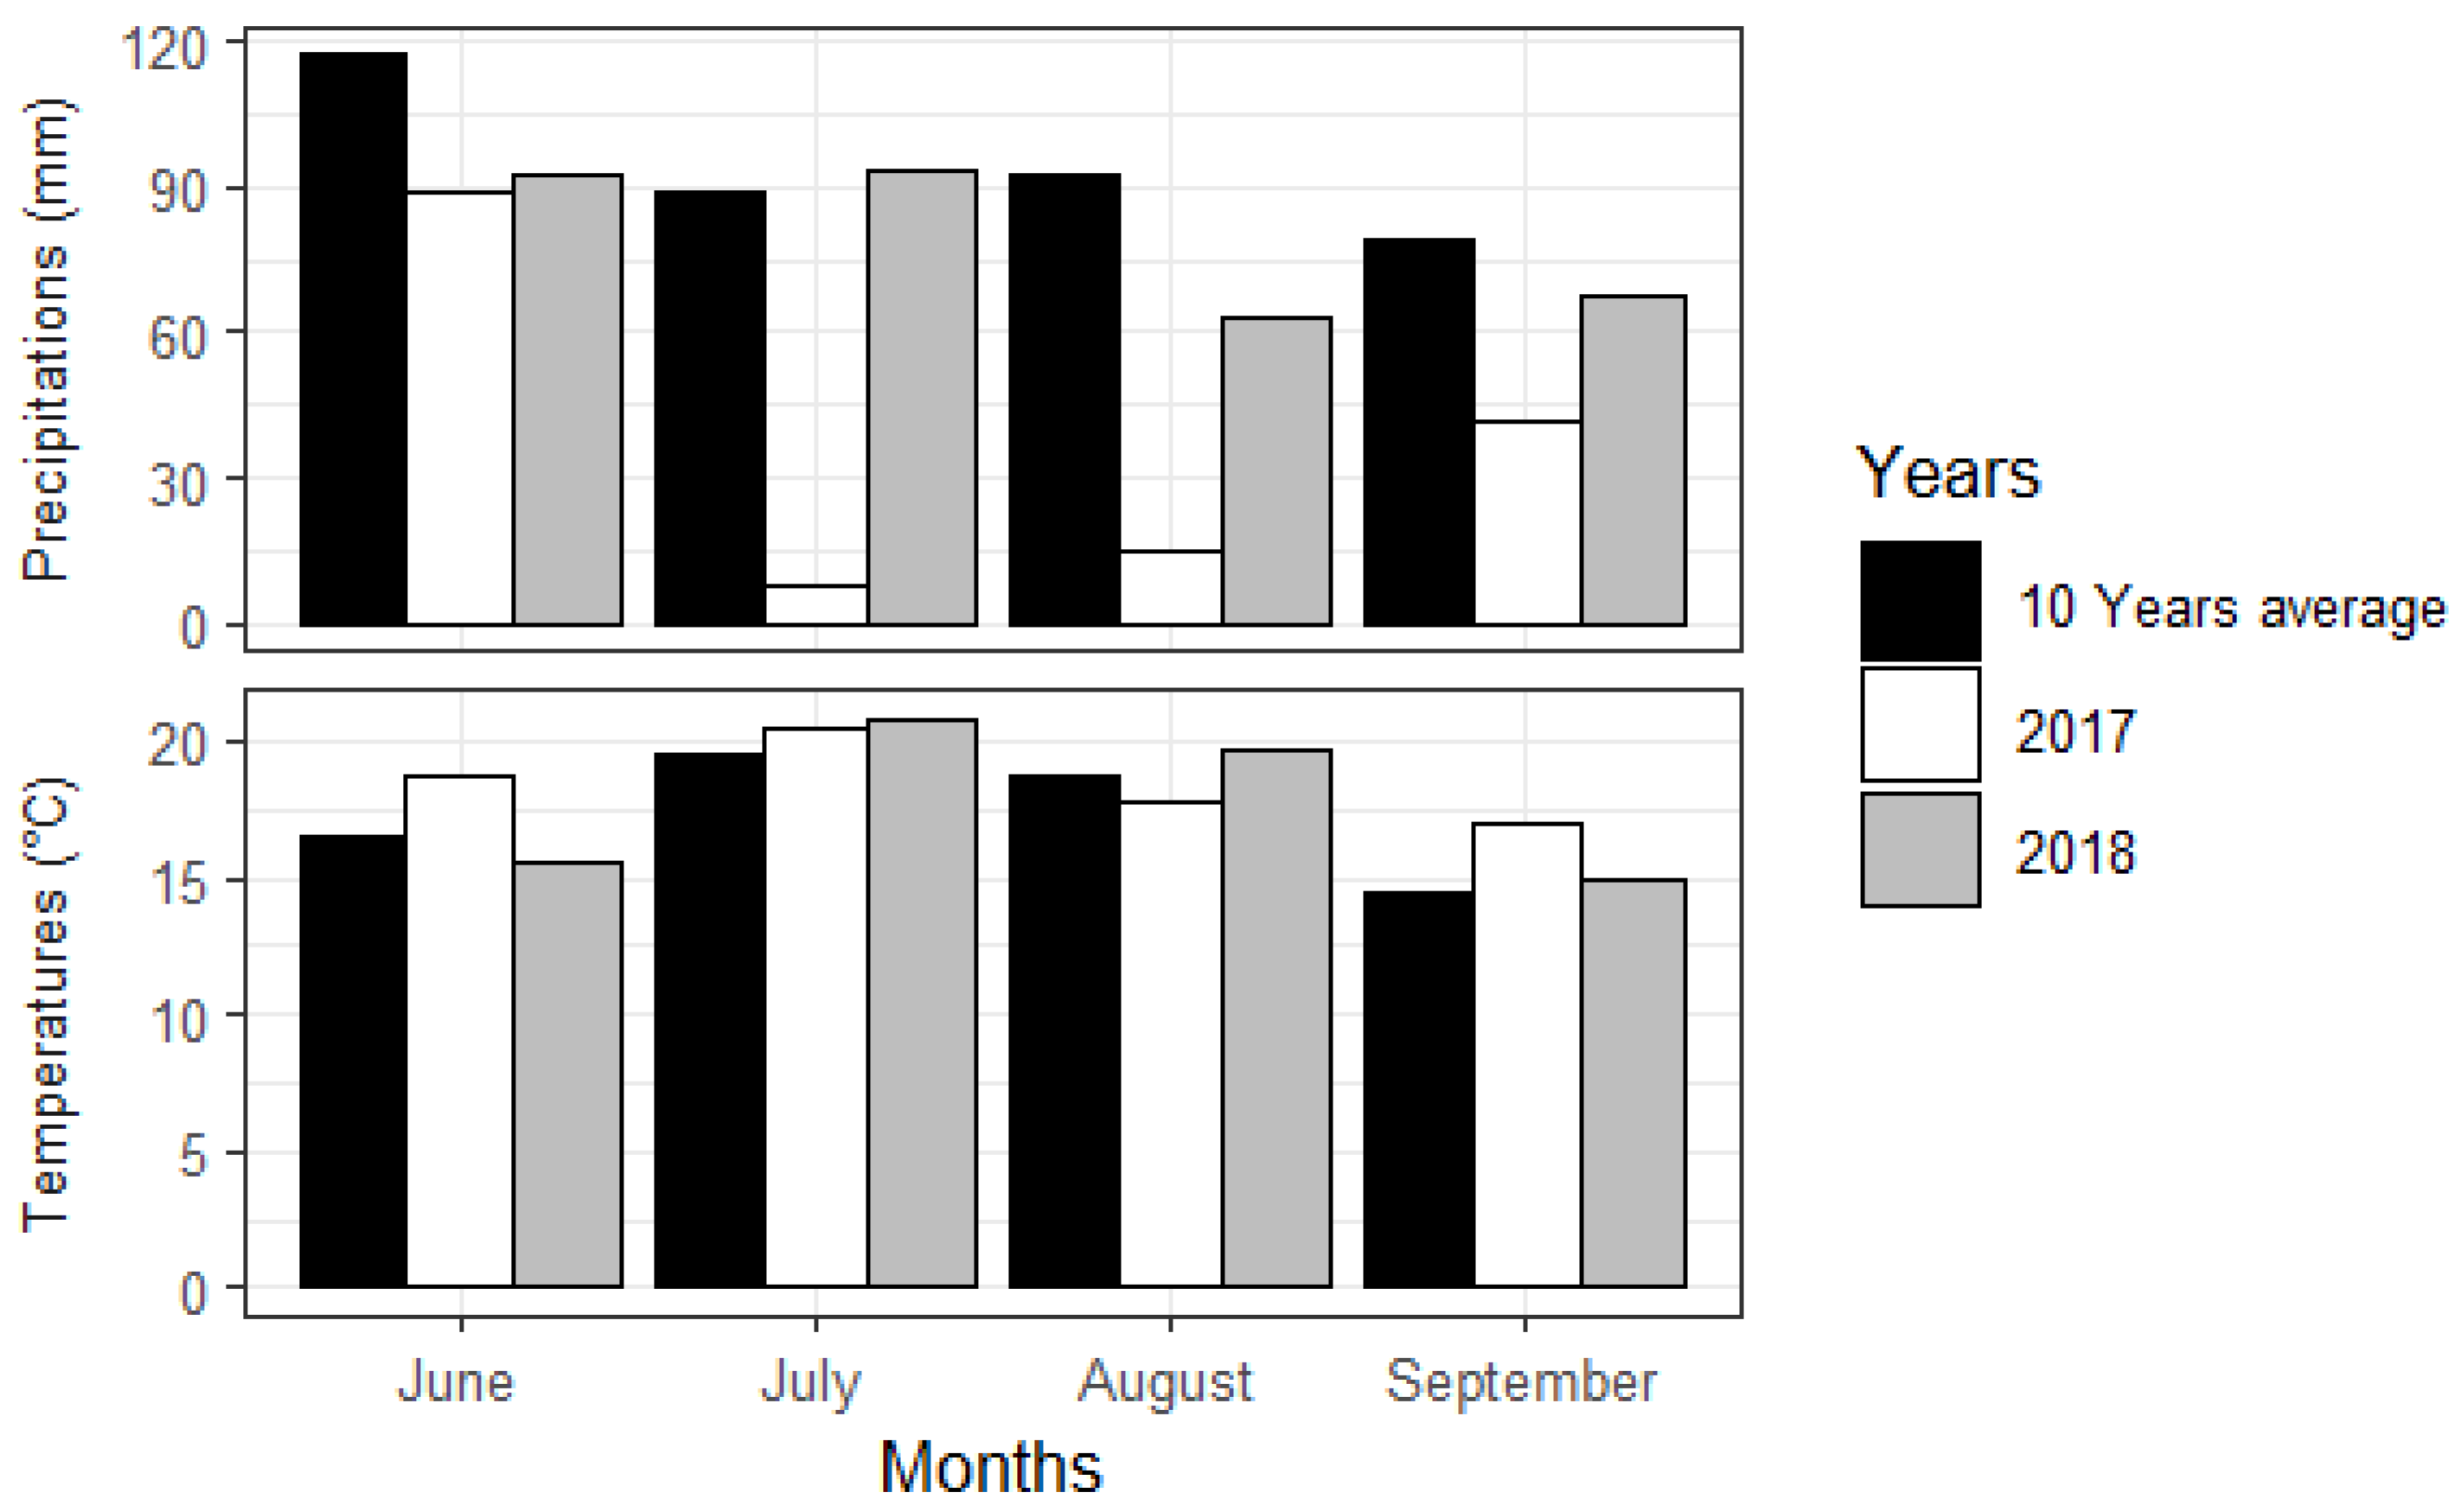
Figure 2.
Growing-season months (2017–2018) and 10-year averages of weather data at Lemieux, Quebec (46°09′56′′ N 72°19′28′′ W), near experimental sites [53].
Figure 2.
Growing-season months (2017–2018) and 10-year averages of weather data at Lemieux, Quebec (46°09′56′′ N 72°19′28′′ W), near experimental sites [53].

Figure 3.
Coefficients of the mixed model linking the TBI decomposition rate (k) to the N dosage and sites with a 95% compatibility interval.
Figure 3.
Coefficients of the mixed model linking the TBI decomposition rate (k) to the N dosage and sites with a 95% compatibility interval.

Figure 4.
Coefficients of the mixed model linking the TBI stabilization factor (S) to the N dosage and sites with a 95% compatibility interval.
Figure 4.
Coefficients of the mixed model linking the TBI stabilization factor (S) to the N dosage and sites with a 95% compatibility interval.

Figure 5.
TBI of Quebec cranberry agroecosystems compared to the TBI of terrestrial ecosystems reported by Keuskamp et al. (2013). United States–Florida = US-FL, China = CN, Panama = PA, the Netherlands = NL, Austria = AU, Ireland = IE, and Iceland = IS.
Figure 5.
TBI of Quebec cranberry agroecosystems compared to the TBI of terrestrial ecosystems reported by Keuskamp et al. (2013). United States–Florida = US-FL, China = CN, Panama = PA, the Netherlands = NL, Austria = AU, Ireland = IE, and Iceland = IS.

Figure 6.
First order kinetics of teas and cranberry litter under field conditions.

Figure 7.
Fractal kinetics of the tea’s decomposition under field conditions with a 95% compatibility interval for the experiment performed in 2018.
Figure 7.
Fractal kinetics of the tea’s decomposition under field conditions with a 95% compatibility interval for the experiment performed in 2018.

Figure 8.
Fractal kinetics of the tea’s biochemicals compound under field conditions with a 95% compatibility interval.
Figure 8.
Fractal kinetics of the tea’s biochemicals compound under field conditions with a 95% compatibility interval.


Table 1.
Soil chemical properties at experimental sites (0–15 cm layer).
| Site #A9 | Site #10 | Site #9 | Site #45 | |
|---|---|---|---|---|
| pHcacl2 | 4.3 | 4.3 | 4.7 | 4.6 |
| C:N | 19.0 | 7.7 | 11.0 | 21.8 |
| g kg−1 | ||||
| C | 11.4 | 5.4 | 12.1 | 13.1 |
| N | 0.6 | 0.7 | 1.1 | 0.6 |
| S | 0.2 | 0.2 | 0.1 | 0.1 |
| Sand 1–2 mm | 13 | 6 | 34 | 19 |
| Sand 0.5–1 mm | 71 | 28 | 93 | 74 |
| Sand 0.25–0.5 mm | 411 | 329 | 404 | 279 |
| Sand 0.1–0.25 mm | 375 | 461 | 261 | 475 |
| Sand 0.25–0.01 mm | 44 | 102 | 69 | 91 |
| Silt | 49 | 5 | 44 | 37 |
| Clay | 36 | 23 | 26 | 26 |
| Mehlich-3 extractable mg element kg−1 | ||||
| P | 47 | 46 | 88 | 62 |
| S | 39 | 25 | 25 | 38 |
| K | 26 | 23 | 36 | 35 |
| Ca | 28 | 26 | 170 | 135 |
| Mg | 6 | 7 | 12 | 10 |
| Zn | 0.5 | 0.7 | 2.0 | 1.1 |
| Cu | 1.5 | 2.5 | 2.1 | 1.9 |
| Mn | 0.8 | 0.9 | 3.0 | 1.0 |
| Fe | 128 | 108 | 159 | 182 |
| Al | 591 | 345 | 690 | 662 |
| Mehlich-3 P saturation ratio | ||||
| P/Al | 0.08 | 0.13 | 0.13 | 0.09 |
Table 2.
Particle size distribution of the control tea litters and cranberry residues.
| Tea Type | Size Fraction (mm) | Particle Size Distribution (%) |
|---|---|---|
| Green tea | >2 | 32.1 |
| 1–2 | 26.2 | |
| 0.5–1 | 5.9 | |
| 0.25–0.50 | 1.7 | |
| <0.25 | 34.1 | |
| Rooibos tea | >2 | 64.8 |
| 1–2 | 14.4 | |
| 0.5–1 | 1.3 | |
| 0.25–0.50 | 0.5 | |
| <0.25 | 19.0 | |
| Cranberry residue | >2 | 89.2 |
| 1–2 | 0.1 | |
| 0.5–1 | - | |
| 0.25–0.50 | - | |
| <0.25 | 10.7 |
Table 3.
Properties of teas and litter materials (mean ± SD) in the first experiment performed in 2017.
Table 3.
Properties of teas and litter materials (mean ± SD) in the first experiment performed in 2017.
| Green Tea | Rooibos Tea | Cranberry Litter | |
|---|---|---|---|
| C:N Ratio | 11.1 ± 1.3 | 54.1 ± 9.1 | 66.7 ± 5.4 |
| % of dry organic mass (total biomass minus ash) (mean ± SD) | |||
| 75.2 ± 1.5 | 45.4 ± 1.4 | 33.9 ± 3.3 |
| 14.8 ± 0.9 | 37.5 ± 0.3 | 25.9 ± 0.9 |
| 17.1 ± 1.1 | 9.8 ± 1.4 | 40.1 ± 2.7 |
| Hydrolyzable (1 + 2) | 90.5 ± 2.4 | 82.9 ± 1.7 | 47.6 ± 4.2 |
| Biomass weight (g) (mean ± SD) | |||
| † | 1.7 ± 1.3 × 10⁻² | 1.9 ± 1.1 × 10⁻² | 1.9 ± 1.5 × 10⁻² |
| 0.7 ± 1.2 × 10⁻¹ | 1.4 ± 1.1 × 10⁻¹ | 1.8 ± 1.3 × 10⁻¹ | |
| Decomposition rate k (day−1) as (ln(M90 days/M0))/90 days (mean ± SD) | |||
| 9.7 × 10⁻³ ± 1.6 × 10⁻³ | 3.3 × 10⁻³ ± 0.8 × 10⁻³ | 0.4 × 10⁻³ ± 0.86 × 10⁻³ | |
† Initial M0 and residual M90 days masses of plant materials, respectively.
Publisher’s Note: MDPI stays neutral with regard to jurisdictional claims in published maps and institutional affiliations. |
© 2021 by the authors. Licensee MDPI, Basel, Switzerland. This article is an open access article distributed under the terms and conditions of the Creative Commons Attribution (CC BY) license (https://creativecommons.org/licenses/by/4.0/).
Share and Cite
MDPI and ACS Style
Dossou-Yovo, W.; Parent, S.-É.; Ziadi, N.; Parent, É.; Parent, L.-É. Tea Bag Index to Assess Carbon Decomposition Rate in Cranberry Agroecosystems. Soil Syst. 2021, 5, 44. https://0-doi-org.brum.beds.ac.uk/10.3390/soilsystems5030044
AMA Style
Dossou-Yovo W, Parent S-É, Ziadi N, Parent É, Parent L-É. Tea Bag Index to Assess Carbon Decomposition Rate in Cranberry Agroecosystems. Soil Systems. 2021; 5(3):44. https://0-doi-org.brum.beds.ac.uk/10.3390/soilsystems5030044
Chicago/Turabian StyleDossou-Yovo, Wilfried, Serge-Étienne Parent, Noura Ziadi, Élizabeth Parent, and Léon-Étienne Parent. 2021. "Tea Bag Index to Assess Carbon Decomposition Rate in Cranberry Agroecosystems" Soil Systems 5, no. 3: 44. https://0-doi-org.brum.beds.ac.uk/10.3390/soilsystems5030044