Article

Changes in Soil Prokaryotic Diversity in Response to Land-Use Changes in Sub-Saharan Africa

1
Graduate School of Global Food Resources, Hokkaido University, Sapporo 060-8589, Japan
2
Research Unit for Comparative Microbiome Analysis, Helmholtz Center for Environmental Health, 85764 Munich, Germany
3
Zambia Agriculture Research Institute, Chilanga 50595, Zambia
4
Global Center for Food, Land and Water Resources, Research Faculty of Agriculture, Hokkaido University, Sapporo 060-8589, Japan
*
Author to whom correspondence should be addressed.
Submission received: 23 August 2021 / Revised: 16 September 2021 / Accepted: 28 September 2021 / Published: 4 October 2021

Abstract

:
Sub-Saharan Africa is one of the most severely affected regions regarding soil degradation, a global issue with the loss of nutrients caused by inappropriate management, leading to low agricultural productivity. Here we asked the question of how soil prokaryotic communities are affected by shifts in land use management and subsequent losses in soil organic carbon. We sampled soils from three sites in Zambia which have neighboring natural and managed sites. After the measurement of soil properties, soil DNA was sequenced, targeting the 16S rRNA gene. As expected, total carbon in soil was decreased in the managed sites, with significant reductions of bacterial biomass. However, the diversity indices in the managed soils were higher than in natural soils. Particularly, the relative abundance of nitrifiers was increased in the managed soils, most likely as a result of fertilization. However also other bacteria, e.g., those which formed tight interactions with the cultivated crops including the genera Balneimonas, and Bacillus, were increased in the managed soils. In contrast bacteria belonging to the family Chloroflexi, which were high in abundance in the natural soil were outcompeted by other prokaryotes in the managed soils most likely as a result of changes in the amount of soil organic carbon. Overall, our results suggest that we need to discuss the trends of prokaryotic diversity separately from those for prokaryotic abundance. Even when bacterial abundances were decreased in the managed soils, nitrifiers’ relative abundance and diversity increased in our experiment, suggesting the possible alteration of the nitrogen cycle in managed soils in sub-Saharan Africa.

1. Introduction

The continuous expansion of farmlands and the increase in land-use intensity in the sub-Saharan African region, one of the fastest-developing regions in the world, is a result of the needs to fulfill the demands for food of the increasing population. These activities caused significant soil degradation including the depletion of soil organic matter, carbon (C) and nitrogen (N), leading to the loss of agricultural productivity [1]. The establishment of sustainable approaches to prevent soil degradation is needed in this region and requires site-specific strategies, as the soils in this region have a tendency of holding a relatively smaller amount of C (less than 1% on average) as reported by [2], compared to soils of other regions.
To establish sustainable management options, the soil microbiome and its functional traits plays a key role. Bacteria, fungi, archaea and small eucaryotes catalyze a large number of functions essential for soil quality, including the mobilization and storage of nutrients, the improvement of stress tolerance of plants, the sequestration of C and the degradation of pollutants [3]. Thus, diversity of soil microbial communities is strongly linked with the multifunctionality of the ecosystems [4,5]. Mismanagement of soils leads to a dysbiosis of the soil microbiome and a loss of soil quality including the increase of plant pathogens, affecting plant growth or microbiota which trigger the formation of greenhouse gases, turning soils from a sink for nutrients into a source for CO2, N2O and CH4 emissions [6].
Major drivers increasing soil microbial diversity have been considered to be higher soil pH and richer soil C content [7,8]. Not surprisingly, recently, many studies have reported that land-use changes, represented by forest-to-farm conversion, affected microbial community structures due to the shifts in soil pH or carbon stocks in response to agricultural management [9,10,11]. For example, mineral N fertilization lowered pH and caused changes in bacterial community structures, inducing an increased relative abundance of N cycle related bacteria [12]. Additionally, not only the quantity of soil C but also its quality has been reported as an important controlling factor of soil microbiomes because high quality C (readily available C) contents are positively correlated to the abundance of copiotrophic microbial communities [13]. These facts indicate decrease in soil organic matters and N addition through cultivation in sub-Saharan Africa would change the soil bacterial communities to adapt to the environment. In addition, microbial activity is strongly influenced by the stoichiometry of nutrients available in soil. Thus, fertilization itself and the kind of fertilizer (organic vs. inorganic fertilizer) strongly influences ratios of C:N:P in soil and subsequently microbial performance [14]. Despite a large body of data available on the effects of shifts in land-use on microbial diversity, there is still no clear pattern visible, in terms of which microbiota are mostly affected, and which functions are subsequently changed. Overall, it seems as though responses are dependent on the site-specific conditions and a generalization of responses is not possible.
In fact, the number of studies investigating the effect of land-use changes on soil microbial communities in sub-Saharan Africa is extremely small. However, taking the very low holding capacity for C in the soils in this region into account, as a result of the sandy soil texture, it is expected that land use changes will have a very pronounced effect on soil microbiota in this region. Thus, the purpose of this study was to investigate the influence of changes in land-use on prokaryotic community structure and diversity in sub-Saharan Africa, comparing managed sites with natural sites close by. Therefore, we selected three sites where we compared prokaryotic diversity using a molecular barcoding approach analyzing pairs of natural and managed plots in each site. We hypothesized that by the cultivation, (1) the soil prokaryotic diversity will be decreased with the loss of soil C content, and (2) abundances of prokaryotes related to nutrient cycle (i.e., C and N cycles) in the natural ecosystem will be influenced, causing a disruption of multifunctionality of diverse prokaryotic communities.

2. Materials and Methods

2.1. Soil Sampling

The soil sampling sites are located in Lusaka and the Central Province, Zambia. In January 2019, three paired farmed and natural sites were selected for soil sampling (Site A, Site B and Site C) and treated as true replicates. The locations of the sampling sites were recorded with a GPS logger (eTrex 20; GARMIN Inc., Olathe, KS, USA; Table S1). The soil textures have been categorized as sandy loam at Site A and Site C and sandy clay loam at Site B (Table S2). The soil type has been classified as Chromic Luvisols at Site A and Undifferentiated Acrisols at Site B and Site C (Table S2), according to the Soil Atlas of Africa [15]. The vegetation at the natural sites was bush, whereas at the managed site maize was used as main crop. Urea was applied to the managed sites as the main source of available nitrogen. For each sampling site, the distance between the two land-use types (agricultural and natural) was approximately 100 m. Within each land-use type and at each sampling site, three 1 m × 1 m plots were selected and treated as technical replicates resulting overall in 54 samples. Within the plot, six soil cores (100 cm3 each) and a bulk soil sample (approximately 1.5 kg) were taken from the topsoil (0–10 cm). Three of the soil cores were used to measure the soil moisture content and the bulk density. The other three were immediately frozen and used for the molecular analyses as described below. The bulk sample was used to analyzed for assessing basic soil characteristics.

2.2. Basic Characteristics of the Soil Samples

The pH of each soil sample was determined by mixing 6 g of soil with 30 mL of deionized water, shaking for 30 min, and measuring the pH of the supernatant using a pH sensor (AS800; AS ONE Co., Osaka, Japan). The total carbon (C) content and total nitrogen (N) content of the samples were measured by using dried soils with an organic elemental analyzer (2400 Series II CHNS/O Elemental Analysis; PerkinElmer Co., Waltham, Massachusetts, USA). The soil moisture was measured by weighing fresh soils, and dry soils after oven-drying at 105 °C for over 24 h. The soil textures were analyzed by the separation of sand (>0.05 mm) with wet sieving of soil mixture, followed by sampling a suspension with a pipette to remove clay (<0.002 mm) from the mixture, leaving silt (0.05–0.002 mm).

2.3. DNA Extraction and Sequencing of 16S rRNA Genes

DNA was extracted from 0.5 g of each soil sample with a soil DNA extraction kit (NucleoSpin Soil; MACHEREY-NAGEL GmbH & Co. KG, Dueren, Germany) according to the protocol of the manufacturer, followed by the PCR based amplification of the 16S rRNA gene targeting the V4 region, using primers F515 (5′-GTGCCAGCMGCCGCGGTAA-3′) and R806 (5′-GGACTACHVGGGTWTCTAAT-3′) [16]. PCR conditions were set as follows: After 10 min of denaturation at 95 °C, the PCR was performed by 30 cycles of 30 sec at 95 °C, 60 sec at 57 °C and 60 sec at 72 °C, and the final extension of 60 sec at 72°C. After the PCR, the samples were purified with a DNA purification kit (AMPure XP Kit; Beckman Coulter, Inc., Pasadena, CA, USA) to remove the primers and the enzyme, and labeled with Ion Xpress barcode adapters (Thermo Fisher Scientific K.K., Yokohama City, Japan) by a PCR using the same condition as written above except the number of the cycles, which reduced to five. The concentrations and length of the final products were quantified using the Qubit™ dsDNA HS Assay Kit (Invitrogen, Waltham, Massachusetts, USA) and the Bioanalyzer High Sensitivity DNA Kit (Agilent Technologies, Santa Clara, California, USA). The samples were then mixed and diluted to 50 pM and loaded onto the Ion 318 Chip, using the Ion Chef Instruments (Thermo Fisher Scientific K.K., Japan) with the Ion PGM™ Hi-Q™ View Chef Kit. The DNA sequencing was conducted with the Ion PGM™ Hi-Q™ View Sequencing Kit and the Ion PGM™ Sequencer (Thermo Fisher Scientific K.K., Japan). The sequence data were deposited in the Sequence Read Archive of the National Center for Biotechnology Information (NCBI) under accession numbers PRJNA664260.

2.4. Quantitative PCR of 16S rRNA Genes

The abundance of prokaryotes was measured using a quantitative PCR assay for 16S rRNA genes. 16S rRNA copy numbers were estimated using the same primers as described above. The PCR was performed using Mx3000P/Mx3005P qPCR Systems and KAPA SYBR Fast qPCR Kit (Agilent). The samples were made up to final volume of 20 µL, containing 10.4 µL of SYBR, 0.8 µL of forward primer (10 µL), 0.8 µL of reverse primer (10 µM), 7 µL of nuclease free water and 1 µL of extracted DNA. The initial denaturation temperature was 95 °C with an annealing temperature of 95 °C, and the extension was conducted for 1 min at 58 °C for 35 cycles. The final extension was done at 72 °C for 30 sec. Pre-experiments have proven no inhibition of PCR using the obtained DNA extracts without dilution (data not shown). Melting curves were performed to check for the specificity of the amplified PCR product. To quantify 16S rRNA gene copy numbers, standard curves were generated from a 10-fold serial dilution of the amplicons containing the target gene fragments from the Escherichia coli 16S rRNA gene. Efficiency of the qPCR was in the range of 90–110%.

2.5. Statistical/Prokaryotic Data Analysis

The prokaryotic sequence data were obtained from the Ion Torrent system and analyzed using QIIME2 [17] as follows. We used the DADA2 plugin on the QIIME2 for adapter trimming, quality filtering, denoising, chimera removal and determination of operational taxonomic units (OTUs) [18]. For the adapter trimming, the sequences were truncated by the length of the primers. The sampling depth for random subsampling to equalize the sample sizes was 7768, which was the least number of non-chimeric sequences among the samples (Table S3). Numbers of observed OTUs (Richness), Shannon diversity indices at OTU level and Pielou’s evenness at OTU level of all the samples were calculated with the QIIME2. Taxonomic data of the OTUs were obtained using a database (Greengenes 13_8 99% OTUs from 515F/806R region of sequences) which is widely used for bacterial/archaeal taxonomic classification. Overall, we obtained 196–1066 OTUs per sample.
The dissimilarities in prokaryotic community structures were analyzed by Non-metric multidimensional scaling (NMDS) based on the Brey–Curtis dissimilarity index using the metaMDS function in the vegan package [19] in R software (version 3.6.2). The difference in the prokaryotic community structures between the land-use types were tested by Permutational multivariate analysis of variance (PERMANOVA) of the factor ‘land-use’ (Farm = 1, Natural = 2) and the factor ‘site’ (A = 1, B = 2, C = 3) with the adonis function of the vegan package. Heatmaps were generated using centered and scaled counts to represent OTUs showing statistically significant differences between the land-uses (p < 0.05) using a manylm ANOVA from the package mvabund [20], using multiple linear model regression with 10,000 resampling iterations of the residual variance [21]. Venn diagrams of the OTUs within the same sites were created using the Venndiagram package in the R. Numbers of OTUs in all sites which belong to each genus (diversity in a genus) were summed within each land-use. The difference of the summations between the land-uses were calculated, then genera were ranked by the difference according to highly distributed in the natural soils or the managed soils. Redundancy analysis (RDA) was used to assess the relation between the prokaryotic communities and the environmental factors obtained from the soil properties written above. The correlations between the environmental factors and the prokaryotic communities were tested with a permutation test of 999 times using envfit function in the vegan package. The factors with correlation (p < 0.05) were shown as arrows in the plots. The correlation between soil pH and Shannon diversity index was calculated with Pearson’s correlation test by cor.test function in the R software.
The effect of the land-use and the investigated sites on total carbon content, total nitrogen content, pH, the diversity indices and the log copy number of 16S rRNA genes were analyzed using two-way analysis of variance (ANOVA) using aov function in the R. When interactions between the effect of land-uses and that of the sites were observed, we set up pairwise comparisons between the land-uses in each site using the emmeans package after fitting a model using the lm function in the R.

3. Results

3.1. Chemical Properties of the Soils

There was an interaction between the land-use and the site, regarding the total carbon contents. At Site A and Site C, the total carbon contents were relatively higher in the natural soil compared to the managed soil (Figure 1a). Similarly, the total nitrogen content of the natural soils was higher than those of the managed soils at all sites (p < 0.001, Figure 1b). The soil pH ranged from 5.00 to 8.52 and had an interaction between the land-use and the site. It was positively affected by the land-use change, at the Site A and C (Figure 1c).

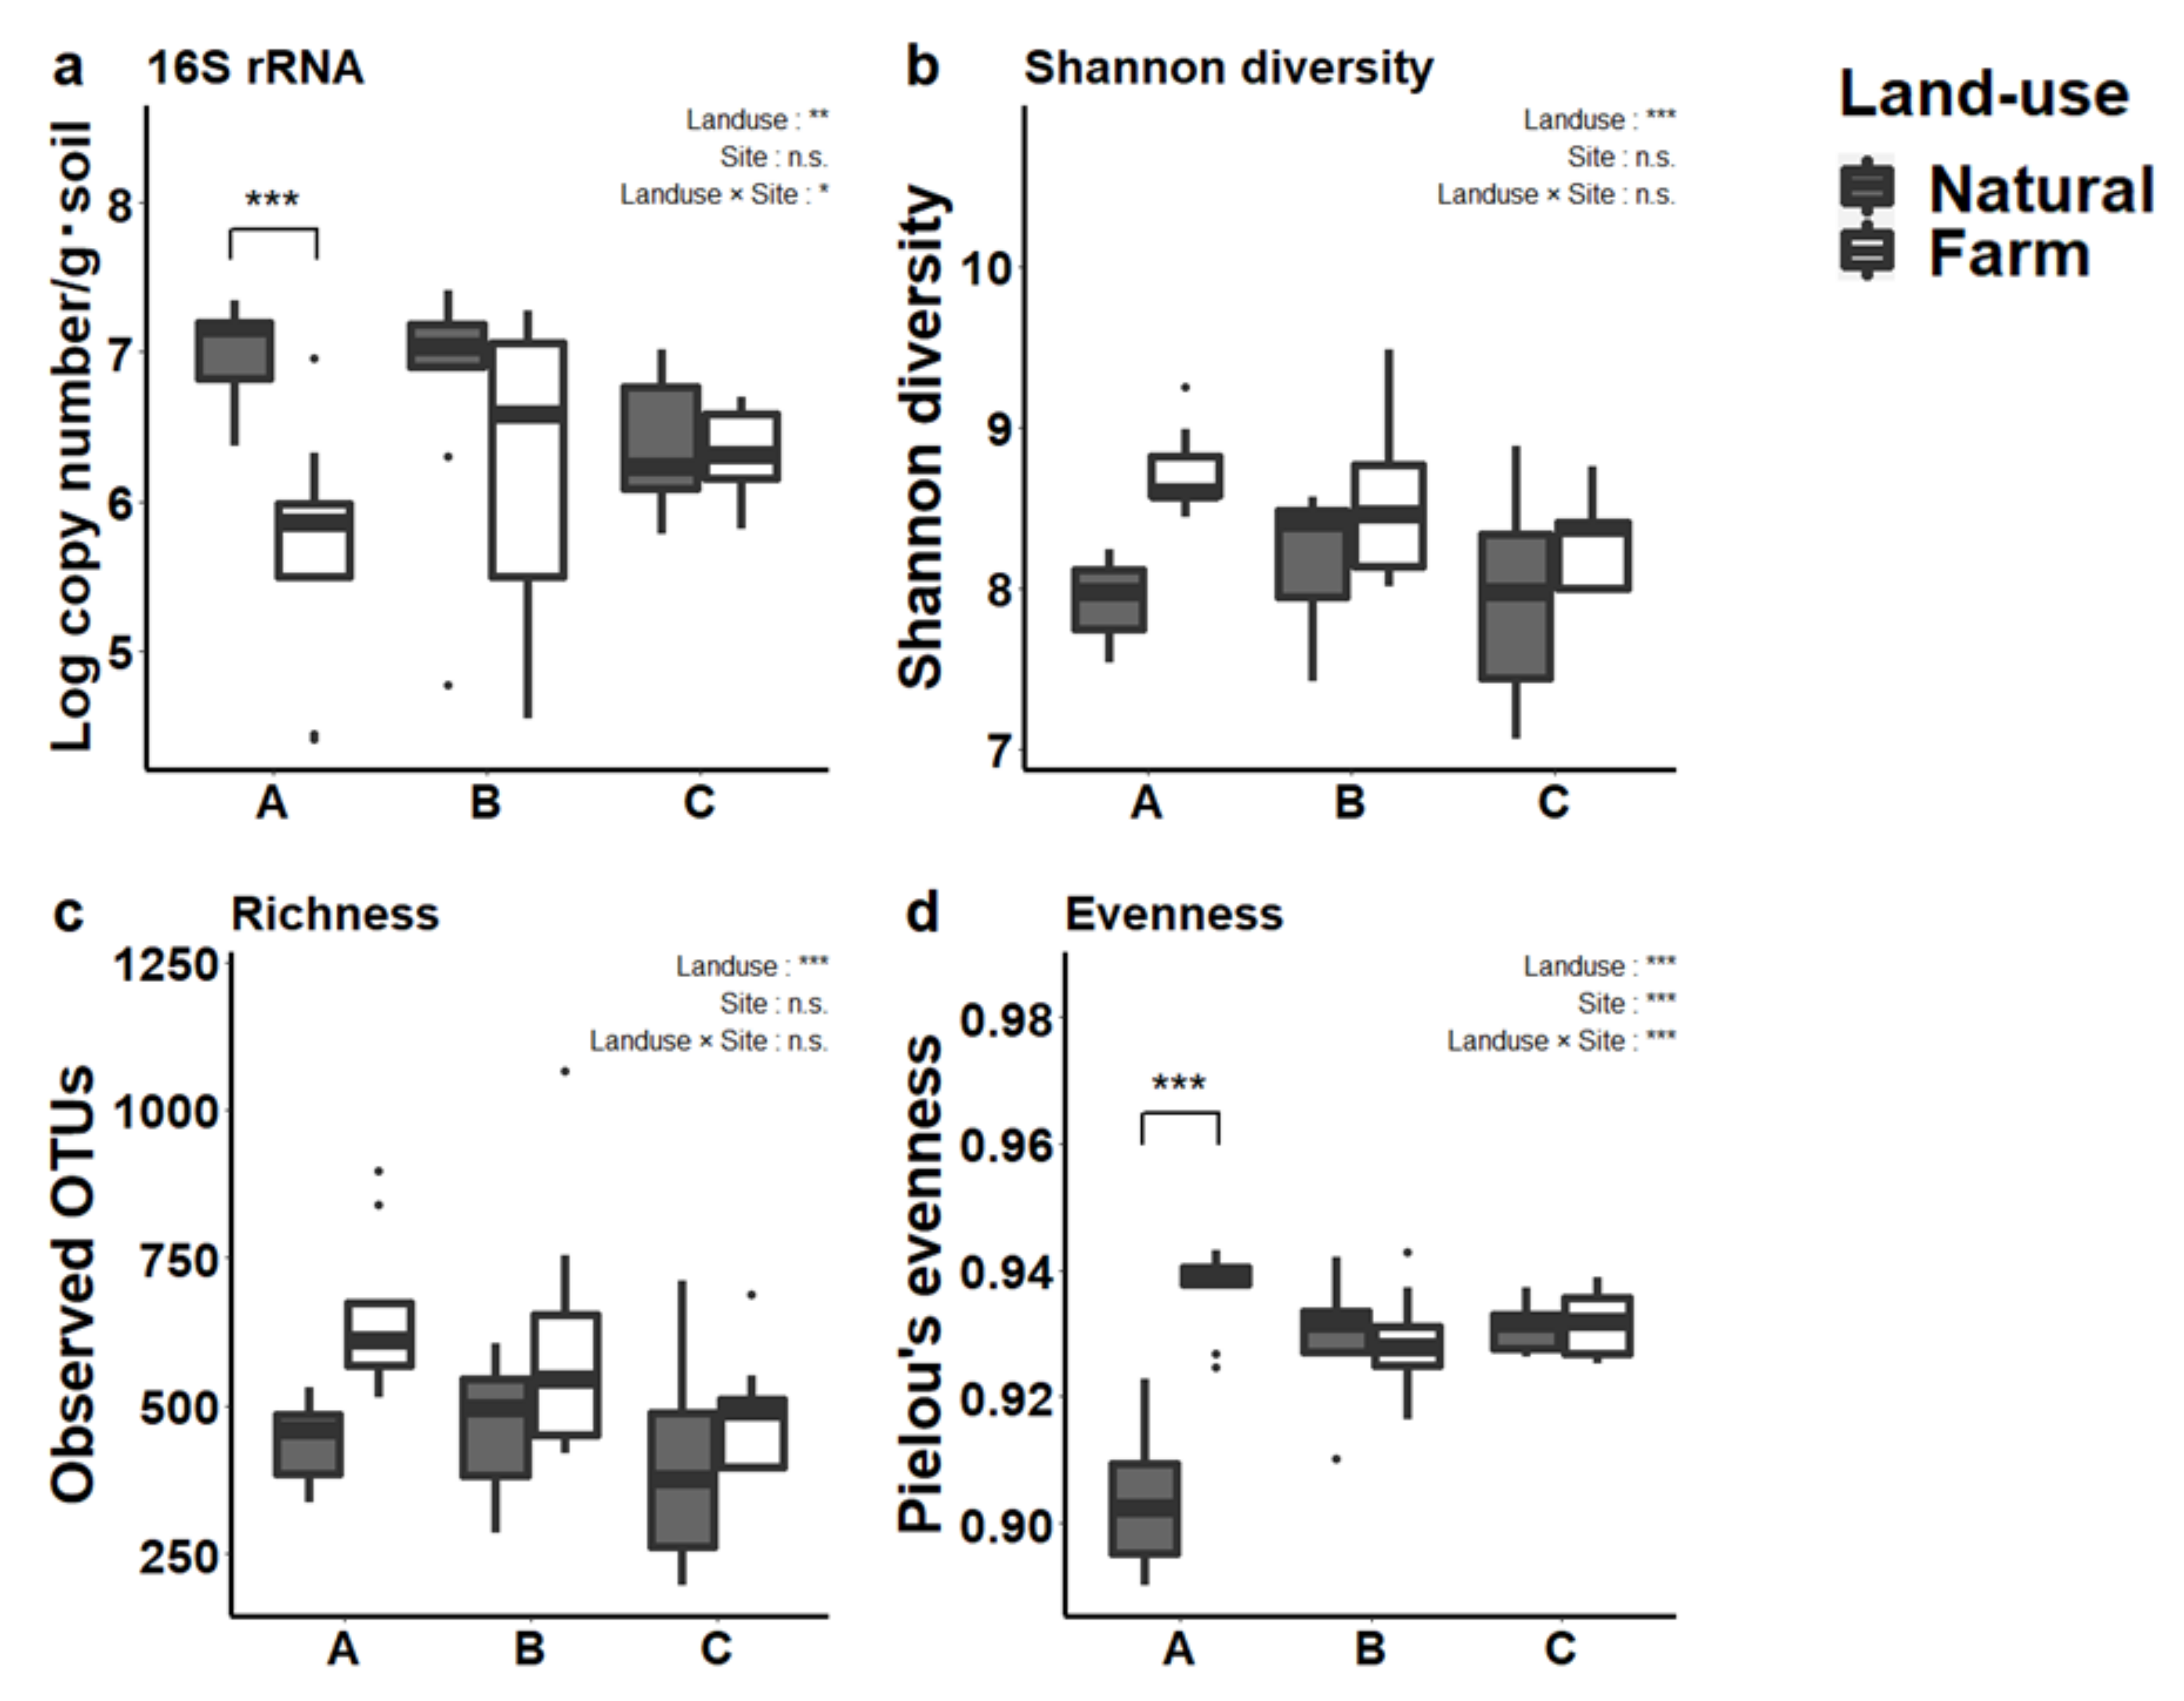
3.2. Prokaryotic Abundance and Diversity

There was an interaction between the land-use and the site regarding the copy number of 16S rRNA genes, and was lower in the managed soils compared to the natural soils in Site A (Figure 2a). At the same time, both Shannon diversity index and numbers of observed OTUs revealed a significantly higher diversity in the soils under agricultural management compared to natural soils at all sites (p < 0.001, Figure 2b,c). Additionally, there was an interaction between the land-use and the site in Pielou’s evenness, indicating a large difference by cultivation in Site A (Figure 2d).
NMDS plot analysis indicated that site specific differences of the three areas under investigation were more pronounced than effects of land-use (Figure 3d). However, for each site, there were significant differences in the prokaryotic community structures, when natural and farm soils were compared (Figure 3a–c). The differences between the land-use types were recognized with significant differences on PERMANOVA.

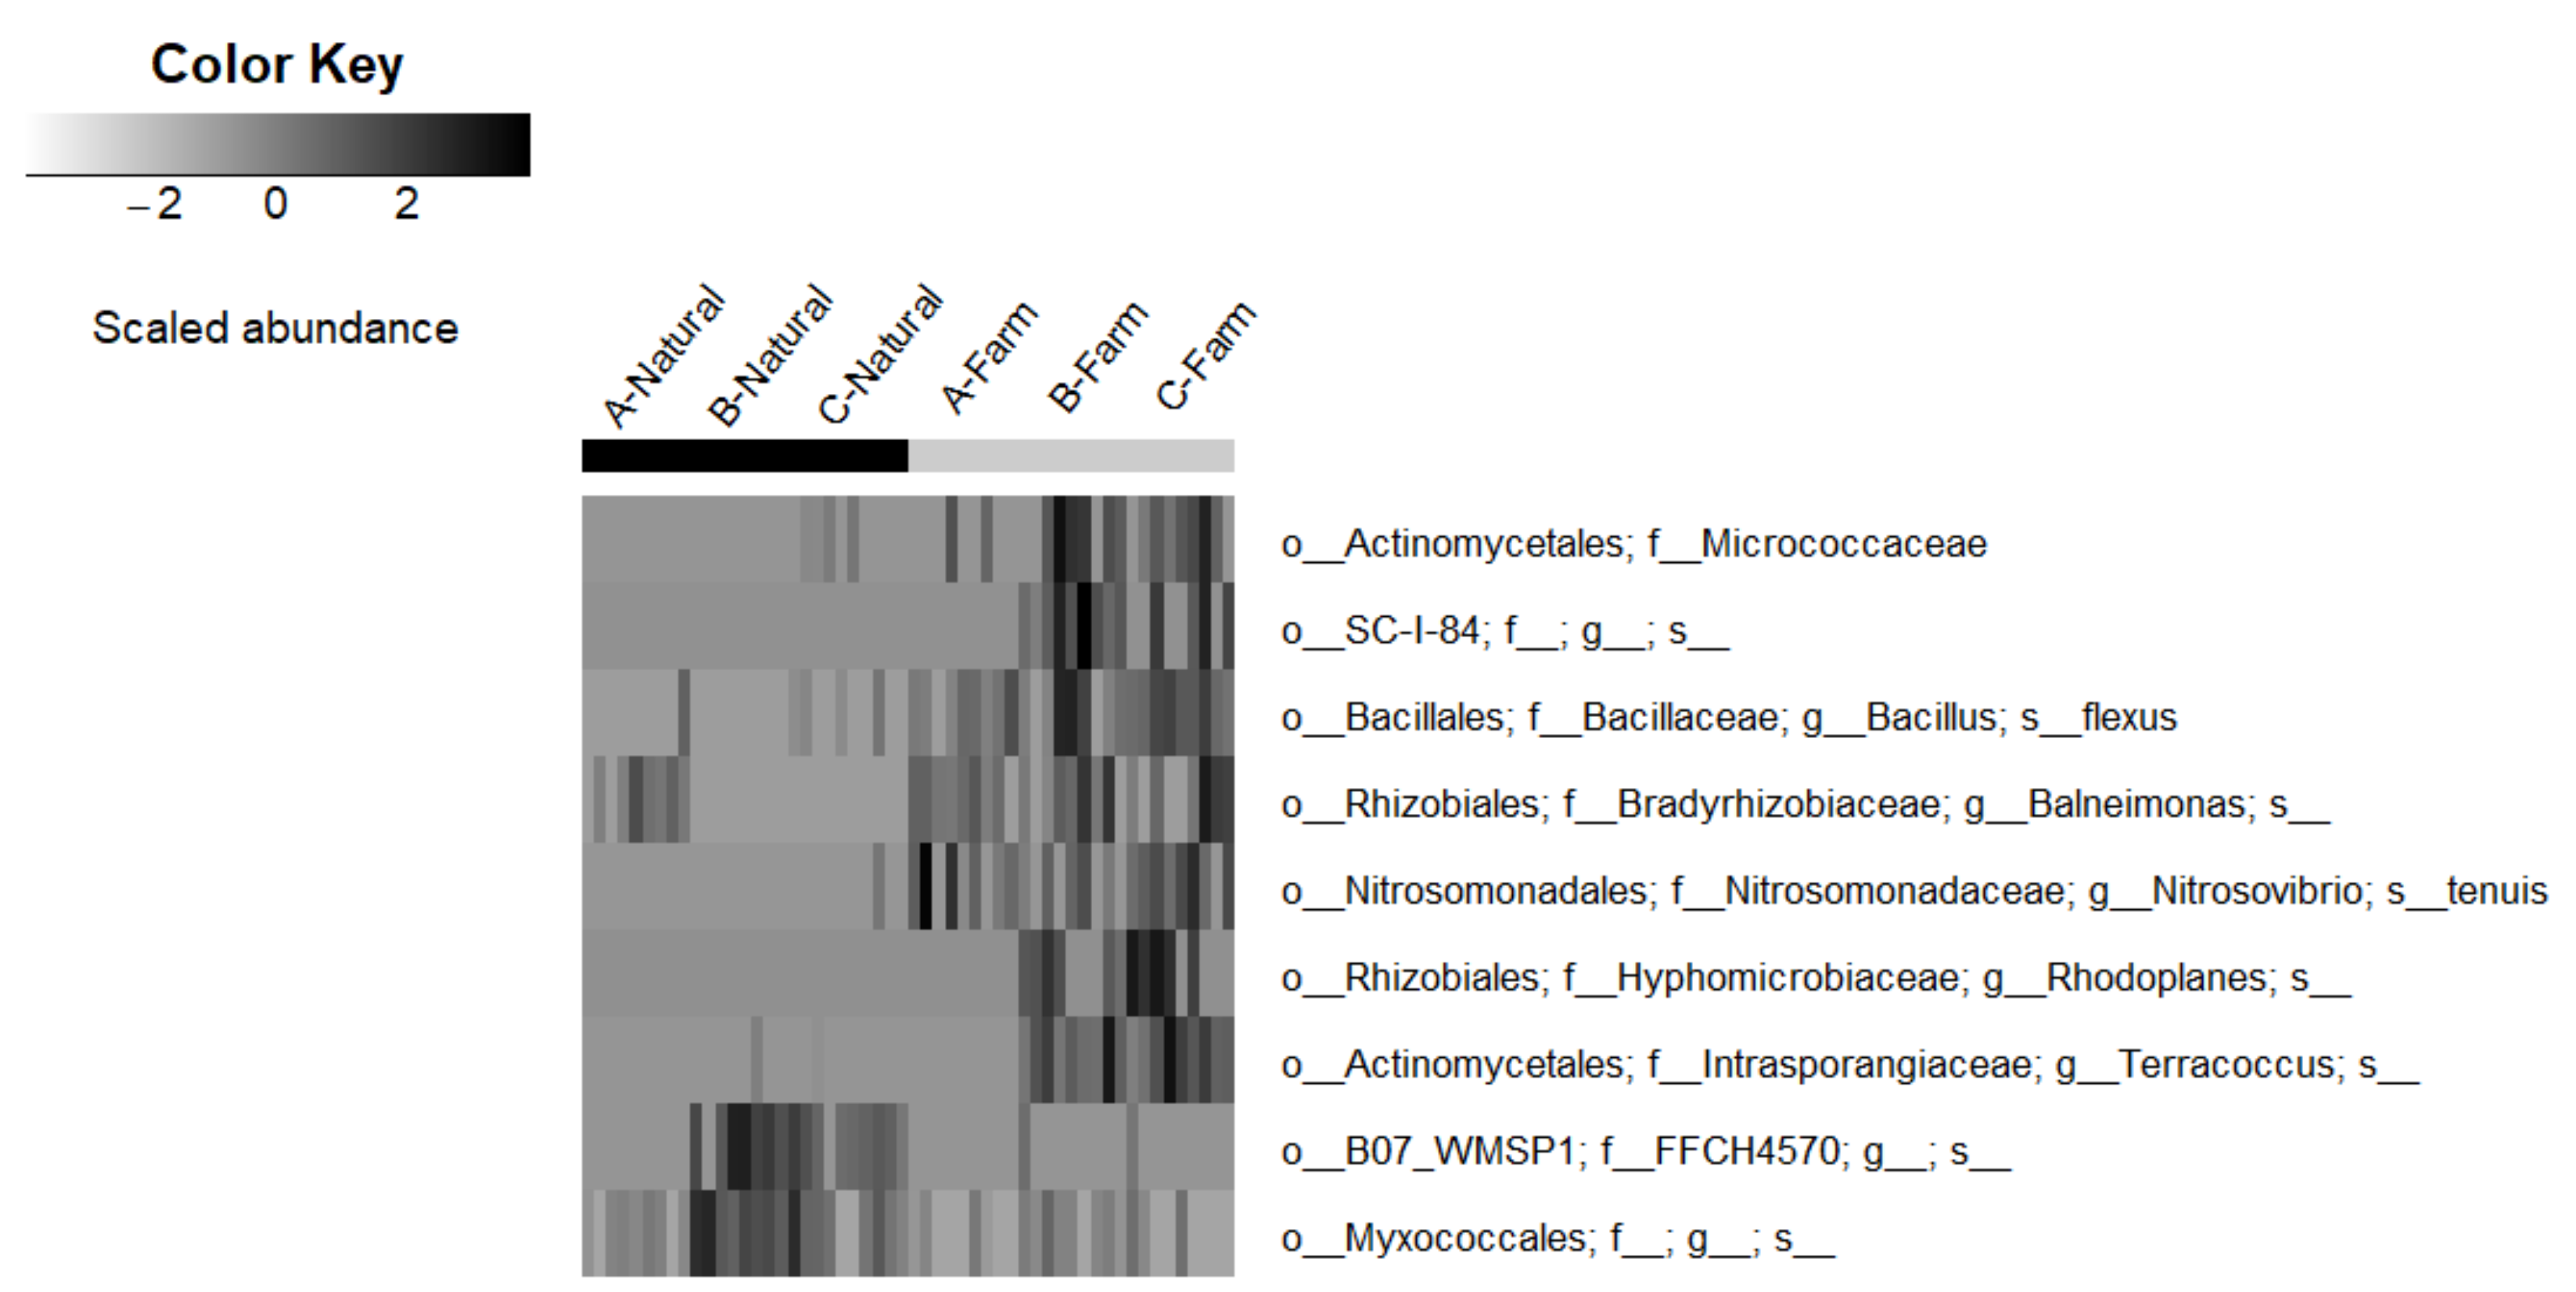
3.3. Identification of Main Prokaryotic Responders towards Management

The constructed heatmaps suggested that agricultural management affected the abundance of several prokaryotic groups regardless of the different sites, although site specific differences were also clearly visible (Figure 4; Figure S1). According to the Venn diagrams constructed for each of the three sites, we found approximately 2000 OTUs unique for farm soils (Figure S2) which exceeded the number of unique OTUs present in the natural soils at all sites. Top 20 of genera with larger numbers of OTUs in managed plots compared to the natural plots are presented in Table S5 and included Flavisolibacter, Balneimonas and Nitrospira. In accordance with the high abundance of Nitrospira in the managed soils, also for other nitrifiers including Nitrosovibrio and Nitrosotalea increased numbers of OTUs were found, although they did not rank among the Top 20 of the genera (Table S6). The heatmaps obtained from the individual sites showed that a genus within Candidatus Nitrososphaera was more abundant in the natural soils in the Site A, while an OTU within genus Nitrospira and Nitrosovibrio were more abundant in the farm soils in the Site B and the Site C, respectively (Figure S1). For sites B and C in addition to the mentioned genera also Terracoccus responded positively to the agricultural management (Figure S1). In the natural soils, the genus FFCH10602 (Chloroflexi) increased numbers of OTUs compared to the soils under agricultural management (Table S4). A similar trend was also recognized by heatmap analysis which shows that family FFCH4570 (Chloroflexi) held a significantly large abundance in the natural soils compared to the managed soils, although the OTU was not identified at genus level (Figure 4). In addition, an OTU which clustered in the family Geodermatophilaceae showed a higher abundance in the natural soils at Site A and C (Figure S1).

3.4. Identification of Major Environmental Factors Driving Shifts in Prokaryotic Communities

In redundancy analysis (RDA), it was revealed that soil pH was correlated with prokaryotic community structure in the managed soils mostly at Site A and C (Figure 5). Although managed soils tended to have both higher pH values and increased diversity values, the correlation between both factors only reached significance for Site A by the Pearson’s correlation test (r = 0.81, p < 0.001), indicating higher pH values induce a diversification of soil prokaryotic communities. In addition to soil pH, total carbon content and total nitrogen content were correlated with prokaryotic community structure at the natural soils mostly pronounced at Site A. Likewise, total C and N contents at the natural plots of Site A, were negatively correlated to Shannon diversity index (Carbon–Shannon index: r = −0.63, p < 0.01; Nitrogen–Shannon index: r = −0.67, p < 0.01).

4. Discussion

4.1. Prokaryotic Community Structures and Diversities Altered by the Cultivation

Based on the NMDS and the PERMANOVA, the effect of the sampling sites appeared to be more pronounced although the effect of the cultivation was also significant (Figure 3d). According to Kuramae et al. (2012), site-dependent effects on the soil prokaryotic community structures were attributable to the differences in the soil characteristics (i.e., soil textures) [22]. Agreeing to this previous work, the soil texture and the soil type had site-specific characteristics in our study (Table S2) and these soil characteristics were reasons for the pronounced impact of the sampling site on prokaryotic community structures. Particularly, the soil in Site A, that showed unique community structures compared to other sites, was categorized as Chromic Luvisols while the soils in Site B and Site C belonged to Undifferentiated Acrisols. Luvisols are described to harbor higher cation exchange capacity unlike Acrisols [15]. Acrisols are often characterized by their high aluminium level. These soil characteristics might be one of the reasons for the community in Site A being distinctly different from that of Site B and Site C.
In addition to such site-dependent effects, the clear impacts of the land-use changes on soil prokaryotic communities were observed (Figure 3a–c), which was consistent with previous reports demonstrating that alteration of natural sites to managed sites induces changes of prokaryotic community structure in various areas in the world [10,23,24].
In this study, the Shannon diversity index was increased by the cultivation despite the decrease in bacterial biomass (Figure 1 and Figure 2). Decreases in soil microbial biomass have been often reported to be associated with the loss in soil C and N [9,11]. Similarly, in this study, soil total C and N were decreased with cultivation, indicating the prokaryotic growth was limited by the poorer nutrient condition in the managed soils. Contrastingly, regarding the prokaryotic diversity, our result was not consistent with previous studies concluding that microbial diversity is decreased by cultivation along with the decreasing microbial biomass (e.g., [23]). To explain the reasons behind our findings (the diversification of microbes despite the loss of C and N), Tardy et al. (2015) illustrated that an intermediate stress had a positive effect on the soil microbial diversity compared to low and high stresses [24]. Likewise, according to the model presented by Giller et al. (1998), moderate stress can increase the diversity by lowering the effects of the competitive exclusion and the selection mechanism, but a decrease in soil microbial diversity may occur (i) in highly stressed environment due to dominance of particularly competitive species through competitive exclusion, and (ii) in highly unstressed environment due to dominance of specifically adapted species through selection [25]. In our study, relatively higher C and N contents in the natural soils, compared to the cultivated soils, could provide an unstressed environment for microbes, leading to the dominance of specifically adapted species and lowering prokaryotic diversity.
In fact, the dominance of such species was clearly observed in Site A, where the natural soils had lower value of Pielou’s evenness than the managed soils (Figure 2d). The postulation that the higher contents in nutrients could lead to the lower prokaryotic diversity can be also confirmed by Zeng et al. (2016), stating that increasing N contents in soils decreased the prokaryotic diversity [26]. They concluded the decreased prokaryotic diversity might be induced by a competitive exclusion among prokaryotic with increased N availability. The higher N contents of the natural soils in the present study possibly triggered competitive exclusion of microbes, causing the loss of prokaryotic diversity, though for C contents more data is needed to support this assumption.
However, it must be questioned whether the managed soils in the current study could be considered as “intermediate” stress. The C contents of the managed soils in our study were considerably low, often below the previously reported critical limit for the agricultural production (1.1%) [2]. If the C status of the managed soils in the current study, which was severely depleted in relation to agricultural productivity, might be considered as “highly stressed” condition for the soil microbiome, this needs to be studied in future experiments.
Furthermore, the control of bacterial communities by fungi might be impacted as a result of agricultural management and disturbance. It has been demonstrated that soils under disturbance (e.g., managed soils), had relatively lower total C and C/N ratio compared to natural soils and they promote increased bacteria to fungi ratios [14,27,28]. This increased bacterial abundance compared to fungal abundance might benefit the bacterial communities in the managed soils in terms of diversification. However, C/N ratio was increased in the managed soils in our study due to relatively large decrease in total N compared to decrease in total C by the cultivation. Therefore, soil C/N ratio was not the factor which increased the prokaryotic diversity in the managed soils in our study.
Our study also showed that the impact of the soil pH on the soil prokaryotic diversity varied among the sites. Decreasing soil pH was reported to act as a driver for decreasing soil prokaryotic diversity, especially for low pH soils in the range of 3.0–5.0 and for high pH soils in the range of 7.0–8.0 [8]. In the current study, the correlation coefficient between the diversity indices was site-dependent. The original soil characteristics might explain the site-dependency, for example, in the Site A, both natural and managed soils retained comparably higher pH (6.75–8.52) than in the Site B (5.00–6.47) and C (5.24–6.51). Microbial diversity was positively correlated to pH only at the Site A which had high soil pH following the previous study [8]. Lauber et al. (2009) discussed that soil pH does not affect soil prokaryotic community directly, but changes soil stoichiometry (e.g., nutrient availability, cationic metal solubility, organic C characteristics, soil moisture regimen, and salinity) and influences consequently prokaryotic community composition more in an indirect manner [29].
Thus, the combination of factors such as relatively higher pH and lower total C and N contents, observed in the managed soils in the current study, might reduce the dominance of specific species, competitive exclusion and competition against fungi. These factors’ combination could provide an “intermediate” condition for the development of diverse prokaryotic communities in sub-Saharan Africa soils after implementation of management for natural soils.

4.2. Prokaryotic Responders towards Cultivation

The diversification of prokaryotes in the managed soils could partly be explained by the prokaryotic groups related to the N cycle. For example, more OTUs related to the genus Nitrospira were found in the managed soils, indicating a positive response of this genus towards cultivation of the soils (Table S5). Nitrospira is capable to oxidize nitrite and thus contributes to nitrification [30]. In natural soils, available N is provided to the soil through processes of organic matter decomposition, while in managed soils, N is directly applied to the soil by fertilization mostly as the state of ammonium-N. This can promote nitrification and the contributing microbiota, mainly in soils with low C content as most nitrifiers are autotrophs which are outcompeted by heterotrophs in soils with high C content. This postulation is confirmed by the fact that in addition to Nitrospira also other nitrifiers including Nitrosovibrio and Nitrostalea were increased in the number of OTUs (Table S6) and the relative abundance of Nitrosovibrio (Figure 4) in the managed soils.
The total N contents in the managed soils were reduced in general, compared to the natural soils, thus the N contents in the soils were not positively correlated to the relative abundance of nitrifiers (Figure S3). Thus, the nitrifiers might be positively responding to repeated application of inorganic-N as chemical fertilizers but not to the total amount of soil N that includes organic-N.
The site-specific differences in trends of the abundance of nitrifiers between the land-uses (Figure S1) might be explained by different pH values [31]. The low organic C in the managed soils might also promoted an increase in abundance of Flavisolibacter. It was reported that the genus was increased in the soil with low soil organic C content and less light fraction organic matter (i.e., plant residues) [32]. The cultivation of crops, mostly crop rotations based on maize and legumes in the studied region induced an increase of specific OTUs. For example the increase in abundance of genus Balneimonas in the family Bradyrhizobiaceae, which holds groups of rhizobia which are capable for N fixation as well as general plant growth promotion [33] might be related to the crop cultivation. In a similar way, the increased OTUs related to the genus Bacillus might be explained.
In the natural soils, averaging across all three sites, genus FFCH10602, within the phylum Chloroflexi, was significantly higher in abundance compared to the managed soils, suggesting that the agricultural management decreased the relative abundance of this genus. Phylum Chloroflexi is a heterotrophic photosynthetic bacterial phylum which is involved in the soil C cycling [34], accounting up to 5% of the relative abundances of soil bacterial communities [35]. The reason why agricultural management reduces the number of OTUs for this genus might be due to the decrease in specific types of soil organic matter typically present in natural soils, which is a critical substrate for the genus.

5. Conclusions

Our results demonstrate that, in sub-Saharan African soils, the abundance of prokaryotes was decreased most likely because of losses of soil carbon and nitrogen induced by agricultural management compared to natural soils. In contrast, prokaryotic diversity was increased by the agricultural management, compared to the natural soils, suggesting poor nutrient condition reduces the prokaryotic abundance but not the diversity. This diversification might be related to the stress by cultivation, though research from the point of ecology would be needed to clarify the real mechanism. Soil microbes involved in nitrification benefited from the agricultural management, increased their relative abundances in the prokaryotic communities. Nitrification is often correlated to the loss of nitrogen from the soils (leaching and denitrification) [36], thus further studies are needed to develop mitigation strategies to reduce N loss from soils in sub-Saharan Africa.

Supplementary Materials

The following are available online at https://0-www-mdpi-com.brum.beds.ac.uk/article/10.3390/soilsystems5040062/s1, Figure S1. Heatmap of the OTUs significantly abundant in each land-use in each site, Figure S2. Distribution of the OTUs between the land-uses, Figure S3. Correlation between the relative abundance of nitrifiers and the total nitrogen content, Table S1. Location of the sampling sites, Table S2 Soil texture and type, Table S3. Number of filtered reads after sequencing, Table S4. Number of OTUs in genus (highly existed in the natural soils), Table S5. Number of OTUs in genus (highly existed in the farm soils), Table S6. Number of OTUs in genus.

Author Contributions

Conceptualization, T.O. and Y.U.; methodology, T.O. and Y.U.; formal analysis, T.O.; investigation, T.O.; resources, K.M.; data curation, T.O.; writing—original draft preparation, T.O.; writing—review and editing, Y.U., M.S. and S.S.; visualization, T.O.; supervision, Y.U.; project administration, Y.U.; funding acquisition, Y.U. and M.S. All authors have read and agreed to the published version of the manuscript.

Funding

This work was supported by KAKENHI 21H02324 and 18KK0183.

Institutional Review Board Statement

Not applicable.

Informed Consent Statement

Not applicable.

Data Availability Statement

The data presented in this study are available on request from the corresponding author. The data are not publicly available to protect the privacy of the farmers who allowed us to sample their soils. However, the fastq data related to the soil microbiome are available on NCBI PRJNA664260.

Acknowledgments

We appreciate Maiko Akari, Tsukino Ito, Akari Kimura, Rina Tsuboi, Juri Motoki, Wang Ji and Toru Hamamoto who helped during this work.

Conflicts of Interest

The authors declare no conflict of interest.

References

  1. Tully, K.; Sullivan, C.; Weil, R.; Sanchez, P. The State of Soil Degradation in Sub-Saharan Africa: Baselines, Trajectories, and Solutions. Sustainability 2015, 7, 6523–6552. [Google Scholar] [CrossRef] [Green Version]
  2. Smith, J.; Abegaz, A.; Matthews, R.B.; Subedi, M.; Orskov, E.R.; Tumwesige, V.; Smith, P. What Is the Potential for Biogas Digesters to Improve Soil Carbon Sequestration in Sub-Saharan Africa? Comparison with Other Uses of Organic Residues. Biomass Bioenergy 2014, 70, 73–86. [Google Scholar] [CrossRef] [Green Version]
  3. Berg, G.; Rybakova, D.; Fischer, D.; Cernava, T.; Vergès, M.-C.C.; Charles, T.; Chen, X.; Cocolin, L.; Eversole, K.; Corral, G.H.; et al. Microbiome Definition Re-Visited: Old Concepts and New Challenges. Microbiome 2020, 8, 103. [Google Scholar] [CrossRef]
  4. Allan, E.; Manning, P.; Alt, F.; Binkenstein, J.; Blaser, S.; Blüthgen, N.; Böhm, S.; Grassein, F.; Hölzel, N.; Klaus, V.H.; et al. Land Use Intensification Alters Ecosystem Multifunctionality via Loss of Biodiversity and Changes to Functional Composition. Ecol. Lett. 2015, 18, 834–843. [Google Scholar] [CrossRef] [PubMed]
  5. Delgado-Baquerizo, M.; Maestre, F.T.; Reich, P.B.; Jeffries, T.C.; Gaitan, J.J.; Encinar, D.; Berdugo, M.; Campbell, C.D.; Singh, B.K. Microbial Diversity Drives Multifunctionality in Terrestrial Ecosystems. Nat. Commun. 2016, 7, 10541. [Google Scholar] [CrossRef] [Green Version]
  6. Schloter, M.; Nannipieri, P.; Sørensen, S.J.; van Elsas, J.D. Microbial Indicators for Soil Quality. Biol. Fertil. Soils 2018, 54, 1–10. [Google Scholar] [CrossRef] [Green Version]
  7. Delgado-Baquerizo, M.; Maestre, F.T.; Reich, P.B.; Trivedi, P.; Osanai, Y.; Liu, Y.-R.; Hamonts, K.; Jeffries, T.C.; Singh, B.K. Carbon Content and Climate Variability Drive Global Soil Bacterial Diversity Patterns. Ecol. Monogr. 2016, 86, 373–390. [Google Scholar] [CrossRef]
  8. Kaiser, K.; Wemheuer, B.; Korolkow, V.; Wemheuer, F.; Nacke, H.; Schöning, I.; Schrumpf, M.; Daniel, R. Driving Forces of Soil Bacterial Community Structure, Diversity, and Function in Temperate Grasslands and Forests. Sci. Rep. 2016, 6, 33696. [Google Scholar] [CrossRef] [Green Version]
  9. Zhang, Q.; Wu, J.; Yang, F.; Lei, Y.; Zhang, Q.; Cheng, X. Alterations in Soil Microbial Community Composition and Biomass Following Agricultural Land Use Change. Sci. Rep. 2016, 6, 36587. [Google Scholar] [CrossRef] [PubMed] [Green Version]
  10. Kamgan Nkuekam, G.; Cowan, D.A.; Valverde, A. Arable Agriculture Changes Soil Microbial Communities in the South African Grassland Biome. S. Afr. J. Sci. 2018, 114, 1–5. [Google Scholar] [CrossRef]
  11. Katulanda, P.M.; Walley, F.L.; Janzen, H.H.; Helgason, B.L. Land Use Legacy Regulates Microbial Community Composition in Transplanted Chernozems. Appl. Soil Ecol. 2018, 129, 13–23. [Google Scholar] [CrossRef]
  12. Lauber, C.L.; Strickland, M.S.; Bradford, M.A.; Fierer, N. The Influence of Soil Properties on the Structure of Bacterial and Fungal Communities across Land-Use Types. Soil Biol. Biochem. 2008, 40, 2407–2415. [Google Scholar] [CrossRef]
  13. Hu, S.J.; van Bruggen, A.H.C.; Grünwald, N.J. Dynamics of Bacterial Populations in Relation to Carbon Availability in a Residue-Amended Soil. Appl. Soil Ecol. 1999, 13, 21–30. [Google Scholar] [CrossRef]
  14. Delgado-Baquerizo, M.; Reich, P.B.; Khachane, A.N.; Campbell, C.D.; Thomas, N.; Freitag, T.E.; Abu Al-Soud, W.; Sørensen, S.; Bardgett, R.D.; Singh, B.K. It Is Elemental: Soil Nutrient Stoichiometry Drives Bacterial Diversity: C:N:P Stoichiometry Drives Bacterial Diversity. Environ. Microbiol. 2017, 19, 1176–1188. [Google Scholar] [CrossRef] [PubMed]
  15. Dewitte, O.; Jones, A.; Spaargaren, O.; Breuning-Madsen, H.; Brossard, M.; Dampha, A.; Deckers, J.; Gallali, T.; Hallett, S.; Jones, R.; et al. Harmonisation of the Soil Map of Africa at the Continental Scale. Geoderma 2013, 211–212, 138–153. [Google Scholar] [CrossRef] [Green Version]
  16. Caporaso, J.G.; Lauber, C.L.; Walters, W.A.; Berg-Lyons, D.; Lozupone, C.A.; Turnbaugh, P.J.; Fierer, N.; Knight, R. Global Patterns of 16S RRNA Diversity at a Depth of Millions of Sequences per Sample. Proc. Natl. Acad. Sci. USA 2011, 108, 4516–4522. [Google Scholar] [CrossRef] [PubMed] [Green Version]
  17. Caporaso, J.G.; Kuczynski, J.; Stombaugh, J.; Bittinger, K.; Bushman, F.D.; Costello, E.K.; Fierer, N.; Peña, A.G.; Goodrich, J.K.; Gordon, J.I.; et al. QIIME Allows Analysis of High-Throughput Community Sequencing Data. Nat. Methods 2010, 7, 335–336. [Google Scholar] [CrossRef] [PubMed] [Green Version]
  18. Callahan, B.J.; McMurdie, P.J.; Rosen, M.J.; Han, A.W.; Johnson, A.J.A.; Holmes, S.P. DADA2: High-Resolution Sample Inference from Illumina Amplicon Data. Nat. Methods 2016, 13, 581–583. [Google Scholar] [CrossRef] [PubMed] [Green Version]
  19. Dixon, P. VEGAN, a Package of R Functions for Community Ecology. J. Veg. Sci. 2003, 14, 927–930. [Google Scholar] [CrossRef]
  20. Wang, Y.; Naumann, U.; Wright, S.T.; Warton, D.I. Mvabund—An R Package for Model-Based Analysis of Multivariate Abundance Data. Methods Ecol. Evol. 2012, 3, 471–474. [Google Scholar] [CrossRef]
  21. Jacquiod, S.; Stenbæk, J.; Santos, S.S.; Winding, A.; Sørensen, S.J.; Priemé, A. Metagenomes Provide Valuable Comparative Information on Soil Microeukaryotes. Res. Microbiol. 2016, 167, 436–450. [Google Scholar] [CrossRef] [PubMed]
  22. Kuramae, E.E.; Yergeau, E.; Wong, L.C.; Pijl, A.S.; Veen, J.A.; Kowalchuk, G.A. Soil Characteristics More Strongly Influence Soil Bacterial Communities than Land-Use Type. FEMS Microbiol. Ecol. 2012, 79, 12–24. [Google Scholar] [CrossRef] [Green Version]
  23. Wang, C.; Liu, D.; Bai, E. Decreasing Soil Microbial Diversity Is Associated with Decreasing Microbial Biomass under Nitrogen Addition. Soil Biol. Biochem. 2018, 120, 126–133. [Google Scholar] [CrossRef]
  24. Tardy, V.; Spor, A.; Mathieu, O.; Lévèque, J.; Terrat, S.; Plassart, P.; Regnier, T.; Bardgett, R.D.; van der Putten, W.H.; Roggero, P.P.; et al. Shifts in Microbial Diversity through Land Use Intensity as Drivers of Carbon Mineralization in Soil. Soil Biol. Biochem. 2015, 90, 204–213. [Google Scholar] [CrossRef]
  25. Giller, K.E.; Witter, E.; Mcgrath, S.P. Toxicity of Heavy Metals to Microorganisms and Microbial Processes in Agricultural Soils: A Review. Soil Biol. Biochem. 1998, 30, 1389–1414. [Google Scholar] [CrossRef]
  26. Zeng, J.; Liu, X.; Song, L.; Lin, X.; Zhang, H.; Shen, C.; Chu, H. Nitrogen Fertilization Directly Affects Soil Bacterial Diversity and Indirectly Affects Bacterial Community Composition. Soil Biol. Biochem. 2016, 92, 41–49. [Google Scholar] [CrossRef]
  27. Bardgett, R.D.; McAlister, E. The Measurement of Soil Fungal: Bacterial Biomass Ratios as an Indicator of Ecosystem Self-Regulation in Temperate Meadow Grasslands. Biol. Fertil. Soils 1999, 29, 282–290. [Google Scholar] [CrossRef]
  28. de Vries, F.T.; Manning, P.; Tallowin, J.R.B.; Mortimer, S.R.; Pilgrim, E.S.; Harrison, K.A.; Hobbs, P.J.; Quirk, H.; Shipley, B.; Cornelissen, J.H.C.; et al. Abiotic Drivers and Plant Traits Explain Landscape-Scale Patterns in Soil Microbial Communities. Ecol. Lett. 2012, 15, 1230–1239. [Google Scholar] [CrossRef]
  29. Lauber, C.L.; Hamady, M.; Knight, R.; Fierer, N. Pyrosequencing-Based Assessment of Soil PH as a Predictor of Soil Bacterial Community Structure at the Continental Scale. Appl. Environ. Microbiol. 2009, 75, 5111–5120. [Google Scholar] [CrossRef] [Green Version]
  30. Pester, M.; Rattei, T.; Flechl, S.; Gröngröft, A.; Richter, A.; Overmann, J.; Reinhold-Hurek, B.; Loy, A.; Wagner, M. AmoA-Based Consensus Phylogeny of Ammonia-Oxidizing Archaea and Deep Sequencing of AmoA Genes from Soils of Four Different Geographic Regions. Environ. Microbiol. 2012, 14, 525–539. [Google Scholar] [CrossRef] [PubMed] [Green Version]
  31. Li, Y.; Chapman, S.J.; Nicol, G.W.; Yao, H. Nitrification and Nitrifiers in Acidic Soils. Soil Biol. Biochem. 2018, 116, 290–301. [Google Scholar] [CrossRef]
  32. Ramírez, P.B.; Fuentes-Alburquenque, S.; Díez, B.; Vargas, I.; Bonilla, C.A. Soil Microbial Community Responses to Labile Organic Carbon Fractions in Relation to Soil Type and Land Use along a Climate Gradient. Soil Biol. Biochem. 2020, 141, 107692. [Google Scholar] [CrossRef]
  33. Itakura, M.; Saeki, K.; Omori, H.; Yokoyama, T.; Kaneko, T.; Tabata, S.; Ohwada, T.; Tajima, S.; Uchiumi, T.; Honnma, K.; et al. Genomic Comparison of Bradyrhizobium Japonicum Strains with Different Symbiotic Nitrogen-Fixing Capabilities and Other Bradyrhizobiaceae Members. ISME J. 2009, 3, 326–339. [Google Scholar] [CrossRef]
  34. Hug, L.A.; Castelle, C.J.; Wrighton, K.C.; Thomas, B.C.; Sharon, I.; Frischkorn, K.R.; Williams, K.H.; Tringe, S.G.; Banfield, J.F. Community Genomic Analyses Constrain the Distribution of Metabolic Traits across the Chloroflexi Phylum and Indicate Roles in Sediment Carbon Cycling. Microbiome 2013, 1, 22. [Google Scholar] [CrossRef] [Green Version]
  35. Delgado-Baquerizo, M.; Oliverio, A.M.; Brewer, T.E.; Benavent-González, A.; Eldridge, D.J.; Bardgett, R.D.; Maestre, F.T.; Singh, B.K.; Fierer, N. A Global Atlas of the Dominant Bacteria Found in Soil. Science 2018, 359, 320–325. [Google Scholar] [CrossRef] [Green Version]
  36. Norton, J.; Ouyang, Y. Controls and Adaptive Management of Nitrification in Agricultural Soils. Front. Microbiol. 2019, 10, 1931. [Google Scholar] [CrossRef] [Green Version]
Figure 1. Basic properties of the soils. The data were analyzed with two-way ANOVA: (a) Total carbon content; (b) Total nitrogen content; (c) Soil pH. When there was a significant interaction between the land-uses and the sites, pairwise comparison tests were performed for the land-uses for each site and the significances are shown as *, ** or ***, representing p < 0.05, p < 0.01, or p < 0.001, respectively. The upper/lower whisker indicates the hinge to the highest/lowest value that is within 1.5 times the interquartile range (IQR) of the hinge, where the IQR is the distance between the first and third quartiles. Points outside the IQR are shown as outliers.
Soilsystems 05 00062 g001
Figure 2. Prokaryotic abundance and diversity. The data were analyzed with two-way ANOVA: (a) 16S rRNA gene abundance; (b) Shannon diversity index; (c) Number of observed OTUs; (d) Pielou’s evenness. When there was an interaction between the land-uses and the sites, significant differences between the two land-use types within each site are shown with p-values as *, ** or ***, representing p < 0.05, p < 0.01, or p < 0.001, respectively. The upper/lower whisker indicates the hinge to the highest/lowest value that is within 1.5 times the interquartile range (IQR) of the hinge, where the IQR is the distance between the first and third quartiles. Points outside the IQR are shown as outliers.
Soilsystems 05 00062 g002
Figure 3. Difference in 16S rRNA community structures: (ac) NMDS plots of the 16S rRNA community structures in each site at OTU level. The effect of land-use change was tested with PERMANOVA; (d) These communities of all sites are plotted in a same scaling with the result of PERMANOVA. The significances are shown as **, representing p < 0.01.
Soilsystems 05 00062 g003
Figure 4. Heatmap of the OTUs significantly abundant in each land-use. All OTUs were tested by mvabund on R, and OTUs with significantly larger relative abundances in each land-uses were plotted in the figure. The heatmap was created by scaling the abundances of the OTUs and colored by the scaled abundances.
Soilsystems 05 00062 g004
Figure 5. Effects of environmental factors on soil prokaryotic community structures: (ac) RDA plots of prokaryotes in each site at OTU level. The arrows illustrate significant correlations (p < 0.05) between the prokaryotic communities and the environmental factors by 999 times permutation test.
Soilsystems 05 00062 g005
Publisher’s Note: MDPI stays neutral with regard to jurisdictional claims in published maps and institutional affiliations.

