Article

A First Insight on the Interaction between Desiccation Cracking and Water Transfer in a Luvisol of Belgium

by
Njaka Ralaizafisoloarivony
1,*,
Aurore Degré
1,
Benoît Mercatoris
1,
Angélique Léonard
2,
Dominique Toye
2 and
Robert Charlier
3
1
Gembloux Agro-Bio Tech, TERRA Teaching and Research Center, University of Liège, 4000 Liège, Belgium
2
Chemical Engineering, University of Liège, 4000 Liège, Belgium
3
Department ArGEnCo, University of Liège, 4000 Liège, Belgium
*
Author to whom correspondence should be addressed.
Submission received: 22 July 2021 / Revised: 26 September 2021 / Accepted: 8 October 2021 / Published: 18 October 2021

Abstract

:
The present paper presents the interactions between water retention/evaporation and cracking during the desiccation of intact and disturbed Belgian Luvisol. The disturbed (DS) and undisturbed (NDS) samples (reduced-tillage-residue-in (RTRI) and conventional-tillage-residue-out (CTRO)) were collected from an agricultural field in Gembloux, Wallonia, Belgium. The drying experiment took place in controlled laboratory conditions at 25 °C. Moisture content, soil suction and surface cracks were monitored with a precision balance, a tensiometer and a digital camera, respectively. The image processing and analysis were performed using PCAS® and ImageJ® software. The results showed that crack formation was initiated at a stronger negative suction and a lower water content (Wc) in DS > CTRO > RTRI. The suction and the crack propagation were positively correlated until 300 kPa for the DS and far beyond the wilting point for the NDS. For the NDS, the cracking accelerated after reaching the critical water content (~20% Wc) which arrived at the end of the plateau of evaporation (40 h after crack initiation). The Krischer curve revealed that the soil pore size > 50 µm, and that it is likely that cracks are important parameters for soil permeability. The soil structure and soil fibre content could influence the crack formation dynamic during drying. The agricultural tillage management also influences the crack propagation. As retention and conductivity functions are affected by cracks, it is likely that the movement of fluids in the soil will also be affected by the cracks following a desiccation period (i.e., when the cracked soil is rewetted).

1. Introduction

Crack propagation is an important natural phenomenon in agricultural fields, especially in fine-grained soils such as the Luvisol of Belgium [1,2]. Cracks may act as a bypass for water and solutes, lower the soil water content and increase its matric suction [3]. Factors affecting cracks are numerous and complex (e.g., mineralogy, temperature, moisture, thickness and other boundary conditions) [4,5]. However, it is commonly observed that the processes of crack initiation and propagation are water dependent [6]. Cracks form when the tensile strength of the soil is reached during desiccation [5].
The physical (structure, porosity and aggregates) and chemical properties (pH, organic carbon, cations and anions) of soil are supposed to influence the crack formation/propagation [7]. These parameters are essentially affected by agricultural practices. Tillage and residue management influence the soil porosity and the fibre/organic matter content, which in turn affects the movement of water and gas [8]. For instance, the addition of organic matter and biochar were found to decrease crack formation [8,9].
Tillage also influences the soil structural heterogeneity and the soil compressibility, which can affect the formation and propagation of cracks [10,11]. In fact, soil heterogeneity can affect the distribution of water, creating a weak area during shrinking [12,13]. Moreover, tillage breaks soil aggregates, modifies the structure, which can lead to soil compaction, and changes the soil permeability [7,14]. However, there are still some gaps in understanding the interaction between the cracks and soil hydraulic properties under varied agricultural practices. Lakshmikantha et al. [4] and Tang et al. [11] were the pioneers of analysing cracks and soil water properties. Later studies have found some links between the crack maximum width and water permeability [3,15].
Some authors have reported that under saturated surface conditions the evaporation depended only on the vapour pressure difference between the atmosphere and the sample surface (excluding cracks) [16,17], and others have mentioned the possible effect of macropores (and cracks), as they assure the water connectivity between the saturated and partially air-filled soil (which is called the drying front) [18].
Despite previous researchers having found that cracks enlarge the soil porosity, increase the soil permeability and reduce the air entry value (AEV), which is the minimum suction at which air starts to enter the largest pores [19], it is still difficult to include cracks in the soil water retention curve (SWRC) and permeability due to their geometric complexity. Moreover, cracks change in their configuration and size during soil desiccation [15]. This requires that researchers include a dynamical analysis of cracks in parallel to a soil hydrodynamical assessment [19]. However, due to crack complexity in form, size, configuration and distribution, crack analysis is often neglected in soil hydrology research, especially as agricultural science is concerned [7,20].
Therefore, this study assesses the dynamics of soil cracking and soil hydrology during drying in a controlled experiment for one soil (Luvisol) under three contrasted treatments (two types of samples under different management systems, and one type of disturbed/mixed sample). Each treatment has three replicates. The purpose of using a remolded sample is to question the impact of the agricultural soil structure. Furthermore, many cracking studies have utilised disturbed samples to represent agricultural soil [4,6,11]. Therefore, this study assesses the differences between the disturbed and undisturbed samples. Moreover, this study will also evaluate the potential interaction between soil cracking and soil hydrology and will discuss the observed differences among the treatments.

2. Materials and Methods

2.1. Sample Collection and Preparation

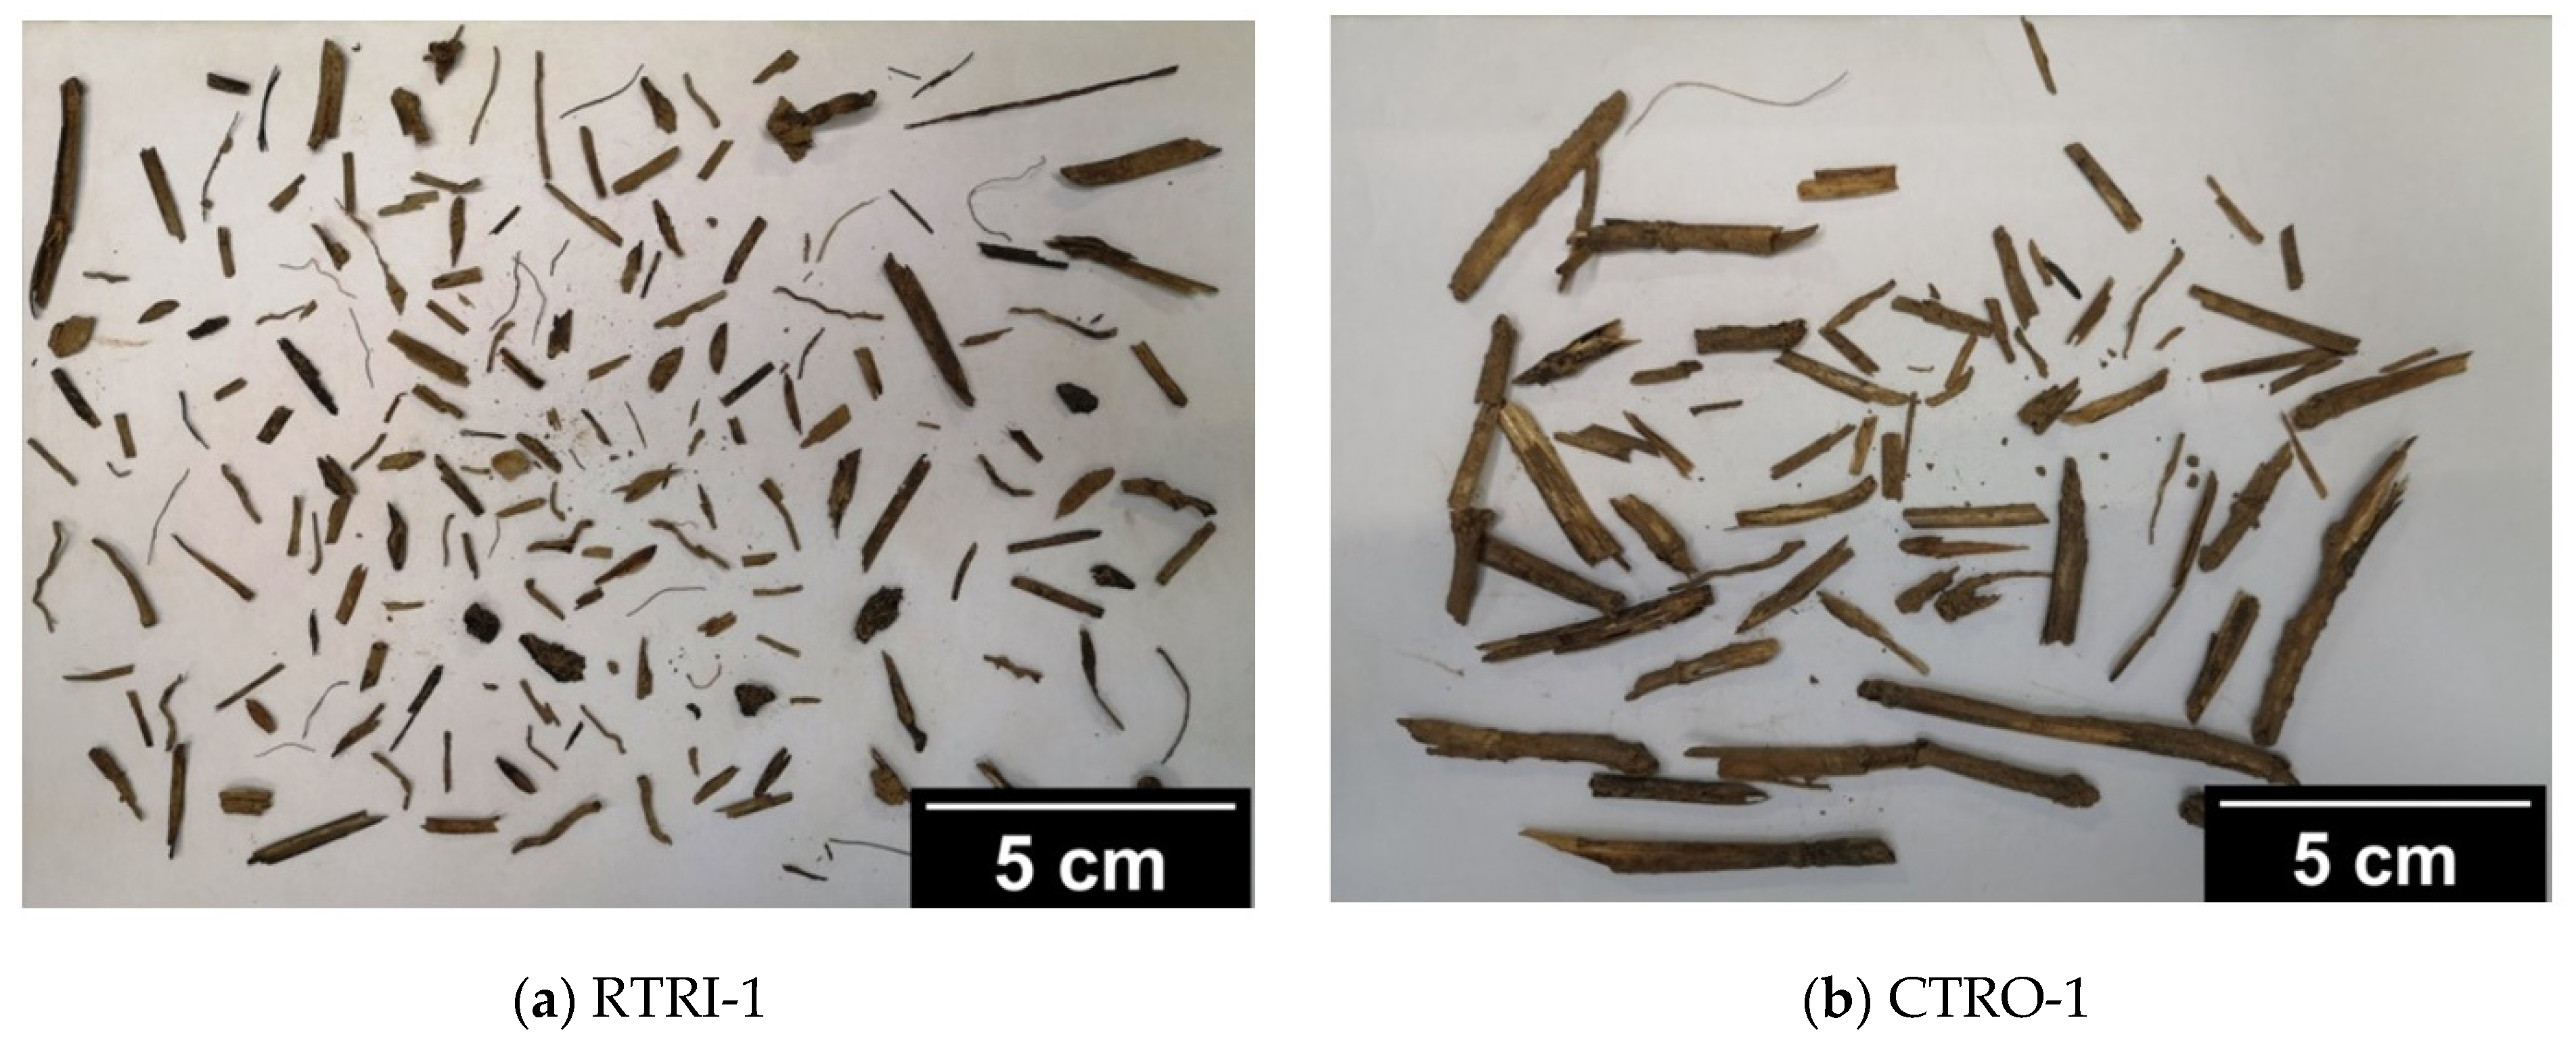
We collected nine topsoil (0–15 cm) samples composed of three reduced-tillage-residue-in (RTRI), three conventional-tillage-residue-out (CTRO) and three disturbed soils (DS) (composite remoulded sieved samples from RTRI and CTRO). The remoulded samples are interesting, as they erase the tillage history and thus give a reference for the comparison of results. The RTRI and CTRO plots were each 15 m × 45 m and located 2 m apart. The samples were collected from an agricultural field in Gembloux, Wallonia, Belgium. The crop rotation in the study area was composed of cover crop (rapeseed: Brassica napus L.; mustard: Brassica nigra L.; oats: Avena sativa L.; peas: Pisum sativum L.), maize (Zea mays), winter wheat (Triticum aestivum L.) and sugar beet (Beta vulgaris L.). The preceding crop was sugar beet.
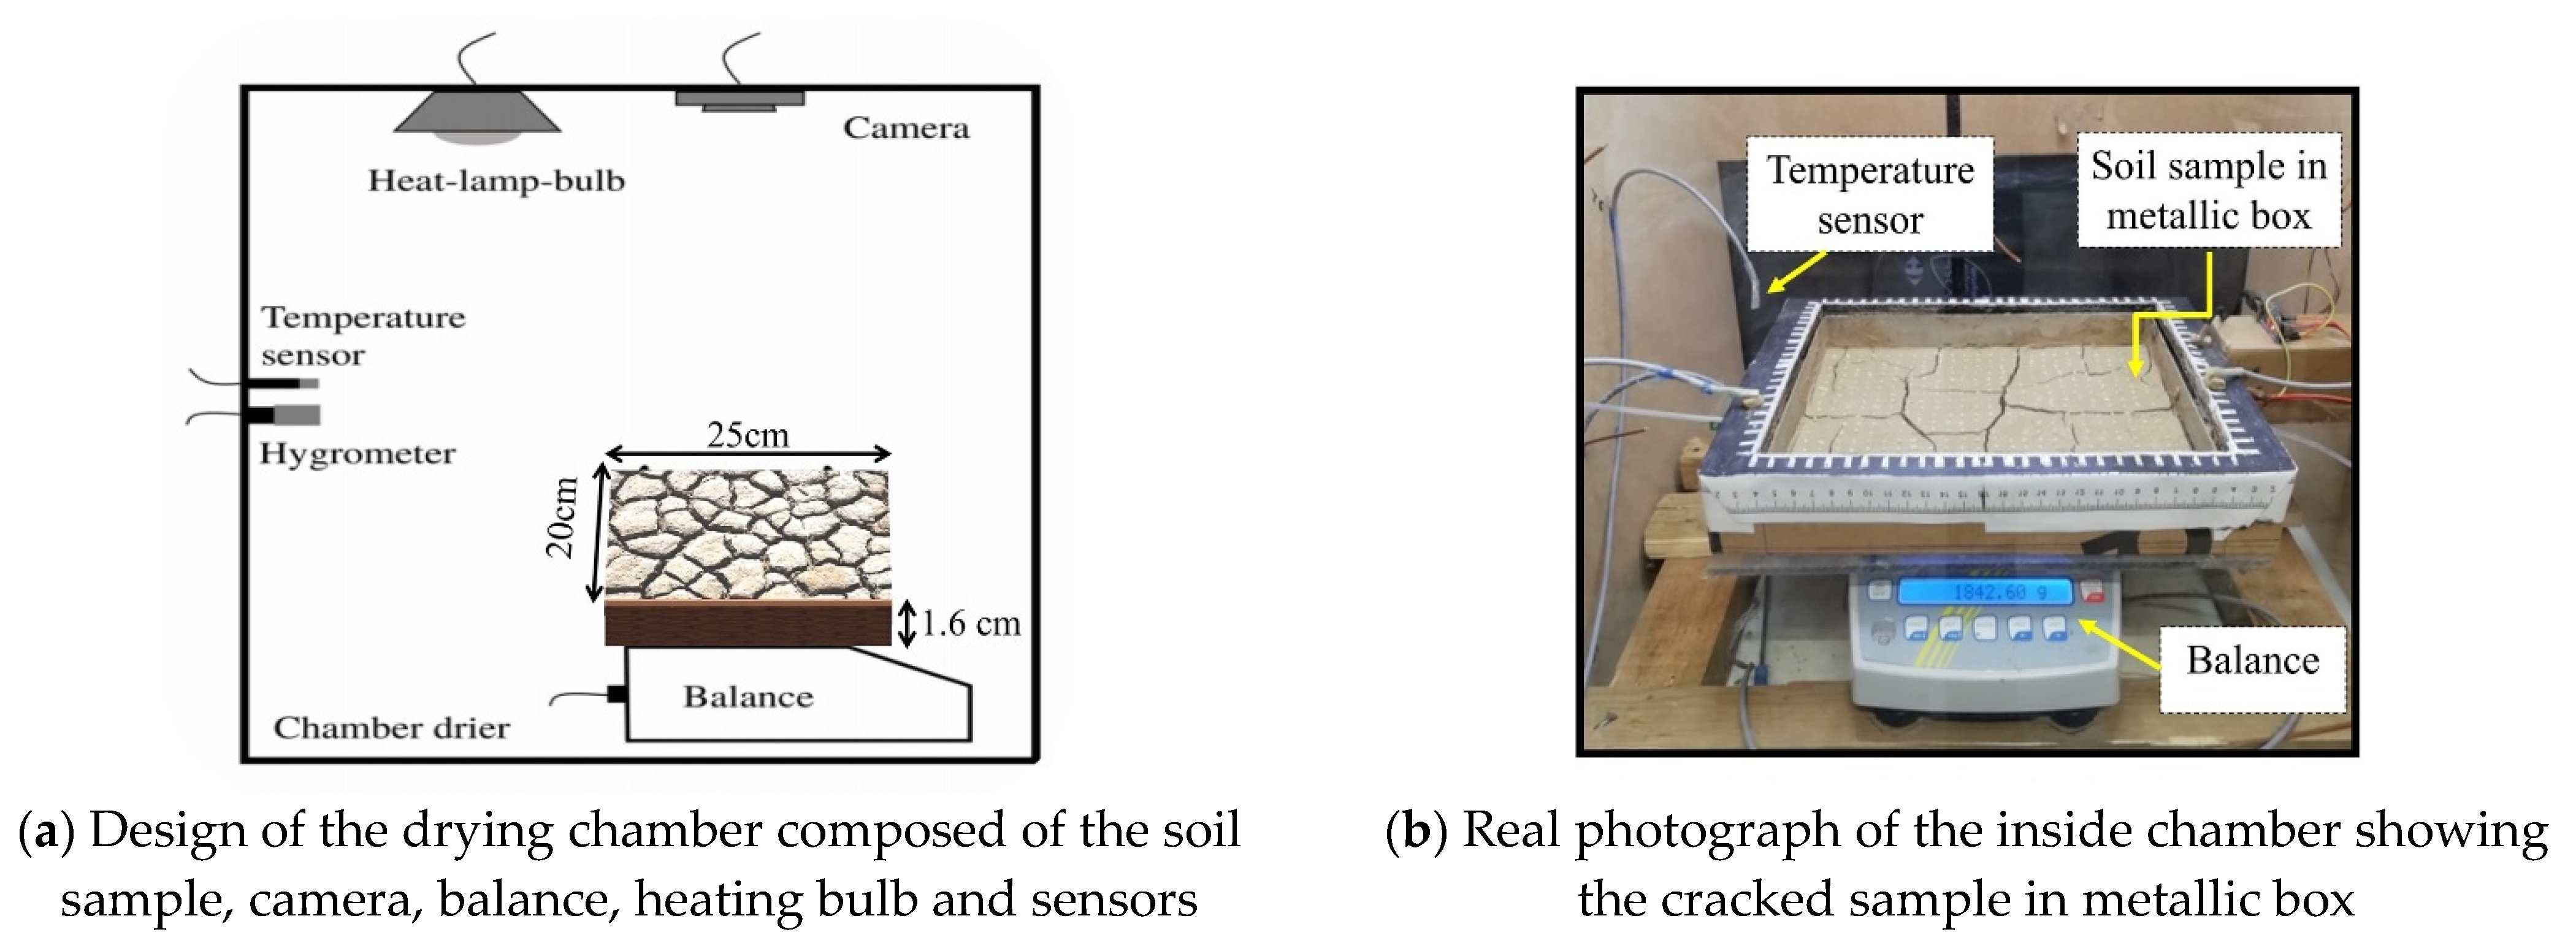
The samples were prepared from a rectangular steel box of 25 cm length × 20 cm width × 1.6 cm height or thickness (Figure 1). The thickness was chosen to enhance the drying-induced cracking process according to the literature and the pretesting experiment [5,20]. The undisturbed samples (NDS = RTRI and CTRO) were saturated with distilled water from the bottom by a capillary rise for 24 h before the commencement of the experiment. In order to assure pore saturation, the water was levelled until 4–5 mm below the sample surface. The initial water content obtained in the NDS was between 45–50%. This value was obtained from the mass difference between the saturated sample and the oven-dried (105 °C 24 h) samples converted into volume divided by the total volume of the wet sample. The soils from the DS were subjected to crushing, oven drying at 40 °C, sieving at 2 mm diameter and moulding at 45–50% of water content (similar to NDS). At this moisture percentage the DS samples obtained a bulk density similar to the NDS samples without the need for further soil compaction. The slurry was uniformly poured into a metal box of the same size as that used for the intact soil. The overall sample was slightly shaken so to fill the box evenly and to remove some of the trapped air in the sample. The specimen was then covered and settled for 2 h prior the drying experiment.

2.2. Sample Physical/Chemical Characteristic and Fibre (Roots, Stubble and Straw) Analysis

Intact soils were collected from the core rings near the sampling location in three replicates in order to measure the soil bulk density and porosity. The formula of the bulk density and porosity is given below:
BD = m s / V
ρ s =   ρ m V m + ρ om V om
Ф = ( 1 BD / ρ s )
where BD and ρs are the soil bulk density and the particle density (g·cm−3), Ф is the soil porosity, ms is the mass of the oven-dried soil (g) (at 105 °C for 24 h), V is the volume of the core cylinder (cm3), ρm is the mineral density (2.65 g·cm−3), ρm: organic matter density (0.8 g·cm−3) and Vm and Vom are the volume fractions of the mineral and organic matter (%).
Clay, silt and sand fractions were quantified using the pipette method (ISO 11464:2006). The organic carbon, humus content and pH of each treatment were measured according to the standard procedures (ISO 10694:1995; ISO 10390:2005). The pH meter measured the soil pH at a soil/water ratio of 1:5. The total carbon (TC) was calculated from the quantity of CO2 coming from the burning sample. The total organic carbon (TOC) required a preremoval of carbonic mineral by HCl 2N before burning the sample.
Based on the literature, the soil was classified as a Cutanic Luvisol [21] mainly composed of silt (80 ± 2%), clay (15 ± 1.5%) and sand (5 ± 2%). The C:N ratio was between 10 and 12 with a C content of 20–35 g per kg of soil [22], and the bulk density was roughly 1.3–1.4 g·cm−3. After the experiment, crop straw, stubble and roots were sieved (2 mm) from the soil, spread on white paper, scanned by camera and quantified using image analysis.

2.3. Drying and Chamber Preparation

The experiment took place at the Gembloux Agro-Bio Tech laboratory. Drying was conducted in a small chamber heated with a lamp bulb (Exo Terra® ceramic heat emitter). We preheated the chamber prior to the experimental setup as proposed by Tran et al. [23]. Precision balance monitored the change in the sample weight every 15 min. Water tensiometer and pressure transducers (0–400/500 kPa) connected to a CR800 Datalogger (a programmable device by Campbell Scientific® controlling sensors) measured the soil water suction, and were inserted in a horizontal position 4 cm inside the sample in the middle width section of the metallic box. The top surface of the sample was exposed to a free evaporation and monitored by 12 MP Canon® cameras (Canon PowerShot SX520 HS®) which took a picture every 30 min. We installed a Plexiglas® at the base of each sample to hold the specimen and to avoid evaporation from its basal. Friction in the squared form grid (1 mm height, 1 cm length) was added in the interfacial between the soil and the Plexiglas®. The experiment lasted for 7–10 days. Between 330 and 480 pictures were taken for each sample.

2.4. Determination of Moisture Content, Evaporation, Soil Water Retention Curve and Pore Size Distribution during Drying

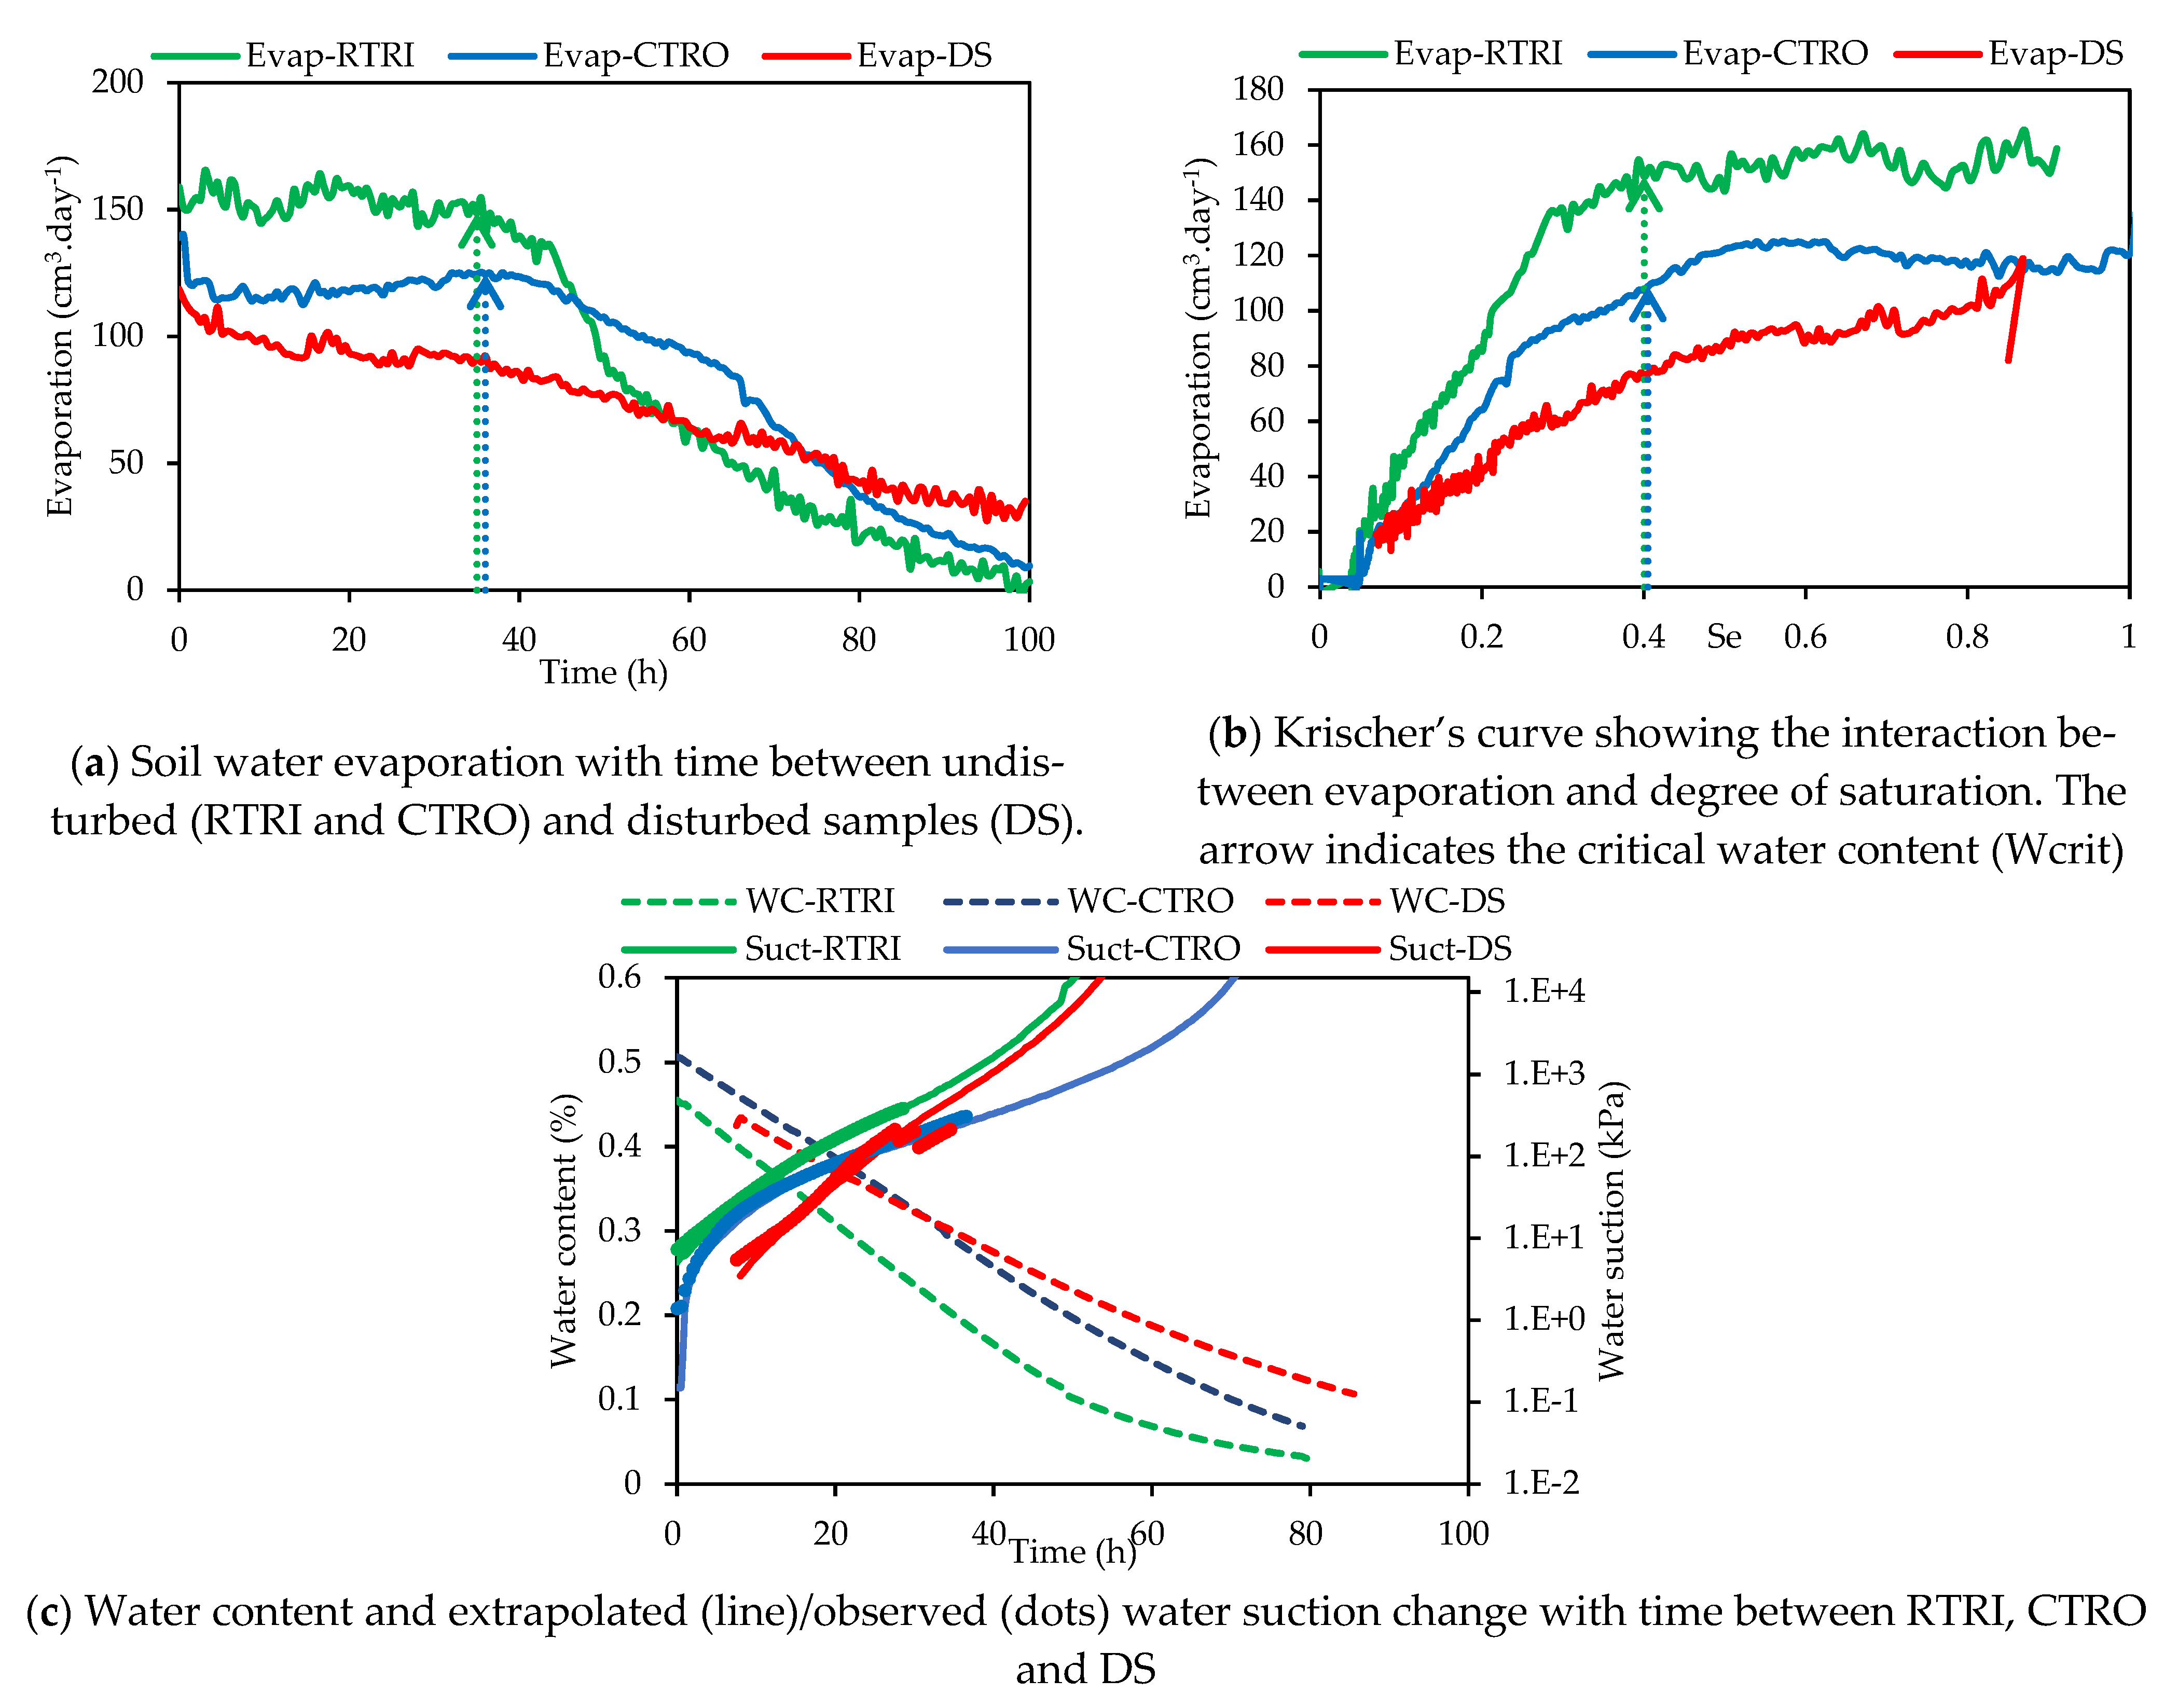
2.4.1. Krischer’s Curve

The moisture content was calculated from the weight difference between the soil at a given time and the oven-dried soil (105 °C for 24 h after 7–10 days of experimentation). The soil evaporation demonstrated the rate of water dissipation through the sample area per second (converted in cm day−1) [24]. The representative curves and their parameters in the result section were averaged from the three replicates. The Krischer curve treated the drying rate q (cm3 day−1) as a function of the water content (θ) adjusted with the initial water content (θo) of 0.5. The drying rate formulation is given below:
q = S o i l   m a s s   ( t ) S o i l   m a s s   ( t 1 ) A     Δ t .  
where q is the drying rate (cm·day−1), Soil mass (t, t − 1) is the change of soil mass during 10 min transformed into water volume (cm3), A is the sample surface area (cm2) and Δt is the time interval between the two measurements (day).
The maximal drying rates (qmax) and the critical water contents (Wcrit) were deduced from the graph of the drying curve versus the time. The critical water content corresponds to the time of the curve deflection after the plateau of the maximum drying rates [25].

2.4.2. Soil Water Retention Curve (SWRC)

The SWRC represents the volumetric water content (θ) against the water suction (in kPa). The volumetric water content is obtained from the weight difference between the wet and the oven-dried soil (105 °C for 24 h) converted into volume (water volume (cm3) = water mass (g)/water density (1 g·cm−3)) and over the total volume of the wet sample (800 cm3 = 25 cm × 20 cm × 1.6 cm). In the calculation of the SWRC, the effective saturation is often used according to the following equation:
S e = θ θ r θ s θ r .  
where Se is the effective saturation, θ is the water content at time t, θs is the saturated water content and θr is the residual water content (i.e., the water remaining in dry soil). Residual water content is the remaining water content at high tension obtained when the gradient d (volumetric water content)/dh (i.e., h: suction) becomes zero. In the calculation, the residual water content is considered to be zero.
The nonlinear equation of van Genuchten [26] and of Durner [27] fitted the monomodal and bimodal pore structures, respectively. The bimodal function of Durner [27] is a combination of two VG models which considers the macropore (first modal) and the micropore (second modal). The fitting curves were calculated using the SWRC-fit package developed by Seki [28]. The double model is given below:
S e = w 1 [ 1 1 + ( α 1 h ) n 1 ] m 1 + w 2 [ 1 1 + ( α 2 h ) n 2 ] m 2
where α (cm−1), n1, n2, m1 and m2 are the empirical parameters and m is calculated by m = 1 − 1/n, and w1 and w2 are the weighing factors. w2 is set to zero for the monomodal curve, making the second part of the Se formula equal to zero.
The three SWRC curves representing each treatment were obtained by averaging the volumetric water content and the water suction of the three replicates. The measured water suction was unfortunately limited to 400–500 kPa due to the classical water-filled tensiometer cavitation. For instance, we utilised a ceramic cylinder (0.5 cm diameter and 2.5 cm long) connected to a pressure transducer (BLPR2-IM-040606® of World Precision Instrument
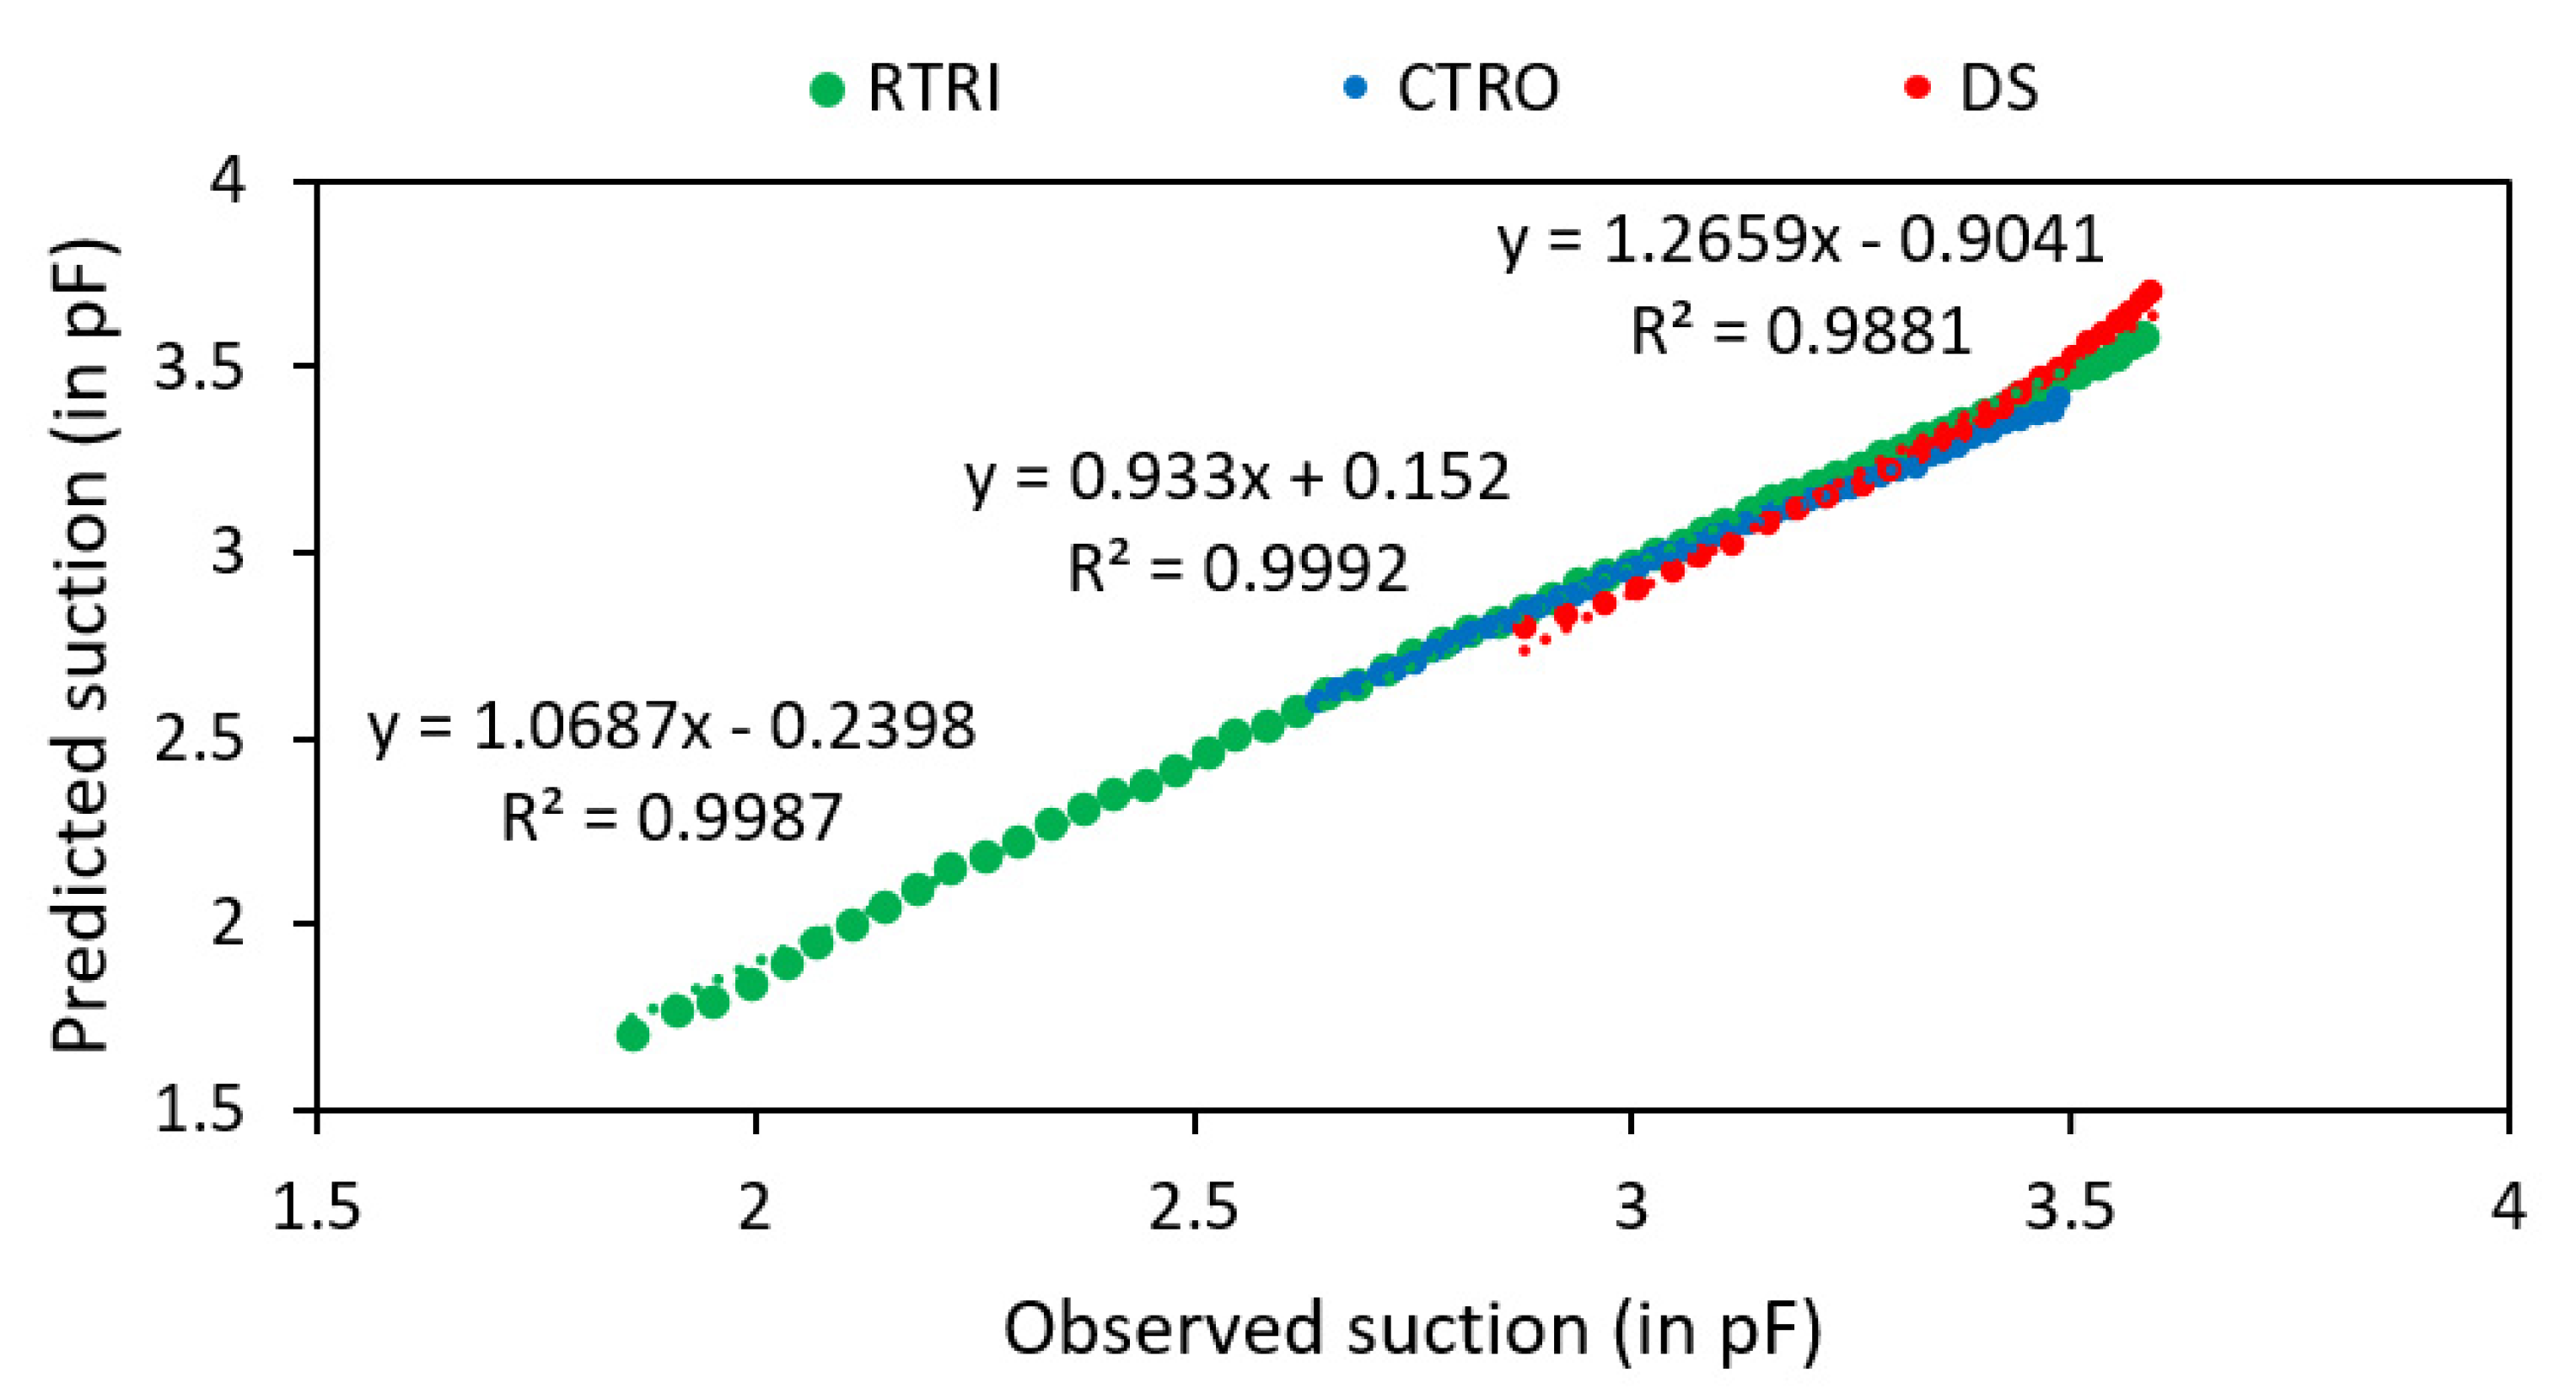
®) by a plastic tube filled with degassed water. The degassing procedure used vacuum instruments (i.e., a glass chamber and a pump) for 72 h. The problem of missing data was addressed by extrapolating the water suction in the range 400–15,000 kPa from the available water content data between 0–500 kPa using the fitted SWRC models (monomodal and bimodal). The quality of the fit is presented in Appendix C and Appendix D.

2.4.3. Pore Size Distribution (PSD)

The water retention curves were converted into PSD. The cumulative pore volume fraction of the ith fraction, if we divide the SWRC in n fractions, is equal to the ratio of the measured water content to the saturated water content, which is equal to Se at the ith fraction:
S e i = j = 0 j = i v i   ;   i = 1 ,   2 , ,   n    
where Sei is the effective saturation (Se) at ith fraction, vi is the volume fraction at ith fraction and n is the total number of the fraction (i.e., the number of portions of the SWRC).
The corresponding pore diameters (di) at the ith fraction is converted from the water matric suction using the Jurin’s law, which is simplified in the equation of [29]:
h i = 3000 d i  
The curve of the pore size distribution (PSD) was obtained by pairing the cumulative pore volume fractions in Equation (8) and the calculated pore diameter from Equation (7) [
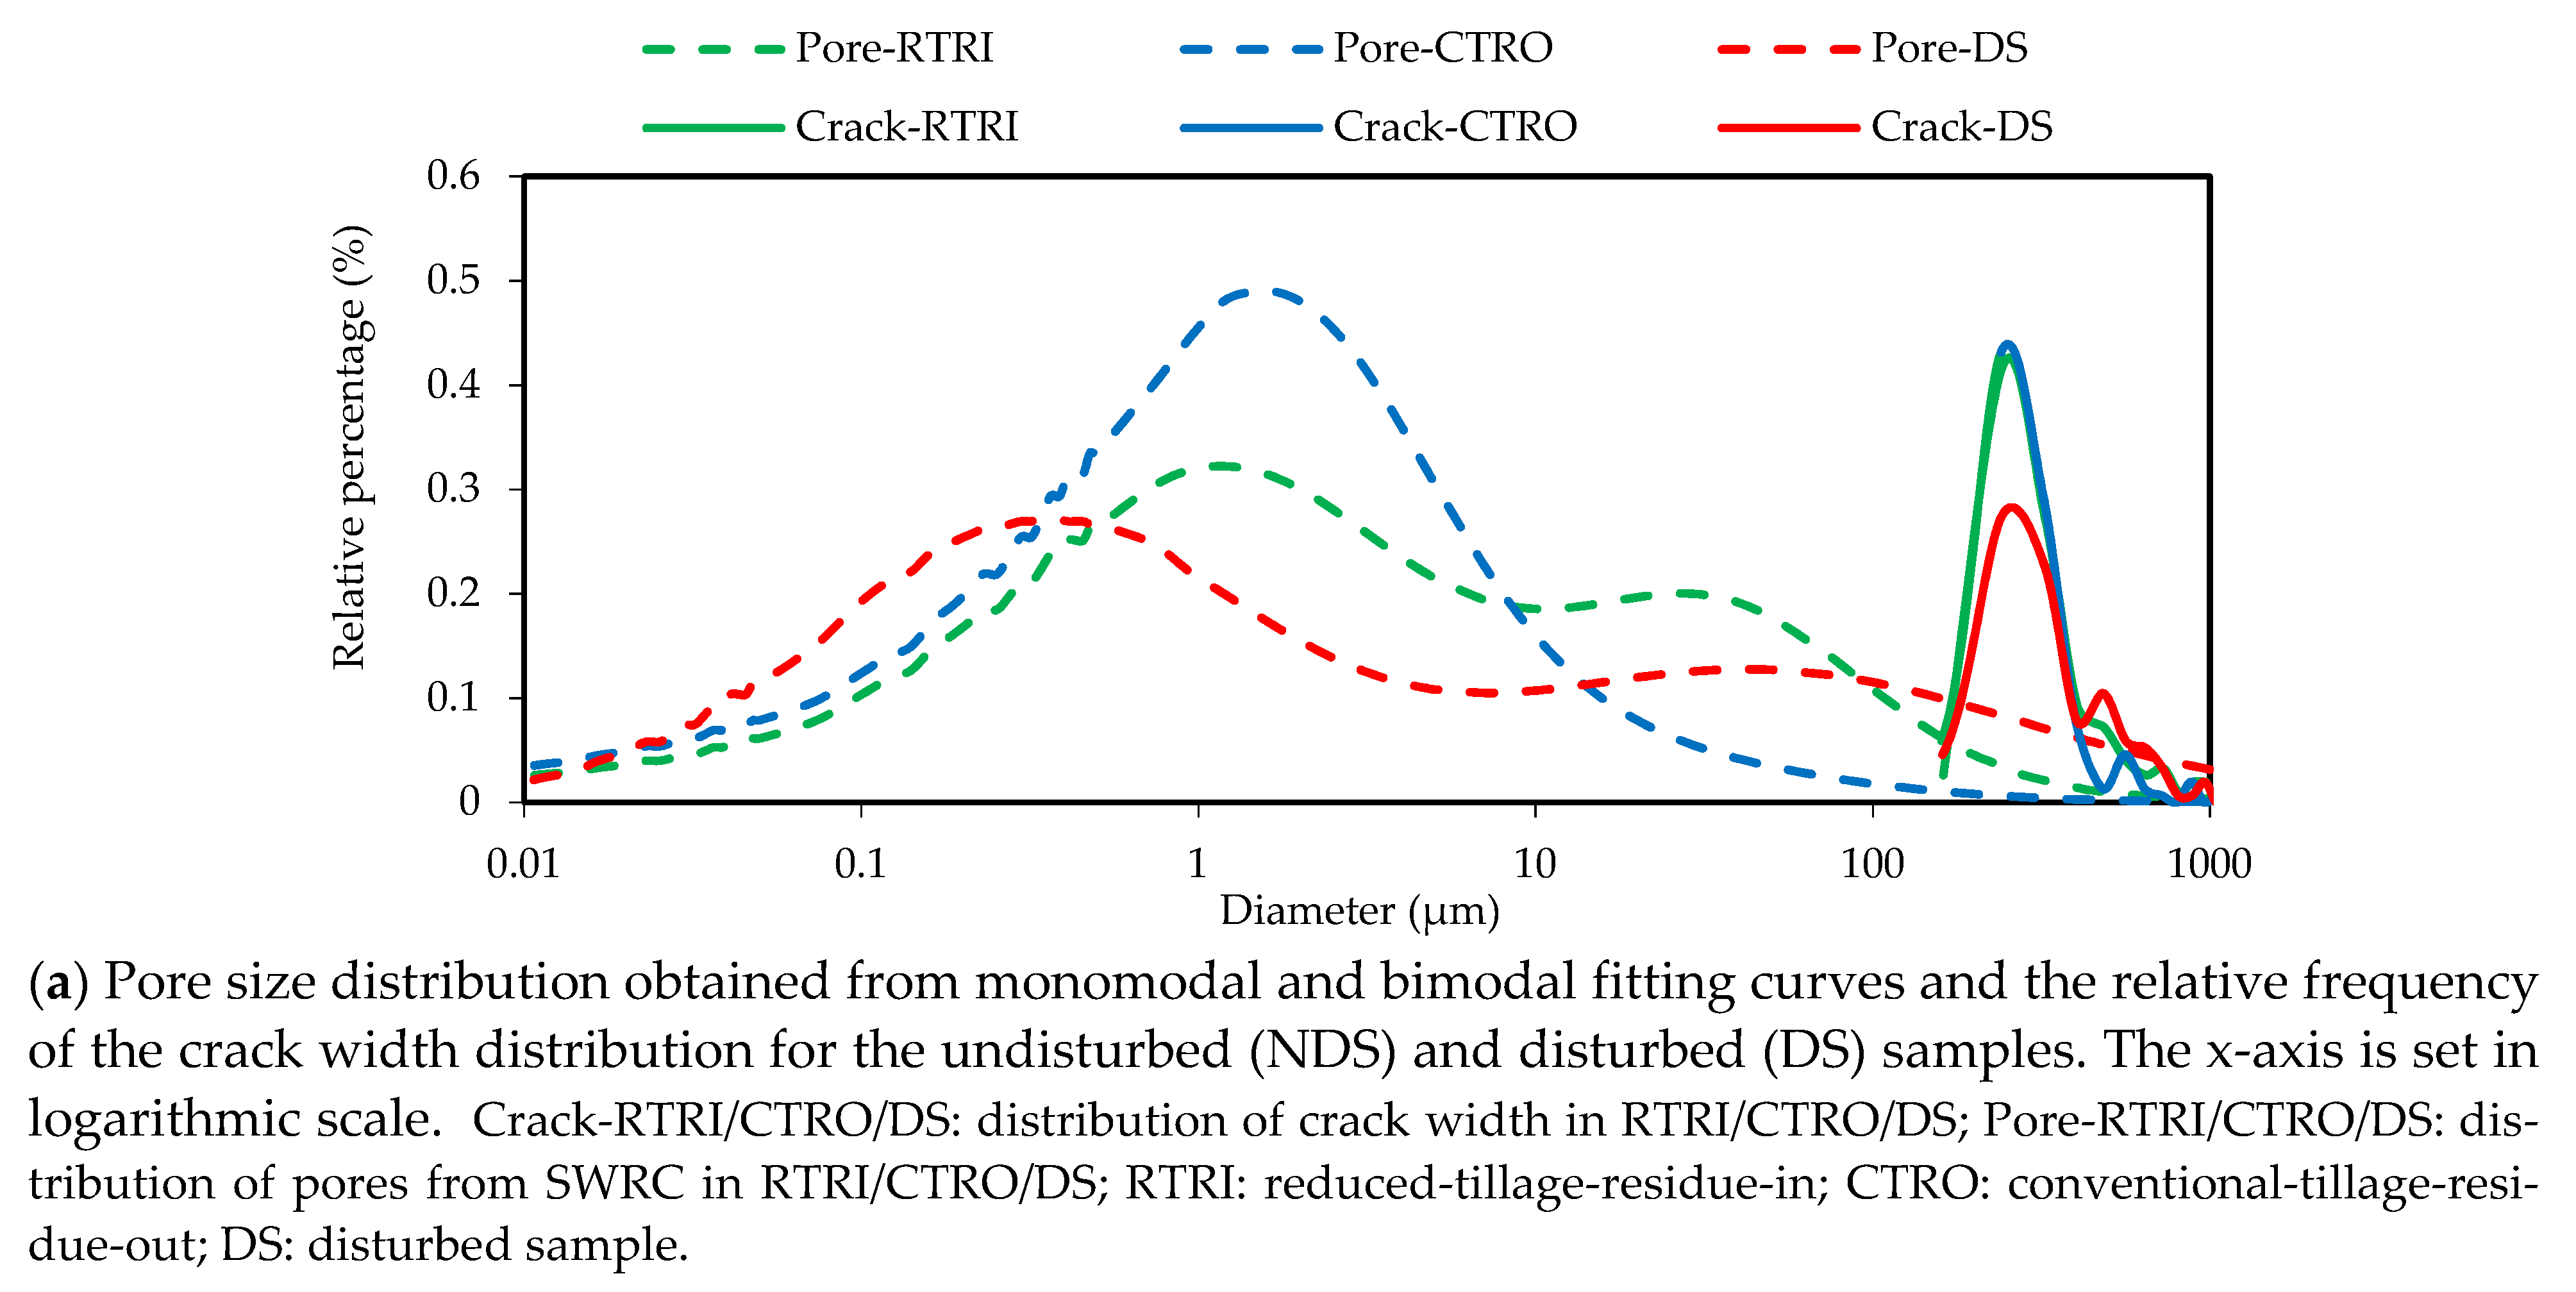
10]. The obtained PSD was classified in three classes for statistical comparison. Pore diameters below 50 µm were classified as storage/residual/binding pores, those between 50 and 500 µm were transmissive pores and >500 µm were fissures [10].

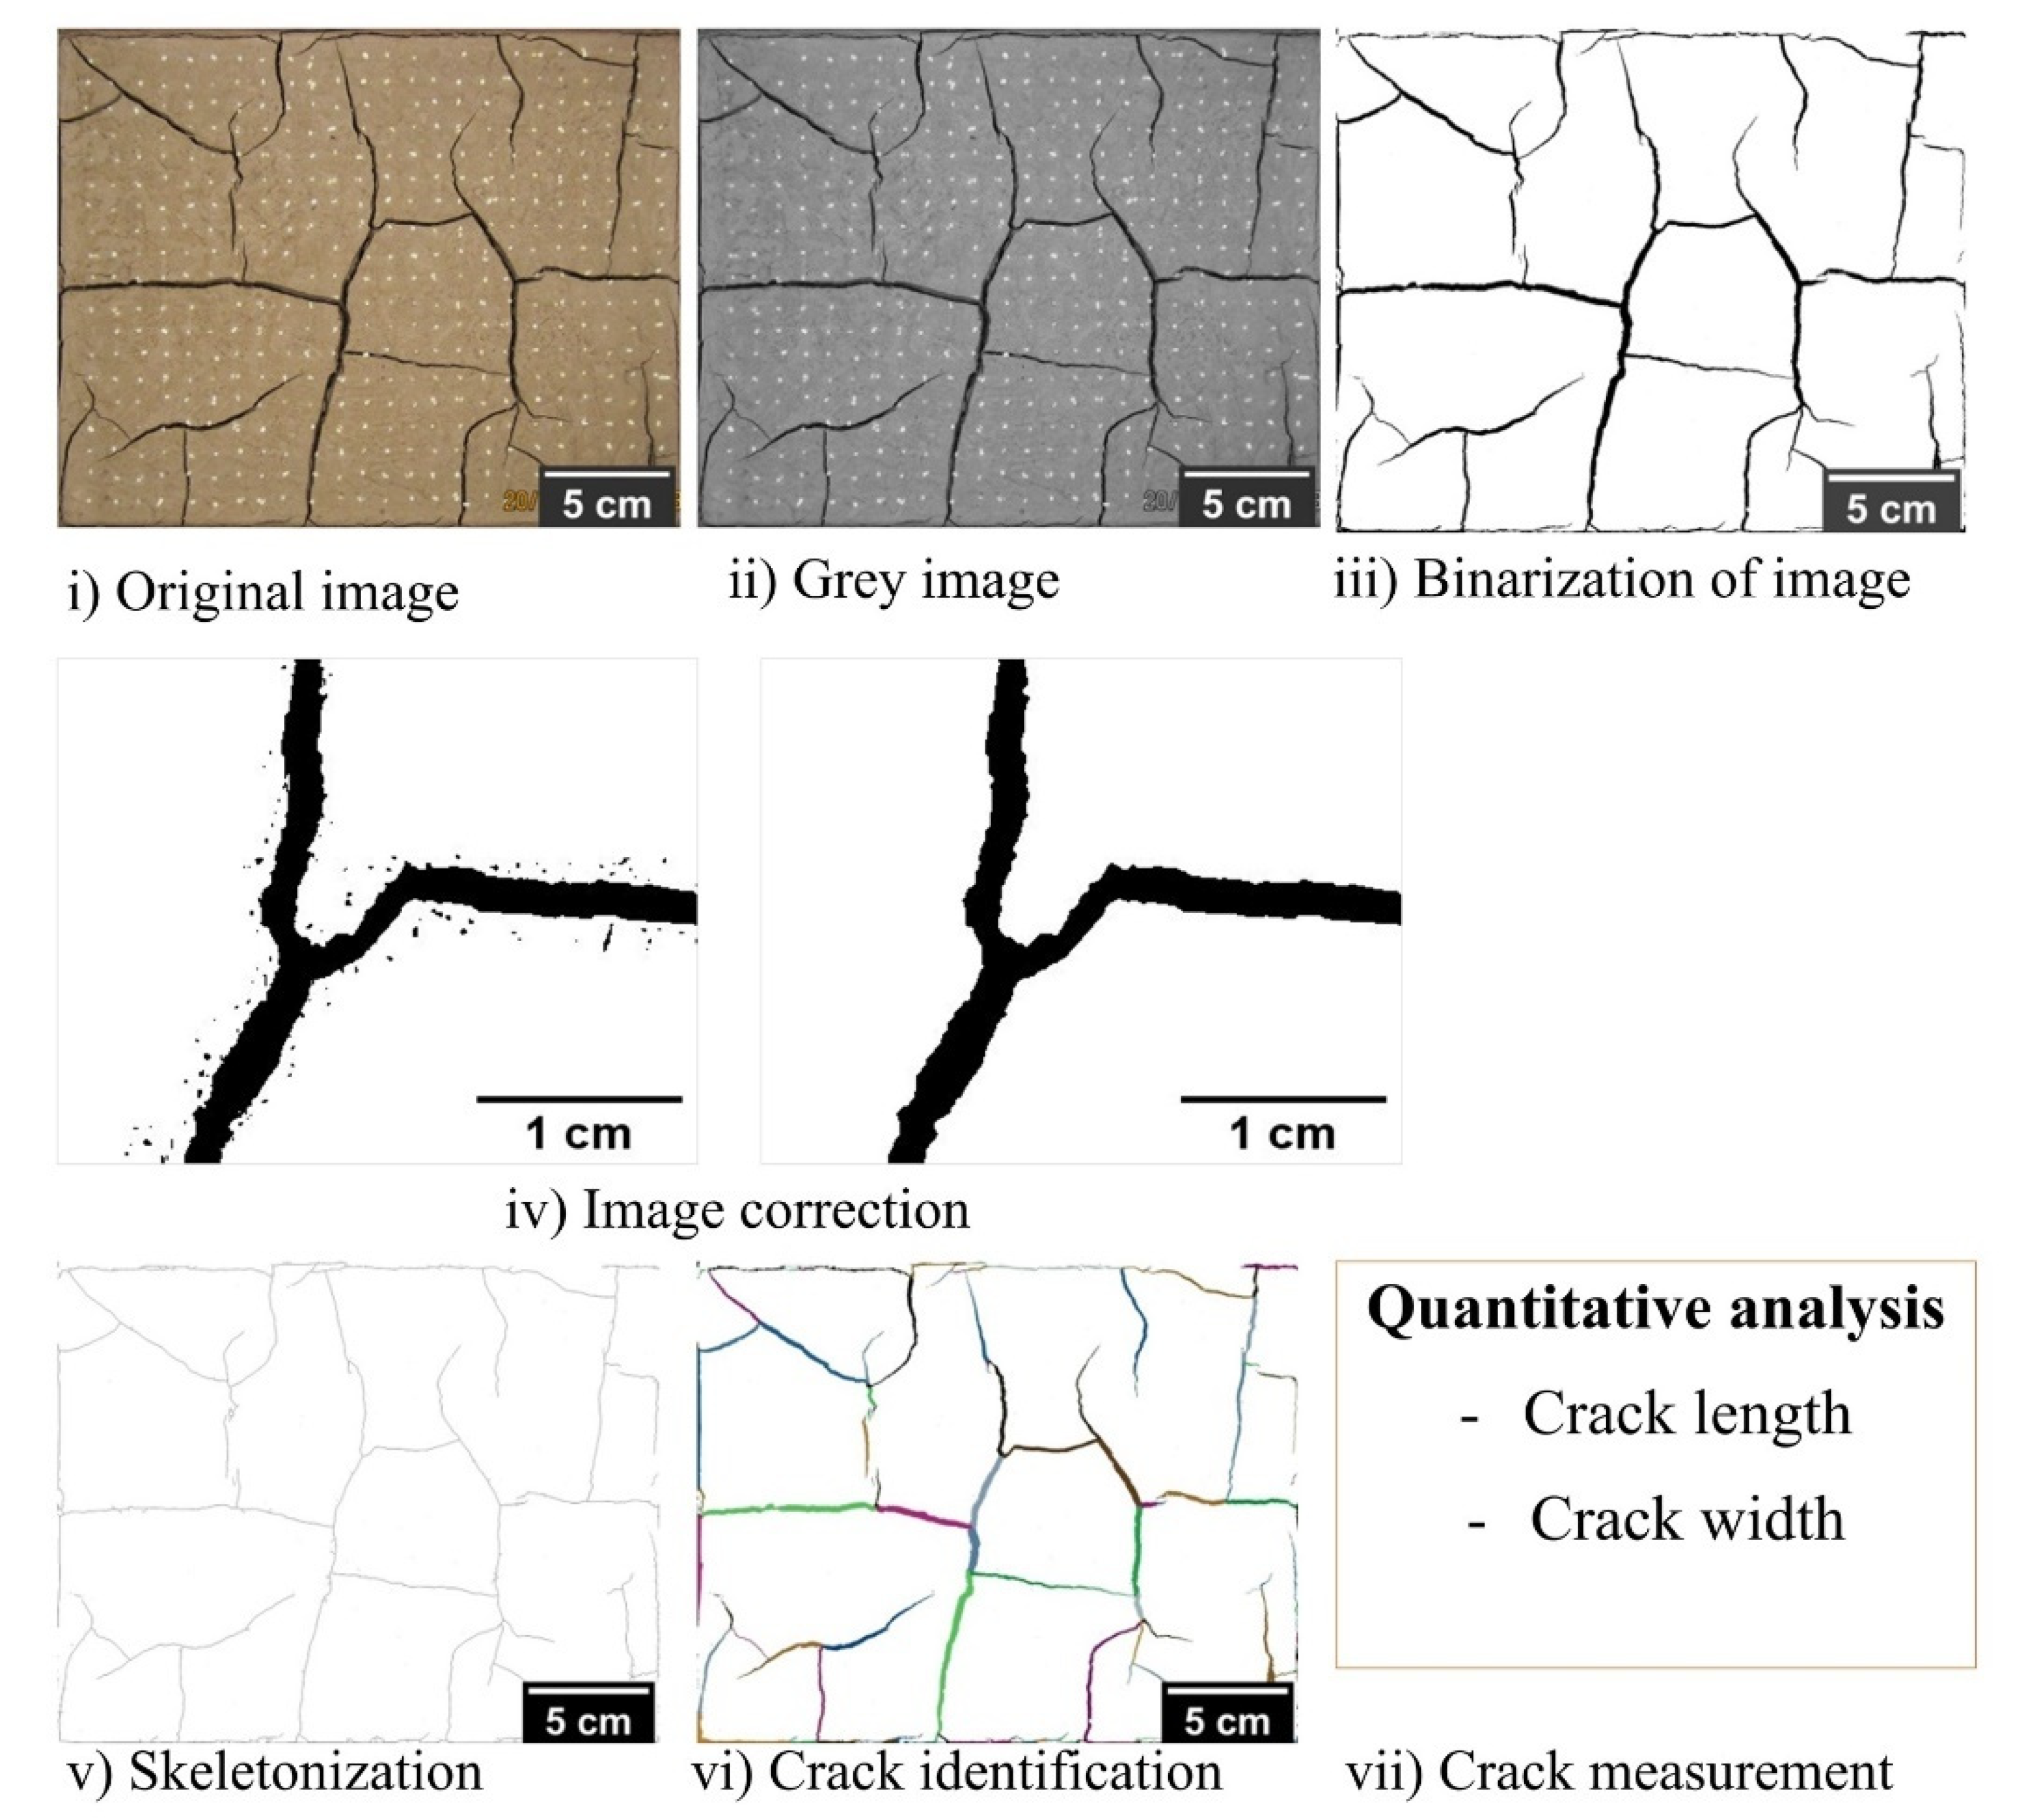
2.5. Image Processing and Analysis

Prior to the image processing, the images were corrected (tilt correction, geometry correction, etc.) using GIMP® software. The image processing followed five main steps as proposed by Lakshmikantha et al. [4], Tang et al. [11], Le Roux et al. [30] and Li et al. [31] using ImageJ® and PCAS
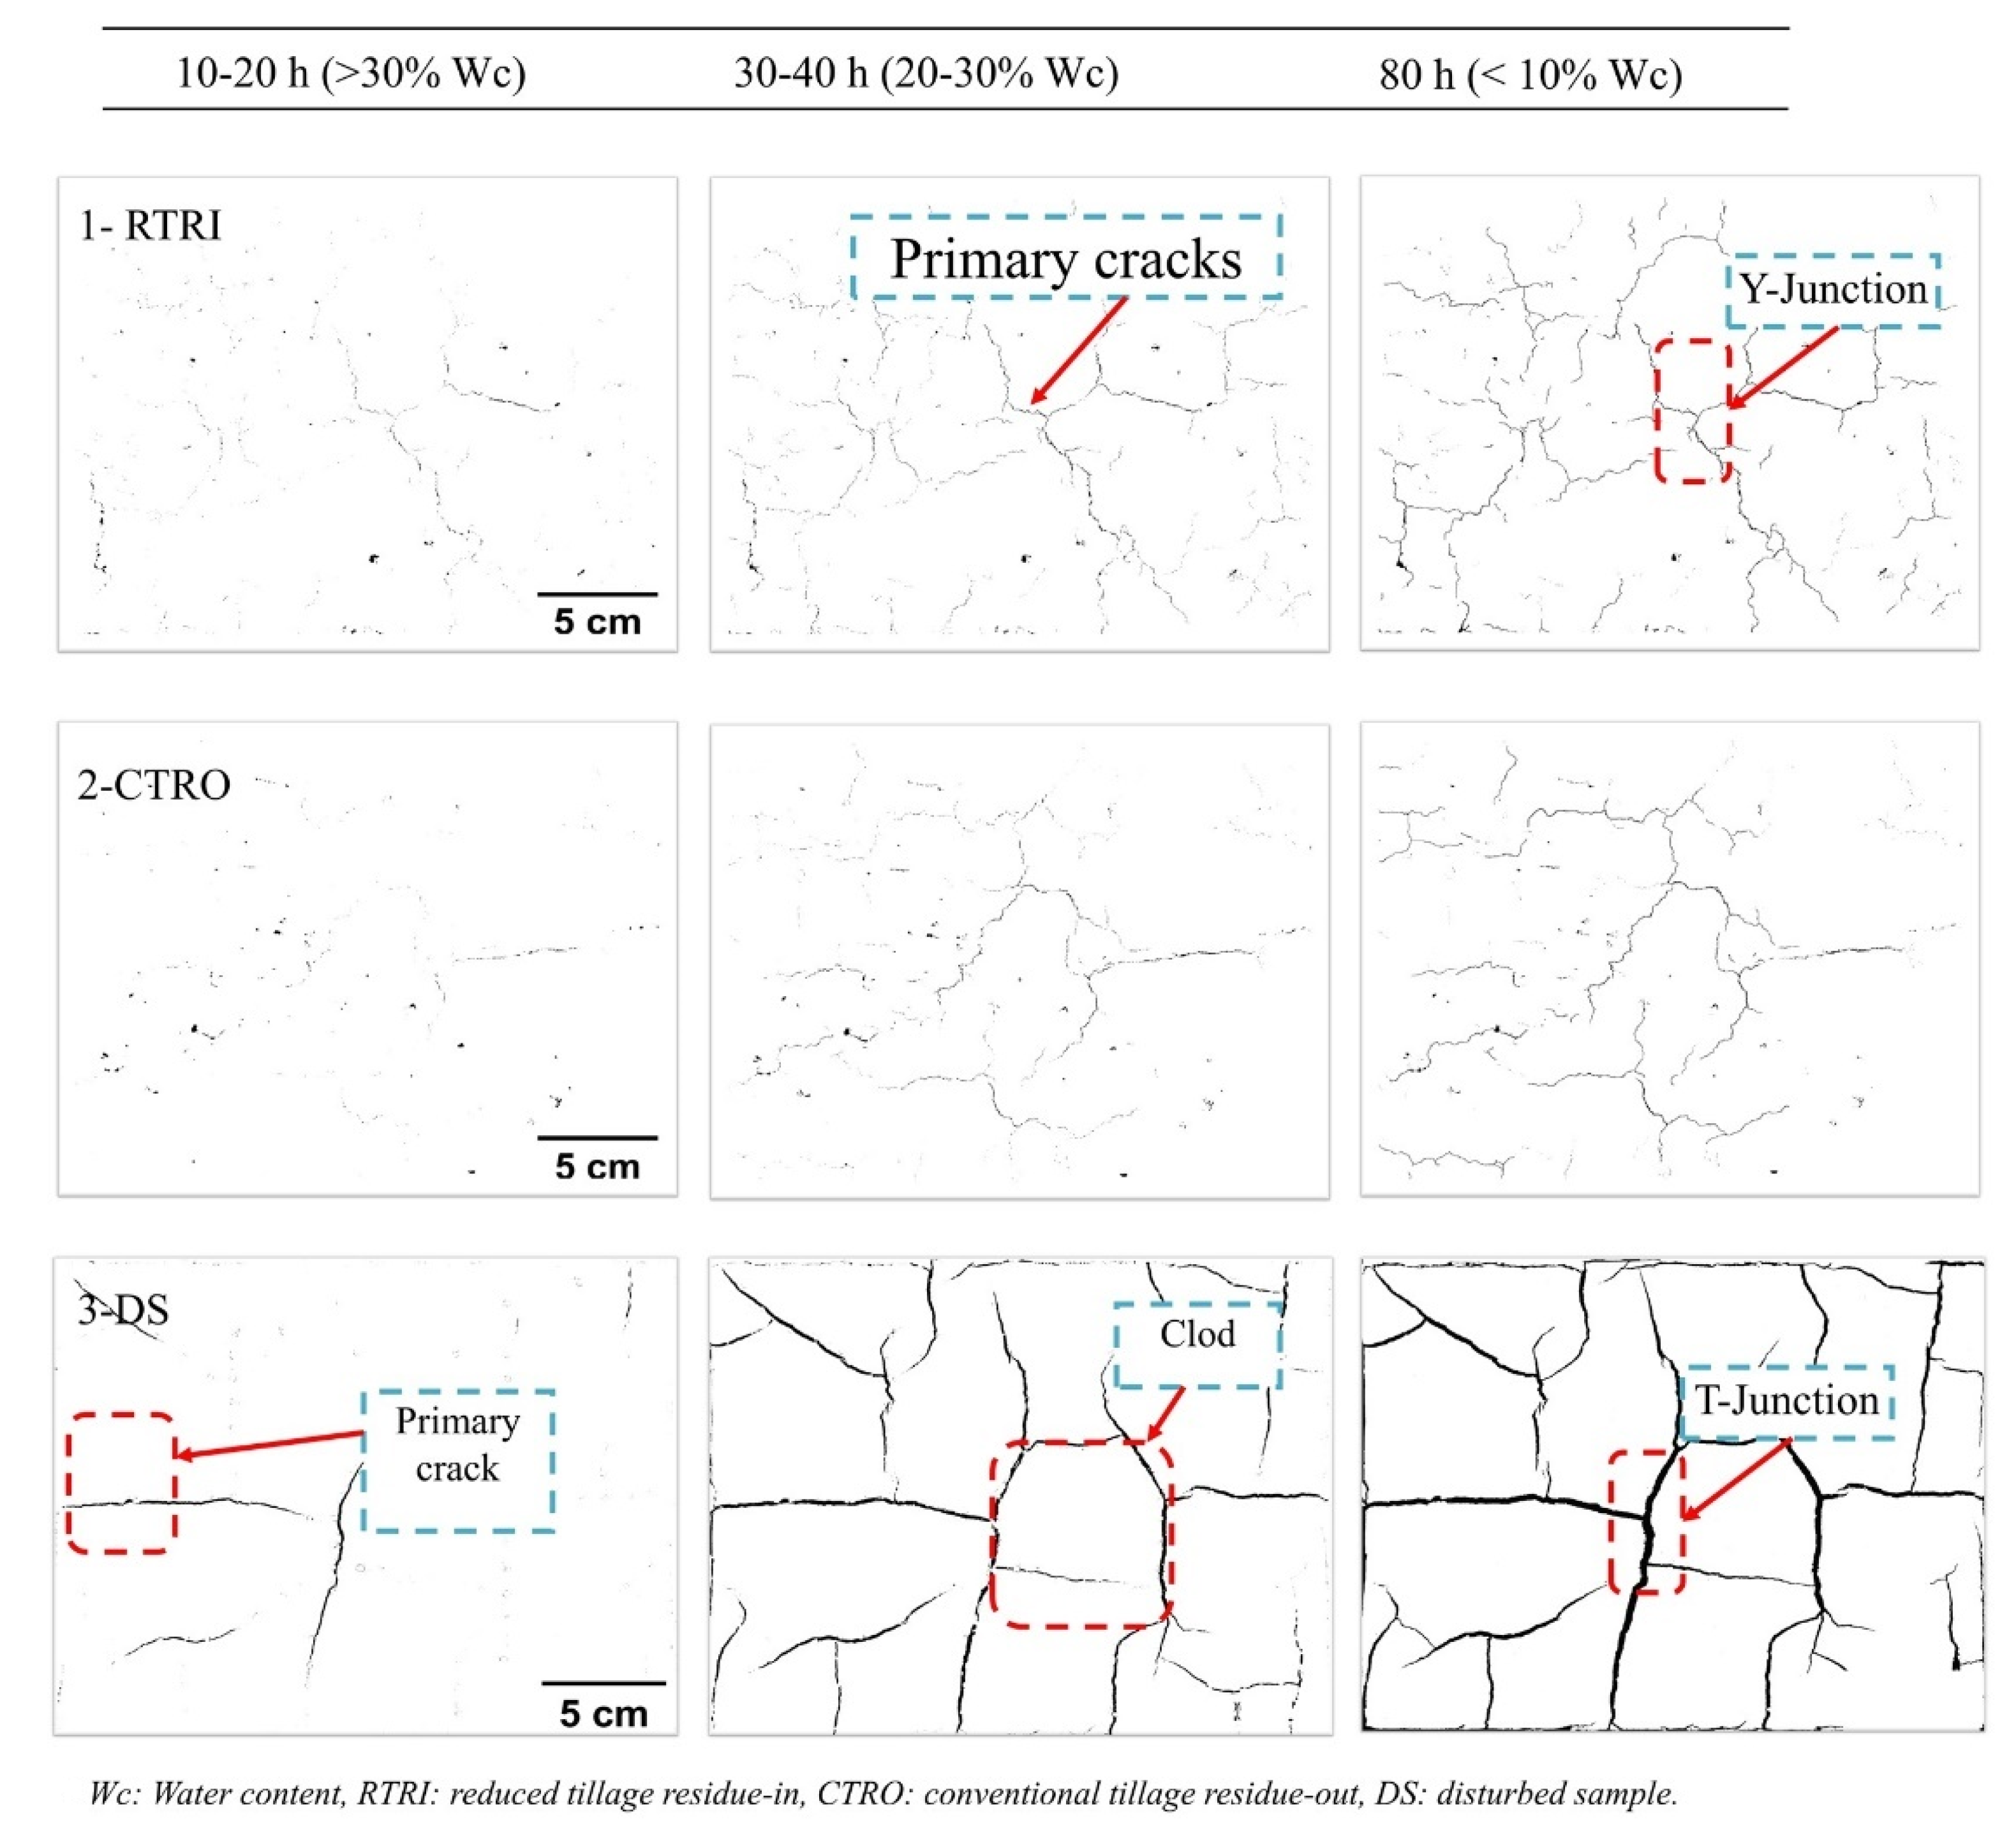
® packages. The first steps converted the RGB image into grey images and then into black (cracks) and white (background) pixels. This binarization process was based on the Otsu thresholding technique. The second step removed all the impurities and noises (e.g., dots and outliers) from the images using a series of techniques (e.g., filter, smooth, sharp, erode, dilate, noise removal and thickening). The skeletonization process during the third step transformed the binary image into skeleton, or thinned medial axis, images. The remaining steps (4–5) consisted in identifying cracks and measuring their width and length (Figure 2).
The crack width and the crack length were estimated from the black pixels of the binary image using the PCAS software [30]. The sum of the medial axis (i.e., crack branches) between the nodes gave the total crack length. The crack width was estimated from the Feret diameter of the fractal images. The Feret diameter is defined as the orthogonal distance between two parallel tangents [32]. The crack width was calculated from the average width of each fractal image.

2.6. Statistical Analysis

All the graphs represent the averaged data from the three replicates per treatment (i.e., each treatment which has three replicates). The relationship between the evaporation rates/water content/water suction and crack length were analysed using the Pearson correlation. The strength of the relationship was assessed statistically with linear regression. The parameters of the Krischer’s curve and the SWRC (monomodal and bimodal curves) were compared statistically among the treatments (i.e., RTRI, CTRO and DS). Repeated measures of ANOVA with mixed models (restricted maximum likelihood (REML) and compound symmetry) from XLSTAT software analysed the pore distribution class between the treatments. All statistical analyses were performed at a confidence level of 95%. The RMSE (root mean square error) and R2 (determination coefficient) of the extrapolated water suction from the SWRC versus the observed data were also calculated.

3. Results and Discussion

3.1. Soil Physical and Fibre Characteristics

Table 1 presents the physical and chemical characteristics of the soil. The results show significant differences in the bulk density and the total porosity between the RTRI and the other treatments (i.e., CTRO and DS) at a 95% confidence level. Note that the difference in terms of the soil mineralogy is assumed to be low since all the samples were coming from neighbouring plots. The fibres were removed from the DS during the sieving process. The fibres from the RTRI were slightly shorter in individual length, narrower in width and lighter (almost decomposed) in weight compared to the CTRO (Figure 3). The total length of the fibres was greater in the RTRI than the CTRO (Table 1). It is important to mention that some roots and parts of the straws (5–10 cm) were also remaining in the field for the CTRO. However, all the residues (roots and above ground biomass) were left for the RTRI. The CTRO presented long (individual size) and almost intact organic matter mainly composed of aboveground biomass (straws). The roots were fewer compared to the RTRI. The crop stubble/roots area was almost similar for both treatments; however, in the RTRI there were many/small fibres while in the CTRO they were few/big (Figure 3).

3.2. Comparative Curves of Water Evaporation, Water Content and Water Suction in Undisturbed (RTRI and CTRO) and Disturbed Samples (DS)

The average curve of the water evaporation with time and against the degree of saturation in each treatment is shown in Figure 4a,b. We observed two distinct periods. During the first evaporation period (before 40 h and 40% of θ/θo) the curve was at its steady and maximum stage (qmax in Appendix A). The undisturbed samples (RTRI and CTRO) presented the highest water evaporation rate (>150 and 120 cm day−1, respectively) compared to the disturbed soils (DS) (<100 cm day−1). The deflexion of the evaporation curve (40–50 h) corresponds to the start of the second period. During this second period, the DS takes time (>100 h) to attain its minimum evaporation rate (compared to the NDS, ~100 h).
Figure 4c shows an initial water content of about 45–50% for all the treatments. The water content decreases linearly before attaining its stabilization line. The deflexion of the curve indicates that the critical water content (Wcrit) is reached after 40–50 h (about 40% of standardized water content in Krischer’s curve Figure 4b). Appendix A shows that the critical water content (Wcrit) is around 0.2 for the NDS while almost unseen for the DS since the DS curve was linear. All the indicators emphasize that water removal is more restricted in the DS than in the NDS. Water loss induces an increase in water suction as shown in Figure 4c. The suction (in kPa) increases exponentially at around 60–80 h, which was 20–40 h after the critical water content.

3.3. Crack Length and Width between Disturbed/Undisturbed Sample

Figure 5 presents the progress of (a) the average crack length and (b) the crack width with time. The maximum crack length (observed at 80 h after crack initiation) was two to three times longer in the DS (~230 cm) than in the NDS (70–100 cm). For the NDS, the crack length increases slowly during the first 30–40 h of the crack initiation. Later, it progresses slightly faster (from 20–80 cm in the next 40 h) and linearly. However, the DS starts with a strong increase after the first 18 h (growth from 0 to 140 cm in <10 h) then a slower rise (~100 cm in the next 40 h) before reaching a stagnation period (~80 h). Small differences can be observed between the RTRI (~100 cm) and the CTRO (~70 cm) in terms of the total crack length. Concerning the crack width, for the NDS the average crack width decreased linearly (from 600 to 400 µm) before reaching a plateau of a stagnating phase (around 40–50 h in Figure 5b). The decrease indicates the formation of thinner cracks during the crack progression. However, for the DS the average crack width increased rapidly (up to 750 µm) after the first 18 h (i.e., the formation of wider cracks) before decreasing slowly and linearly (i.e., the formation of thinner cracks).
Figure 6 depicts the cracks obtained from the image analysis 10–20 h, 30–40 h and 80 h after crack initiation, respectively. The results show that the DS forms 90° (T-pattern) and 120° (Y-pattern) crack junctions while the NDS forms only Y-patterned cracks (Figure 6). Wang et al. [33] describe the T-junctions (90°) as the result of the coalescence of two cracks while the Y-junctions (120°) are extensions of the cracks. The T-junctions are mainly observed between the primary cracks (i.e., the first main cracks) in the DS, which end by forming a clod (i.e., polygonal looping cracks). The Y-junctions (in DS) come later when the secondary and tertiary cracks are forming. This is the period during which the soil is slightly dry and the crack propagation is more difficult. Therefore, the formation of only Y-junctions in the NDS demonstrates the difficulty of spreading cracks in the NDS samples when compared to the DS samples.

3.4. How Does Drying Drive the Cracking?

Figure 7a presents the growth of the crack length with suction. Figure 7a shows a clear increase of the crack length with suction up to 300 kPa for the DS and beyond the wilting point (>1500 kPa for NDS), indicating a strong link between the suction, which is a driving force, and the progressive cracking.
The drying of soils induces shrinkage. However, in our experiments the shrinkage is restrained, on the one hand, by the drying gradient along the sample thickness, and, on the other hand, by the basal friction (grid) installed at the base of the samples. This shrinkage restriction provokes the soil cracking. In the field, the drying gradient over the thickness is probably the main reason for the cracking [34]. Moreover, the soil heterogeneity may also contribute to the cracking [11]. The mechanical analysis of the cracking is beyond the scope of this paper. According to the concepts of the effective stress [35,36], an increase of the suction implies an increase of the tensile stress state. By consequence, the soil strains appear in the form of shrinkage. The disturbed sample is more sensitive to an increasing suction than are the NDS samples (slope 4 10−2 versus slopes 3 10−3 and 2 10−3 cm kPa−1). Among the NDS samples, the treatment (i.e., the tillage associated with residue management) effect induces fewer differences. The cracks in the RTRI are about 50% longer than in the CTRO. The crack width (Figure 7b) of the structured samples (CTRO and RTRI) are not clearly evolving with suction, while evolving monotonically for the DS. This may be related to the number of fibres (i.e., straw, stubbles and roots) which were removed from the DS before the experiment (Table 1). Figure 7c,d shows that the crack length and width change with the water content and are comparable to the those observed with suction (Figure 7a,b). It is clear from Figure 7c,d that the crack formation starts to gain in amplitude when the NDS reach their critical water content. The critical water content is about 20% for the NDS (Appendix A). This implies that the Wcrit (i.e., critical water content) is also critical for crack propagation.

3.5. How Could Cracks Modify the Water Transfer?

3.5.1. Porosimetry Curve Related to Sample Structure and Its Change with Cracking

Figure 8a shows the porosimetric curves for all the samples tested. These curves are obtained based on the tensiometer measurements (until 400–500 kPa) and on the average of the water content based on sample weighting. Based on this methodology, the knowledge of pore distribution above 3 µm is much stronger than for pores with lower than 3 µm. This limit refers to the cavitation of the tensiometers. Below this pore size we rely on the extrapolation of the SWRC. Figure 8a shows only one pore family for the CTRO samples with a peak at 3 µm diameter. The RTRI samples show two pore families, the first and most frequent around 3 µm and the second around 30 µm. In the DS, the first pore family has a lower radius of around 0.5 µm while the second family has a larger and more dispersed radius of around 50 µm. The preceding analysis does not consider the cracks. The crack width in the CTRO and the RTRI vary slightly between 200–600 µm (Figure 7d). They create a kind of third pore family that is one order larger but taking on a different shape. This family appears relatively late in the RTRI and CTRO samples and does not interact with the tensiometers which have cavitated at that time. The cracks in the DS have about the same width but appear earlier.

3.5.2. Water Transfer during Crack Formation and Its Impact on SWRC

During the first evaporation period, the samples remain saturated, and the permeability primarily concerns the larger and saturated pores [18]. The CRP (from Krischer’s curve in Figure 4b) is upheld as long as there are liquid connections between the drying front and the evaporating surface [37]. The length of the plateau and the magnitude of the evaporation depends on the macropores. The cracks are not present at that time. The RTRI presents a longer plateau (ending at θ/θo = 40%) than the CTRO (ending at θ/θo = 50%) (Figure 4b). This is logical if one considers the porosimetry curve: the RTRI has a significant family of pores around 30 microns which does not appear for the CTRO samples. As the permeability is mostly driven by the larger pores, the RTRI permeability should then be larger than that of the CTRO (Figure 8a,b). Interestingly, only about 20% of the crack length has developed at the plateau end for each tillage case (Figure 4b and Figure 7c). Therefore, the cracks should not disturb the first phase.
The DS do not show any clear plateau and the evaporation rate is lower than when the experiment began. It may therefore be considered that the initial permeability is also lower. This is supported by the pore size distribution (Figure 8a,b) which indicates that the DS presents fewer (significant) large pores than the CTRO and RTRI (Appendix B, Table A2). The low permeability induces a short hydraulic connection layer that makes it difficult to extract water from the soil [18]. While the cracks develop earlier and much more intensively in the DS, this should not significantly increase its permeability during the first half of the tests. If the permeability is significantly enhanced by the cracking, it will not appear clearly during a drying test because the increase arrives too late. However, it could possibly significantly affect a wetting phase following a drying one.
During the second period of evaporation (Figure 4a,b) known as the Falling Rate Period (FRP), the crack initiatess (for the DS) and develops faster for all samples (Figure 7c). This period starts when the evaporation curve decreases. The film of water linking the surface and the sample is interrupted. During this period, the surface is no longer saturated and the wetting front (i.e., the layer of saturated moisture) sinks deep inside of the sample. The drying of the soil decreases its overall permeability. Moreover, the evaporation mainly comes from vapour rather than the liquid transport inside the soil [18]. The water transfer becomes progressively difficult, thus explaining the abrupt drop of the evaporation curve. This creates a dry surface and induces crack formation (Figure 7c,d). We observed from these results that the evaporation curve dropped faster (i.e., a steeper slope) on the NDS than in the DS.
During the drying experiment, the SWRC of all the samples evolved with the soil structure due to crack formation. This provides further evidence of the importance of the structure dynamic in soil hydrodynamic behaviour. Figure 8a,b and Figure 9a,b present the SWRC for all the treatments associated with crack formation. We observed that cracks initiate when the water content decreases significantly during a drying process. Until then, the SWRC are not influenced by the cracking. Moreover, cracks arrive at a lower suction for the RTRI (~7 kPa in the SWRC) when compared to the CTRO and the DS. However, despite the fact that the cracks come late in the SWRC (~50 kPa) for the DS, the cracks attained a large size more quickly (0–152 cm from 50–300 kPa) than with the NDS. Conversely, for the CTRO the cracks start at a higher suction (>10 kPa) and remain very low at a strong suction (<50 cm length until 1000 kPa). Therefore, the CTRO treatment could not influence its retention curve (i.e., the SWRC).
Figure 8b shows the increase of pores due to cracking (i.e., the value taken at the end of the experiment). The results show that the crack strongly affects pores between 50–500 µm, followed by pores > 500 µm. Additionally, pores in the DS are more important in those ranges (>50 µm) compared to the NDS (RTRI and CTRO). In the pores between 50–500 µm, the crack raises the pore percentage by 20% in the RTRI, 40% in the CTRO and 37% in the DS. Concerning pores > 500 µm, we noticed an increase of 30% in the RTRI, 20% in the CTRO and more than 45% in the DS. Therefore, during the wetting of a dry sample the cracks should probably modify the hydration process.

4. Conclusions

Crack formation during soil desiccation appears to be strongly linked to the soil structure (i.e., highly affected by the remolding for the DS) and to a lesser extent the agricultural management system. We have assumed that the difference between the disturbed and undisturbed samples reside in their structural characteristics despite no specific soil structural analysis done in this study. Using the disturbed and undisturbed soil samples, we observed that:
(1)
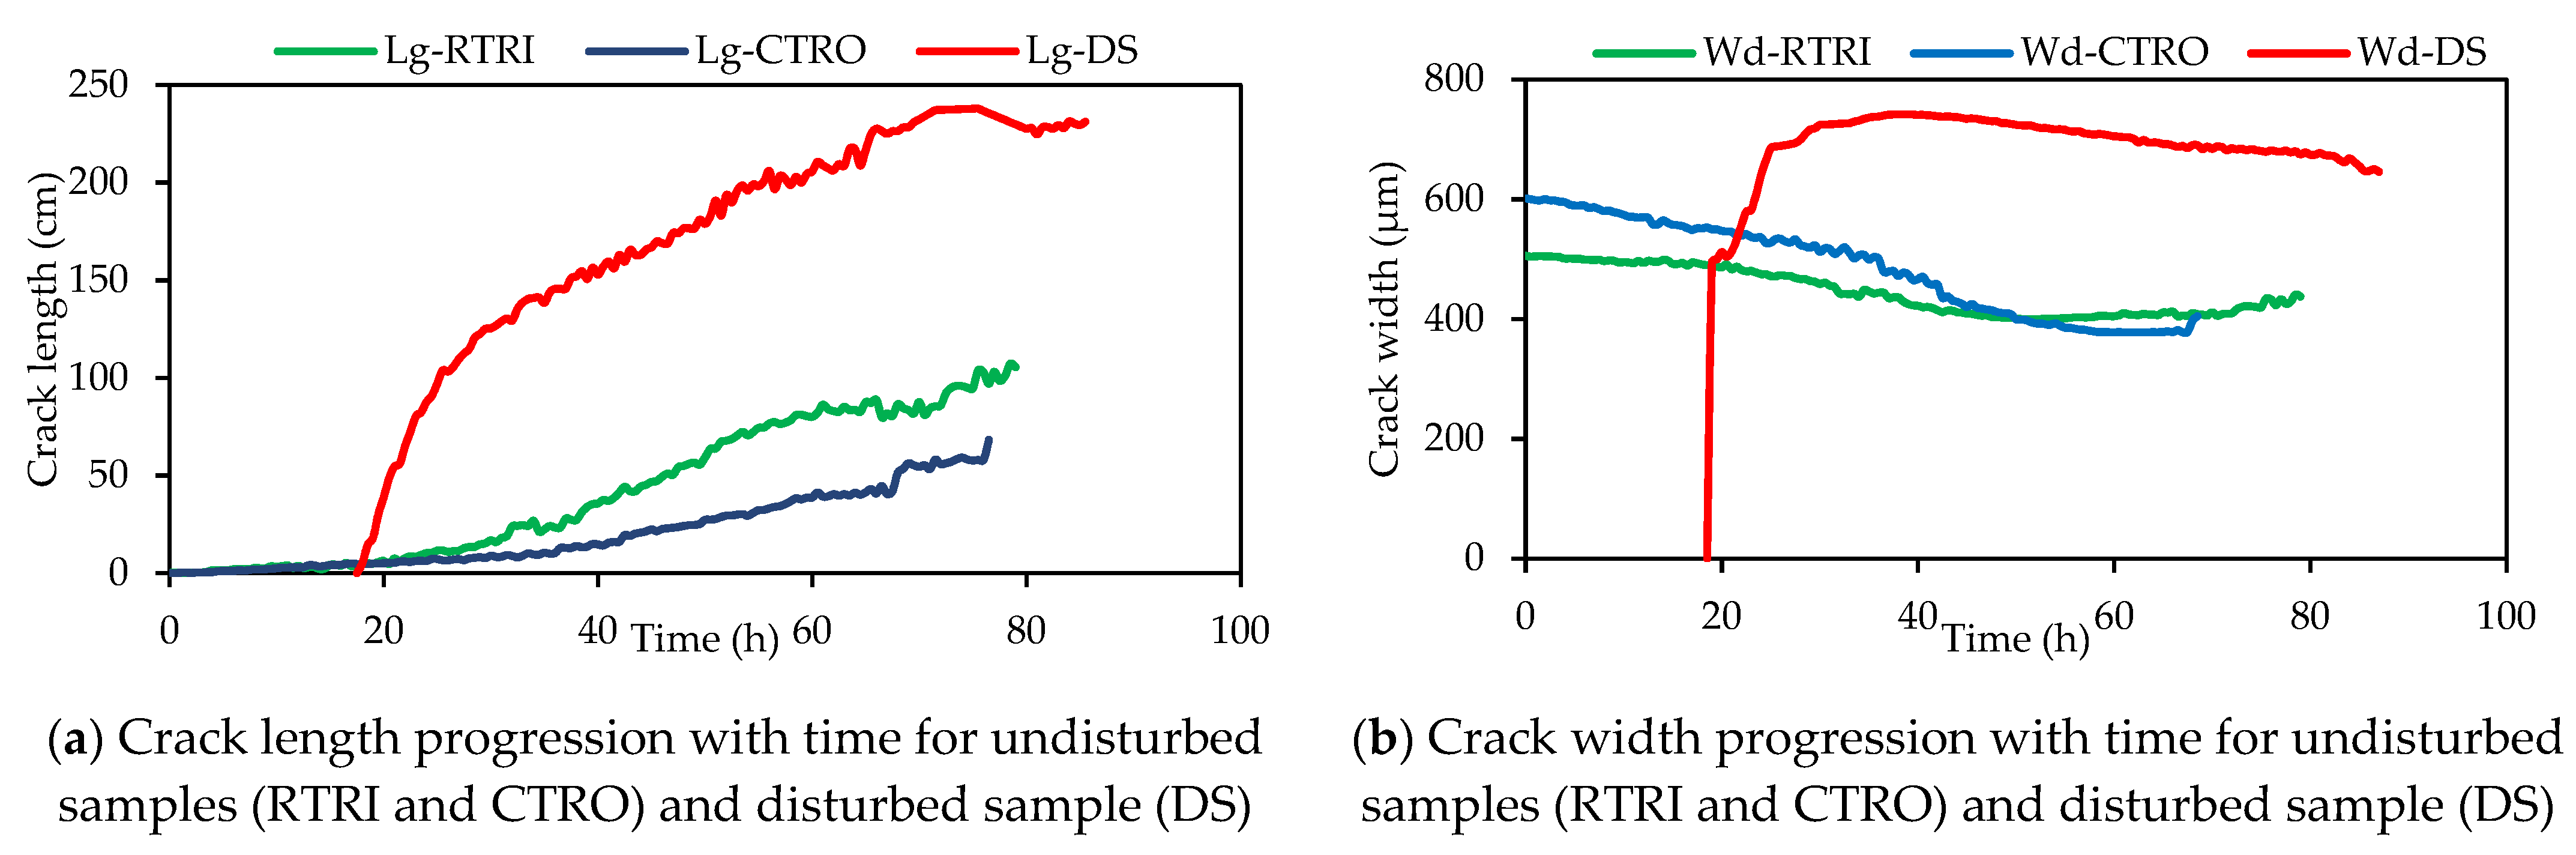
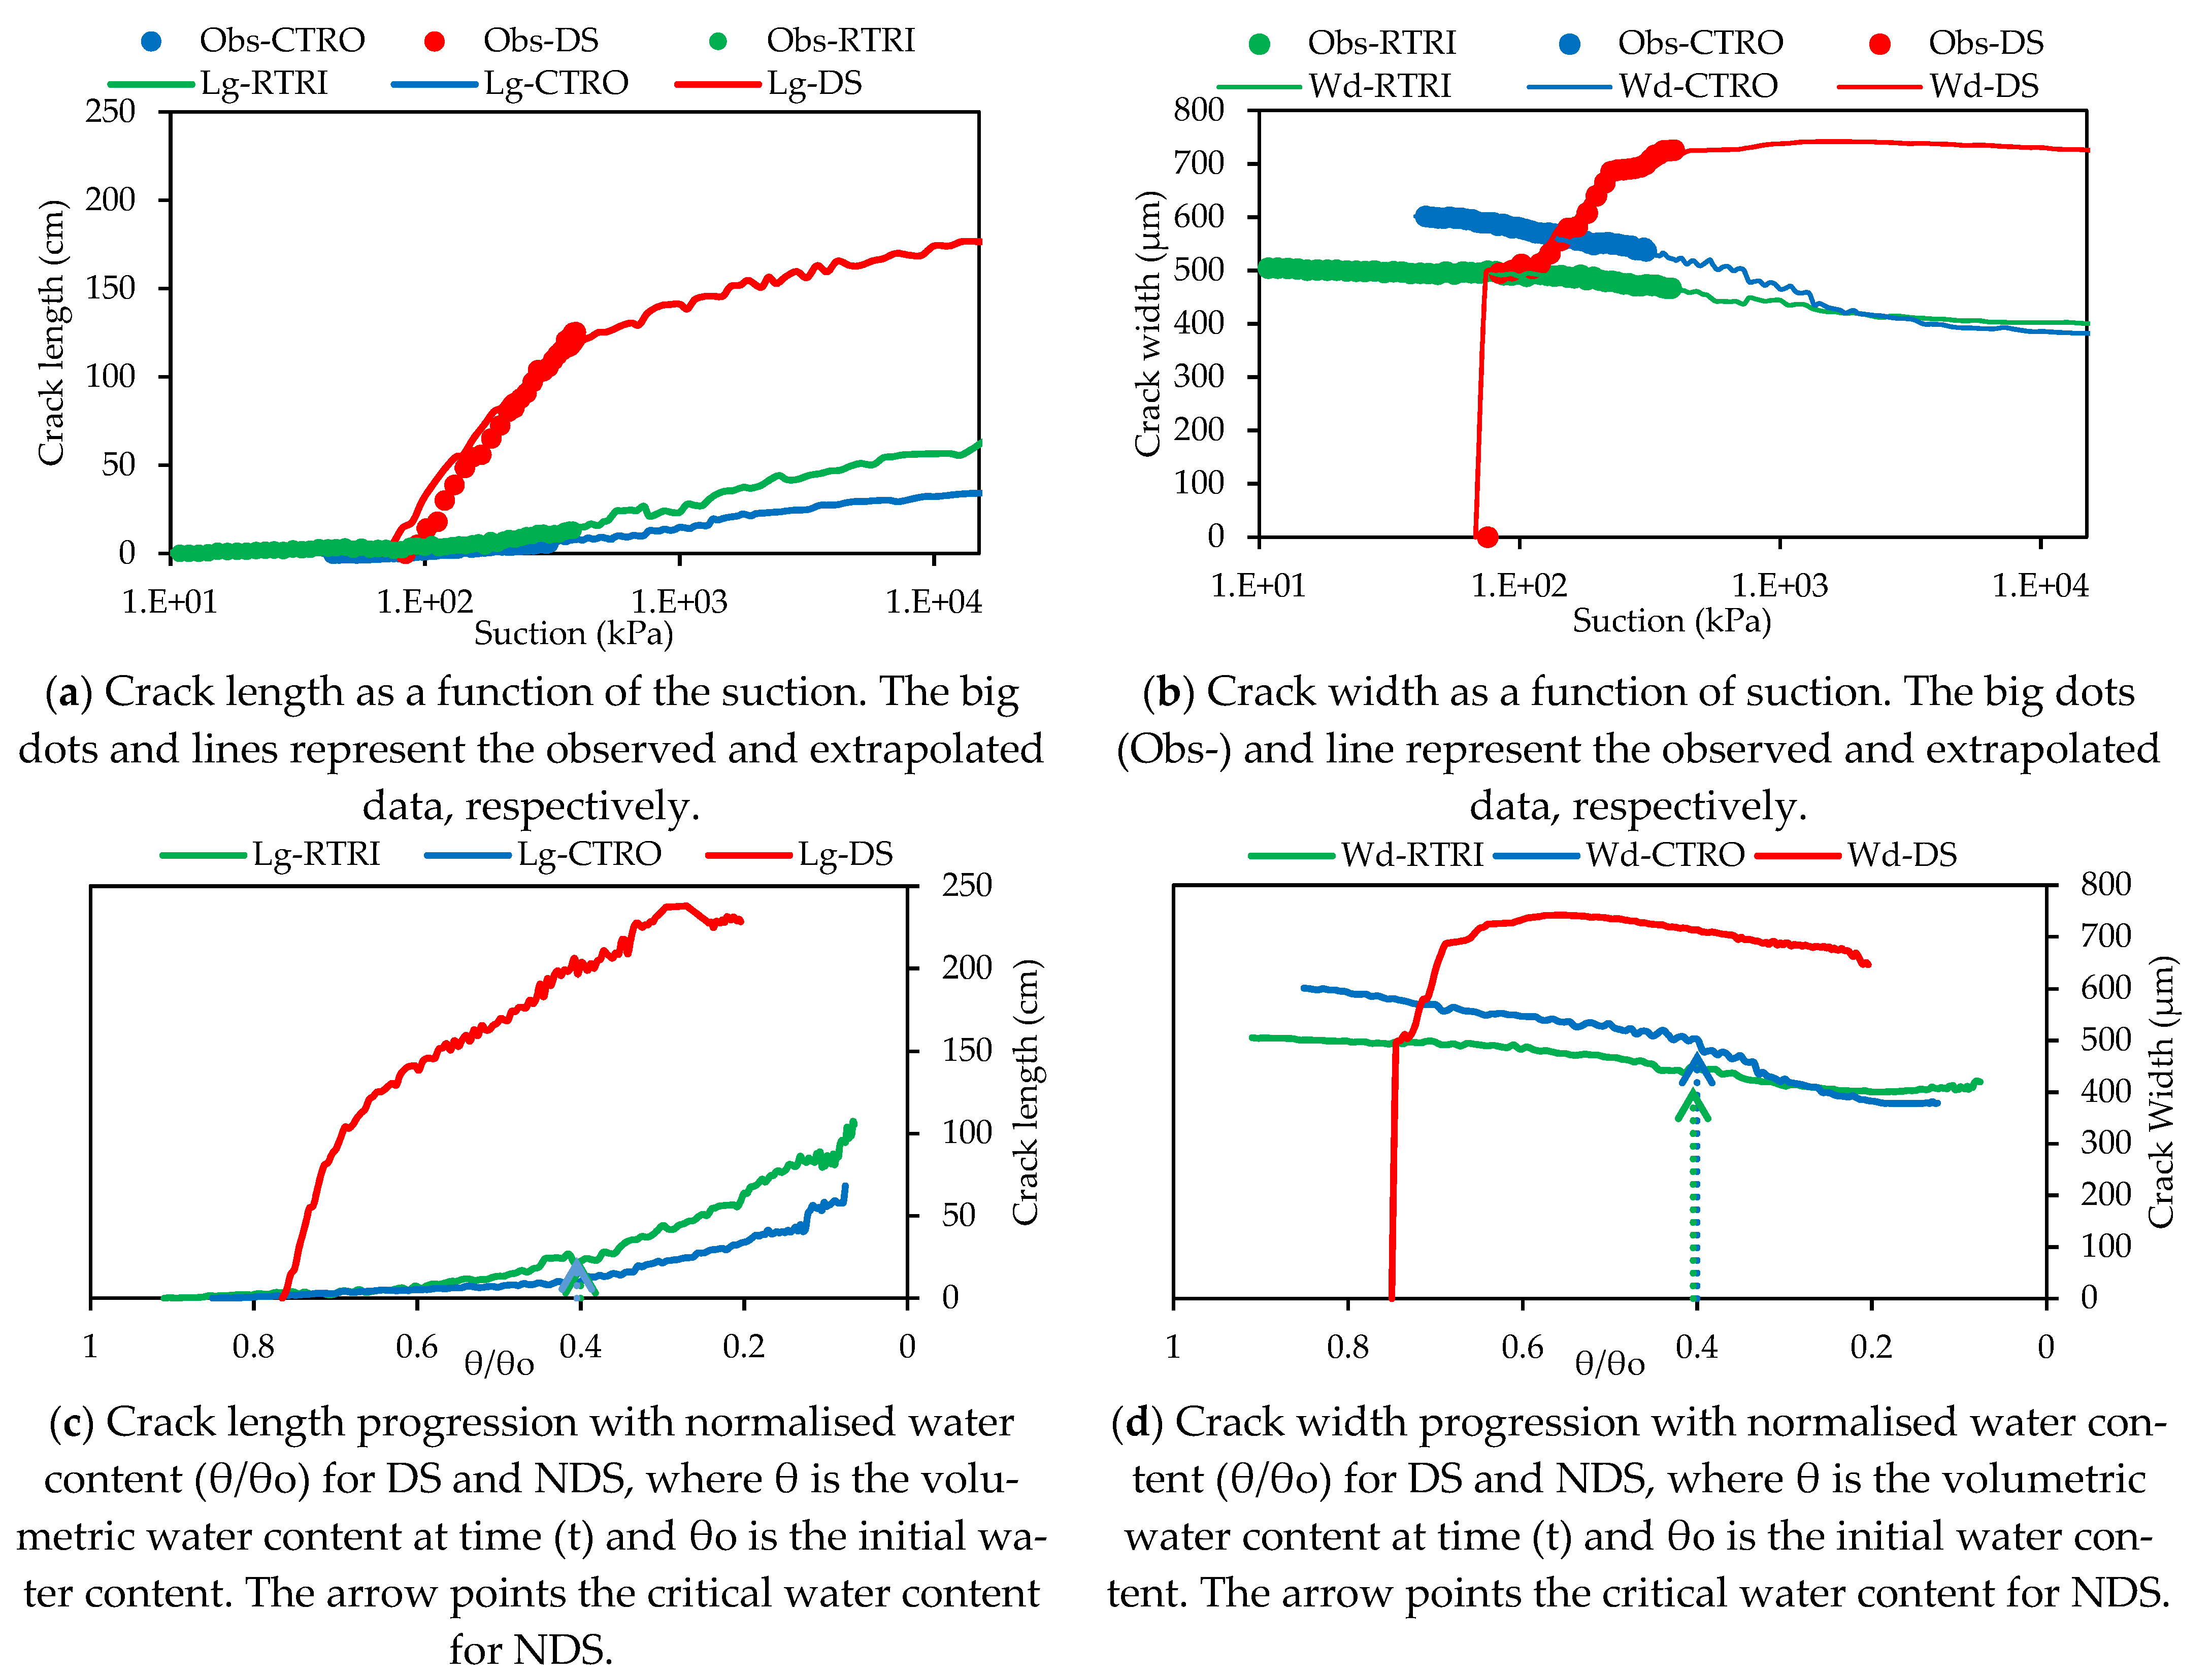
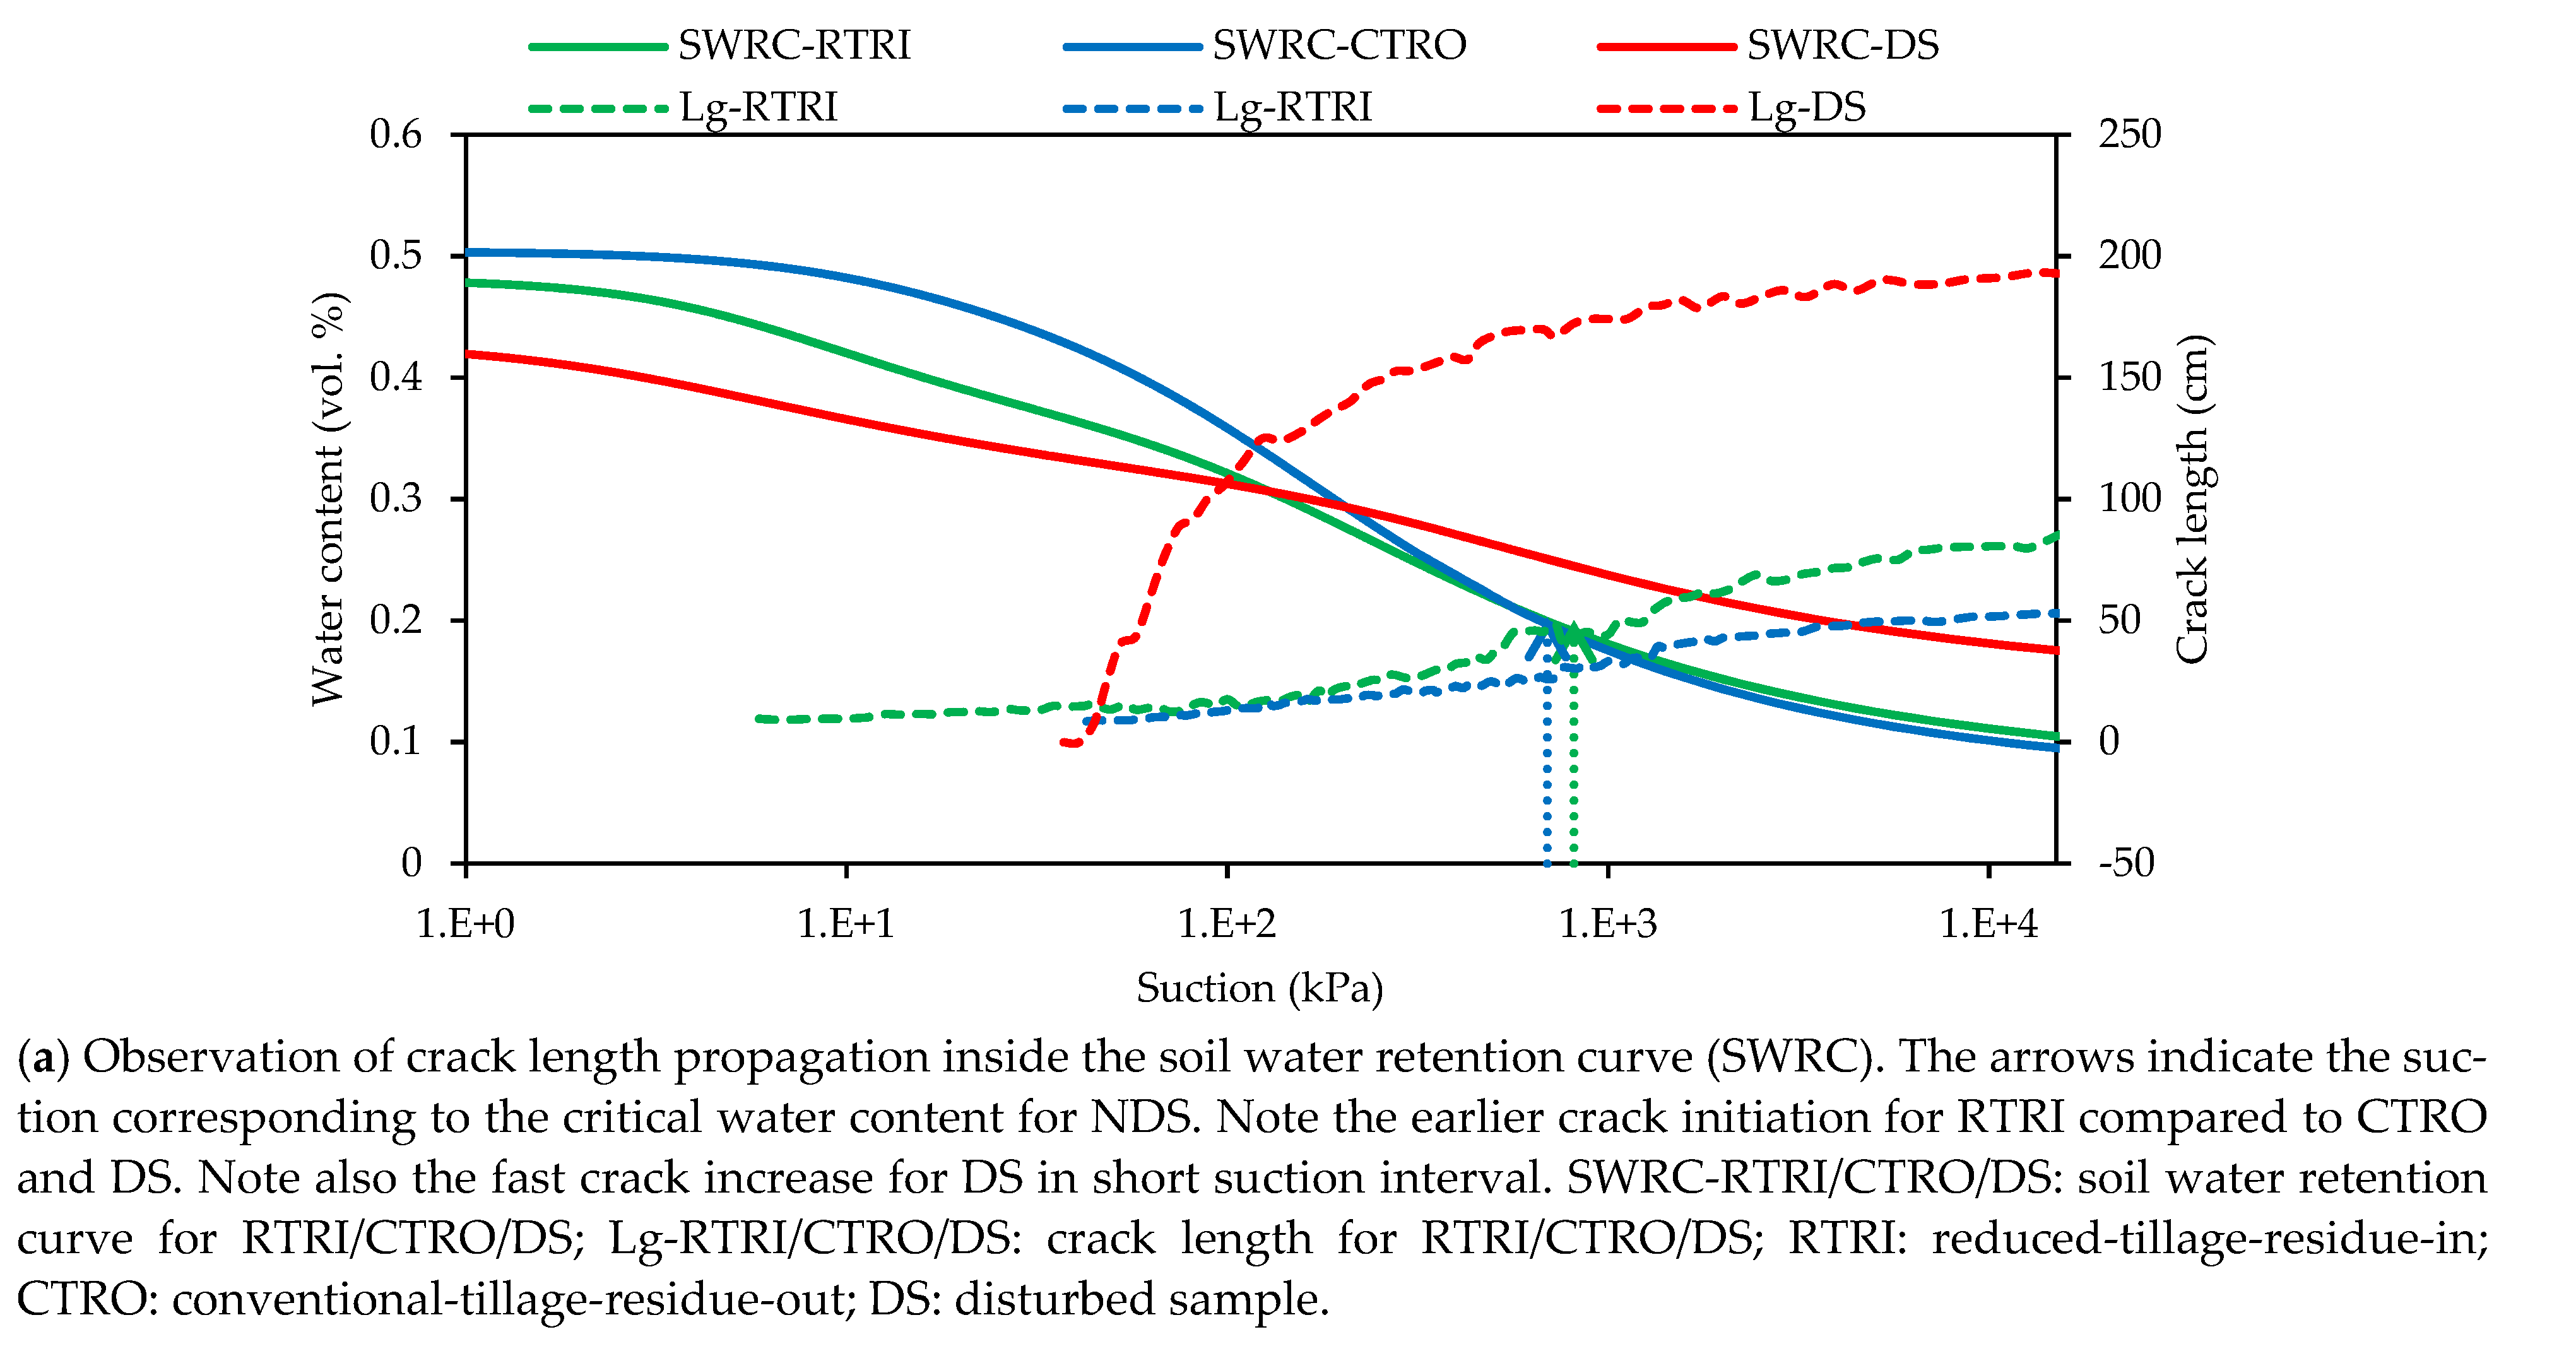
The crack initiation and development were driven differently (among treatments) by the water suction. The crack initiation required a stronger negative suction and a lower water content in the DS compared to the NDS. Concerning the NDS, the crack started at a slightly weaker (i.e., lower) suction (<100 kPa) in the RTRI than in the CTRO;
(2)
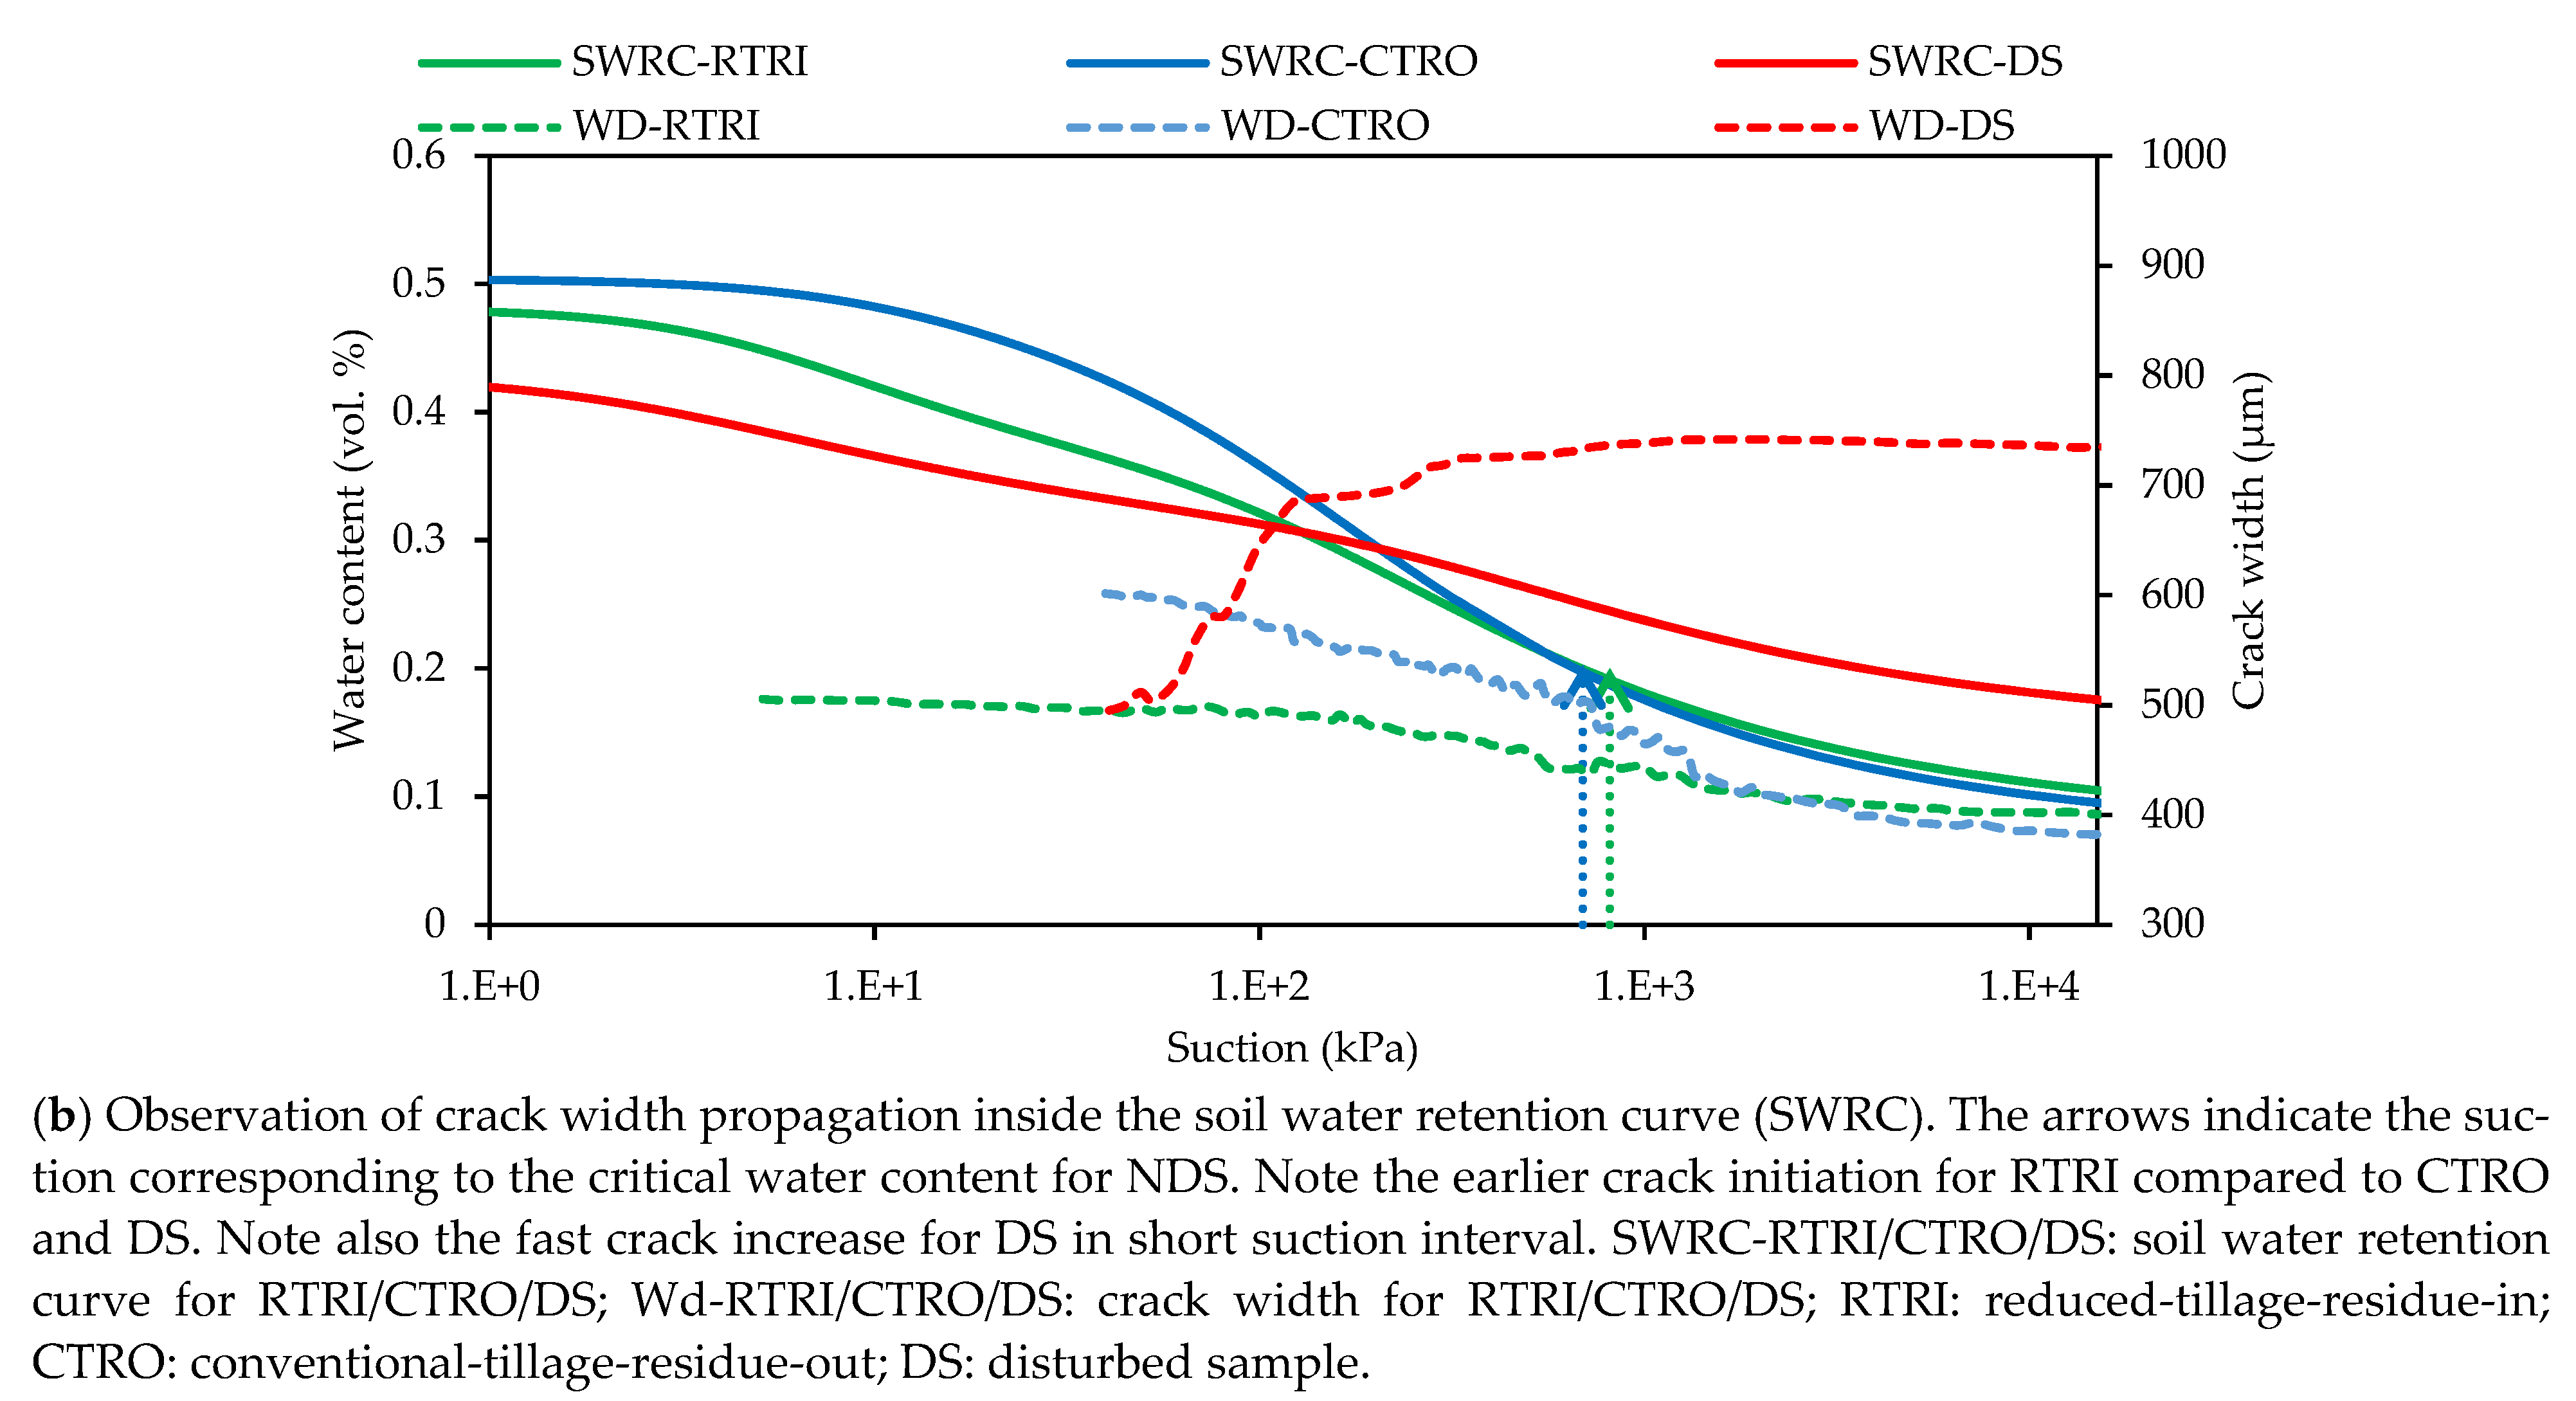
For the NDS, the soil structure was assumed to restrict further expansion during stronger suction. The DS could swell and shrink greatly, thereby producing thicker and longer cracks. This could be triggered by the lack of sample structure and the removal of frictional elements (i.e., sand, roots and fibre). The crack expanded faster in the NDS when the critical water content was reached and the evaporation started to drop (i.e., the end of constant evaporation rate period; CRP);
(3)
The soil water permeability was commonly related to the soil pore size distribution. The RTRI and the DS contained significantly higher macropores (>50 µm) than the CTRO. The rate and the duration of the CRP in the RTRI compared to the CTRO was related to the large pores (>50µm) and the potentially earlier forming cracks (at <100 kPa). This helped to explain the lower evaporation rate in the DS despite its high cracking length;
(4)
The cracks seem not to have affected the SWRC during the first drying, since they arrived late (>100 kPa) in the curve (for both the CTRO and the DS). However, the shrinkage observed brought about structural changes inside the sample even at a lower suction. After the first drying, the cracks changed the pore size distribution of the sample, which should affect the subsequent wettings and dryings.
The results of this study have revealed that soil disturbance (DS) changed the soil cracking pattern while decreasing the rate of evaporation and probably reducing the soil permeability. Therefore, care should be taken when analysing cracks through remoulded samples. Moreover, despite the small differences among the undisturbed samples, the RTRI presented slightly higher cracks, higher evaporation and higher macropores than the CTRO. Future studies should include other agricultural practices (e.g., the use of biochar or sticking mucilage, etc.) under laboratory and/or field conditions.

Author Contributions

Conceptualization, N.R., A.D. and R.C.; methodology, N.R., A.D., B.M., A.L. and R.C.; software, N.R. and B.M.; validation, N.R., D.T. and A.D.; formal analysis, N.R., D.T. and A.L.; investigation, N.R. and A.D.; resources, A.D. and R.C.; writing—original draft preparation, N.R., A.D. and R.C.; writing—review and editing, N.R., A.D., B.M., A.L., D.T. and R.C.; visualization; supervision, A.D. and R.C.; funding acquisition, A.D. and R.C. All authors have read and agreed to the published version of the manuscript.

Funding

This research was fully supported by the FNRS–FRIA fund of Wallonia-Brussels Federation of Belgium in cooperation with the University of Liège, Belgium.

Institutional Review Board Statement

Not applicable.

Informed Consent Statement

Not applicable.

Data Availability Statement

The data presented in this study are available on request from the corresponding author. The data are not publicly available due to grant restriction.

Conflicts of Interest

The authors declare no conflict of interest.

Appendix A

Table A1. Parameters of soil water evaporation curve.
Treatmentα (m·s−1)Wcrit (%)Qmax (cm3·Day−1)
RTRI0.00221 ± 0.00017 a *0.2 ± 0.016181.28 ± 14.09 a *
CTRO0.00161 ± 0.00017 ab0.2 ± 0.016131.68 ± 14.09 ab
DS0.00111 ± 0.00017 b 90.56 ± 14.09 b
* Wcrit: critical water content; α: mass transfer coefficient α (m/s); qmax: maximum drying rate (cm3·day−1); N/A: not enough data.

Appendix B

Table A2. ANOVA of pore size distribution (PSD) class.
SourceDFSum of SquaresMean SquaresFPr > F
Model20.00830.004211.90100.0056
Error70.00250.0004
Corrected Total90.0108

Appendix C

Table A3. Model parameters of van Genuchten [26] and Durner [27].
Treatmentθsθrwa/m bR2
RTRI (DB)0.477 ± 0.0330.053 ± 0.0460.24 ± 0.1820.999 ± 0.001
CTRO (VG)0.499 ± 0.0046.5810−6 ± 8.7210−61.275 ± 0.0550.989 ± 0.009
DS (DB)0.467 ± 0.0460.16 ± 0.0830.217 ± 0.2040.998 ± 0.002
a DB: bimodal model of Durner b; VG: monomodal model of van Genuchten; θs: saturated water content; θr: residual water content; R2: determination coefficient. The value indicates mean ± standard error.
Table A4. Detailed information about the model’s parameters.
Treatmentθsθrw1a1/an1/ma2n2R2
RTRI-10.4430.0000.0330.0057.940.00161.300.99776
RTRI-20.4810.0750.3150.0191.78470.00081.460.99998
RTRI-30.5080.0830.3720.0181.53980.00061.480.99996
CTRO-10.4968.8510−7N/A0.0021.3284N/AN/A0.99829
CTRO-20.5032.2410−6N/A0.0041.219N/AN/A0.98094
CTRO-30.4981.5510−5N/A0.0021.2786N/AN/A0.98678
DS-10.4710.0500.2940.0791.37230.00031.330.99810
DS-20.4280.1450.4700.0381.43870.00041.420.99930
DS-30.5310.2050.0380.12227.6590.01791.190.99775
R2: determination coefficient.

Appendix D

Figure A1. Correlation coefficient and RMSE between observed and fitted water suction from SWRC. Graph shows the linear correlation between predicted (from SWRC) and observed data. Slope = 1: perfect estimation, Slope > or < 1: over and underestimation.
Soilsystems 05 00064 g0a1
Table A5. Correlation coefficient and RMSE between observed and fitted water suction from SWRC. Characteristic and error between predicted/observed suction data.
TreatmentNb-ObsSlopeR2RMSE
RTRI581.070.99870.0603
CTRO470.930.99920.0575
DS271.270.98810.0696
Nb-Obs: number of observations; Slope: slope of the correlation between predicted versus observed data; R2: correlation coefficient of determination; RMSE: Root Mean Square Error.

References

  1. Gentile, A.R.; Barceló-Cordón, S.; Van Liedekerke, M. JRC Publications Repository—Soil Country Analyses—Belgium. Available online: https://publications.jrc.ec.europa.eu/repository/handle/JRC53315 (accessed on 20 September 2021). [CrossRef]
  2. Stoops, G.; Langohr, R.; Van Ranst, E. Micromorphology of Soils and Palaeosoils in Belgium. An Inventory and Meta-Analysis. Catena 2020, 194, 104718. [Google Scholar] [CrossRef]
  3. Shepidchenko, T.; Zhang, J.; Tang, X.; Liu, T.; Dong, Z.; Zheng, G.; Yang, L. Experimental Study of the Main Controlling Factors of Desiccation Crack Formation from Mud to Shale. J. Pet. Sci. Eng. 2020, 194, 107414. [Google Scholar] [CrossRef]
  4. Lakshmikantha, M.R.; Prat, P.C.; Ledesma, A. Image Analysis for the Quantification of a Developing Crack Network on a Drying Soil. Geotech. Test. J. 2009, 32, 505–515. [Google Scholar] [CrossRef]
  5. Zeng, H.; Tang, C.; Cheng, Q.; Inyang, H.I.; Rong, D.; Lin, L.; Shi, B. Coupling Effects of Interfacial Friction and Layer Thickness on Soil Desiccation Cracking Behavior. Eng. Geol. 2019, 260, 105220. [Google Scholar] [CrossRef]
  6. Tang, C.S.; Cui, Y.J.; Tang, A.M.; Shi, B. Experiment Evidence on the Temperature Dependence of Desiccation Cracking Behavior of Clayey Soils. Eng. Geol. 2010, 114, 261–266. [Google Scholar] [CrossRef] [Green Version]
  7. Merlin, O.; Stefan, V.; Amazirh, A.; Chanzy, A.; Ceschia, E.; Er-Raki, S.; Gentine, P.; Tallec, T.; Ezzahar, J.; Bircher, S.; et al. Modeling Soil Evaporation Efficiency in a Range of Soil and Atmospheric Conditions Using a Meta-Analysis Approach. Water Resour. Res. 2016, 52, 3663–3684. [Google Scholar] [CrossRef] [Green Version]
  8. Aguilar Torres, M.A.; De Luna Armenteros, E.; Ordóñez Fernández, R.; González Fernández, P. Digital Image Analysis for the Estimation of Cracked Areas and the Soil Shrinkage Characteristic Curve in Clay Soils Amended with Composted Sewage Sludge. Span. J. Agric. Res. 2004, 2, 473–479. [Google Scholar] [CrossRef] [Green Version]
  9. Lu, Y.; Gu, K.; Zhang, Y.; Tang, C.; Shen, Z.; Shi, B. Impact of Biochar on the Desiccation Cracking Behavior of Silty Clay and Its Mechanisms. Sci. Total Environ. 2021, 794, 148608. [Google Scholar] [CrossRef]
  10. Weninger, T.; Julich, S.; Feger, K.-H.; Schwärzel, K.; Bodner, G.; Schwen, A. Effects of Tillage Intensity on Pore System and Physical Quality of Silt-Textured Soils Detected by Multiple Methods. Soil Res. 2019, 57, 703–711. [Google Scholar] [CrossRef]
  11. Tang, C.; Shi, B.; Liu, C.; Zhao, L.; Wang, B. Influencing Factors of Geometrical Structure of Surface Shrinkage Cracks in Clayey Soils. Eng. Geol. 2008, 101, 204–217. [Google Scholar] [CrossRef]
  12. Tang, C.S.; Cui, Y.J.; Shi, B.; Tang, A.M.; Liu, C. Desiccation and Cracking Behaviour of Clay Layer from Slurry State under Wetting-Drying Cycles. Geoderma 2011, 166, 111–118. [Google Scholar] [CrossRef] [Green Version]
  13. Peron, H.; Hueckel, T.; Laloui, L.; Hu, L.B. Fundamentals of Desiccation Cracking of Fine-Grained Soils: Experimental Characterisation and Mechanisms Identification. Can. Geotech. J. 2009, 46, 1177–1201. [Google Scholar] [CrossRef]
  14. Zhang, X.; Xin, X.; Zhu, A.; Zhang, J.; Yang, W. Effects of Tillage and Residue Managements on Organic C Accumulation and Soil Aggregation in a Sandy Loam Soil of the North China Plain. Catena 2017, 156, 176–183. [Google Scholar] [CrossRef]
  15. Mihashi, H.; Ahmed, S.F.U.; Mizukami, T.; Nishiwaki, T. Quantification of Crack Formation Using Image Analysis and Its Relationship with Permeability TT—Bauinstandsetzen Und Baudenkmalpflege: Eine Internationale Zeitschrift. Restor. Build. Monum. an Int. J. Bauinstandsetz. und Baudenkmalpfl. eine Int. Zeitschrift 2006, 12, 335–348. [Google Scholar]
  16. Léonard, A. Étude Du Séchage Convectif de Boues de Station d’épuration—Suivi de La Texture Par Microtomographie à Rayons X. Ph.D. Dissertation, Université de Liège, Liège, Belgique, 2002. [Google Scholar]
  17. Kowalski, S.J. Thermomechanics of Drying Processes; Lecture Notes in Applied and Computational Mechanics; Springer Berlin Heidelberg: Berlin/Heidelberg, Germany, 2012; Volume 8. [Google Scholar]
  18. Hubert, J.; Plougonven, E.; Prime, N.; Léonard, A.; Collin, F. Comprehensive Study of the Drying Behavior of Boom Clay: Experimental Investigation and Numerical Modeling. Int. J. Numer. Anal. Methods Geomech. 2018, 42, 211–230. [Google Scholar] [CrossRef] [Green Version]
  19. Al-Dakheeli, H.; Bulut, R.; Clarke, C.R.; Nevels, J.B. Hydro-Mechanical Analysis of Crack Initiation in Expansive Soils. In Geotechnical Special Publication; Ascelibrary: Dallas, TX, USA, 2018; pp. 332–340. [Google Scholar] [CrossRef]
  20. Lomeling, D.; Kenyi, M.C.; Lodiong, M.A.; Kenyi, M.S.; Silvestro, G.M.; Yieb, J.L.L. Characterizing Dessication Cracking of a Remolded Clay (Eutric Vertisol) Using the Fractal Dimension Approach. Open J. Soil Sci. 2016, 6, 68–80. [Google Scholar] [CrossRef] [Green Version]
  21. WRB. World Reference Base for Soil Resources 2014, Update 2015. International Soil Classification System for Naming Soils and Creating Legends for Soil Maps. World Soil Resources Reports No. 106; FAO: Rome, Italy, 2014. [Google Scholar] [CrossRef]
  22. Degrune, F.; Theodorakopoulos, N.; Colinet, G.; Hiel, M.P.; Bodson, B.; Taminiau, B.; Daube, G.; Vandenbol, M.; Hartmann, M. Temporal Dynamics of Soil Microbial Communities below the Seedbed under Two Contrasting Tillage Regimes. Front. Microbiol. 2017, 8, 1127. [Google Scholar] [CrossRef]
  23. Tran, D.K.; Ralaizafisoloarivony, N.; Charlier, R.; Mercatoris, B.; Léonard, A.; Toye, D.; Degré, A. Studying the Effect of Desiccation Cracking on the Evaporation Process of a Luvisol—From a Small-Scale Experimental and Numerical Approach. Soil Tillage Res. 2019, 193, 142–152. [Google Scholar] [CrossRef]
  24. Song, W.K.; Cui, Y.J. Modelling of Water Evaporation from Cracked Clayey Soil. Eng. Geol. 2020, 266, 105465. [Google Scholar] [CrossRef]
  25. Gerard, P.; Mahdad, M.; Mccormack, A.R.; François, B. A Unified Failure Criterion for Unstabilized Rammed Earth Materials upon Varying Relative Humidity Conditions. Constr. Build. Mater. 2015, 95, 437–447. [Google Scholar] [CrossRef]
  26. van Genuchten, M.T. A Closed-Form Equation for Predicting the Hydraulic Conductivity of Unsaturated Soils. Soil Sci. Soc. Am. J. 1980, 44, 892–898. [Google Scholar] [CrossRef] [Green Version]
  27. Durner, W. Hydraulic Conductivity Estimation for Soils with Heterogeneous Pore Structure. Water Resour. Res. 1994, 30, 211–223. [Google Scholar] [CrossRef]
  28. Seki, K. SWRC Fit—A Nonlinear Fitting Program with a Water Retention Curve for Soils Having Unimodal and Bimodal Pore Structure. Hydrol. Earth Syst. Sci. Discuss. 2007, 4, 407–437. [Google Scholar] [CrossRef] [Green Version]
  29. Chang, C.-C.; Cheng, D.-H. Predicting the Soil Water Retention Curve from the Particle Size Distribution Based on a Pore Space Geometry Containing Slit-Shaped Spaces. Hydrol. Earth Syst. Sci. 2018, 22, 4621–4632. [Google Scholar] [CrossRef] [Green Version]
  30. Le Roux, S.; Medjedoub, F.; Dour, G.; Rézaï-Aria, F. Image Analysis of Microscopic Crack Patterns Applied to Thermal Fatigue Heat-Checking of High Temperature Tool Steels. Micron 2013, 44, 347–358. [Google Scholar] [CrossRef] [PubMed]
  31. Li, J.H.; Li, L.; Chen, R.; Li, D.Q. Cracking and Vertical Preferential Flow through Landfill Clay Liners. Eng. Geol. 2016, 206, 33–41. [Google Scholar] [CrossRef]
  32. Inan Sezer, G.; Ramyar, K.; Karasu, B.; Burak Göktepe, A.; Sezer, A. Image Analysis of Sulfate Attack on Hardened Cement Paste. Mater. Des. 2008, 29, 224–231. [Google Scholar] [CrossRef]
  33. Wang, L.L.; Tang, C.S.; Shi, B.; Cui, Y.J.; Zhang, G.Q.; Hilary, I. Nucleation and Propagation Mechanisms of Soil Desiccation Cracks. Eng. Geol. 2018, 238, 27–35. [Google Scholar] [CrossRef]
  34. Zhu, L.; Shen, T.; Ma, R.; Fan, D.; Zhang, Y.; Zha, Y. Development of Cracks in Soil: An Improved Physical Model. Geoderma 2020, 366, 114258. [Google Scholar] [CrossRef]
  35. Bishop, A.W. The Principle of Effective Stress. In Teknisk Ukeblad 39; Norges Geotekniske Institutes: Oslo, Norway, 1960; pp. 859–863. [Google Scholar]
  36. Terzaghi, K. Theoretical Soil Mechanics; John Wiley & Sons, Inc.: London, UK, 1943. [Google Scholar] [CrossRef]
  37. Yiotis, A.G.; Tsimpanogiannis, I.N.; Stubos, A.K.; Yortsos, Y.C. Pore-Network Study of the Characteristic Periods in the Drying of Porous Materials. J. Colloid Interface Sci. 2006, 297, 738–748. [Google Scholar] [CrossRef]
Figure 1. Overview of the experimental chamber set-up illustrating (a) tools: camera, balance, heating bulb, and sensors; (b) soil sample and metallic box.
Soilsystems 05 00064 g001
Figure 2. Image processing and analysis.
Soilsystems 05 00064 g002
Figure 3. Representative fibres (crop stubble/roots) collected from undisturbed samples (case of (a) RTRI-1 and (b) CTRO-1). Note the many small and almost decomposed roots from RTRI and the few large fresh stems (i.e., cereal) for CTRO. RTRI: reduced-tillage-residue-in; CTRO: conventional-tillage-residue-out.
Soilsystems 05 00064 g003
Figure 4. Graphs showing the progression of (a) water evaporation with time, (b) water evaporation with degree of saturation (Krisher’s curve), and (c) water content and water suction with time for each treatment. Note the deflexion of the evaporation curve from around the critical water content. The critical water content is also obtained from the average of three replicates as the treatment’s curves (RTRI, CTRO and DS). Evap-RTRI/CTRO/DS: Water evaporation for RTRI/CTRO/DS; Wc-RTRI/CTRO/DS: Water content for RTRI/CTRO/DS; Suct-RTRI/CTRO/DS: Water suction (kPa) for RTRI/CTRO/DS; RTRI: reduced-tillage-residue-in; CTRO: conventional-tillage-residue-out; DS: disturbed sample.
Soilsystems 05 00064 g004
Figure 5. Evaluation of crack progression presented in (a) length and (b) width for disturbed (DS) and undisturbed samples (NDS). The data was obtained from the average of three replicates. Note the large crack size and rapid crack increase in DS compared to CTRO and RTRI. The decrease in crack width indicates the formation of thinner cracks during drying. Note that crack width represents the average crack width (at time t) while crack length is the total crack length from a sample. Lg-RTRI/CTRO/DS: Crack length for RTRI/CTRO/DS; Wd-RTRI/CTRO/DS for RTRI/CTRO/DS; RTRI: reduced-tillage-residue-in; CTRO: conventional-tillage-residue-out; DS: disturbed sample; NDS = RTRI and CTRO.
Soilsystems 05 00064 g005
Figure 6. Crack development between 10–20 h after crack initiation, 30–40 h and 80 h for RTRI, CTRO and DS, respectively. Note the formation of the Y-junction cracks (i.e., cracks that intersect at 120°) for RTRI and CTRO while the T-junction cracks (i.e., cracks that intersect at 90°) and clod (looping cracks) for DS.
Soilsystems 05 00064 g006
Figure 7. Graphs illustrating the progression of (a) average crack length and (b) width in function of water suction (expressed in kPa) and with (c,d) degree of saturation, respectively. The degree of saturation indicates the ratio between the water content (at time t) over the initial saturated water content. The arrow indicates the critical water content measured from the Krischer’s curve (Figure 4b).
Soilsystems 05 00064 g007
Figure 8. Comparison between (a) pore size distribution (PSD) taken from SWRC and crack width frequency distribution obtained from image analysis and (b) pore percentage distributed in three pore classes. Note the bimodality (two pictures) of the curves from RTRI and DS while monomodal (one picture) curve for CTRO. Note also the significant pore percentage between 50–500 µm for DS and RTRI.
Soilsystems 05 00064 g008aSoilsystems 05 00064 g008b
Figure 9. Graph showing the crack initiation and development in the SWRC for DS and NDS. Note the early crack initiation in RTRI and the fast rise of cracks in DS. The arrow indicates the critical water for the NDS.
Soilsystems 05 00064 g009aSoilsystems 05 00064 g009b
Table 1. Soil physical characteristics and fibre content from each sample. The soil porosity is calculated from the bulk density considering the amount of soil organic matter. Fibre includes all fresh organic matter (roots, straw and stubbles) extracted from the undisturbed samples.
CategoryRTRICTRODS
BD, g cm−31.39 ± 0.02 b1.5 ± 0.02 a *1.56 ± 0.02 a *
Porosity0.46 ± 0.01 a *0.42 ± 0.01 b0.40 ± 0.01 b
pH7.78 ± 0.167.28 ± 0.148.3 ± 0.21
Clay, %15.93 ± 0.1615.13 ± 0.1615.95 ± 0.14
Silt, %78.62 ± 0.1879.48 ± 0.1878.98 ± 0.15
Sand, %5.44 ± 0.095.38 ± 0.095.07 ± 0.08
Fibre total area, cm225.99 ± 8.6327.85 ± 10.690.00 ± 0.00
Fibre total length, cm169.17 ± 76.15110.55 ± 55.260.00 ± 0.00
Fibre average width, cm0.16 ± 0.030.22 ± 0.060.00 ± 0.00
Fibre weight, g0.87 ± 0.11.02 ± 0.090.00 ± 0.00
Fibre percentage, mg g−1 soil0.71 ± 0.10.89 ± 0.060.00 ± 0.00
BD: bulk density; a,b,c: significance difference at 5% error (* p > 0.01; RTRI: reduced-tillage residue-in; CTRO: conventional-tillage-residue-out; DS: disturbed sample; N/A: no data. Note: values represent means ± standard error of the mean (n = 9).
Publisher’s Note: MDPI stays neutral with regard to jurisdictional claims in published maps and institutional affiliations.

