
Enrichment and Fractionation of Rare Earth Elements in an Estuarine Marsh Soil Receiving Acid Discharges from Legacy Sulfide Mine Wastes


Abstract
:
1. Introduction
2. Site Description and History
3. Materials and Methods
4. Results and Discussion
4.1. Field Observations
4.2. Soil pH and Mineralogy
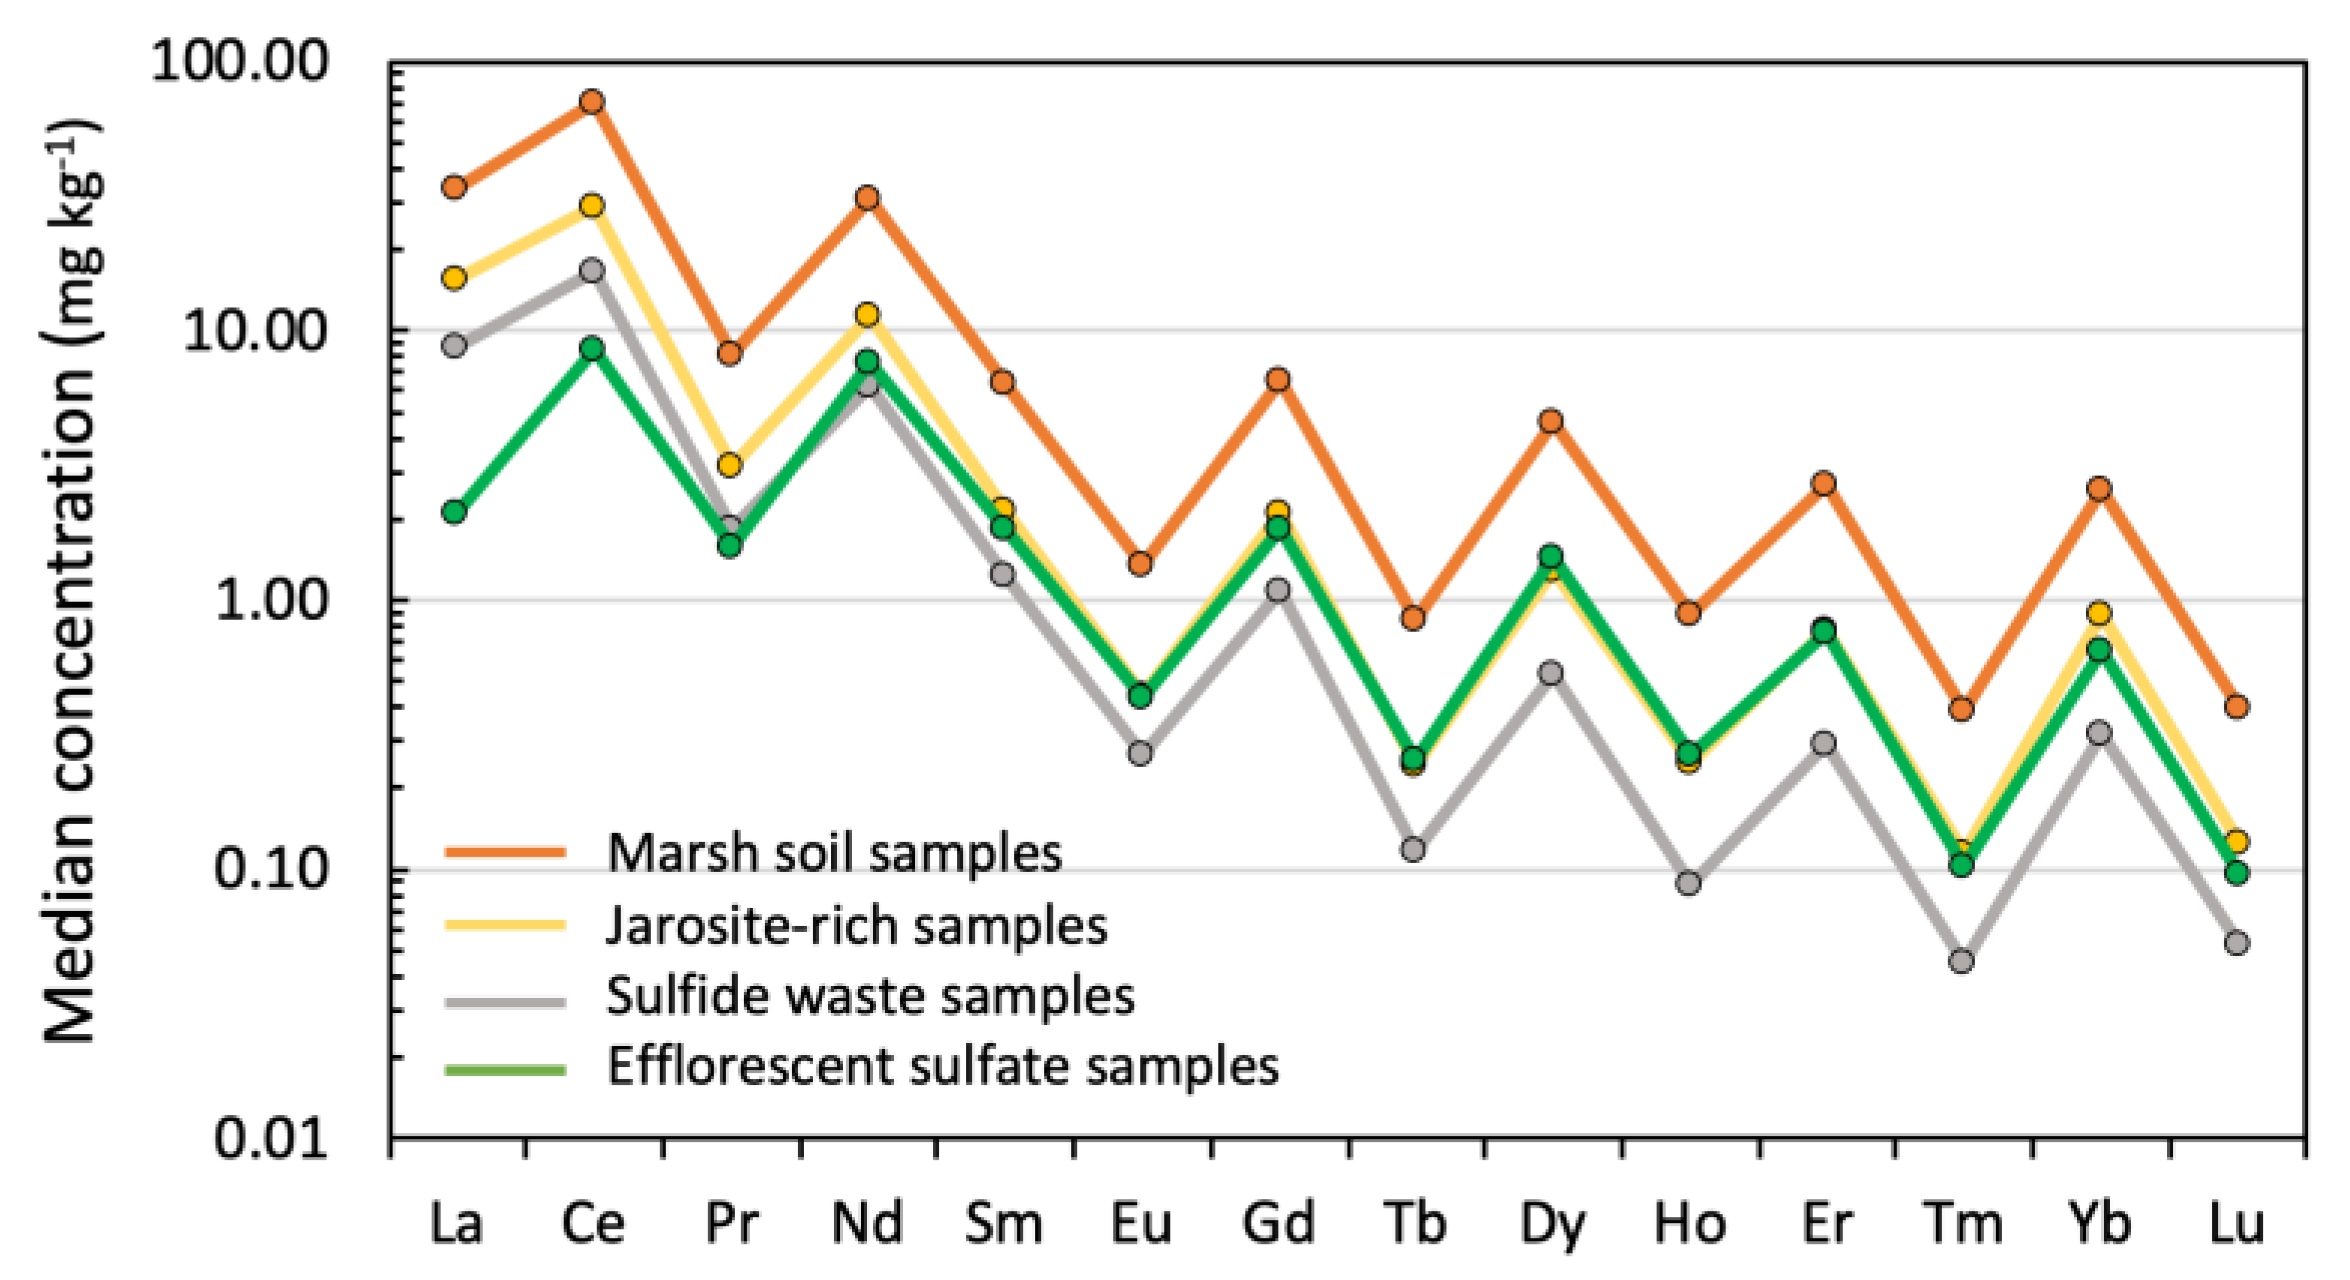
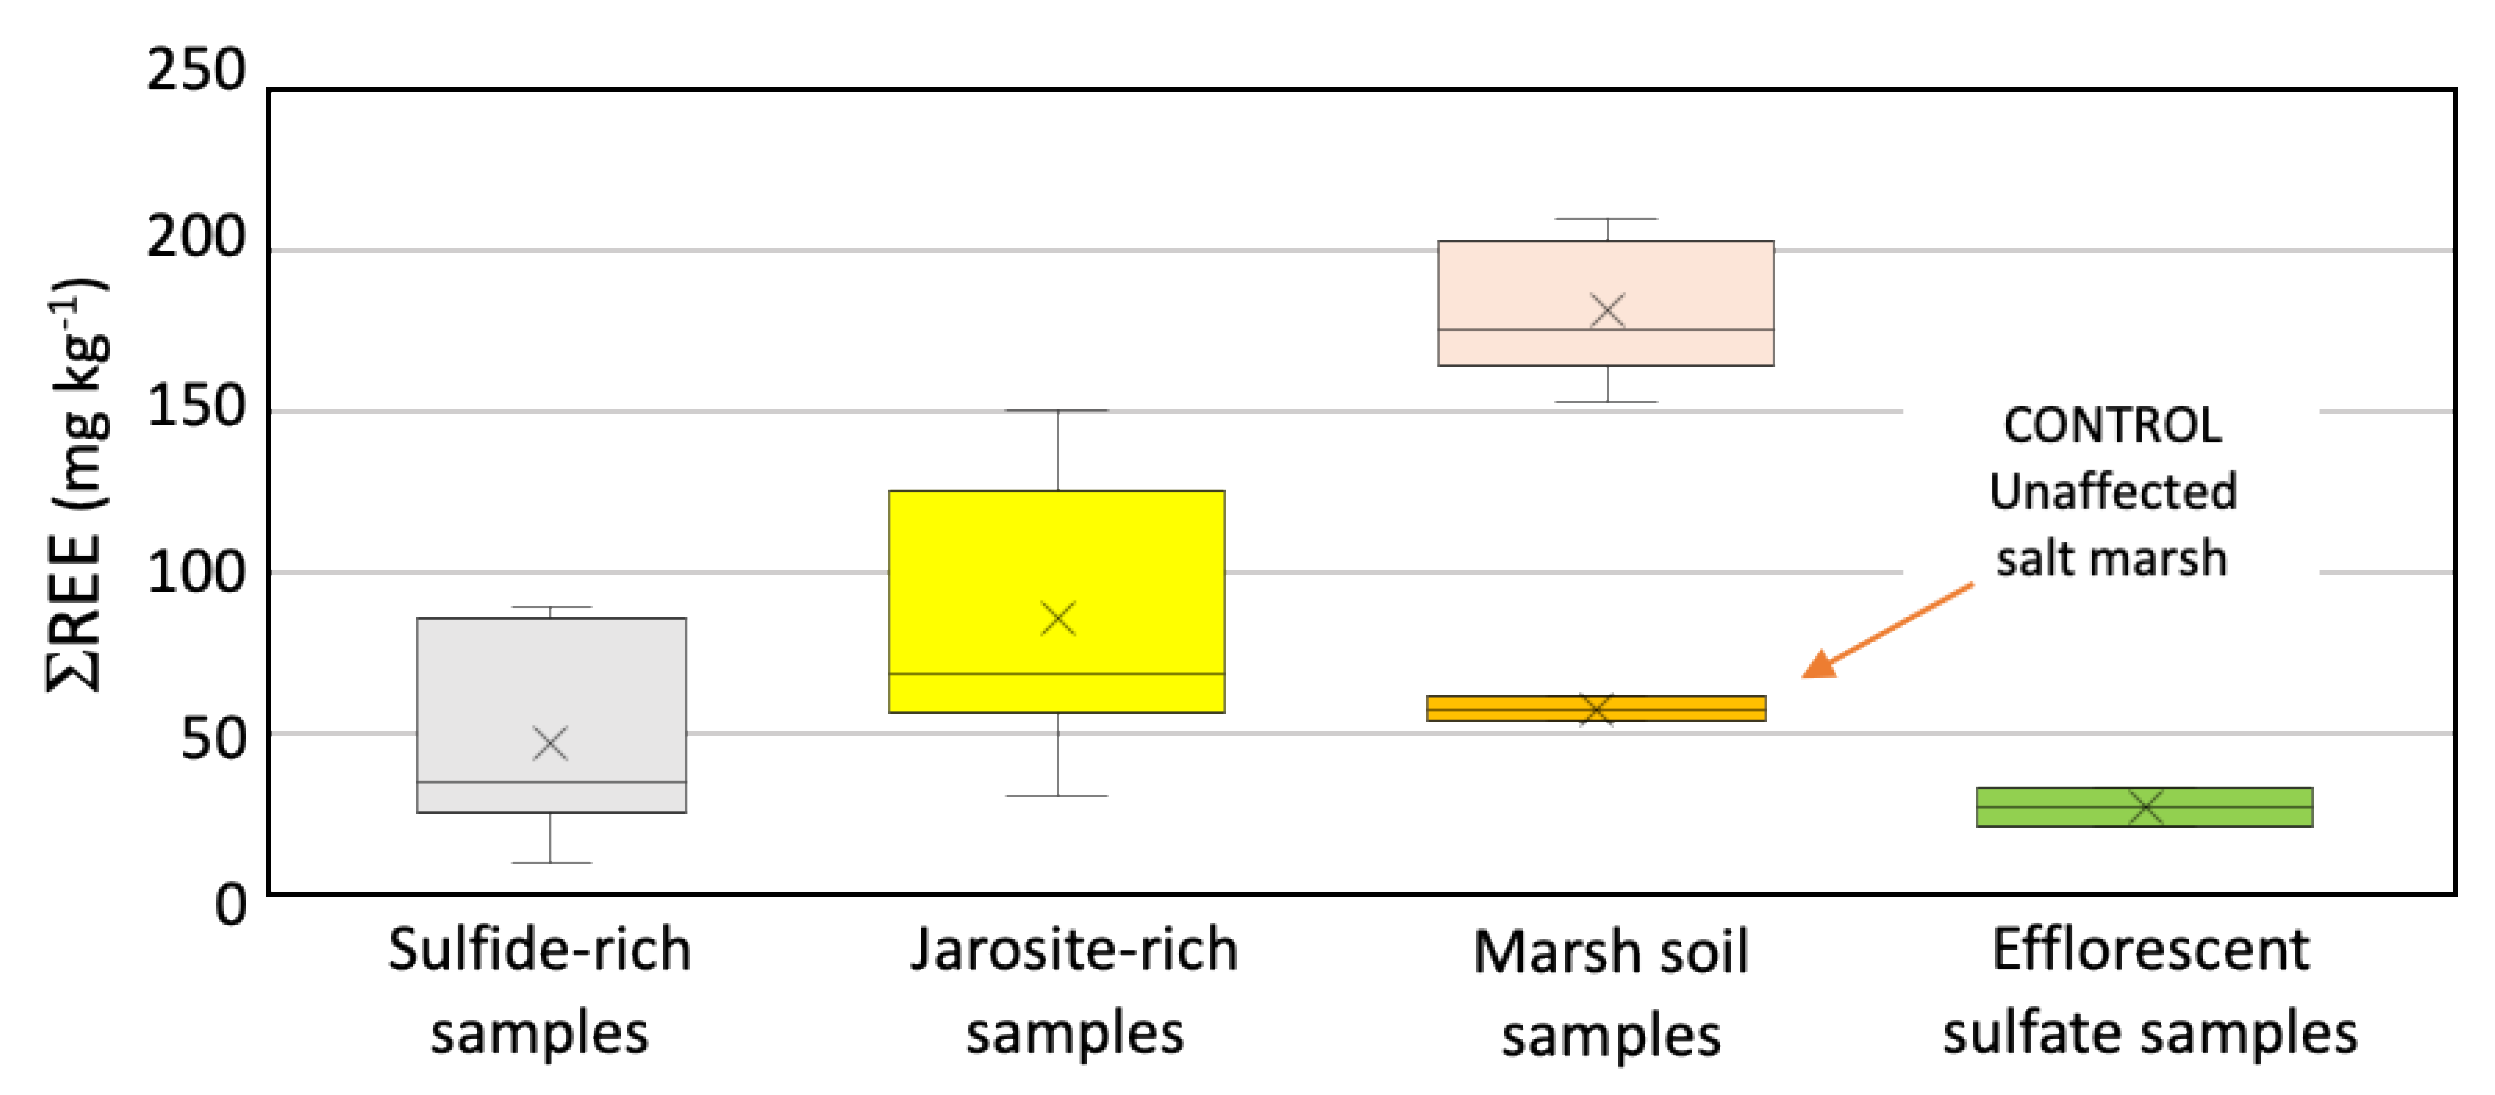
4.3. REE Abundance and Distribution
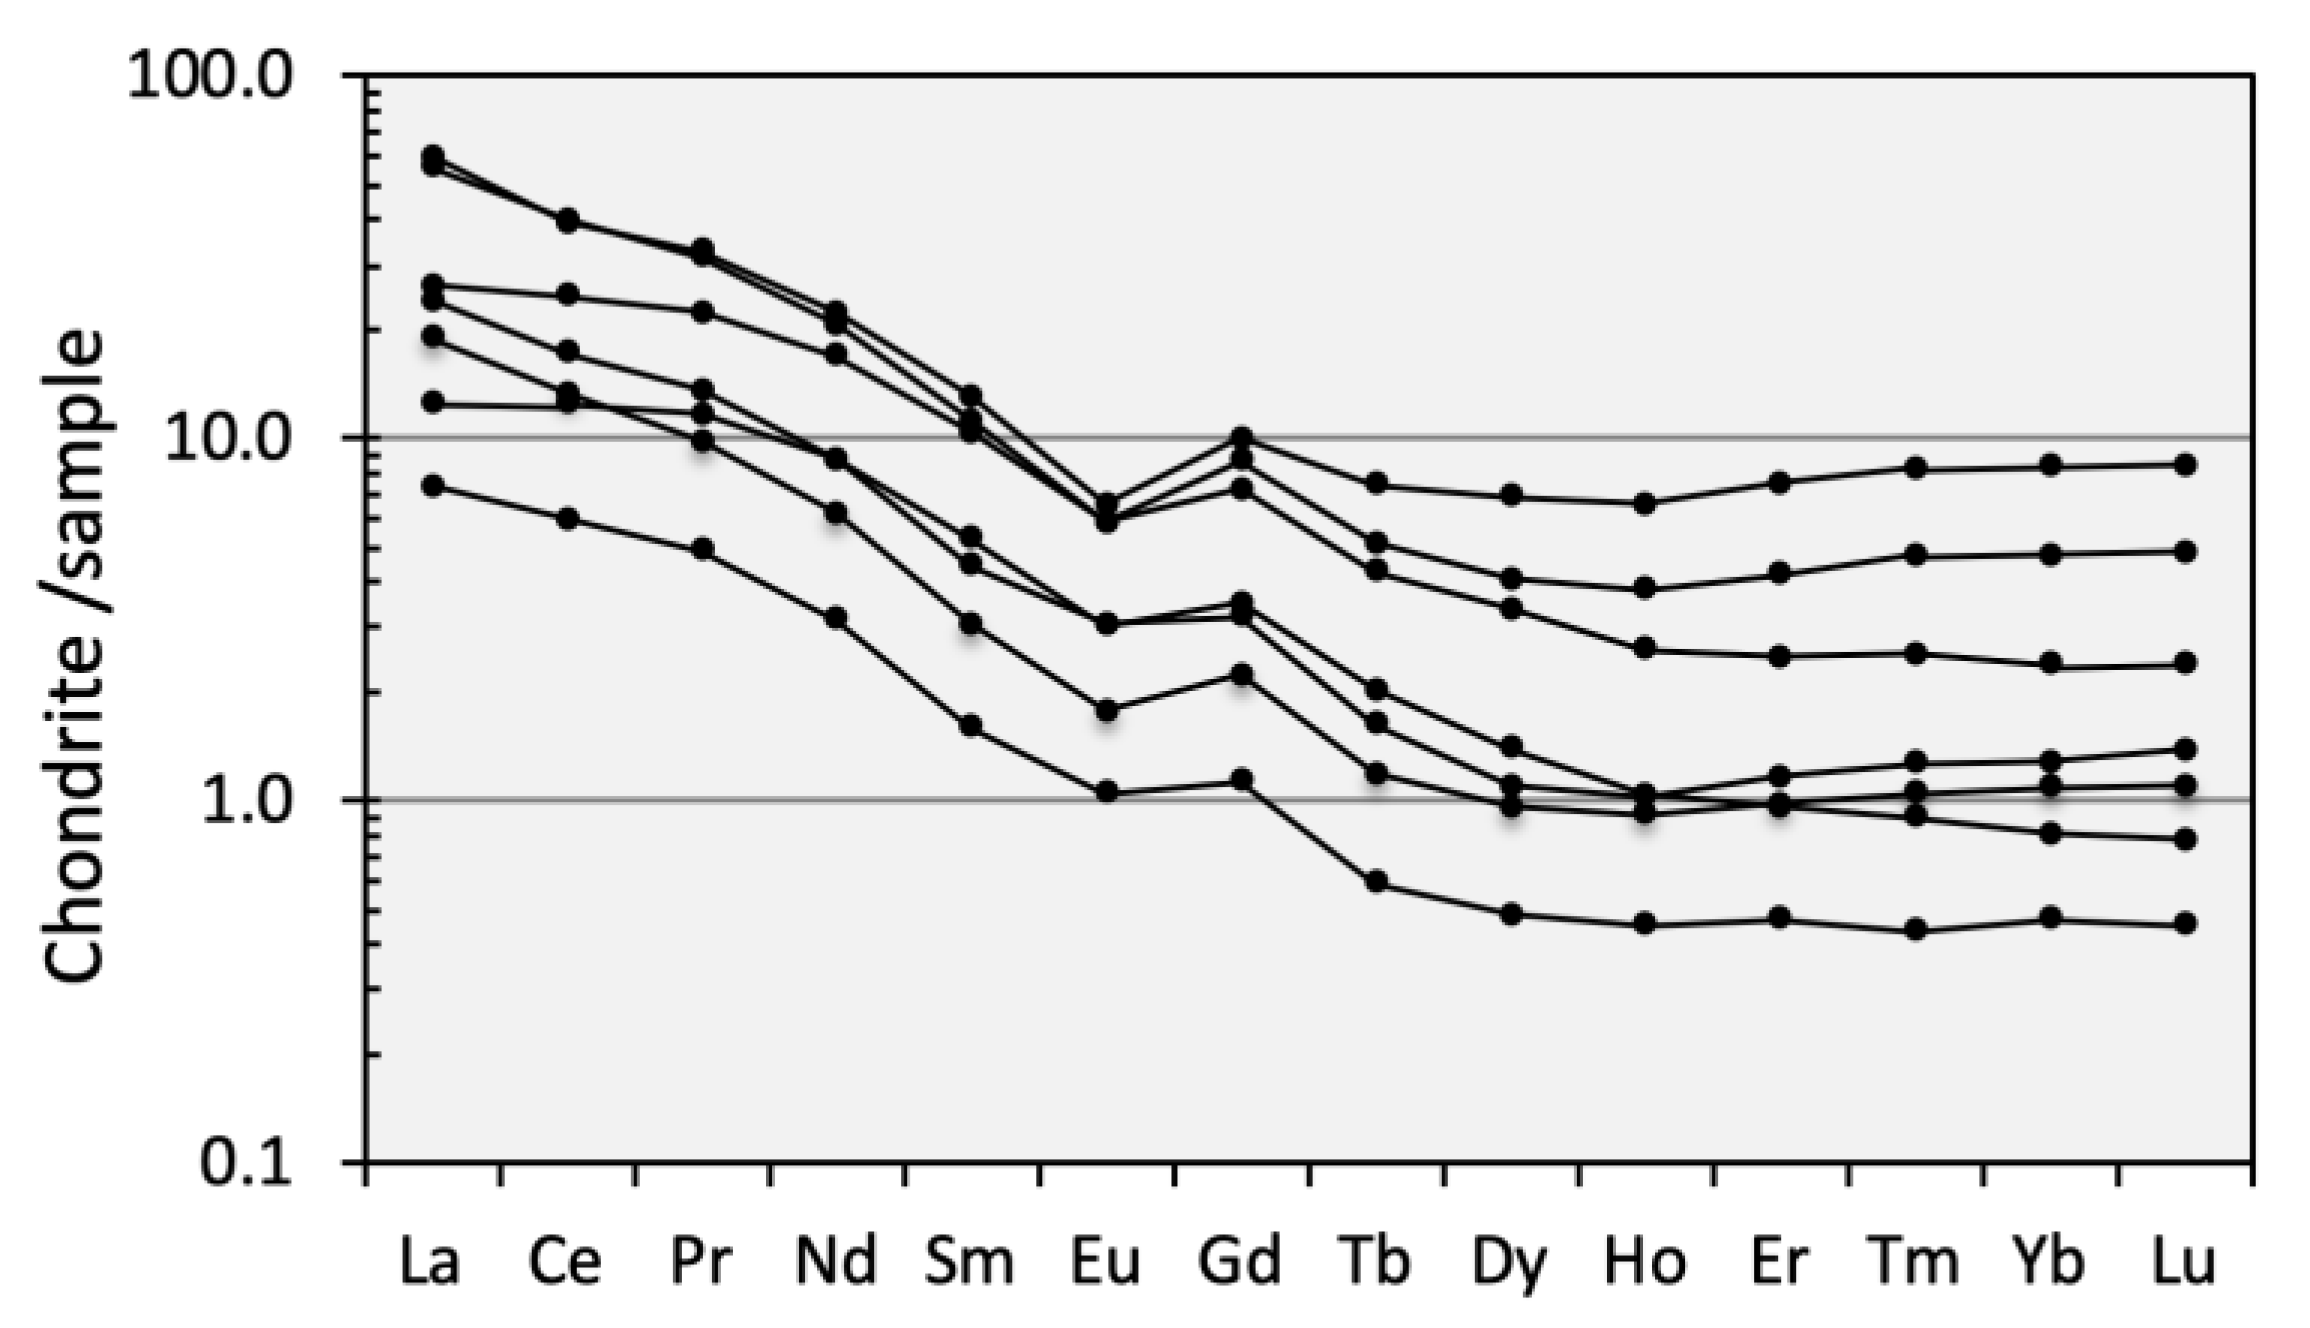
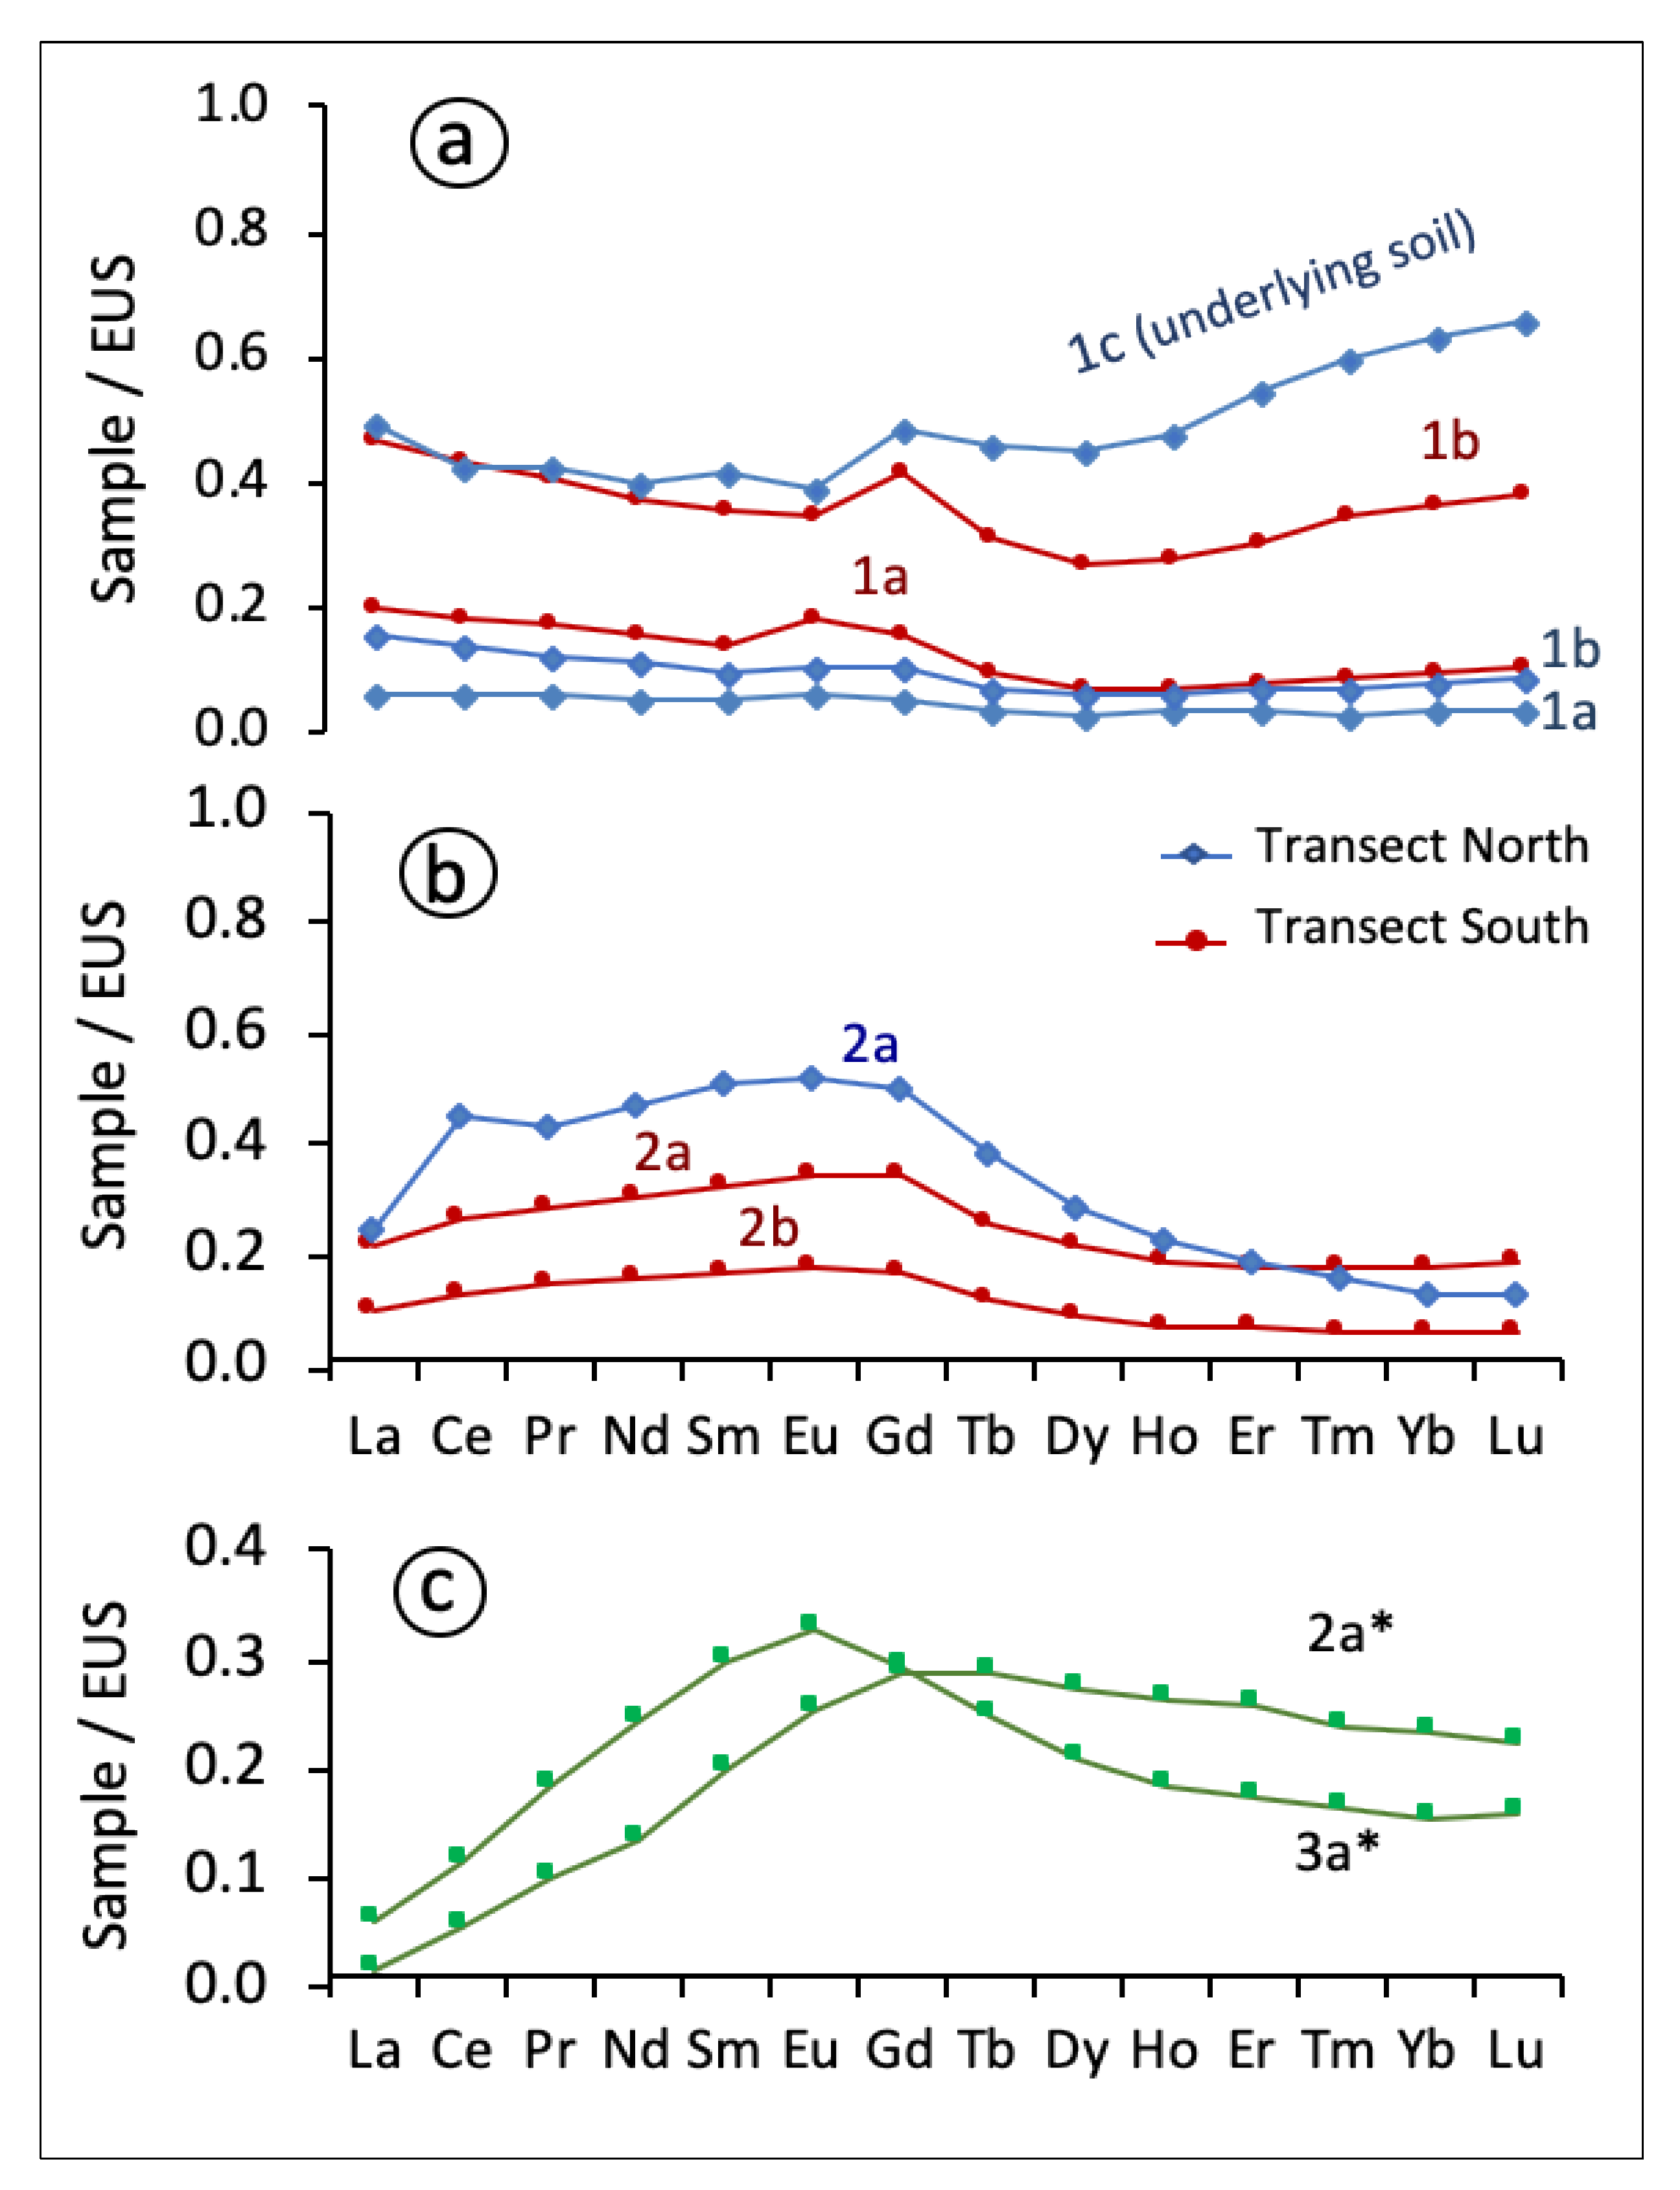
4.4. REE Fractionation Patterns
4.5. Mineralogical Controls on REE Retention
5. Conclusions
- The pyrite concentrates stockpiled on the banks of the estuarine salt marshes are a legacy source of leachable REEs in the AMD-impacted marshland.
- REEs are subject to geochemical cycling processes in the acid sulfate soil developed on the wetland by sulfide mineral oxidation and acidic drainage over decades.
- Abundance and fractionation patterns of REEs in the marsh soil that receives inputs from the sulfide heaps are distinct from those reported in nearby non-impacted sites. The receiving soil was found enriched in ΣREEs relative to local baseline concentrations, and reflects to some extent the source-related REE signal of the soil–water interaction.
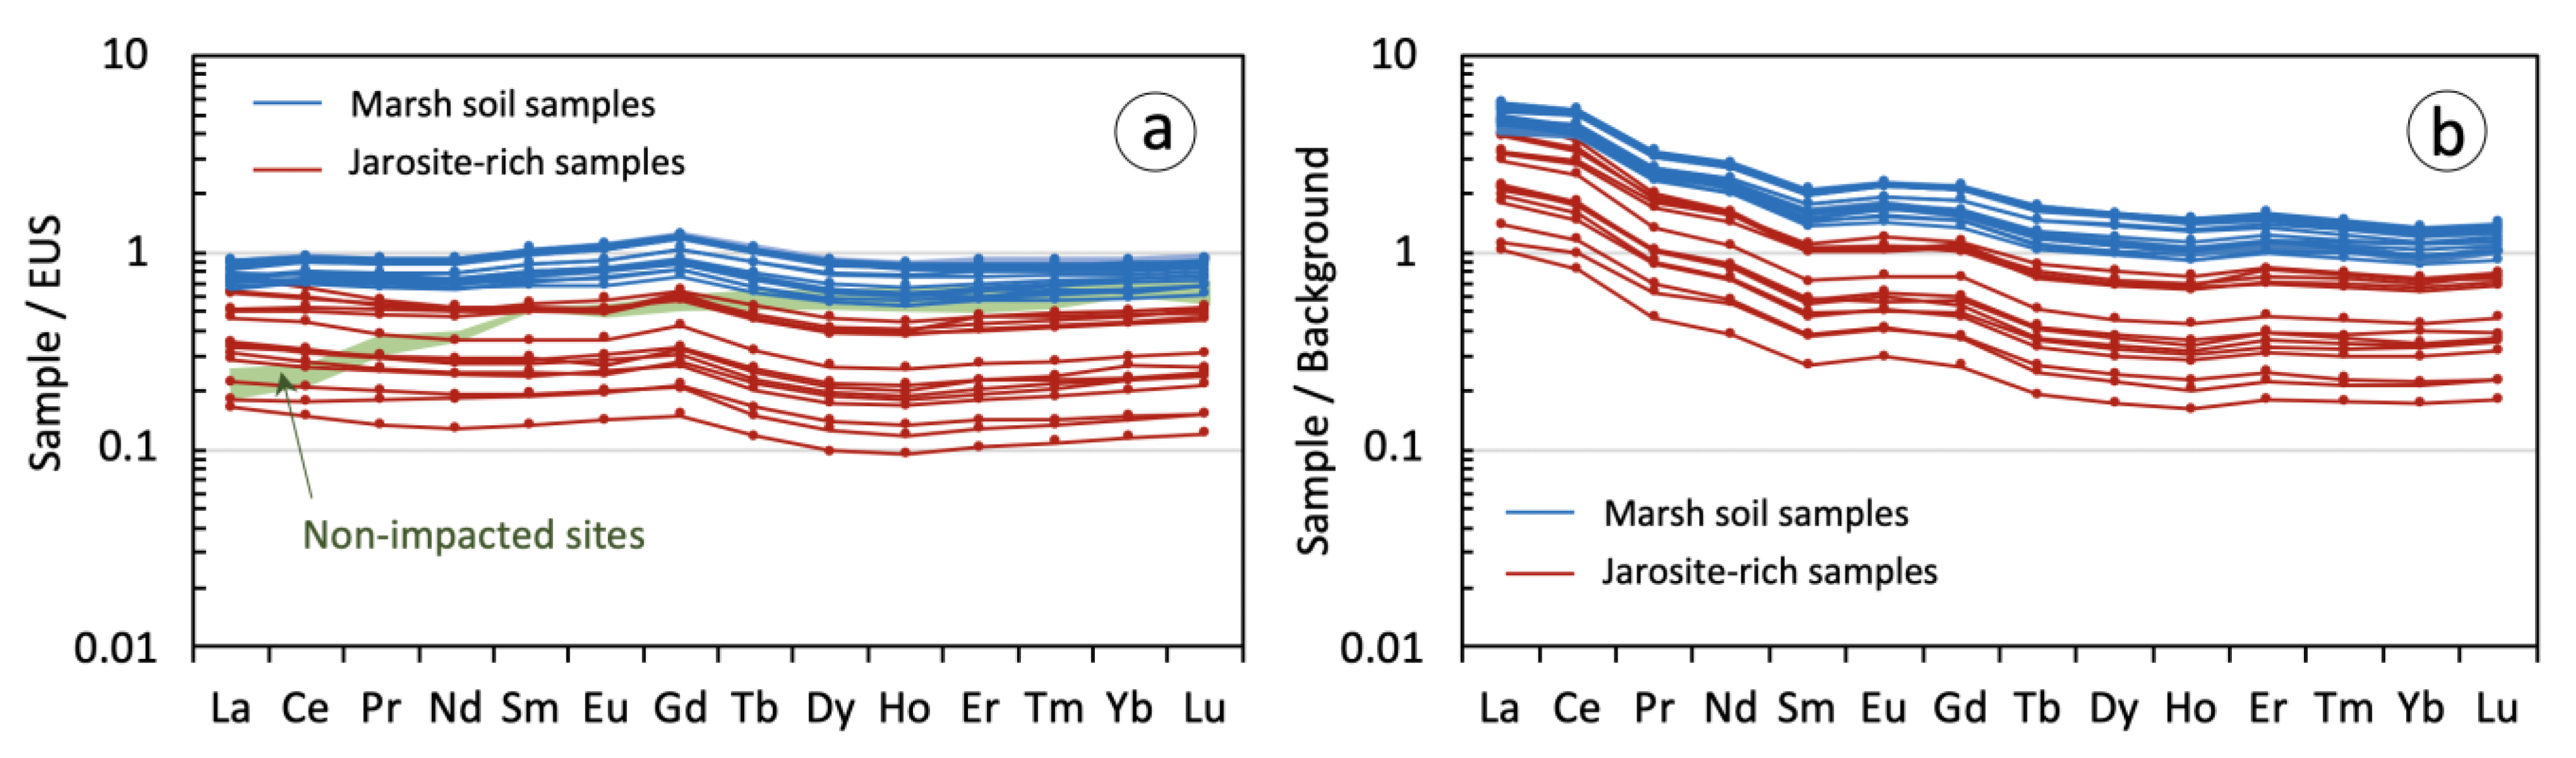
- The EUS-normalized REE patterns of the marsh soil samples did not display a significant LREE/HREE fractionation, but rather a slight MREE enrichment, suggesting that AMD precipitates (notably iron oxyhydroxides) are able to scavenge and act as sinks for MREEs.
- The efflorescent sulfate salts represent a transient reservoir of readily leachable MREEs and HREEs for the wetland.
Author Contributions
Funding
Institutional Review Board Statement
Informed Consent Statement
Data Availability Statement
Acknowledgments
Conflicts of Interest
References
- Hartshorn, R.M.; Hellwich, K.-H.; Yerin, A.; Damhus, T.; Hutton, A.T. Brief guide to the nomenclature of inorganic chemistry. Pure Appl. Chem. 2015, 87, 1039–1049. [Google Scholar] [CrossRef]
- Gwenzi, W.; Mangori, L.; Danha, C.; Chaukura, N.; Dunjana, N.; Sanganyado, E. Sources, behaviour, and environmental and human health risks of high-technology rare earth elements as emerging contaminants. Sci. Total Environ. 2018, 636, 299–313. [Google Scholar] [CrossRef] [PubMed]
- Chakhmouradian, A.R.; Wall, F. Rare Earth Elements: Minerals, Mines, Magnets (and More). Elements 2012, 8, 333–340. [Google Scholar] [CrossRef]
- Laveuf, C.; Cornu, S. A review on the potentiality of Rare Earth Elements to trace pedogenetic processes. Geoderma 2009, 154, 1–12. [Google Scholar] [CrossRef]
- Brookins, D.G. Chapter 8. Aqueous Geochemistry of Rare Earth Elements. Geochem. Mineral. Rare Earth Elem. 1989, 21, 201–226. [Google Scholar] [CrossRef]
- Elderfield, H.; Upstill-Goddard, R.; Sholkovitz, E. The rare earth elements in rivers, estuaries, and coastal seas and their significance to the composition of ocean waters. Geochimica Cosmochimica Acta 1990, 54, 971–991. [Google Scholar] [CrossRef]
- Johannesson, K.H.; Lyons, W.; Yelken, M.A.; Gaudette, H.E.; Stetzenbach, K.J. Geochemistry of the rare-earth elements in hypersaline and dilute acidic natural terrestrial waters: Complexation behavior and middle rare-earth element enrichments. Chem. Geol. 1996, 133, 125–144. [Google Scholar] [CrossRef]
- Bau, M. Scavenging of dissolved yttrium and rare earths by precipitating iron oxyhydroxide: Experimental evidence for Ce oxidation, Y-Ho fractionation, and lanthanide tetrad effect. Geochimica Cosmochimica Acta 1999, 63, 67–77. [Google Scholar] [CrossRef]
- Gimeno, M.J.; Auqué, L.F.; Nordstrom, D. REE speciation in low-temperature acidic waters and the competitive effects of aluminum. Chem. Geol. 2000, 165, 167–180. [Google Scholar] [CrossRef]
- Verplanck, P.L.; Nordstrom, D.; Taylor, H.E.; Kimball, B.A. Rare earth element partitioning between hydrous ferric oxides and acid mine water during iron oxidation. Appl. Geochem. 2004, 19, 1339–1354. [Google Scholar] [CrossRef]
- Gammons, C.H.; Wood, S.A.; Nimick, D. Diel behavior of rare earth elements in a mountain stream with acidic to neutral pH. Geochimica et Cosmochimica Acta 2005, 69, 3747–3758. [Google Scholar] [CrossRef]
- Wood, S.A.; Gammons, C.H.; Parker, S.R. The behavior of rare earth elements in naturally and anthropogenically acidified waters. J. Alloys Compd. 2006, 418, 161–165. [Google Scholar] [CrossRef]
- Noack, C.W.; Dzombak, D.A.; Karamalidis, A.K. Rare Earth Element Distributions and Trends in Natural Waters with a Focus on Groundwater. Environ. Sci. Technol. 2014, 48, 4317–4326. [Google Scholar] [CrossRef] [PubMed]
- Soyol-Erdene, T.; Valente, T.; Grande, J.; DE LA Torre, M.L. Mineralogical controls on mobility of rare earth elements in acid mine drainage environments. Chemosphere 2018, 205, 317–327. [Google Scholar] [CrossRef] [PubMed]
- Morgan, B.; Rate, A.W.; Burton, E.; Smirk, M.N. Enrichment and fractionation of rare earth elements in FeS- and organic-rich estuarine sediments receiving acid sulfate soil drainage. Chem. Geol. 2012, 308-309, 60–73. [Google Scholar] [CrossRef]
- Xu, N.; Morgan, B.; Rate, A. From source to sink: Rare-earth elements trace the legacy of sulfuric dredge spoils on estuarine sediments. Sci. Total Environ. 2018, 637-638, 1537–1549. [Google Scholar] [CrossRef]
- Åström, M. Abundance and fractionation patterns of rare earth elements in streams affected by acid sulphate soils. Chem. Geol. 2001, 175, 249–258. [Google Scholar] [CrossRef]
- Åström, M.E.; Nystrand, M.; Gustafsson, J.P.; Österholm, P.; Nordmyr, L.; Reynolds, J.K.; Peltola, P. Lanthanoid behaviour in an acidic landscape. Geochimica Cosmochimica Acta 2010, 74, 829–845. [Google Scholar] [CrossRef]
- Welch, S.; Christy, A.; Isaacson, L.; Kirste, D. Mineralogical control of rare earth elements in acid sulfate soils. Geochimica et Cosmochimica Acta 2009, 73, 44–64. [Google Scholar] [CrossRef]
- Gröger, J.; Proske, U.; Hanebuth, T.J.; Hamer, K. Cycling of trace metals and rare earth elements (REE) in acid sulfate soils in the Plain of Reeds, Vietnam. Chem. Geol. 2011, 288, 162–177. [Google Scholar] [CrossRef]
- Morgan, B.; Johnston, S.; Burton, E.; Hagan, R.E. Acidic drainage drives anomalous rare earth element signatures in intertidal mangrove sediments. Sci. Total Environ. 2016, 573, 831–840. [Google Scholar] [CrossRef]
- Worrall, F.; Pearson, D. Water-rock interaction in an acidic mine discharge as indicated by rare earth element patterns. Geochimica Cosmochimica Acta 2001, 65, 3027–3040. [Google Scholar] [CrossRef]
- Fernández-Caliani, J.; Barba-Brioso, C.; De la Rosa, J. Mobility and speciation of rare earth elements in acid minesoils and geochemical implications for river waters in the southwestern Iberian margin. Geoderma 2009, 149, 393–401. [Google Scholar] [CrossRef]
- Pérez-López, R.; Delgado, J.; Nieto, J.M.; García, B.M. Rare earth element geochemistry of sulphide weathering in the São Domingos mine area (Iberian Pyrite Belt): A proxy for fluid–rock interaction and ancient mining pollution. Chem. Geol. 2010, 276, 29–40. [Google Scholar] [CrossRef]
- Grawunder, A.; Merten, D.; Büchel, G. Origin of middle rare earth element enrichment in acid mine drainage-impacted areas. Environ. Sci. Pollut. Res. 2014, 21, 6812–6823. [Google Scholar] [CrossRef] [PubMed]
- Edahbi, M.; Plante, B.; Benzaazoua, M.; Ward, M.; Pelletier, M. Mobility of rare earth elements in mine drainage: Influence of iron oxides, carbonates, and phosphates. Chemosphere 2018, 199, 647–654. [Google Scholar] [CrossRef]
- Merten, D.; Geletneky, J.; Bergmann, H.; Haferburg, G.; Kothe, E.; Büchel, G. Rare earth element patterns: A tool for understanding processes in remediation of acid mine drainage. Geochemistry 2005, 65, 97–114. [Google Scholar] [CrossRef]
- Goldstein, S.J.; Jacobsen, S.B. Rare earth elements in river waters. Earth Planet. Sci. Lett. 1988, 89, 35–47. [Google Scholar] [CrossRef]
- Johannesson, K.H.; Zhou, X. Origin of middle rare earth element enrichments in acid waters of a Canadian High Arctic lake. Geochimica et Cosmochimica Acta 1999, 63, 153–165. [Google Scholar] [CrossRef]
- Verplanck, P.L.; Nordstrom, D.K.; Taylor, H.E. Overview of rare earth element investigations in acid waters of U.S. Geological Survey abandoned mine lands watersheds. U.S. Geol. Surv. Wat. Resourc. Invest. 1999, 99-4018A, 83–92. [Google Scholar]
- Chevis, D.; Johannesson, K.H.; Burdige, D.; Cable, J.; Martin, J.B.; Roy, M. Rare earth element cycling in a sandy subterranean estuary in Florida, USA. Mar. Chem. 2015, 176, 34–50. [Google Scholar] [CrossRef]
- Delgado, J.; Pérez-López, R.; Galván, L.; Nieto, J.M.; Boski, T. Enrichment of rare earth elements as environmental tracers of contamination by acid mine drainage in salt marshes: A new perspective. Mar. Pollut. Bull. 2012, 64, 1799–1808. [Google Scholar] [CrossRef] [PubMed]
- Mihajlovic, J.; Bauriegel, A.; Stärk, H.-J.; Roßkopf, N.; Zeitz, J.; Milbert, G.; Rinklebe, J. Rare earth elements in soil profiles of various ecosystems across Germany. Appl. Geochem. 2019, 102, 197–217. [Google Scholar] [CrossRef]
- Dávila, J.M.; Sarmiento, A.M.; Santisteban, M.; Luís, A.; Fortes, J.C.; Diaz-Curiel, J.; Valbuena, C.; Grande, J.A. The UNESCO national biosphere reserve (Marismas del Odiel, SW Spain): An area of 18,875 ha affected by mining waste. Environ. Sci. Pollut. Res. 2019, 26, 33594–33606. [Google Scholar] [CrossRef] [PubMed]
- Grantcharova, M.M.; Fernández-Caliani, J.C. Geochemical and mineralogical reactions driven by acid generation and metal release from pyritic wastes improperly disposed on estuarine marsh soils. In Proceedings of the 31st Annual V.M. Goldschmidt Conference, Lyon, France, 4–9 July 2021; Available online: https://2021.goldschmidt.info/goldschmidt/2021/meetingapp.cgi/Paper/4050 (accessed on 20 September 2021).
- Elbaz-Poulichet, F.; Dupuy, C. Behaviour of rare earth elements at the freshwater–seawater interface of two acid mine rivers: The Tinto and Odiel (Andalucía, Spain). Appl. Geochem. 1999, 14, 1063–1072. [Google Scholar] [CrossRef]
- Borrego, J.; López-González, N.; Carro, B.; Lozano-Soria, O. Geochemistry of rare-earth elements in Holocene sediments of an acidic estuary: Environmental markers (Tinto River Estuary, South-Western Spain). J. Geochem. Explor. 2005, 86, 119–129. [Google Scholar] [CrossRef]
- Borrego, J.; Carro, B.; López-González, N.; De La Rosa, J.; Grande, J.A.; Gómez, T.; De La Torre, M.L. Effect of acid mine drainage on dissolved rare earth elements geochemistry along a fluvial–estuarine system: The Tinto-Odiel Estuary (S.W. Spain). Hydrol. Res. 2012, 43, 262–274. [Google Scholar] [CrossRef]
- López-González, N.; Borrego, J.; Carro, B.; Grande, J.A.; De la Torre, M.L.; Valente, T. Rare earth element fractionation patterns in estuarine sediments as a consequence of acid mine drainage: A case study in SW Spain. Bol. Geol. Min. 2012, 123, 55–64. [Google Scholar]
- LeComte, K.L.; Sarmiento, A.; Borrego, J.; Nieto, J. Rare earth elements mobility processes in an AMD-affected estuary: Huelva Estuary (SW Spain). Mar. Pollut. Bull. 2017, 121, 282–291. [Google Scholar] [CrossRef]
- Cánovas, C.R.; Basallote, M.D.; Macías, F. Distribution and availability of rare earth elements and trace elements in the estuarine waters of the Ría of Huelva (SW Spain). Environ. Pollut. 2020, 267, 115506. [Google Scholar] [CrossRef]
- WRB. World Reference Base for Soil Resources; World Soil Resources Reports 106; FAO: Rome, Italy, 2014; Available online: http://www.fao.org/3/i3794en/I3794en.pdf (accessed on 20 September 2021).
- Finkl, C.W.; Makowski, C. Coastal Wetlands: Alteration and Remediation; Springer International Publishing: Cham, Switzerland, 2017; pp. 215–241. [Google Scholar] [CrossRef] [Green Version]
- Checkland, S.G. The Mines of Tharsis. Roman, French and British Enterprise in Spain; Allen and Unwin: London, UK, 1967; p. 288. [Google Scholar]
- Tarazona, J.V.; Fernández, M.D.; Vega, M.M. Regulation of Contaminated Soils in Spain—A New Legal Instrument (4 pp). J. Soils Sediments 2005, 5, 121–124. [Google Scholar] [CrossRef]
- Fernández-Caliani, J.C. Risk-based assessment of multimetallic soil pollution in the industrialized peri-urban area of Huelva, Spain. Environ. Geochem. Health 2011, 34, 123–139. [Google Scholar] [CrossRef] [PubMed]
- Kahle, M.; Kleber, M.; Jahn, R. Review of XRD-based quantitative analyses of clay minerals in soils: The suitability of mineral intensity factors. Geoderma 2002, 109, 191–205. [Google Scholar] [CrossRef]
- Bau, M.; Schmidt, K.; Pack, A.; Bendel, V.; Kraemer, D. The European Shale: An improved data set for normalisation of rare earth element and yttrium concentrations in environmental and biological samples from Europe. Appl. Geochem. 2018, 90, 142–149. [Google Scholar] [CrossRef]
- Taylor, S.R.; McLennan, S. Composition and Evolution of the Continental Crust; Cambridge University Press: Cambridge, UK, 2009; pp. 301–324. [Google Scholar]
- Ruiz, C.; Arribas, A. Mineralogy and geochemistry of the Masa Valverde blind massive sulphide deposit, Iberian Pyrite Belt (Spain). Ore Geol. Rev. 2002, 19, 1–22. [Google Scholar] [CrossRef] [Green Version]
- Leybourne, M.I.; Peter, J.M.; Layton-Matthews, D.; Volesky, J.; Boyle, D.R. Mobility and fractionation of rare earth elements during supergene weathering and gossan formation and chemical modification of massive sulfide gossan. Geochimica et Cosmochimica Acta 2006, 70, 1097–1112. [Google Scholar] [CrossRef]
- Da Silva, E.F.; Bobos-Radu, I.; Matos, J.X.; Patinha, C.; Reis, A.; Fonseca, E. Mineralogy and geochemistry of trace metals and REE in volcanic massive sulfide host rocks, stream sediments, stream waters and acid mine drainage from the Lousal mine area (Iberian Pyrite Belt, Portugal). Appl. Geochem. 2009, 24, 383–401. [Google Scholar] [CrossRef]
- Wood, S.A. The aqueous geochemistry of the rare-earth elements and yttrium: 1. Review of available low-temperature data for inorganic complexes and the inorganic REE speciation of natural waters. Chem. Geol. 1990, 82, 159–186. [Google Scholar] [CrossRef]
- Breuker, A.; Ritter, S.F.; Schippers, A. Biosorption of Rare Earth Elements by Different Microorganisms in Acidic Solutions. Metals 2020, 10, 954. [Google Scholar] [CrossRef]
- Lozano, A.; Ayora, C.; Fernández-Martínez, A. Sorption of rare earth elements on schwertmannite and their mobility in acid mine drainage treatments. Appl. Geochem. 2020, 113, 104499. [Google Scholar] [CrossRef]
- Jambor, J.L.; Nordstrom, D.K.; Alpers, C. Metal-sulfate Salts from Sulfide Mineral Oxidation. Rev. Miner. Geochem. 2000, 40, 303–350. [Google Scholar] [CrossRef]
- Dutrizac, J. The behaviour of the rare earths during the precipitation of sodium, potassium and lead jarosites. Hydrometallurgy 2004, 73, 11–30. [Google Scholar] [CrossRef]
- Welch, S.A.; Christy, A.; Kirste, D.; Beavis, S.G.; Beavis, F. Jarosite dissolution I—Trace cation flux in acid sulfate soils. Chem. Geol. 2007, 245, 183–197. [Google Scholar] [CrossRef]
- De Moraes, M.L.B.; Ladeira, A.C.Q. The role of iron in the rare earth elements and uranium scavenging by Fe–Al-precipitates in acid mine drainage. Chemosphere 2021, 277, 130131. [Google Scholar] [CrossRef] [PubMed]
- Aström, M.E.; Yu, C.X.; Virtasalo, J.J.; Österholm, P.; Peltola, P.; Burton, E.D.; Hogmalm, K.J.; Ojala, A.E.K. Extensive accumulation of rare earth elements in estuarine sediments affected by leaching of acid sulfate soils. Boreal Environ. Res. 2020, 25, 105–120. [Google Scholar]
- Coppin, F.; Berger, G.; Bauer, A.; Castet, S.; Loubet, M. Sorption of lanthanides on smectite and kaolinite. Chem. Geol. 2002, 182, 57–68. [Google Scholar] [CrossRef]


| Transect | Zone | Core | Core Sample | Soil Acidity | Mineral Composition | |||
|---|---|---|---|---|---|---|---|---|
| pH(H2O) | >50% | 25–50% | 5–25% | Accesories (<5%) | ||||
| NORTH | Sulfide wastes | 1 | 1a | 1.25 | Py | Qz+Fd+Ang+Cp+Hlt | ||
| 1b | 1.73 | Py | Qz+Fd+Cpy+Ang+Hlt | |||||
| 1c | 2.53 | Fs | Qz | Js | Fd+Hm | |||
| Yellow zone | 2 | 2a * | 1.04 | Sz+Cp | Hlt | |||
| 2a | 1.84 | Py | Js+Gy | Qz+Ang+Cp+Me+Hlt+Ep | ||||
| 2b | 1.68 | Js | Qz+Fs+Py | Fd+Cp | ||||
| 2c | 1.84 | Fs | Js | Qz+Fd | Py | |||
| 2d | 2.36 | Fs | Qz+Js | Fd+Amp | ||||
| 2e | 2.41 | Py+Fs | Js+Qz+Fd | Gy+Amp | ||||
| 3 | 3a | 2.48 | Js+Py | Qz+Fs | Fd+Ha+Gy+Ba+Mz | |||
| 3b | 2.10 | Js | Py+Qz+Fs | Gy+Amp | ||||
| 3c | 2.53 | Fs | Qz | Js+Fd | Ha | |||
| White zone | 4 | 4a | 3.65 | Fs | Qz+Js | Fd+Py+Ha | ||
| 4b | 3.93 | Js+Qz | Py+Fs+Fd | Ha+Amp+Ba+Mz | ||||
| 4c | 2.59 | Js+Py | Qz+Fs | Fd+Ha | ||||
| 4d | 3.56 | Fs | Qz | Fd | Ha | |||
| Ochre zone | 5 | 5a | 4.80 | Fs | Qz | Fd+Ha+Hm+Mz | ||
| 5b | 5.49 | Fs | Qz+Fd | Ha | ||||
| 6 | 6a | 3.63 | Js | Fs | Qz | Py+Gy+Hm+Mz | ||
| 6b | 6.13 | Fs | Qz | Fd | ||||
| 6c | 6.29 | Fs | Qz | Fd | Amp | |||
| Tidal channel | 7 | 7a | 3.09 | Js | Qz+Fd+Ha+Cpy | |||
| 7b | 3.66 | Js | Fs+Qz | Fd | ||||
| SOUTH | Sulfide wastes | 1 | 1a | 1.10 | Py | Qz+Fd+Ba+Sph+Ang+Cp | ||
| 1b | 1.60 | Py | Qz+Fd+Fs | |||||
| Yellow zone | 2 | 2a | 2.05 | Py | Js+Qz+Fs | Gy+Ba+Ang+Me | ||
| 2b | 1.97 | Py | Qz+Fd+Gy | |||||
| 2c | 2.15 | Fs | Qz+Js | Fd | ||||
| 3 | 3a * | 1.95 | Cp | Ha | ||||
| 3a | 1.97 | Js | Py+Fs+Qz | Fd+Hm | ||||
| 3b | 1.80 | Js | Py+Fs | Qz+Fd+Gy | ||||
| 3c | 2.03 | Js | Fs | Qz | Fd | |||
| White zone | 4 | 4a | 3.08 | Js | Py+Fs+Qz+Ha | Fd | ||
| 4b | 2.56 | Js | Py+Fs+Qz | Fd+Ha+Ba | ||||
| Ochre zone | 5 | 5a | 5.36 | Fs | Qz | Fd+Py+Ha+Ba+Zr | ||
| 5b | 5.26 | Fs | Qz | Fd+Ha | ||||
| 5c | 5.69 | Fs | Qz | Fd+Ha | ||||
| 5d | 6.25 | Fs | Qz+Fd+Ha | |||||
| 6 | 6a | 5.59 | Fs | Qz | Fd+Ha | |||
| 6b | 4.37 | Fs | Js+Qz+Fd | Ha+Py+Ba+Hm+Mz | ||||
| 6d | 5.31 | Fs | Qz+Fd | Ha+Amp | ||||
| Transect North | Core 1 (Pyrite StockPiles) | Core 2 (Yellow Zone) | Core 3 (Yellow Zone) | Core 4 (White Zone) | Core 5 (Ochre Zone) | Core 6 (Ochre Zone) | Core 7 (Tidal Channel) | ||||||||||||||||
|---|---|---|---|---|---|---|---|---|---|---|---|---|---|---|---|---|---|---|---|---|---|---|---|
| Sample | 1a | 1b | 1c | 2a * | 2a | 2b | 2c | 2d | 2e | 3a | 3b | 3c | 4a | 4b | 4c | 4d | 5a | 5b | 6a | 6b | 6c | 7a | 7b |
| La | 2.70 | 6.92 | 22.06 | 1.17 | 11.09 | 14.76 | 27.42 | 34.80 | 28.92 | 22.41 | 9.70 | 31.89 | 33.06 | 31.73 | 15.29 | 31.23 | 33.35 | 31.53 | 15.45 | 32.31 | 38.93 | 7.22 | 13.76 |
| Ce | 5.73 | 12.68 | 37.55 | 5.93 | 40.34 | 27.76 | 51.78 | 68.63 | 62.73 | 44.60 | 18.35 | 62.39 | 70.85 | 68.90 | 27.52 | 65.69 | 69.44 | 63.94 | 28.68 | 70.58 | 82.55 | 13.01 | 24.84 |
| Pr | 0.67 | 1.35 | 4.51 | 1.15 | 4.62 | 3.17 | 5.81 | 7.64 | 7.58 | 5.14 | 2.09 | 7.27 | 8.27 | 7.50 | 3.08 | 7.81 | 7.95 | 7.51 | 3.11 | 8.19 | 9.61 | 1.43 | 2.74 |
| Nd | 2.24 | 4.43 | 15.75 | 5.54 | 18.56 | 11.41 | 20.69 | 27.41 | 28.68 | 18.66 | 7.50 | 26.19 | 30.81 | 27.63 | 10.89 | 28.96 | 29.38 | 27.85 | 11.07 | 30.93 | 35.94 | 5.04 | 9.64 |
| Sm | 0.37 | 0.71 | 3.02 | 1.48 | 3.75 | 2.13 | 3.87 | 5.29 | 5.83 | 3.67 | 1.40 | 4.97 | 6.40 | 5.47 | 1.99 | 5.88 | 5.89 | 5.78 | 2.10 | 6.40 | 7.34 | 0.97 | 1.79 |
| Eu | 0.09 | 0.15 | 0.57 | 0.38 | 0.77 | 0.40 | 0.76 | 1.09 | 1.24 | 0.77 | 0.30 | 1.01 | 1.36 | 1.18 | 0.42 | 1.25 | 1.20 | 1.20 | 0.45 | 1.35 | 1.59 | 0.21 | 0.36 |
| Gd | 0.35 | 0.68 | 3.07 | 1.83 | 3.20 | 2.05 | 3.77 | 5.21 | 5.56 | 3.62 | 1.30 | 4.82 | 6.57 | 5.74 | 1.93 | 5.84 | 5.59 | 5.50 | 2.12 | 6.63 | 7.74 | 0.95 | 1.76 |
| Tb | 0.034 | 0.069 | 0.430 | 0.272 | 0.363 | 0.234 | 0.461 | 0.629 | 0.703 | 0.432 | 0.140 | 0.591 | 0.837 | 0.706 | 0.213 | 0.740 | 0.676 | 0.678 | 0.242 | 0.839 | 0.983 | 0.110 | 0.206 |
| Dy | 0.18 | 0.37 | 2.64 | 1.62 | 1.68 | 1.23 | 2.43 | 3.40 | 3.77 | 2.33 | 0.74 | 3.29 | 4.56 | 3.80 | 1.13 | 4.04 | 3.66 | 3.74 | 1.28 | 4.65 | 5.28 | 0.58 | 1.09 |
| Ho | 0.04 | 0.08 | 0.56 | 0.31 | 0.27 | 0.23 | 0.48 | 0.67 | 0.71 | 0.45 | 0.14 | 0.63 | 0.87 | 0.73 | 0.22 | 0.78 | 0.70 | 0.71 | 0.25 | 0.90 | 1.02 | 0.11 | 0.21 |
| Er | 0.12 | 0.24 | 1.88 | 0.90 | 0.66 | 0.77 | 1.48 | 2.04 | 2.06 | 1.37 | 0.44 | 2.00 | 2.61 | 2.24 | 0.70 | 2.39 | 2.19 | 2.26 | 0.77 | 2.75 | 3.11 | 0.35 | 0.65 |
| Tm | 0.015 | 0.037 | 0.295 | 0.120 | 0.079 | 0.112 | 0.225 | 0.309 | 0.322 | 0.204 | 0.065 | 0.300 | 0.378 | 0.315 | 0.106 | 0.352 | 0.330 | 0.343 | 0.116 | 0.395 | 0.442 | 0.054 | 0.099 |
| Yb | 0.12 | 0.27 | 2.06 | 0.77 | 0.44 | 0.76 | 1.53 | 2.09 | 2.02 | 1.40 | 0.47 | 2.07 | 2.50 | 2.13 | 0.74 | 2.41 | 2.28 | 2.41 | 0.88 | 2.64 | 2.93 | 0.38 | 0.73 |
| Lu | 0.017 | 0.042 | 0.320 | 0.112 | 0.064 | 0.119 | 0.249 | 0.330 | 0.332 | 0.219 | 0.074 | 0.326 | 0.386 | 0.328 | 0.120 | 0.373 | 0.350 | 0.366 | 0.126 | 0.410 | 0.455 | 0.058 | 0.115 |
| ∑REE | 12.67 | 28.04 | 94.72 | 21.59 | 85.88 | 65.13 | 120.97 | 159.52 | 150.46 | 105.29 | 42.69 | 147.75 | 169.47 | 158.38 | 64.36 | 157.76 | 163.00 | 153.81 | 66.63 | 168.98 | 197.91 | 30.46 | 58.00 |
| ∑LREE | 11.34 | 25.39 | 79.87 | 13.80 | 74.61 | 57.10 | 105.71 | 138.48 | 127.91 | 90.81 | 37.64 | 127.74 | 142.99 | 135.75 | 56.78 | 133.70 | 140.12 | 130.82 | 58.31 | 142.00 | 167.02 | 26.69 | 50.98 |
| ∑HREE | 0.31 | 0.67 | 5.11 | 2.21 | 1.51 | 1.99 | 3.96 | 5.43 | 5.45 | 3.65 | 1.18 | 5.33 | 6.75 | 5.74 | 1.89 | 6.31 | 5.85 | 6.09 | 2.14 | 7.10 | 7.96 | 0.95 | 1.81 |
| LREE/HREE | 37.15 | 37.82 | 15.62 | 6.23 | 49.39 | 28.69 | 26.66 | 25.50 | 23.49 | 24.86 | 31.88 | 23.97 | 21.18 | 23.66 | 30.05 | 21.20 | 23.93 | 21.49 | 27.23 | 20.00 | 20.98 | 28.10 | 28.23 |
| LaN/GdN | 1.11 | 1.45 | 1.03 | 0.09 | 0.50 | 1.03 | 1.04 | 0.96 | 0.74 | 0.89 | 1.07 | 0.95 | 0.72 | 0.79 | 1.14 | 0.77 | 0.85 | 0.82 | 1.04 | 0.70 | 0.72 | 1.09 | 1.12 |
| GdN/LuN | 1.54 | 1.25 | 0.73 | 1.25 | 3.85 | 1.32 | 1.16 | 1.21 | 1.28 | 1.26 | 1.35 | 1.13 | 1.30 | 1.34 | 1.23 | 1.20 | 1.22 | 1.15 | 1.28 | 1.24 | 1.30 | 1.24 | 1.18 |
| LaN/LuN | 1.72 | 1.82 | 0.76 | 0.11 | 1.91 | 1.36 | 1.21 | 1.16 | 0.95 | 1.12 | 1.44 | 1.07 | 0.94 | 1.06 | 1.39 | 0.92 | 1.04 | 0.94 | 1.34 | 0.86 | 0.94 | 1.36 | 1.31 |
| Eu/Eu * | 1.41 | 1.23 | 0.89 | 1.05 | 1.16 | 0.99 | 1.01 | 1.05 | 1.08 | 1.09 | 1.18 | 1.05 | 1.04 | 1.06 | 1.15 | 1.06 | 1.07 | 1.07 | 1.11 | 1.04 | 1.05 | 1.14 | 1.04 |
| Gd/Gd * | 1.24 | 1.23 | 1.14 | 1.39 | 1.34 | 1.30 | 1.27 | 1.29 | 1.28 | 1.31 | 1.30 | 1.24 | 1.33 | 1.34 | 1.29 | 1.30 | 1.29 | 1.29 | 1.34 | 1.33 | 1.35 | 1.32 | 1.29 |
| Ce/Ce * | 1.04 | 1.01 | 0.92 | 0.99 | 1.33 | 0.99 | 1.00 | 1.03 | 1.04 | 1.02 | 1.00 | 1.00 | 1.05 | 1.09 | 0.98 | 1.03 | 1.04 | 1.02 | 1.01 | 1.06 | 1.04 | 0.99 | 0.99 |
| Transect South | Core 1 (Pyrite Stockpiles) | Core 2 (Yellow Zone) | Core 3 (Yellow Zone) | Core 4 (White Zone) | Core 5 (Ochre Zone) | Core 6 (Ochre Zone) | ||||||||||||
|---|---|---|---|---|---|---|---|---|---|---|---|---|---|---|---|---|---|---|
| Sample | 1a | 1b | 2a | 2b | 2c | 3a * | 3a | 3b | 3c | 4a | 4b | 5a | 5b | 5c | 5d | 6a | 6b | 6c |
| La | 8.77 | 20.62 | 9.71 | 4.56 | 33.28 | 3.08 | 20.67 | 7.87 | 28.04 | 22.92 | 12.74 | 38.14 | 40.11 | 39.02 | 40.02 | 36.60 | 30.32 | 36.89 |
| Ce | 16.44 | 38.54 | 23.75 | 11.89 | 58.79 | 11.01 | 38.96 | 15.61 | 53.19 | 46.34 | 23.20 | 79.86 | 83.39 | 81.32 | 83.57 | 78.28 | 61.21 | 78.97 |
| Pr | 1.85 | 4.32 | 3.04 | 1.60 | 6.03 | 2.03 | 4.05 | 1.90 | 5.75 | 5.49 | 2.66 | 9.50 | 9.95 | 9.64 | 9.83 | 9.24 | 7.04 | 9.30 |
| Nd | 6.25 | 14.72 | 11.99 | 6.22 | 20.88 | 9.76 | 14.18 | 7.18 | 20.12 | 20.12 | 9.46 | 35.40 | 37.12 | 35.91 | 36.72 | 34.74 | 25.88 | 34.84 |
| Sm | 1.03 | 2.60 | 2.40 | 1.22 | 3.80 | 2.20 | 2.62 | 1.37 | 3.71 | 4.04 | 1.73 | 7.29 | 7.62 | 7.36 | 7.42 | 7.18 | 5.21 | 7.09 |
| Eu | 0.27 | 0.51 | 0.51 | 0.26 | 0.74 | 0.49 | 0.54 | 0.29 | 0.73 | 0.86 | 0.37 | 1.55 | 1.62 | 1.58 | 1.57 | 1.53 | 1.10 | 1.54 |
| Gd | 0.99 | 2.64 | 2.22 | 1.08 | 3.95 | 1.88 | 2.70 | 1.35 | 3.76 | 4.05 | 1.69 | 7.50 | 7.83 | 7.67 | 7.72 | 7.47 | 5.18 | 7.38 |
| Tb | 0.09 | 0.30 | 0.25 | 0.12 | 0.44 | 0.24 | 0.30 | 0.15 | 0.43 | 0.50 | 0.19 | 0.94 | 0.98 | 0.96 | 0.94 | 0.95 | 0.63 | 0.94 |
| Dy | 0.42 | 1.56 | 1.29 | 0.53 | 2.36 | 1.25 | 1.54 | 0.81 | 2.27 | 2.72 | 1.00 | 5.16 | 5.31 | 5.16 | 5.07 | 5.17 | 3.31 | 5.06 |
| Ho | 0.09 | 0.32 | 0.22 | 0.09 | 0.47 | 0.22 | 0.30 | 0.15 | 0.45 | 0.52 | 0.20 | 0.98 | 1.03 | 1.00 | 0.96 | 0.98 | 0.63 | 0.97 |
| Er | 0.29 | 1.05 | 0.62 | 0.24 | 1.61 | 0.62 | 0.93 | 0.48 | 1.39 | 1.63 | 0.61 | 2.93 | 3.02 | 2.95 | 2.84 | 2.95 | 1.96 | 2.88 |
| Tm | 0.05 | 0.17 | 0.09 | 0.03 | 0.23 | 0.08 | 0.14 | 0.07 | 0.21 | 0.24 | 0.09 | 0.42 | 0.43 | 0.42 | 0.41 | 0.42 | 0.28 | 0.41 |
| Yb | 0.32 | 1.19 | 0.59 | 0.20 | 1.59 | 0.52 | 0.97 | 0.48 | 1.46 | 1.64 | 0.65 | 2.81 | 2.87 | 2.88 | 2.69 | 2.75 | 1.91 | 2.72 |
| Lu | 0.05 | 0.18 | 0.09 | 0.03 | 0.24 | 0.08 | 0.15 | 0.07 | 0.23 | 0.26 | 0.10 | 0.44 | 0.45 | 0.43 | 0.42 | 0.43 | 0.30 | 0.43 |
| ∑REE | 36.89 | 88.72 | 56.77 | 28.07 | 134.42 | 33.46 | 88.04 | 37.79 | 121.72 | 111.33 | 54.69 | 192.92 | 201.74 | 196.30 | 200.17 | 188.71 | 144.96 | 189.42 |
| ∑LREE | 33.31 | 78.20 | 48.49 | 24.27 | 118.99 | 25.87 | 77.85 | 32.55 | 107.09 | 94.87 | 48.07 | 162.90 | 170.59 | 165.89 | 170.14 | 158.87 | 124.45 | 159.99 |
| ∑HREE | 0.79 | 2.91 | 1.61 | 0.59 | 4.15 | 1.53 | 2.48 | 1.26 | 3.74 | 4.29 | 1.65 | 7.57 | 7.80 | 7.68 | 7.31 | 7.53 | 5.08 | 7.41 |
| LREE/HREE | 42.10 | 26.83 | 30.08 | 41.09 | 28.69 | 16.88 | 31.34 | 25.74 | 28.67 | 22.12 | 29.17 | 21.51 | 21.86 | 21.59 | 23.28 | 21.10 | 24.49 | 21.58 |
| LaN/GdN | 1.27 | 1.12 | 0.63 | 0.61 | 1.44 | 0.23 | 1.30 | 0.95 | 1.25 | 0.93 | 1.22 | 0.86 | 0.87 | 0.87 | 0.89 | 0.84 | 0.96 | 0.86 |
| GdN/LuN | 1.44 | 1.10 | 1.87 | 2.79 | 1.25 | 1.81 | 1.37 | 1.41 | 1.26 | 1.21 | 1.27 | 1.32 | 1.34 | 1.35 | 1.42 | 1.33 | 1.33 | 1.32 |
| LaN/LuN | 1.83 | 1.22 | 1.17 | 1.69 | 1.51 | 0.42 | 1.50 | 1.18 | 1.34 | 0.98 | 1.37 | 0.96 | 0.99 | 0.98 | 1.05 | 0.93 | 1.11 | 0.95 |
| Eu/Eu * | 1.50 | 1.03 | 1.17 | 1.23 | 1.02 | 1.18 | 1.07 | 1.11 | 1.02 | 1.06 | 1.14 | 1.05 | 1.05 | 1.05 | 1.05 | 1.04 | 1.08 | 1.06 |
| Gd/Gd * | 1.35 | 1.31 | 1.33 | 1.37 | 1.34 | 1.29 | 1.37 | 1.33 | 1.32 | 1.31 | 1.30 | 1.33 | 1.34 | 1.35 | 1.36 | 1.34 | 1.34 | 1.33 |
| Ce/Ce * | 1.00 | 1.00 | 1.06 | 1.06 | 1.01 | 0.95 | 1.04 | 0.99 | 1.02 | 1.01 | 0.97 | 1.03 | 1.02 | 1.03 | 1.03 | 1.04 | 1.03 | 1.04 |
| REE | Sulfide-Rich Samples (N = 7) | Efflorescent Sulfate Samples (N = 2) | Jarosite-Rich Samples (N = 15) | Marsh Soil Samples (N = 16) | ||||||||||||||||
|---|---|---|---|---|---|---|---|---|---|---|---|---|---|---|---|---|---|---|---|---|
| Samples | 1a–b,2a (North) + 1a–b,2a–b (South) | 2a * (North) + 3a * (South) | 2b–c,3a–b,4c,6a,7a–b (N) + 2c,3a–c,4a–b,6b (S) | 2d–e,3c,4a–b,4d,5a–b,6b–c (N) + 5a–d,6a,6c (S) | ||||||||||||||||
| Statistics | Min | Max | Mean | Std Dev | Median | Min | Max | Mean | Std Dev | Median | Min | Max | Mean | Std Dev | Median | Min | Max | Mean | Std Dev | Median |
| La | 2.70 | 20.62 | 9.20 | 5.82 | 8.77 | 1.17 | 3.08 | 2.13 | 1.35 | 2.13 | 7.22 | 33.28 | 18.79 | 8.34 | 15.45 | 28.92 | 40.11 | 34.91 | 3.62 | 34.08 |
| Ce | 5.73 | 40.34 | 21.34 | 13.51 | 16.44 | 5.93 | 11.01 | 8.47 | 3.59 | 8.47 | 13.01 | 61.21 | 35.59 | 16.09 | 28.68 | 62.39 | 83.57 | 73.19 | 7.76 | 70.71 |
| Pr | 0.67 | 4.62 | 2.49 | 1.53 | 1.85 | 1.15 | 2.03 | 1.59 | 0.62 | 1.59 | 1.43 | 7.04 | 3.97 | 1.76 | 3.17 | 7.27 | 9.95 | 8.55 | 0.99 | 8.23 |
| Nd | 2.24 | 18.56 | 9.20 | 5.98 | 6.25 | 5.54 | 9.76 | 7.65 | 2.98 | 7.65 | 5.04 | 25.88 | 14.18 | 6.34 | 11.41 | 26.19 | 37.12 | 31.78 | 3.89 | 30.87 |
| Sm | 0.37 | 3.75 | 1.72 | 1.22 | 1.22 | 1.48 | 2.20 | 1.84 | 0.51 | 1.84 | 0.97 | 5.21 | 2.69 | 1.25 | 2.13 | 4.97 | 7.62 | 6.45 | 0.88 | 6.40 |
| Eu | 0.09 | 0.77 | 0.37 | 0.24 | 0.27 | 0.38 | 0.49 | 0.43 | 0.07 | 0.43 | 0.21 | 1.10 | 0.55 | 0.26 | 0.45 | 1.01 | 1.62 | 1.37 | 0.20 | 1.36 |
| Gd | 0.35 | 3.20 | 1.59 | 1.09 | 1.08 | 1.83 | 1.88 | 1.85 | 0.04 | 1.85 | 0.95 | 5.18 | 2.68 | 1.27 | 2.12 | 4.82 | 7.83 | 6.55 | 1.07 | 6.60 |
| Tb | 0.03 | 0.36 | 0.17 | 0.13 | 0.12 | 0.24 | 0.27 | 0.26 | 0.02 | 0.26 | 0.11 | 0.63 | 0.31 | 0.16 | 0.24 | 0.59 | 0.98 | 0.82 | 0.14 | 0.84 |
| Dy | 0.18 | 1.68 | 0.86 | 0.62 | 0.53 | 1.25 | 1.62 | 1.43 | 0.26 | 1.43 | 0.58 | 3.31 | 1.65 | 0.84 | 1.28 | 3.29 | 5.31 | 4.45 | 0.75 | 4.60 |
| Ho | 0.04 | 0.32 | 0.16 | 0.11 | 0.09 | 0.22 | 0.31 | 0.27 | 0.06 | 0.27 | 0.11 | 0.63 | 0.32 | 0.16 | 0.25 | 0.63 | 1.03 | 0.85 | 0.14 | 0.89 |
| Er | 0.12 | 1.05 | 0.46 | 0.33 | 0.29 | 0.62 | 0.90 | 0.76 | 0.19 | 0.76 | 0.35 | 1.96 | 1.01 | 0.51 | 0.77 | 2.00 | 3.11 | 2.58 | 0.40 | 2.68 |
| Tm | 0.02 | 0.17 | 0.07 | 0.05 | 0.05 | 0.08 | 0.12 | 0.10 | 0.03 | 0.10 | 0.05 | 0.28 | 0.15 | 0.07 | 0.12 | 0.30 | 0.44 | 0.38 | 0.05 | 0.39 |
| Yb | 0.12 | 1.19 | 0.45 | 0.36 | 0.32 | 0.52 | 0.77 | 0.65 | 0.17 | 0.65 | 0.38 | 1.91 | 1.04 | 0.50 | 0.88 | 2.02 | 2.93 | 2.51 | 0.32 | 2.57 |
| Lu | 0.02 | 0.18 | 0.07 | 0.06 | 0.05 | 0.08 | 0.11 | 0.10 | 0.02 | 0.10 | 0.06 | 0.30 | 0.16 | 0.08 | 0.13 | 0.33 | 0.45 | 0.39 | 0.05 | 0.40 |
| ∑REE | 12.67 | 88.72 | 48.15 | 29.82 | 36.89 | 21.59 | 33.46 | 27.53 | 8.39 | 27.53 | 30.46 | 144.96 | 83.10 | 37.36 | 66.63 | 147.75 | 201.74 | 174.77 | 19.77 | 169.22 |
| ∑LREE | 11.34 | 78.20 | 42.23 | 25.89 | 33.31 | 13.80 | 25.87 | 19.84 | 8.54 | 19.84 | 26.69 | 124.45 | 72.53 | 32.38 | 58.31 | 127.74 | 170.59 | 148.43 | 16.00 | 142.50 |
| ∑HREE | 0.31 | 2.91 | 1.20 | 0.90 | 0.79 | 1.53 | 2.21 | 1.87 | 0.48 | 1.87 | 0.95 | 5.08 | 2.68 | 1.33 | 2.14 | 5.33 | 7.96 | 6.71 | 0.95 | 6.93 |
| LREE/HREE | 26.83 | 49.39 | 37.78 | 7.57 | 37.82 | 6.23 | 16.88 | 11.56 | 7.53 | 11.56 | 22.12 | 31.88 | 27.73 | 2.62 | 28.23 | 20.00 | 25.50 | 22.27 | 1.49 | 21.59 |
| LaN/GdN | 0.50 | 1.45 | 0.95 | 0.37 | 1.11 | 0.09 | 0.23 | 0.16 | 0.10 | 0.16 | 0.89 | 1.44 | 1.10 | 0.15 | 1.07 | 0.70 | 0.96 | 0.83 | 0.08 | 0.85 |
| GdN/LuN | 1.10 | 3.85 | 1.98 | 1.00 | 1.54 | 1.25 | 1.81 | 1.53 | 0.40 | 1.53 | 1.16 | 1.41 | 1.27 | 0.07 | 1.26 | 1.13 | 1.42 | 1.28 | 0.08 | 1.30 |
| LaN/LuN | 1.17 | 1.91 | 1.62 | 0.30 | 1.72 | 0.11 | 0.42 | 0.27 | 0.22 | 0.27 | 0.98 | 1.51 | 1.30 | 0.15 | 1.34 | 0.86 | 1.16 | 0.98 | 0.07 | 0.96 |
| Eu/Eu * | 1.03 | 1.50 | 1.25 | 0.16 | 1.23 | 1.05 | 1.18 | 1.12 | 0.09 | 1.12 | 0.99 | 1.18 | 1.08 | 0.06 | 1.08 | 1.04 | 1.08 | 1.06 | 0.01 | 1.05 |
| Gd/Gd * | 1.23 | 1.37 | 1.31 | 0.05 | 1.33 | 1.29 | 1.39 | 1.34 | 0.07 | 1.34 | 1.27 | 1.37 | 1.32 | 0.02 | 1.31 | 1.24 | 1.36 | 1.32 | 0.03 | 1.33 |
| Ce/Ce * | 1.00 | 1.33 | 1.07 | 0.12 | 1.04 | 0.95 | 0.99 | 0.97 | 0.03 | 0.97 | 0.97 | 1.04 | 1.00 | 0.02 | 1.00 | 1.00 | 1.09 | 1.04 | 0.02 | 1.03 |
Publisher’s Note: MDPI stays neutral with regard to jurisdictional claims in published maps and institutional affiliations. |
© 2021 by the authors. Licensee MDPI, Basel, Switzerland. This article is an open access article distributed under the terms and conditions of the Creative Commons Attribution (CC BY) license (https://creativecommons.org/licenses/by/4.0/).
Share and Cite
Fernández-Caliani, J.C.; Grantcharova, M.M. Enrichment and Fractionation of Rare Earth Elements in an Estuarine Marsh Soil Receiving Acid Discharges from Legacy Sulfide Mine Wastes. Soil Syst. 2021, 5, 66. https://0-doi-org.brum.beds.ac.uk/10.3390/soilsystems5040066
Fernández-Caliani JC, Grantcharova MM. Enrichment and Fractionation of Rare Earth Elements in an Estuarine Marsh Soil Receiving Acid Discharges from Legacy Sulfide Mine Wastes. Soil Systems. 2021; 5(4):66. https://0-doi-org.brum.beds.ac.uk/10.3390/soilsystems5040066
Chicago/Turabian StyleFernández-Caliani, Juan Carlos, and Mihaela Mihaylova Grantcharova. 2021. "Enrichment and Fractionation of Rare Earth Elements in an Estuarine Marsh Soil Receiving Acid Discharges from Legacy Sulfide Mine Wastes" Soil Systems 5, no. 4: 66. https://0-doi-org.brum.beds.ac.uk/10.3390/soilsystems5040066