
Impact of Recycled Water Irrigation on Soil Salinity and Its Remediation
by
 , and
, and
Muhammad Muhitur Rahman
1 ,
,
Alireza Aghajani Shahrivar
2, 
Dharmappa Hagare
2,* and
and
Basant Maheshwari
3 1
Department of Civil and Environmental Engineering, King Faisal University, Al-Hofuf 31982, Saudi Arabia
2
School of Engineering, Design and Built Environment, Western Sydney University, Locked Bag 1797, Penrith, NSW 1797, Australia
3
School of Science, Western Sydney University, Locked Bag 1797, Penrith, NSW 2751, Australia
*
Author to whom correspondence should be addressed.
Soil Syst. 2022, 6(1), 13; https://0-doi-org.brum.beds.ac.uk/10.3390/soilsystems6010013
Submission received: 10 December 2021
/
Revised: 17 January 2022
/
Accepted: 21 January 2022
/
Published: 25 January 2022
(This article belongs to the Special Issue Advances in the Prediction and Remediation of Soil Salinization)
Abstract
:Continuous use of recycled water (treated wastewater) over a long period of time may lead to the accumulation of salt in the root zone of the soil. This is due to the relatively higher levels of salt contained in the recycled water compared to a town water supply. The increase in salt concentration in the soil can adversely influence the amount of water a plant can uptake from the soil due to the osmotic effect. Despite significant benefits, recycled water may deteriorate soil health in terms of increased salinity and sodicity. Although several studies in the past have highlighted the increase of soil salinity due to recycled water irrigation, the phenomenon depends on the variability of soil characteristics. In this study, the impact of using three different types of irrigation water (with electrical conductivity 0.2, 0.8, and 2.0 dS/m) on the mechanism of salt accumulation in the soil was investigated. To contribute to the addition of the existing knowledge of soil salinisation, soil from two paddocks (i.e., D33 and Yarramundi) in Western Sydney, Australia were analysed, and relationships among parameters associated with salt accumulation were evaluated using the results from continuous column studies. Results show that if the irrigation is conducted with high saline water, there is a possibility for salinisation of soil to occur. To prevent this from occurring, one of the solutions could be to use a normal town water supply for irrigation at some intervals. This will allow for the leaching of excess salt accumulated in the soil to deeper layers.
1. Introduction
Recycling is one feasible approach for achieving sustainable wastewater management. The benefits of recycled water are numerous, including alleviating pressure on existing fresh water supplies, minimising effluent discharge to surface or coastal waters, and providing a steady volume of water in comparison to rainfall-dependent sources [1]. Due to the lower treatment cost of recycled water compared to seawater desalination and imported surface water, it may play a significant role in improving urban water supplies in many water-scarce areas of industrialised countries. The advancement of technology and the economic viability of wastewater treatment have enabled wastewater recycling and expanded the most sustainable use of recycled water. One such reuse option is to apply recovered urban water to open fields, such as paddocks and sporting ovals.
In 2004, around 67 percent of recycled water in Australia was used for agriculture, with irrigation firms using approximately half of this water for pasture and feed crops [2]. In 2004-05 and 2008-09, recycled water use in urban irrigation accounted for 30% of total recycled water use but decreased to 27.2 percent in 2009-10 [3,4,5]. According to Sydney Water’s annual report [6], 47 billion litres of recycled water was supplied to Sydney consumers in 2019–2020. This occurred via 23 recycling water schemes contributing to the saving of 13 billion litres of drinking water. The application of supplied recycled water included: 23% for the replacement of drinking water in residential, commercial, and industrial uses; 36.2% for environmental use, such as improving the water quality of rivers; 36.2% for use in recycling water systems in wastewater treatment plants; and 4.25% for irrigation of parks, sporting fields, and agricultural lands. In addition, there is a specific form of water recycling in Sydney, known as sewer mining—owned and operated by organisations such as councils, golf clubs, and commercial operators—contributing to the treatment and provision of over 1.13 billion litres of recycled water across ten schemes [6]. Thus, using urban effluent or recycled water to irrigate urban open fields in lieu of fresh water is an important goal for local and national governments seeking to accomplish sustainable water management.
However, the disadvantage of recycling water, particularly for irrigation, is its pollutant content. Salts are one of the contaminants that this study is concerned with. Salinity refers to the concentration of soluble salts in water, which is measured in soil solutions as total dissolved salts (TDS) or electrical conductivity (EC). Electrical conductivity in soil solution can be determined as EC1:5 (EC of 1:5 soil-water dilution ratio) and ECe (EC of saturated soil paste extract). From an environmental standpoint, salt, and chloride are the two constituents of recycled water that are most concerning since they are more likely to persist as ions in soil solutions and contribute to the salinity’s effect on plant growth [7]. The majority of mineral salts pass through the standard wastewater treatment process untouched unless reverse osmosis is used as one of the treatment procedures [8,9]. As a result of the recycled water’s elevated salt content, when it is utilised for irrigation, there is a risk of salt build-up in the root zone.
Due to the osmotic effect, an increase in the salt content in the soil can have a detrimental effect on the amount of water that a plant can take up from the soil. Numerous studies have documented increasing saline levels in the soil as a result of continuous irrigation using recycled water. Dikinya and Areola [10] detected distinct long-term salinity impacts of recycled water use. They discovered that three years of irrigation with recycled water raised the electrical conductivity of soil from 0.11 to 0.24 dS/cm and the Na+ content from 2.95 to 5.75 meq/100 g of soil. Jahantigh [11] observed a 95 percent increase in salinity levels after five years of irrigation with recycled water. A large number of other researchers have similarly observed an increase in salinity in terms of EC, Na+, and Cl− [12,13,14,15,16,17,18]. Increased salt levels in the soil can have a detrimental effect on the soil’s ability to support plant and agricultural growth [16,19,20,21,22]. As a result, it is critical to regulate salt accumulation in the root zone appropriately, which includes regulating the salt content of irrigation water. Controlling such salt accumulation is possible, which is reported by Shoalhaven Water [23], where soil salinity levels in terms of EC 1:5 have remained well within non-limiting crop growth levels of less than 2 dS/m, even with 17 years of recycled water irrigation history.
Recycled water use, particularly in irrigation, has emerged as a viable solution for meeting water shortages in the absence of new sources of water [24]. Despite the numerous benefits, recycled water may have a detrimental effect on soil health by increasing salinity and sodicity. While various research [12,13,14,15,16,18,25] have demonstrated a rise in soil salinity as a result of recycled water irrigation, the phenomena are highly variable depending on the soil parameters. Due to the high solubility of salts, they enter and collect in the soil’s deeper layer. When the EC of the soil is smaller than the EC of recycled water, a small amount of residual dissolved solid is deposited in the soil, while the majority of the salt is leached from the soil and accumulates in the groundwater [15]. The flow of soil solution is dependent on the soil type in the study region and the soil’s hydraulic qualities, which should be carefully studied while investigating salt accumulation caused by recycled water irrigation. Conducting column studies in the laboratory elicits useful information about the extent of salt accumulation in relation to soil depth, irrigation frequency, and irrigation water salinity. Without such knowledge, it is exceedingly difficult to assert that soil quality is directly related to recycled water application [26,27].
Since 1960, recycled water has been used for irrigation in the Hawkesbury Water Reuse Scheme (HWRS) [26]. Due to this long history of irrigation with recycled water, the HWRS has always been on the radar of the Western Sydney scientific community, prompting the completion of several risk assessment studies related to recycled water irrigation [28,29,30,31,32,33,34]. However, the effect of various irrigation water types on the mechanism of salt formation in the soil requires additional research. To contribute to the current understanding of soil salinisation, soil is studied from two paddocks (D33 and Yarramundi) in the research locations, and links between factors related to salt build-up are analysed using data from continuous column investigations. If the effect of employing different water for irrigation on salt accumulation is known, it will assist field managers in managing the irrigation scheme more effectively.
2. Materials and Methods
2.1. Case Study Area
The Hawkesbury Water Reuse Scheme is located on the Western Sydney University’s Hawkesbury Campus in Richmond, NSW, approximately 80 km northwest of Sydney (Figure 1). The Hawkesbury Water Reuse Scheme was developed in collaboration with the University of Sydney and Sydney Water Corporation (SWC), Richmond TAFE, Hawkesbury City Council, and Clean-Up Australia [35]. Richmond, Blacktown, Londonderry, and Clarendon paddocks are included in the proposal. The D33 paddock (S 33036.889 E 150045.500) is located beneath Blacktown paddock and has a 41-year irrigation history. Yarramundi paddock (S 33036.535 E 150044.193) has never had recycled water irrigation.
Soil samples were collected using the open-pit method from paddocks ranging in depth from 0 to 0.2 m. Different physical and chemical parameters of the air-dried samples were determined (Table 1). The soil textures of D33 and Yarramundi paddocks were assessed to be silty loam (45.6 percent sand, 29.5 percent silt, and 24.9 percent clay) and loamy sand (86.6 percent sand, 9.0 percent silt, and 4.4 percent clay), respectively. Table 2 summarises further physico-chemical parameters.
As shown in Table 2, the electrical conductivity of the soil samples was determined using two different approaches (such as EC1:5 and ECe). While EC1:5 is a simple method for determining soil salinity that is widely used in agriculture, ECe (Soil Saturated Extract Electrical Conductivity) is a time-consuming procedure that requires laboratory facilities to complete effectively. The ECe values are critical for determining a plant’s salinity tolerance [7]. As demonstrated in Table 2, the ratio of ECe to EC1:5 ranged between 6.8 and 13.75 for soils taken from paddocks. The pH values were determined in a 1:5 soil water solution and a saturated paste extract. For all types of soil, the pH of saturated paste extract (pHSE) was greater than the pH of 1:5 soil water solutions.
Before employing soil samples in column investigations, soluble and exchangeable cations were determined in soil samples. The cation exchange capacity was calculated as a sum of all measured exchangeable cations. The soluble cations Na+, K+, Ca2+, and Mg2+ were determined in soil pore water (saturated paste extract). The data presented in Table 2 are critical for establishing the column study’s initial state. Specifically, for a given paddock soil, the baseline values of dissolved cations will be compared to soil samples collected at various depths in the soil profile at the conclusion of the column study; a salinity profile will then be shown. The salinity profile in the soil column enables an understanding of the salt build-up process, particularly in the root zone soil, and aids in the development of sustainable salinity control measures. Additionally, the beginning values of soluble cations presented in Table 2 are compared to samples taken at the conclusion of the column study, which focused on the amount of cations maintained in the soil as a result of recycled water irrigation.
2.2. Irrigation Water
Three types of irrigation waters were used to feed columns in the continuous column study:
- Recycled water;
- Tap water; and
- Synthetic saline water.
The HWRS receives recycled water from Sydney Water’s Richmond Sewage Treatment Plant (STP), which is collected at a receiving pond and then pumped up to the University’s first storage facility, the Effluent Turkey Nest Dam (capacity 93 ML) [35]. Until late 2005, this STP’s supply was primarily secondary, utilising a trickling filter (TF) process combined with pond stabilisation. However, in 2005, Sydney Water made significant changes to the STP, including the replacement of the old TF process with an intermittently decanted aerated lagoon (IDAL) process and tertiary treatment using sand filtration and chlorination/dechlorination [28]. Currently, Richmond STP provides an annual amount of 92 ML of recycled water for the irrigation of Richmond Golf Course and 341 ML for the irrigation of farms, parks, and sports fields within the Hawkesbury campus of Western Sydney University [6]. The recovered water had an electrical conductivity of between 0.81 and 0.84 dS/m. Cation concentrations of Na+, Mg2+, K+, and Ca2+ were determined to be 95.9, 20.6, 16.9, and 13.7 mg/L, respectively. The sodium adsorption ratio was determined to be 3.8. The tap water was collected at Western Sydney University’s laboratory for column investigations. Tap water had an electrical conductivity of between 0.21 and 0.22 dS/m. Cation concentrations of Na+, Mg2+, K+, and Ca2+ were determined to be 19.5, 4.67, 4.65, and 13.52 mg/L, respectively. The sodium adsorption coefficient was determined to be 1.2. The electrical conductivity of synthetic water was 2.0 dS/m. The concentrations of Na+, Mg2+, K+, and Ca2+ were determined to be 240, 52, 43, and 34 mg/L, respectively, and 6.0 was determined as the sodium adsorption ratio.
2.3. Continuous Laboratory Column Study
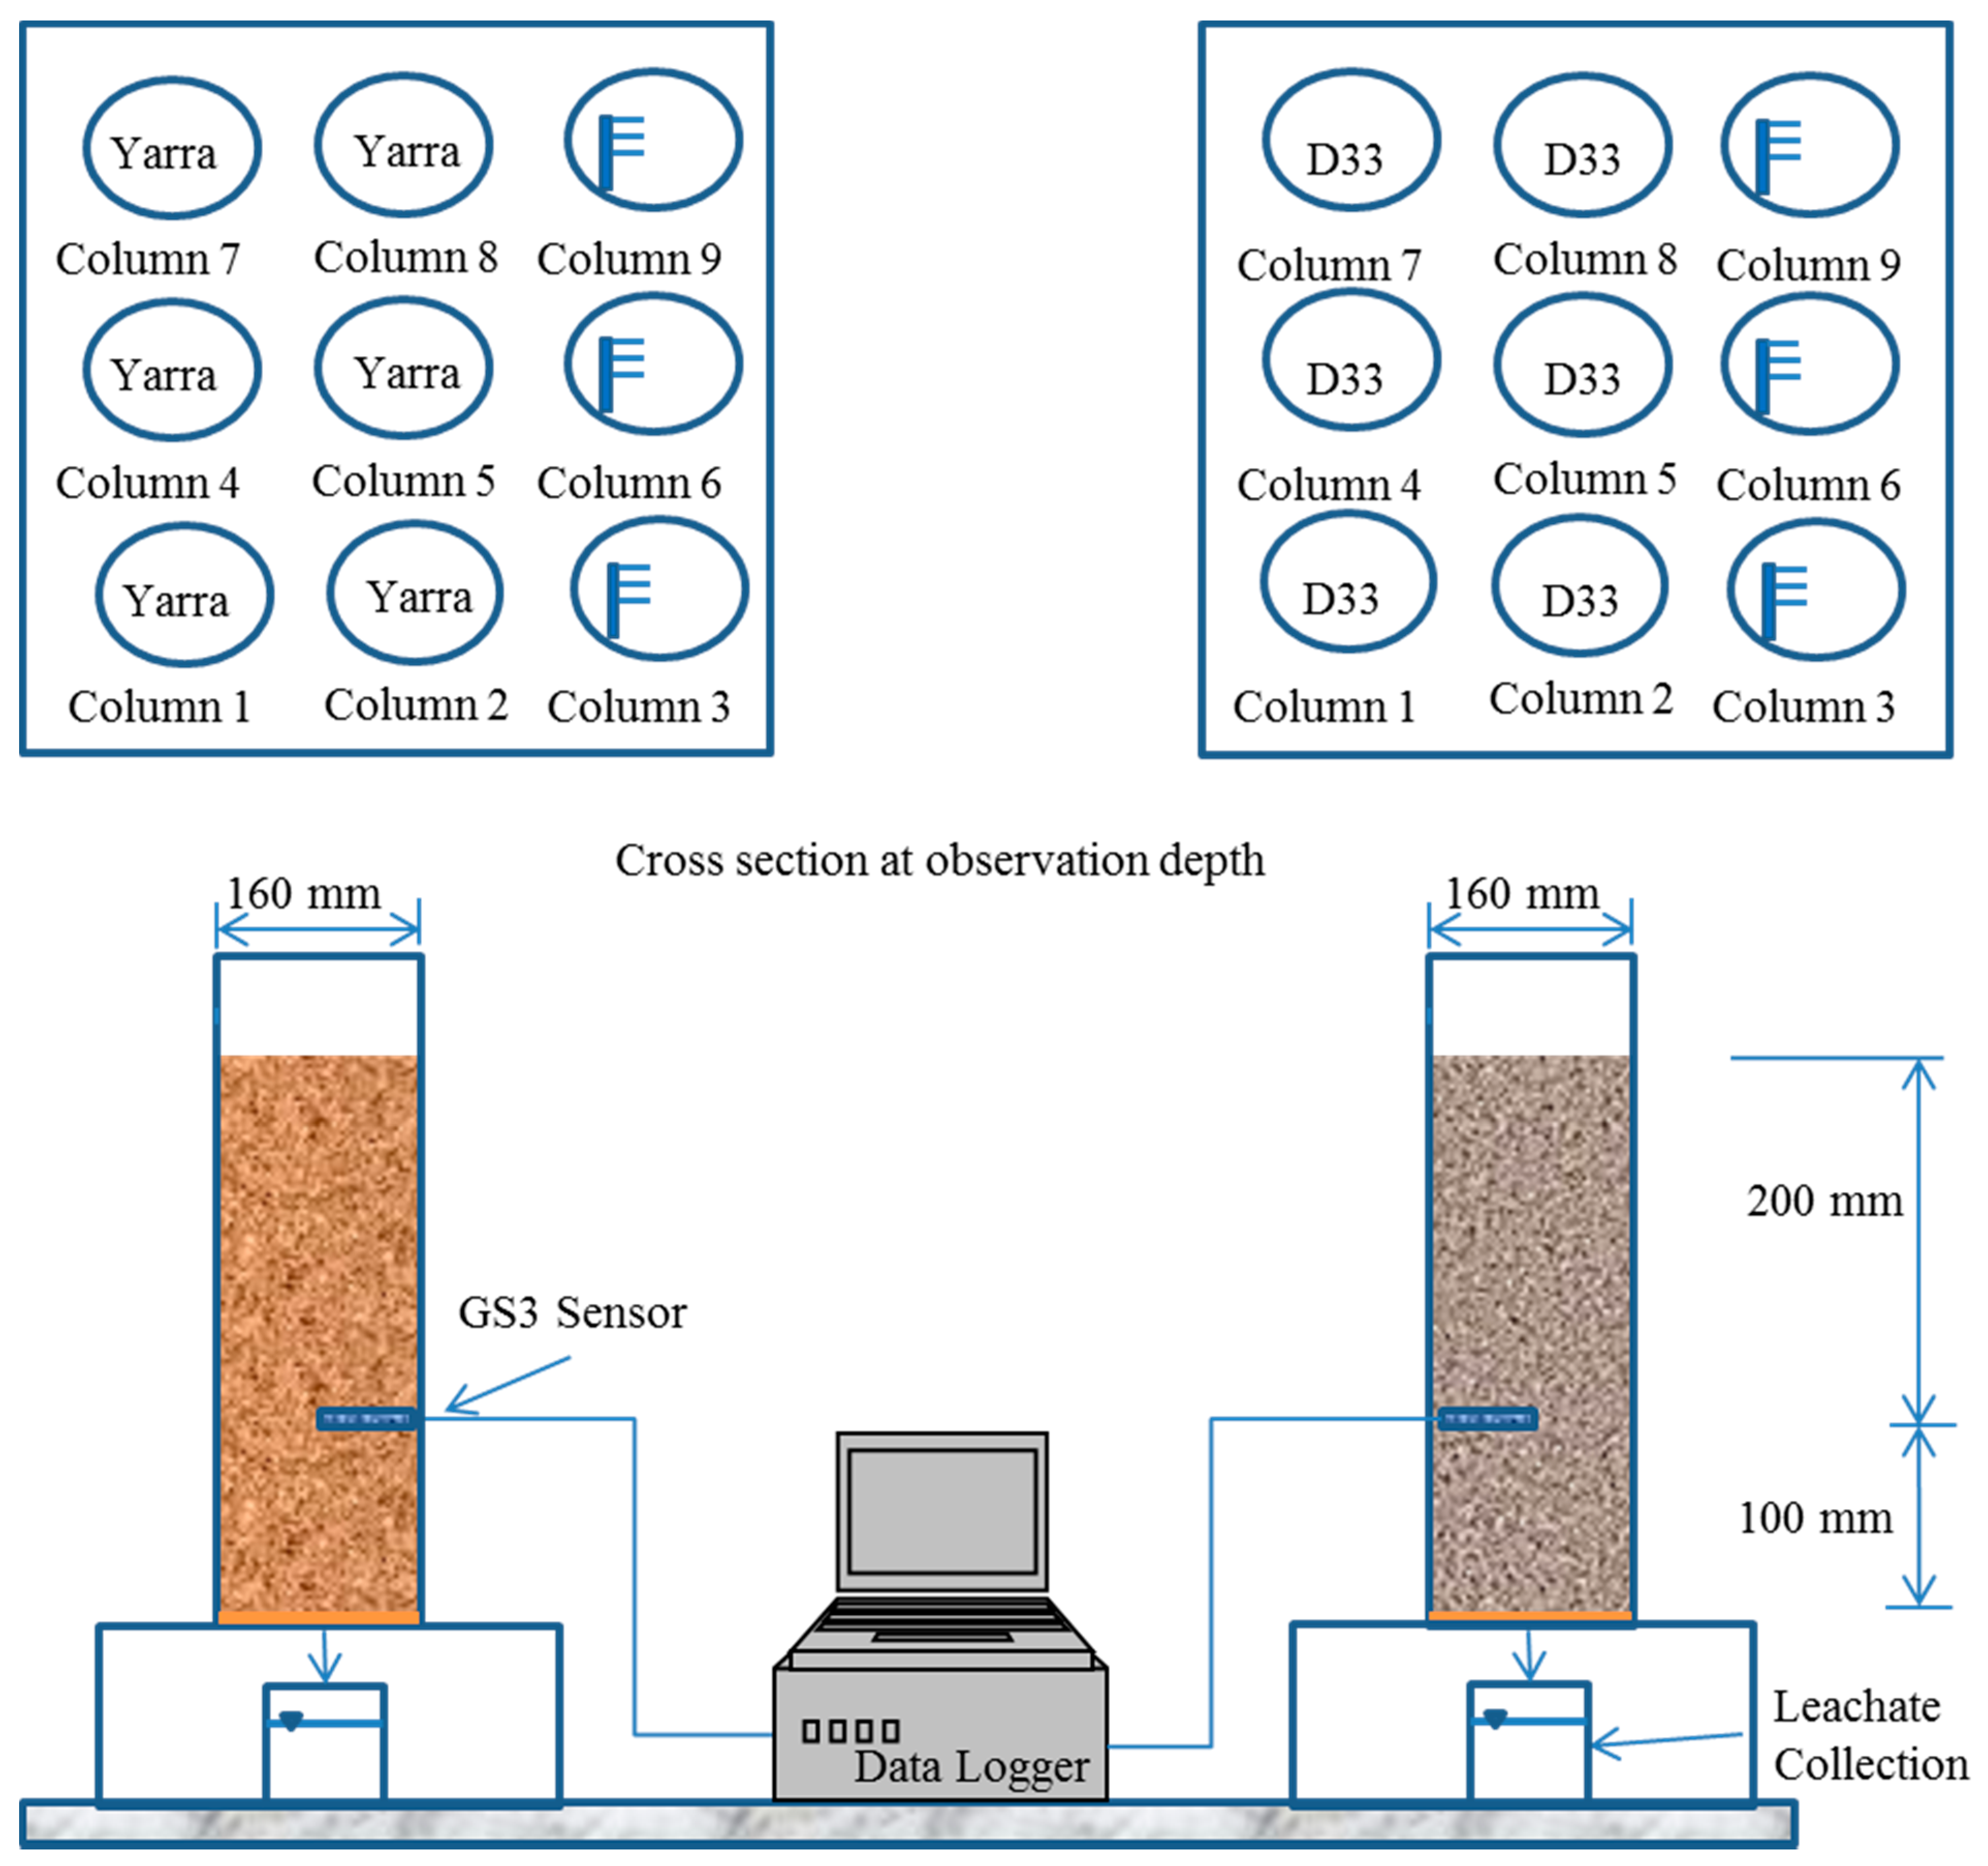
Soil samples were placed into 350 mm long plexiglass tubes with 2.5 mm thick columns. Each column’s soil profile was maintained 300 mm below the surface. The 300 mm depth of the soil profile is selected to resemble the root zone of the field condition. The columns were 160 mm in diameter externally. At the bottom of the column, a 200 mm × 200 mm baseplate was employed. The base plate was perforated with holes of 2.0 mm in diameter. At the bottom of the column, a plastic mesh (mesh size 800 m) was employed. The column configuration is schematically depicted in Figure 2. Three replicates of each soil type were irrigated with a different type of irrigation water. For example, in columns 1, 2, and 3, tap water was utilised; recycled water was used in columns 4, 5, and 6; and synthetic saline water was used in columns 7, 8, and 9. Irrigation water was applied in a similar manner to both types of soil. At a depth of 0.2 m from the soil surface, one of the three columns from each irrigation water type was mounted with a GS3 sensor [39]. At a depth of 0.2 m, GS3 sensors were employed to monitor bulk electrical conductivity (ECbulk).
All 18 columns of both soil types were packed to maintain a bulk density of 1500 kg/m3. The soil column experiment lasted 330 days. Three times per week, irrigation water (tap, recycled, and saline) was applied; a total of 960 mm of each type of irrigation water was applied during the study period. The leached water at the bottom of each column was collected, volumetrically quantified, and electrical conductivity measured using an EC meter. It should be noted that no equivalent of rainfall was considered in the column study, which would have had an additional leaching effect in a field environment regardless of an irrigation water source. At the conclusion of the investigation, soil samples were taken every five centimetres along the soil profile. Each soil sample was subsampled for EC1:5, ECe, and soluble cations analysis (Na+, Mg2+, K+, and Ca2+). All soil samples collected from 18 columns were subjected to the tests. The entire setup took place within a laboratory on the University of Western Sydney’s Kingswood campus. A weather station regularly monitored meteorological factors such as temperature, relative humidity, and wind speed. A pyranometer was used to measure solar radiation (Decagon Inc., Lagos, Nigeria).
The cumulative quantity of leached salt (g/m2) was estimated by multiplying the amount of leached water (m) by the total dissolved solids (TDS) in the leached water (g/m3). The concentration of salt in the leached water was determined using electrical conductivity (dS/m) and converted to TDS using a factor of 640 [40,41]. The leaching fraction was calculated by dividing the volume of water leached from the soil column by the volume of irrigation water applied.
2.4. Goodness of Fit Indices
The goodness of fit between experimental and model projected data were evaluated using a variety of statistical measures, including mean absolute error (MAE), root mean square error (RMSE), percent relative error (RE), and percent bias (BIAS).
Between observed and expected values, the mean absolute error (MAE) is calculated as follows:
where, represents observed values; represents predicted values; N represents the number of observations. The MAE value close to zero indicates good model performance. Similarly, the RMSE can be calculated by:
MAE and RMSE are used to quantify the presence and magnitude of deviations between simulated and observed data [42,43]. MAE and RMSE are expressed in the units of the corresponding variable.
RE expresses the relative error of simulated values as a percentage of observed values. RE’s ideal value is zero, which shows optimal model performance. It may be determined as follows:
BIAS calculates the percentage of residuals that are more than or equal to the observed values, indicating whether the model over- or underestimates the observed values [44]. BIAS has a perfect value of zero. Low values of BIAS suggest that the model produced superior simulation results, whereas positive and negative values represent underestimate and overestimation bias in the simulated outcomes, respectively. The BIAS can be calculated as follows:
Statistical analyses were conducted using Minitab® [45].
3. Results and Discussion
3.1. Impact of Irrigation Water Salinity on the Salt Mass Balance
Figure 3a illustrates the average amount of salt accumulated in D33 paddock soil columns as a result of irrigation with tap water (TW), recycled water (RW), and synthetic saline water (SW). The stored salt load in columns using tap water varied between 0.04 and 3.88 g/m2. On the other hand, in the case of recycled and saline water they were 0.78 to 7.7 g/m2 and 0.79 to 12.82 g/m2, respectively. The total cumulative salt mass stored in both RW and SW irrigated columns demonstrated a distinct rising pattern of salt accumulation within 21 days of applying irrigation water. However, for TW irrigation, the salt build-up trend was different, with a negative salt accumulation at the start of the research period. From day two, the applied tap water leached a significant amount of salt from the D33 soil profile, resulting in a negative cumulative stored salt mass over 134 days. Positive salt accumulation began on day 135 and continued throughout the study period. As expected, more accumulation occurred in SW irrigated columns than in RW and TW irrigated columns. At the end of the 330-day study period, SW irrigated columns accumulated 16.2 times more salt than TW irrigated columns and 2.5 times more salt than RW irrigated columns. When comparing RW and TW irrigated columns, the RW irrigated column accumulated 6.4 times the amount of salt compared to the TW irrigated column. Thus, the results presented above indicate that in the absence of rainfall, salt increases in the D33 paddock soil.
The salinity of irrigation water has a significant effect on the EC of leachate (Figure 3a). It is intriguing to see that the EC of leachate in SW irrigated columns increased as the study period progressed. During the study period, the average leachate EC from SW irrigated columns was 8.30 dS/m (range: 2.18–16.03 dS/m); for RW irrigated columns, the average leachate EC was 3.32 dS/m (range: 1.33–8.44 dS/m); and for TW irrigated columns, the average leachate EC was 1.12 dS/m (range: 0.29—The cumulative quantity of leachate averaged over three columns) from SW and TW irrigated columns was practically identical, at 2.5 L; however, the figure was 0.3 L greater than the cumulative amount of leachate from RW irrigated columns. This accounts for about 12% difference, which may not be significant. An almost identical cumulative leachate amount demonstrates that the same operating protocols were followed for all nine columns.
Similar observations can be made with D33 soil columns (Figure 3b). Positive cumulative salt accumulation began on day 76 for columns irrigated with TW. It should be noted that the negative salt build-up persisted in the D33 paddock column for a longer amount of time than in the Yarramundi paddock column, which may be due to the difference in soil texture and starting salt concentration between these two types of soil. Silty loam soil (D33 paddock) comprises a greater amount of clay than loamy sand soil (Yarramundi paddock), implying that it has a low hydraulic conductivity, resulting in a longer time required to leach salt from the soil profile. Another factor could be the irrigation history of the D33 paddock, which has been irrigated with recycled water for 40 years, compared to zero years for Yarramundi pasture. When the soils were collected at the start of the investigation, the D33 soil had a higher saturated electrical conductivity than the Yarramundi paddock soil, 0.824 dS/m against 0.281 dS/m, respectively (Table 2).
At the end of the study period, SW irrigated columns accumulated 10.9 times more salt than TW irrigated columns and 2.3 times more salt than RW irrigated columns. When comparing RW and TW irrigated columns, RW irrigated columns accumulated salt 4.8 times faster than TW irrigated columns. Similar to D33 soil columns, leachate from Yarramundi soil columns included a greater concentration of salt, as shown by electrical conductivity (EC). During the study period, the average EC of leachate from SW irrigated columns was 6.40 dS/m (range: 2.22–13.40 dS/m); for RW irrigated columns, the average EC of leachate was 1.81 dS/m (range: 0.83–3.06 dS/m); and for TW irrigated columns, the average EC of leachate was 0.66 dS/m (range: 0.15–1.67 dS/m). Leachate had a lower electrical conductivity in Yarramundi soil columns than in D33 soil columns. Leachate was also less prevalent in Yarramundi soil columns than in D33 soil columns, particularly in SW irrigated columns. After 233 days, no leachate was recorded in SW-irrigated Yarramundi columns. This uncommon condition may explain why Yarramundi soil columns contain more salt than D33 soil columns. As illustrated in Figure 3a,b, up to 233 days after SW irrigation, the salt mass of Yarramundi and D33 soil columns was similar; 640 g/m2 for Yarramundi and 609 g/m2 for D33 soil columns. However, over the next 97 days, the salt load in SW irrigated Yarramundi columns grew by 46%, whereas the salt load in D33 soil columns increased by 35%. This instance demonstrates the critical role of leaching in reducing salt accumulation in the soil profile.
3.2. Impact of Irrigation Water Salinity on Continuous Real-Time Monitoring of Salt Accumulation
Figure 4a illustrates the results of continuous real-time monitoring of ECbulk at a depth of 0.2 m in D33 paddock soil columns. SW irrigated columns consistently had a higher ECbulk than RW and TW irrigated columns from the start of the study period. On average, SW irrigated columns had 1.9 and 2.8 times the salinity level of RW and TW irrigated columns in terms of ECbulk, respectively. The ECbulk for the RW irrigated column was 1.5 times that of the TW irrigated column. After 270 days, a rapid increase in ECbulk was recorded for all SW, RW, and TW irrigated columns, owing to the increased irrigation water input after Day 270. As illustrated in Figure 4a, about 1.5 times as much water was applied between Days 260 and 320 compared to the between Days 228 and 259. This additional irrigation water was provided to maintain the volumetric water content (VWC) near 0.25, which corresponds to the field capacity of D33 paddock soil.
Comparing the ECbulk variation obtained for Yarramundi soil columns (Figure 4b) to that observed in D33 columns (Figure 4a), ECbulk was observed to be higher for Yarramundi columns, which were irrigated with SW and RW. At the end of the column studies, ECbulk for the SW irrigated column containing Yarramundi soil was 1.9 dS/m, which was significantly higher than the value observed for D33 paddock soil (1.2 dS/m). This indicates that Yarramundi soil has the tendency to accumulate salinity within its profile.
3.3. Impact of Irrigation Water Salinity on EC1:5 and ECe
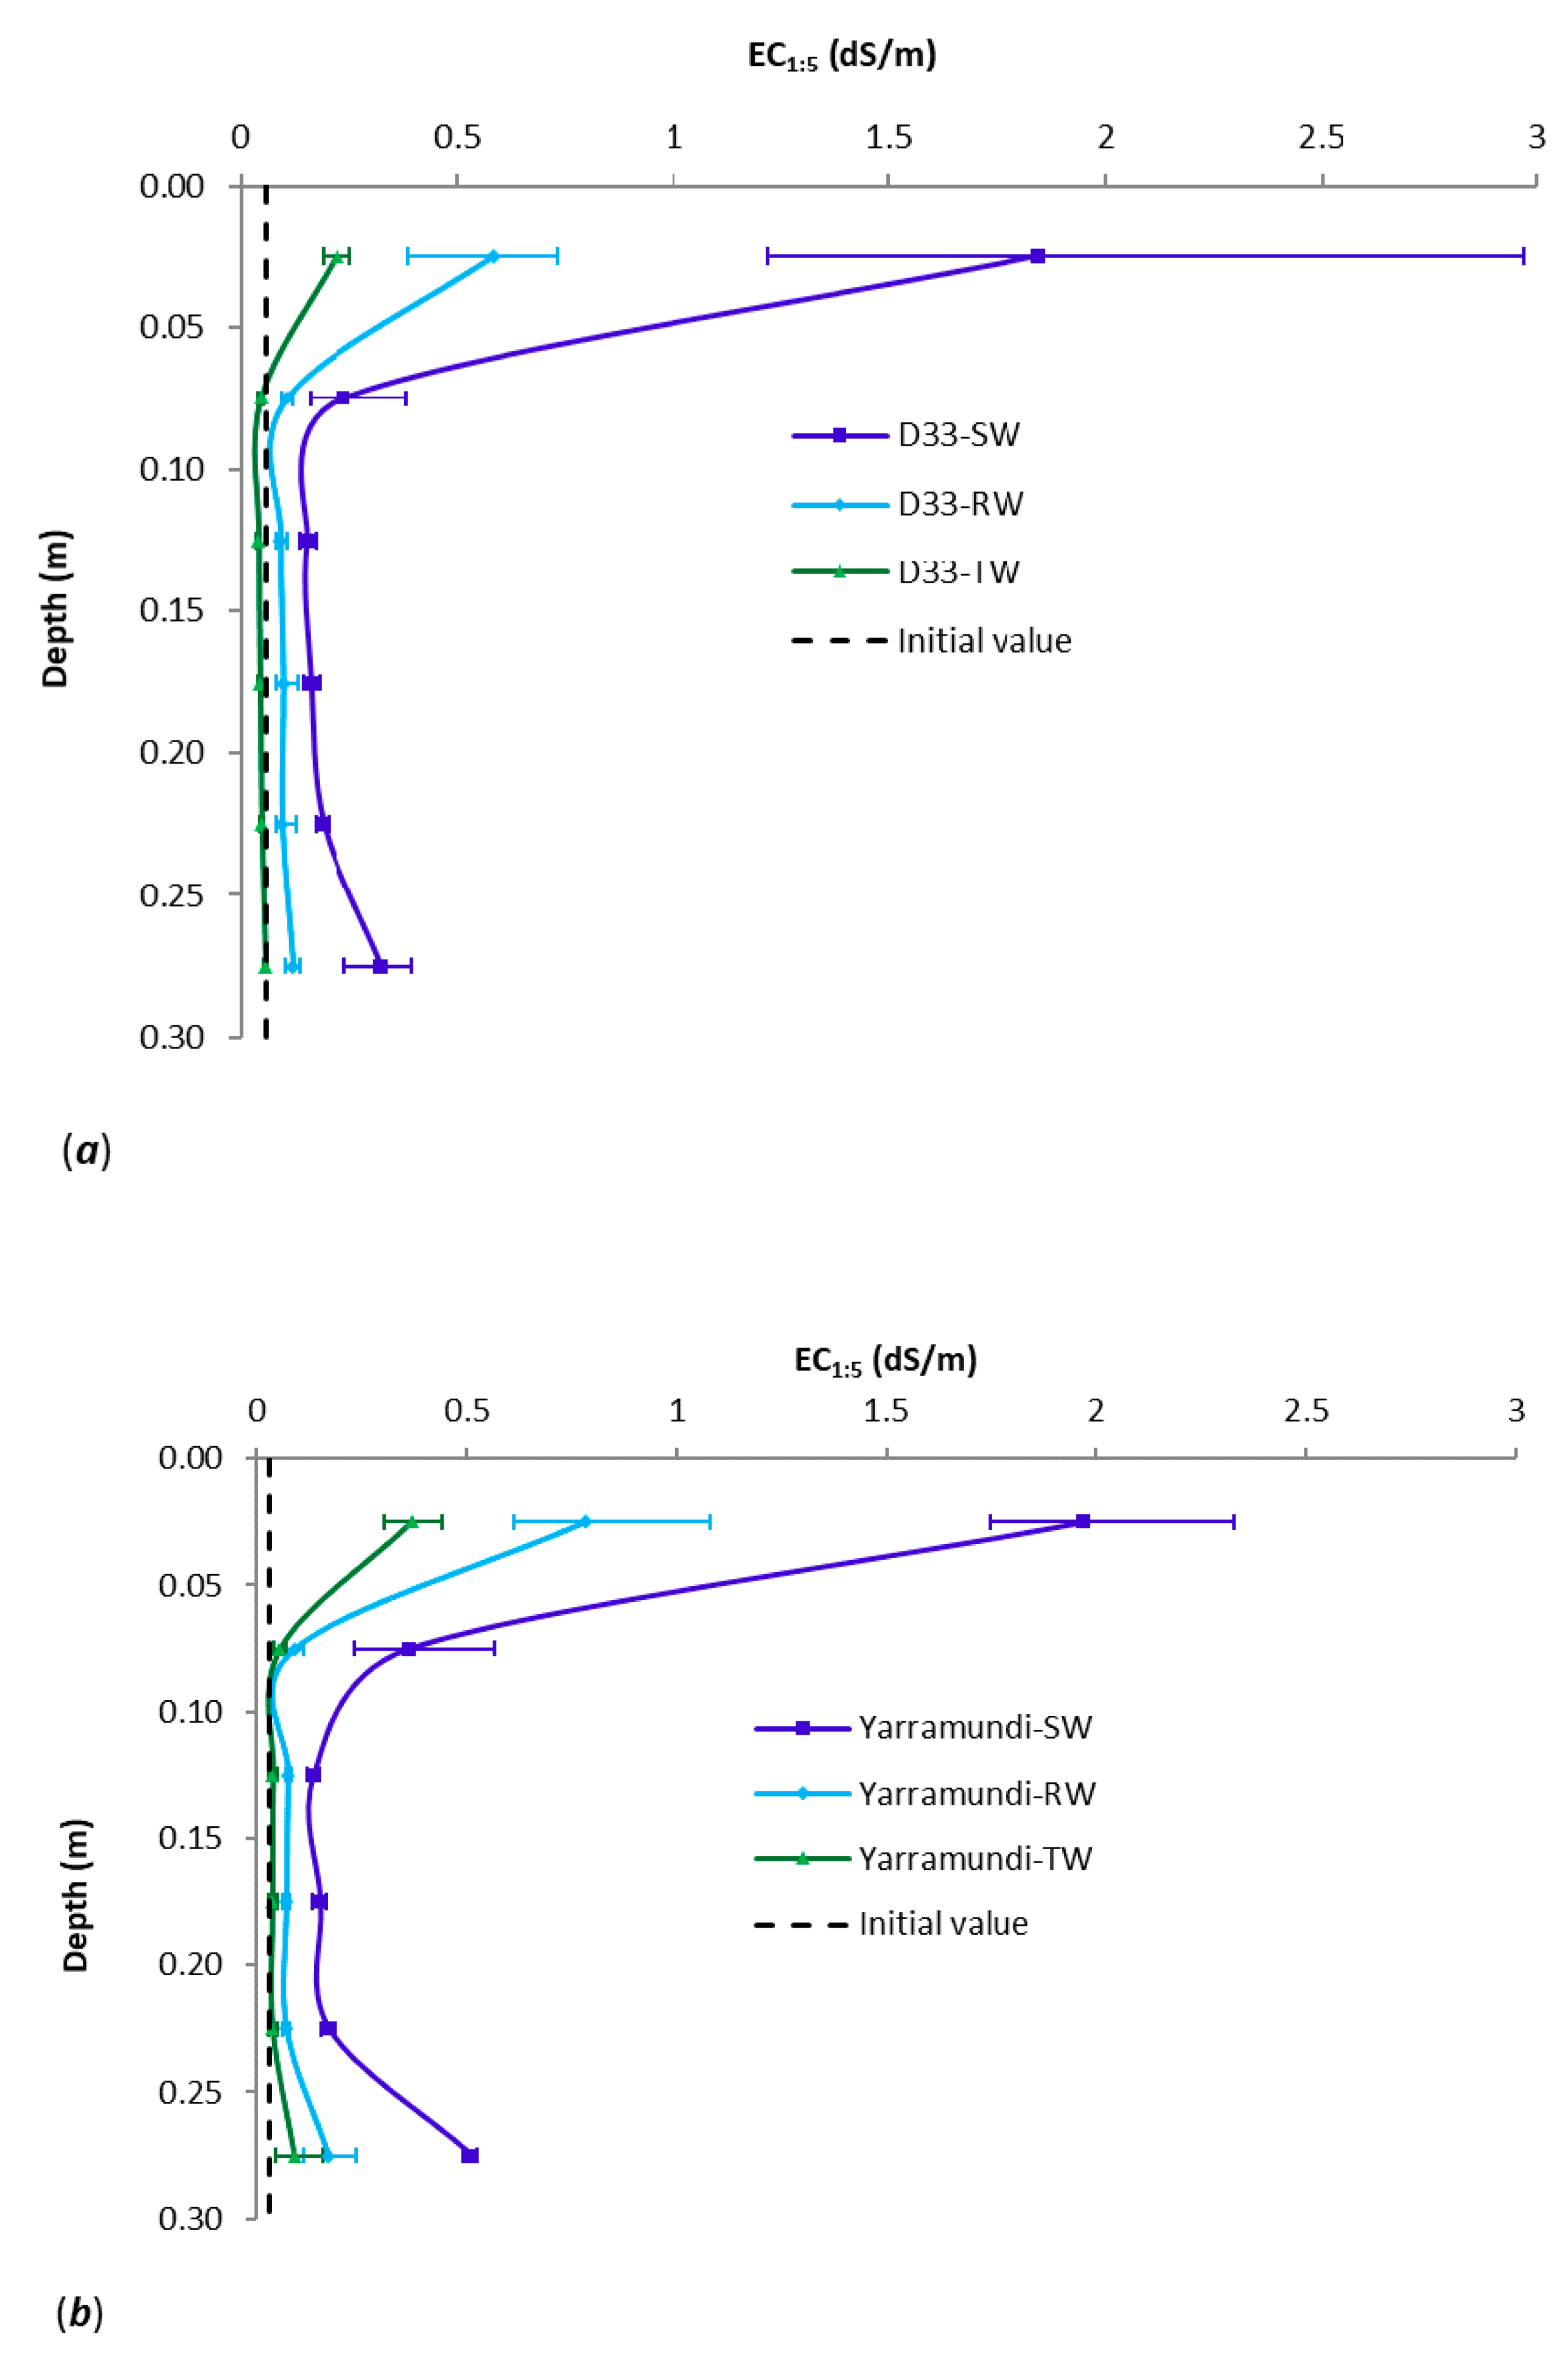
Figure 5 illustrates the results of EC1:5 at various levels of the soil profile in the D33 and Yarramundi paddock soil columns. It should be noted that the data reflect the salt accumulation at the conclusion of the 330-day column research. The values of EC1:5 were averaged over six soil samples at various depths (for each irrigation water type). As illustrated in Figure 5a, the majority of salt accumulation occurred between 0 and 0.1 m below the soil surface. This is expected, as the upper half of the soil column evaporates more water than the bottom part. SW irrigated columns had 3.2 times the EC1:5 of RW irrigated columns, and 8.3 times the EC1:5 of TW irrigated columns in the top 0.05 m of the soil column. In comparison to TW irrigated columns, RW irrigated columns had 2.6 times the EC1:5 concentrations. The results demonstrate that irrigation water salinity has an effect on soil salinity at this level in terms of EC1:5. The fluctuation in the amount of salt accumulated was greater at this depth (0–0.1 m) than in the rest of the columns, as indicated by the error bars. This is especially true for SW irrigated columns of D33 paddock soil. The results reveal that salt accumulation is diverse at this depth in the D33 soil profile. SW irrigated columns accumulated 2.7 and 6.8 times more salt than RW and TW irrigated columns, respectively, while RW irrigated columns accumulated 2.5 times more salt than TW irrigated columns. For all three irrigation water types, the variance in EC1:5 was nearly constant between column depths of 0.1 and 0.2 m. However, the EC1:5 ratio grew again between 0.25 and 0.3 m deep. Between 0.2 and 0.3 m, SW irrigated columns accumulated 2.4 and 4.9 times more salt than RW and TW irrigated columns, respectively, while RW irrigated columns accumulated 2.0 times more salt than TW irrigated columns. As a result of the foregoing discussion, it can be inferred that as irrigation water salinity increased (i.e., in comparison to each other), more salt was collected between depths 0 and 0.2 m in D33 paddock soil columns than between depths 0.2 and 0.3 m.
Additionally, Figure 5a depicts the variation in the value of EC1:5 relative to its original value at the start of the column research. Table 2 shows the values of EC1:5 and ECe obtained in D33 paddock soil prior to the beginning of the column investigation. Between 0 and 0.2 m, EC1:5 increased 10 and 3.7 times in SW and RW irrigated columns, respectively; between 0.2 and 0.3 m, the rise was 4.3 and 1.8 times, respectively. Furthermore, EC1:5 increased 3.7 times (from 0.06 to 0.368 dS/m) in TW irrigated columns, but remained lower than the starting value at all other depths. The results demonstrate the feasibility of utilising less saline water to regulate salinity in irrigated soils.
Figure 5b illustrates the variation in salt accumulation in terms of EC1:5 in Yarramundi soil columns. As with the D33 paddock soil columns, a nearly same pattern of fluctuation in EC1:5 over the depth of the soil profile was found. Between 0 and 0.2 m, SW irrigated columns accumulated 2.6 and 5.3 times more salt than RW and TW irrigated columns, respectively, while RW irrigated columns accumulated 2.0 times more salt than TW irrigated columns; the average values of EC1:5 were higher than those observed in D33 paddock soil columns at this depth. Between 0.2 and 0.3 m, SW irrigated columns accumulated 2.9 and 5.5 times the salt of RW and TW irrigated columns, respectively, while RW irrigated columns accumulated 1.9 times the salt of TW irrigated columns. These results, again, indicate that the Yarramundi soil has the tendency to accumulate higher amounts of salinity.
When the fluctuation of EC1:5 in Yarramundi paddock soil columns was compared to its starting value (Figure 5b), EC1:5 was greater between depths 0 and 0.2 m than between depths 0.2 and 0.3 m. Between depths 0 and 0.2 m, EC1:5 rose by 21.8, 8.4 and 4.1 times in SW, RW, and TW irrigated columns, respectively, and by 11.4, 4.0, and 2.1 times between depths 0.2 and 0.3 m. It appears that Yarramundi paddock soil columns included greater EC1:5 in their higher half (from 0 to 0.2 m) when compared to D33 soil columns at the same depth. This could be because silty loam soil holds more water than loamy sand soil, resulting in less evaporation from D33 paddock soil than Yarramundi paddock soil. Evaporation is the primary mechanism by which salt is concentrated in the soil in this experiment; more evaporation occurred from the Yarramundi paddock soil columns than from the D33 paddock soil columns, resulting in greater salt accumulation in the upper part of the Yarramundi soil columns than in the D33 paddock soil columns. Figure 6 illustrates salt accumulation in terms of ECe at various levels of the soil profile in the D33 and Yarramundi paddock soil columns. In general, salt accumulation in terms of ECe followed the typical cyclical pattern of salt accumulation in all columns. The cyclical pattern of salt accumulation depicted in Figure 6 is related to variations in irrigation water evaporation and application, as well as salt transit through the soil column. Salinity profiles in terms of ECe were found to be similar to the salinity profiles of EC1:5 mentioned previously in D33 and Yarramundi paddock soil; however, they differed quantitatively. As a result, a full examination of the fluctuation of ECe in the columns is omitted.
Relationship between ECe and EC1:5
The extraction of soil water solution for the determination of EC1:5 is less time-consuming and more convenient than the extraction of soil water solution for the determination of ECe. As a result, it is desirable to calculate ECe from the supplied value of EC1:5 when representing salt build-up using an appropriate conversion equation. The purpose of this study is to assess a site-specific equation for converting EC1:5 to ECe for both D33 and Yarramundi paddocks. Figure 7 depicts the connection between the measured ECe and EC1:5 in soil samples from the D33 and Yarramundi soil columns. As illustrated in Figure 7a, when all data were analysed, the measured ECe values in samples from D33 paddock soil columns were found to be poorly linked with EC1:5. When values of ECe > 10 dS/m were excluded, however, it was shown that they were substantially linked with EC1:5. The values of ECe greater than 10 dS/m were excluded since the best correlation between ECe and EC1:5 was obtained when the ECe value was less than 10 dS/m. A straightforward linear regression equation has been developed, which is as follows:
The predictor variable (EC1:5) in Equation (5) has a p-value of zero, indicating that it is a meaningful object in the regression equation. The root mean square error (RMSE) value indicates a reasonable agreement between experimental and regressed results (Figure 7b). The regressed ECe values for soil samples were less than 0.5 percent lower than the experimental ECe values, as indicated by BIAS in Figure 7b. As a result, the proposed regression equation is adequate for measuring samples with an ECe of 10 dS/m and an EC1:5 of 1.5 dS/m for D33 paddock soils. Other studies have also reported segmenting observed ECe and EC1:5 values in order to build a reasonable relationship between ECe and EC1:5. A few examples are listed in Table 3.
When all data were reviewed, the measured ECe values for Yarramundi soil columns (Figure 7c) were shown to be poorly linked with EC1:5. When values of ECe > 10 dS/m were excluded, however, it was shown that they were substantially linked with EC1:5 (Figure 7d). A straightforward linear regression equation has been developed, which is as follows:
The p-value for the predictor variable in the regression equation (EC1:5) was determined to be zero, indicating that the predictor is a meaningful object in the regression equation. The root mean square error (RMSE) value indicates a reasonable agreement between experimental and regressed results (Figure 7c). According to BIAS, the regressed ECe computed for soil samples overstated the experimental ECe by less than 0.5 percent. Similar to D33 paddock soil, the proposed regression equation is acceptable for Yarramundi paddock soil samples with ECe values of 10 dS/m and EC1:5 values of 2.5 dS/m.
3.4. Impact of Irrigation Water Salinity on Soluble Cations
Figure 8 illustrates the results of soluble cations analysis in terms of Na+, Mg2+, K+, and Ca2+ at various depths of the soil columns containing D33 and Yarramundi paddock soil. The soluble cations in the saturated paste extract were determined. Sodium’s general behaviour was found to be comparable to that of the ECe shown in Figure 6. Na+ grew more rapidly in the top 0.1 m of the soil profile (due to enhanced evaporation at this depth compared to the lower half of the column), but remained cyclical throughout the soil profile. The increased Na+ concentration at the top of the columns could potentially be due to the absence of rainfall throughout the research period. According to Gonçalves et al. [49], in the absence of rainfall, the concentration of Na+ peaked in the upper layer of the soil profile, but returned to its initial level following rainfall; the amount of Na+ in the bottom layer rose following rainfall. The low values of Na+ concentration in the lower part of the column may be due to a lack of flushing of Na+ from the top part of the column by rainfall; the nominal increase of Na+ in some depths between 0.15 and 0.3 m may be due to leaching of some Na+ from the upper part (0–0.1 m) and transport to the lower part due to irrigation water application.
As expected, the concentration of sodium chloride (Na+) in soil columns irrigated with synthetic saline water (SW) was higher than in columns irrigated with recycled water or tap water; the concentration of Na+ in synthetic saline water was 2.5 times that of recycled water and 12.3 times that of tap water. The highest concentration of Na+ was reported in Yarramundi paddock soil (Figure 8e) in the top 0.1 m depth, which was nearly double that found in D33 paddock soil (Figure 8a); this could be due to the soil type differential noted previously. Additionally, Ca2+, Mg2+, and K+ concentrations are also shown in Figure 8. Once again, these cations varied in a manner similar to that of Na+.
The soluble Na+, Ca2+, and Mg2+ concentrations were utilised to calculate the sodium adsorption ratio. The effect of increasing the salinity of the irrigation water on the SAR measured in the saturated paste extract was observed to be distinct; the SAR in both types of soil rose as the irrigation water salinity increased. As expected, the variance for SAR throughout the soil profile followed the same pattern as that of ECe.
Relationships of ECe with Soluble Cations
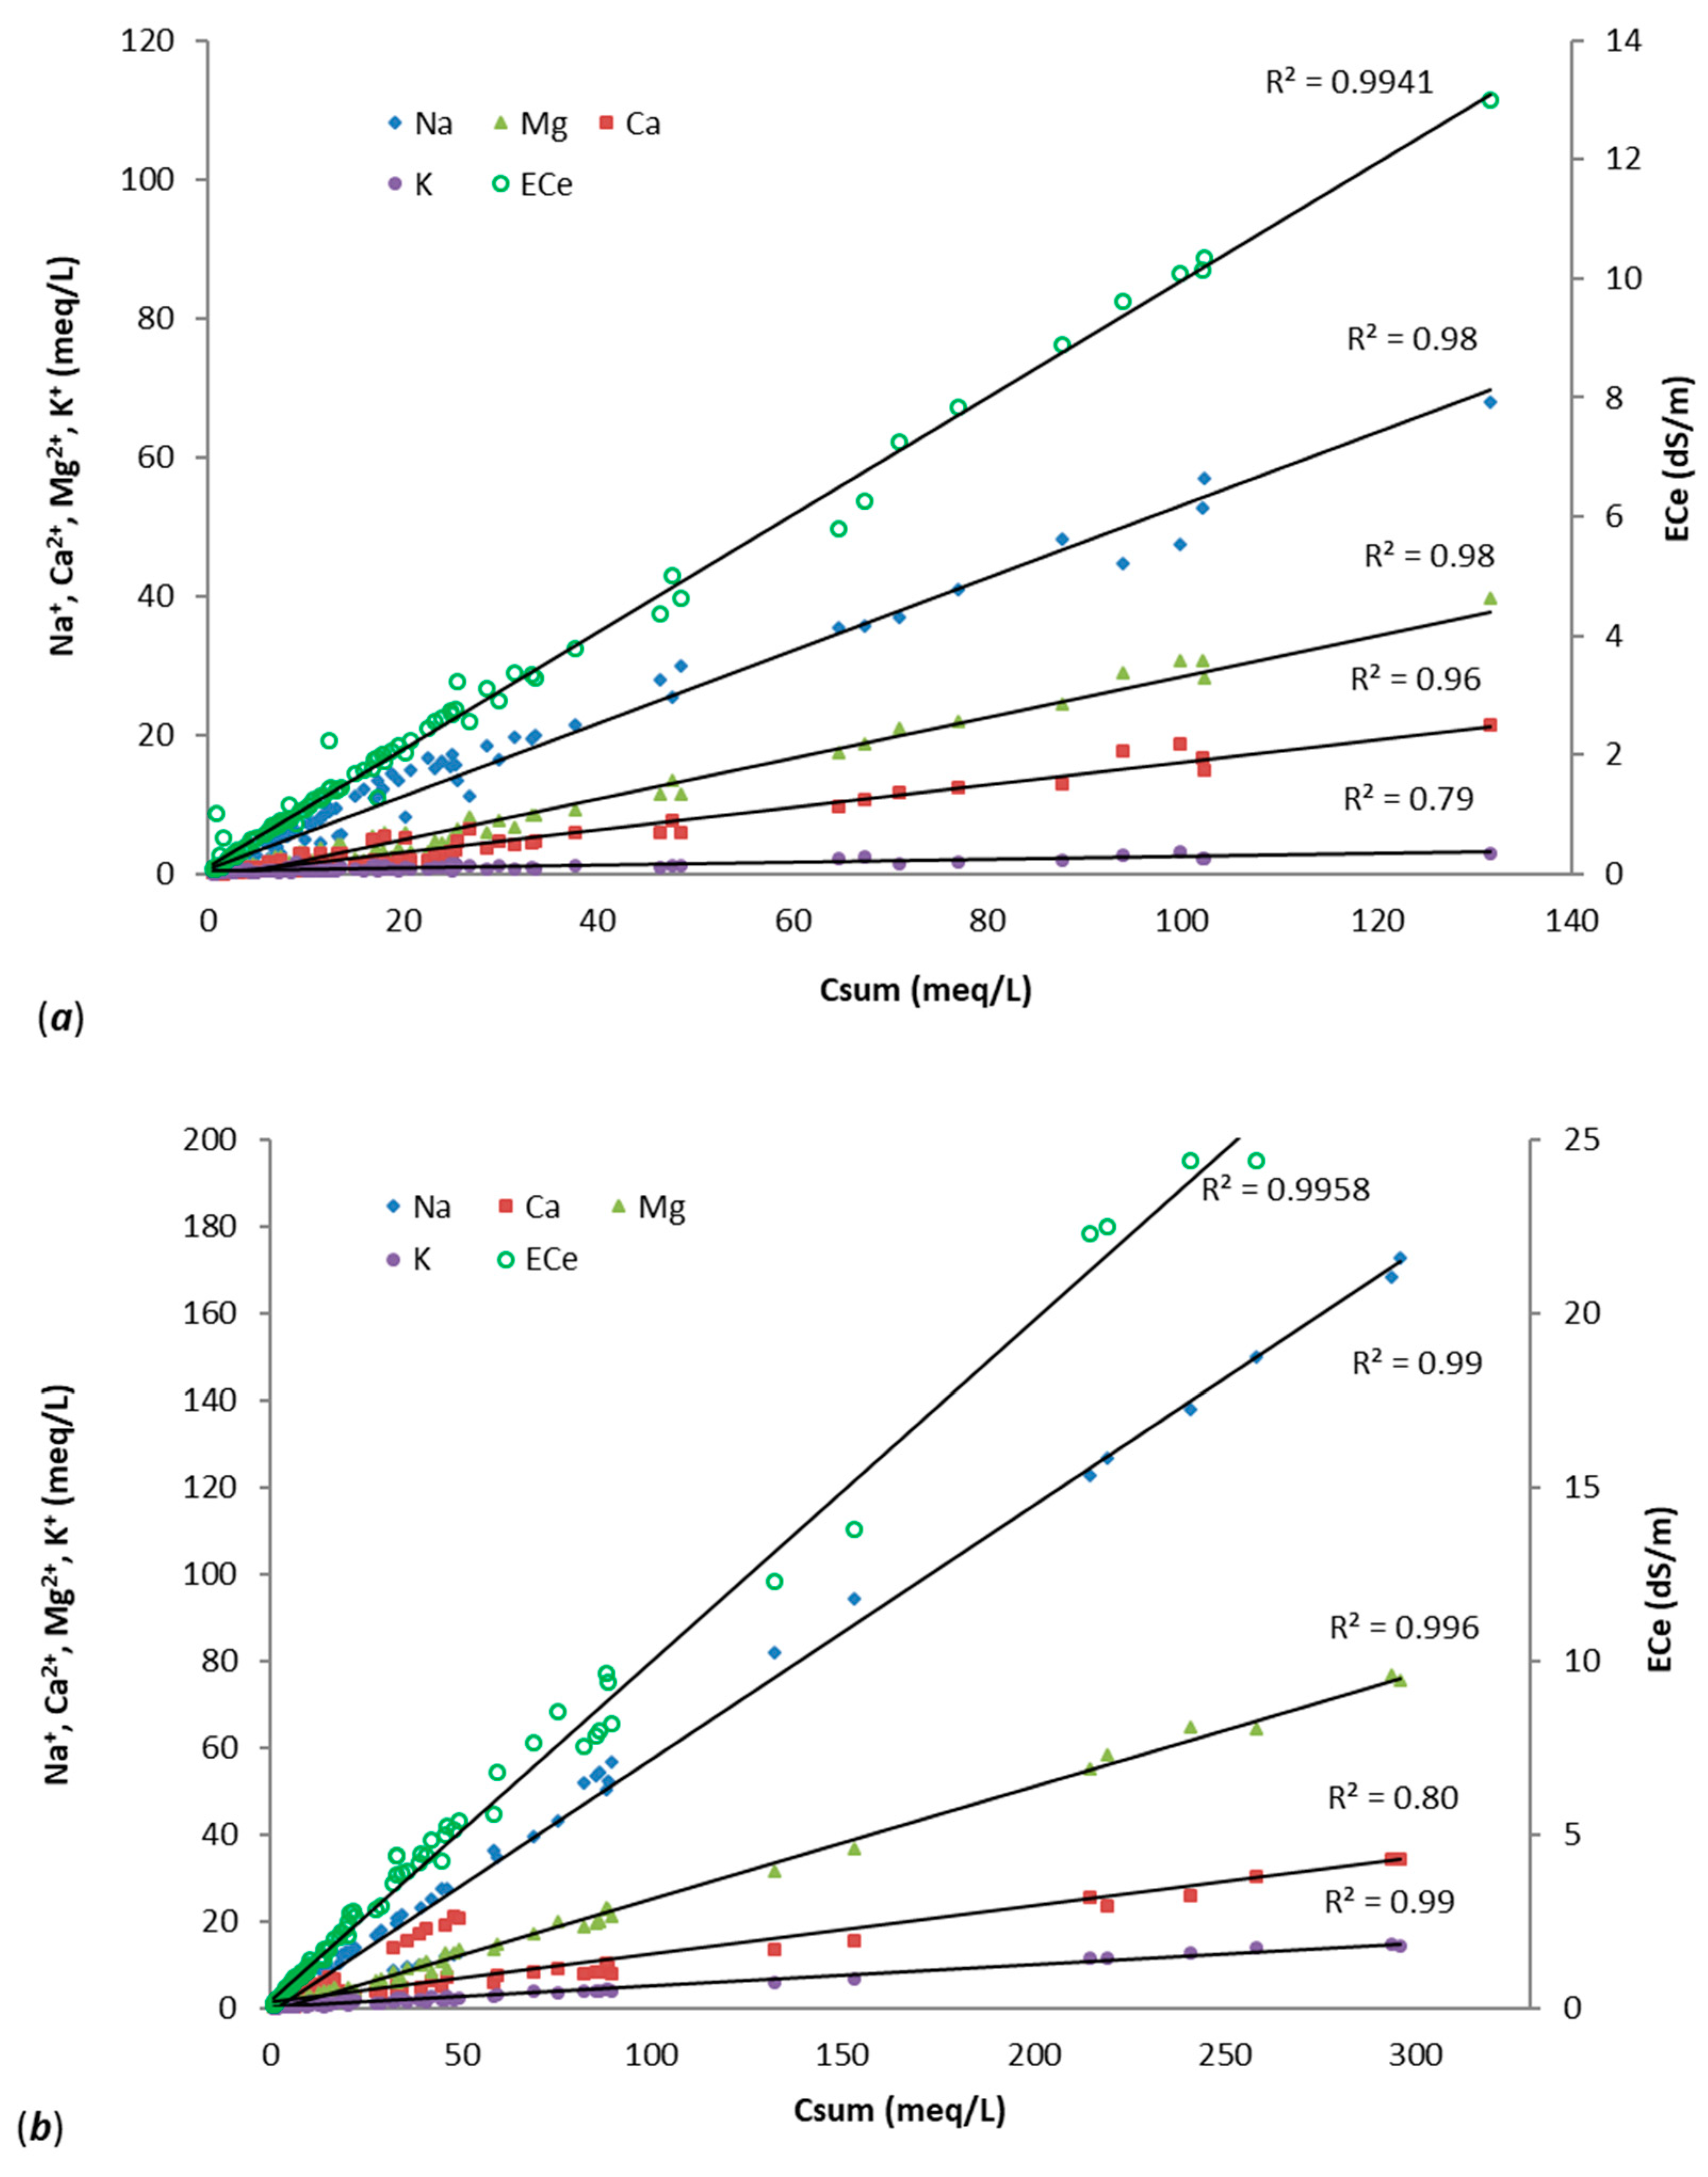
The association between ECe and the total cation concentration (Na+, Ca2+, Mg2+, K+ abbreviated as Csum) in the saturated paste extract for samples obtained from D33 paddock soil columns is shown in Figure 9a. The correlation between the values of ECe and Csum was discovered, and a regression equation was proposed (Figure 9a). The suggested regression equation was established for ECe values ranging from 0.07 to 13 dS/m and Csum values ranging from 0.5 to 132 meq/L. At these ranges, the equation is adequate for calculating Csum for a given value of ECe on soil similar to the D33 paddock. The regression equation between ECe and Csum was found to be similar to the equation proposed by Bresler et al. [50], which is given by:
ECe = 0.1 Csum
A similar association between ECe and the total cation content measured in the saturated paste extract was examined and reported in Figure 9b for samples collected from Yarramundi paddock soil columns.
Additionally, Figure 9a was created to determine the correlations between specific cations and Csum in saturated paste extract. Relationships between the concentrations of individual cations (e.g., Na+, Ca2+, Mg2+, or K+) and their total cation concentrations are useful for determining the effect of individual cations on the ionic composition of saturated paste extract (or soil water). This also identifies which cation is causing nutritional deficiencies in the root zone soil water, which may have an effect on crop growth [51]. According to Oanzen & Chang [51], two phenomena can limit crop output as a result of salt accumulation in the root zone: osmotic stress and nutrient deficiency in the soil water. Thus, for D33 paddock soil, the following relationships between individual cations and total salinity (in terms of cation concentration) in saturated paste extract are postulated (Equations (8)–(11)):
For a given Csum, Equations (8)–(11) can be used to determine the ionic composition of saturated paste extract from D33 paddock soil. Needless to say, the total cation concentration for a particular ECe may be determined using the relationship presented in Figure 9a. Similar equations for Yarramundi paddock soil were constructed as follows (Equations (12)–(15)):
The high correlation coefficient between individual and total cation concentrations, as well as the low p-values for the generated Equations (12)–(15), confirm that they can be used with a degree of confidence for the soil types investigated in this study.
As illustrated in Figure 9a,b, the concentrations of all cations increased linearly with increasing total salinity, while the ratio of soluble cations differed in soil samples. For example, in the case of RW irrigated D33 paddock soil, the soluble cations ratios Na+/Mg2+/Ca2+/K+ were discovered to be 0.61/0.22/0.13/0.04, compared to 0.34/0.37/0.04/0.25 before the start of the study. Similarly, for RW irrigated Yarramundi paddock soil, the ratios were determined to be 0.62/0.22/0.11/0.04, compared to 0.35/0.11/0.18/0.35 at the start of the trial. The shift in the ratios happened as a result of cation exchange. Due to the high salt content of recycled water and continuous irrigation with it, this resulted in a rise in Na+ and a reduction in K+. This will result in an increase in soil sodicity and a decrease in the amount of nutrients accessible to plants.
4. Conclusions
A column study integrating real-time salinity monitoring in the soil profile was done to determine the effect of irrigation water salinity on salt build-up in the soil of two paddocks in Hawkesbury, NSW, Australia (D33 and Yarramundi). Three types of water were used as irrigation water namely, tap water (TW), recycled water (RW), and synthetic saline water (SW) with average electrical conductivities of 0.2, 0.81, and 2.0 dS/m, respectively.
The results indicated that the continuous use of recycled water can lead to the accumulation of salt in the soil, particularly in the root depth of 0 to 0.2 m. The higher the salt concentration in the recycled water, the higher is the accumulation of salt in the soil. The study included columns filled with two types of soils, namely, silty loam (D33 Paddock) and loamy sand (Yarramundi paddock). It appears that the soil from the Yarramundi paddock is more susceptible to salt accumulation compared to the soil from the D33 paddock.
The results indicate the critical role of leaching in managing the salt accumulation in the soil profile. In practice, if the recycled water is used for irrigation, the field may balance salt concentration in the soil by allowing the salt to escape from the top layers of the soil into the deep layers. This can naturally happen when there are rain events at regular intervals.
A set of equations relating ECe, and total and individual cation concentrations were established as part of this study. By using these equations, it is possible to estimate the individual cation concentrations by measuring the ECe of the soil. When the recycled water is used for irrigation, these equations can be used to monitor the cations build-up by just measuring the ECe of the soil. Particularly, these equations are useful to monitor sodium build-up in the soil. As a result, there is a considerable cost saving that can be achieved for monitoring the salt accumulation in the soil which is irrigated with recycled water.
In general, the effect of irrigation water salinity on salt build-up in the soil profile was evident. The data presented in this paper demonstrated that the higher the salt content in the irrigation water, the higher is the salt build-up. This salt build-up can be controlled by either reducing the salt concentration in the irrigation water or facilitating the leaching of the salt to deeper layers through appropriate irrigation management.
Author Contributions
Conceptualization, M.M.R.; methodology, M.M.R. and D.H.; formal analysis, M.M.R.; data curation, M.M.R., A.A.S. and D.H.; writing—original draft preparation, M.M.R., D.H. and A.A.S.; writing—review and editing, B.M., M.M.R., D.H. and A.A.S. All authors have read and agreed to the published version of the manuscript.
Funding
No funding was received for this research.
Institutional Review Board Statement
Not applicable.
Informed Consent Statement
Not Applicable.
Data Availability Statement
Data related to this article can be obtained by contacting the lead or corresponding author.
Acknowledgments
The lead author acknowledges the support received from King Faisal University (KFU), Saudi Arabia, for preparing this manuscript. The authors acknowledge the support received from Western Sydney University (WSU) and Commonwealth Scientific and Industrial Research Organisation (CSIRO) for conducting this research. Thanks to Lyn Anderson, Roger Attwater, Mark Emanuel, Julie Svanberg, and Burhan Amiji from Hawkesbury Campus, WSU, for extending their support in conducting field experiment and laboratory analysis. Thanks to Upul Jayamaha, Tosin Famakinwa, and Kiran KC, from Penrith Campus, WSU for providing logistic supports. Special thanks to Nelly Albrecht and Tiffany Bassinet from École Nationale Supérieure de Chimie de Rennes, France, who contributed to the chemical analyses of soil samples.
Conflicts of Interest
The authors declare no conflict of interest.
References
- Chen, Z.; Ngo, H.H.; Guo, W. A critical review on sustainability assessment of recycled water schemes. Sci. Total Environ. 2012, 426, 13–31. [Google Scholar] [CrossRef] [PubMed]
- Hamilton, A.J.; Boland, A.M.; Stevens, D.; Kelly, J.; Radcliffe, J.; Ziehrl, A.; Dillon, P.; Paulin, B. Position of the Australian horticultural industry with respect to the use of reclaimed water. Agric. Water Manag. 2005, 71, 181–209. [Google Scholar] [CrossRef]
- ABS. Water Account for Australia 2009–2010; Australian Bureau of Statistics: Canberra, Australia, 2012.
- ABS. Water Account for Australia 2008–2009; Australian Bureau of Statistics: Canberra, Australia, 2010.
- ABS. Water Account for Australia 2004–2005; Australian Bureau of Statistics: Canberra, Australia, 2006.
- Sydney Water. Water Conservation Report—Sydney Water; Sydney Water: Sydney, Australia, 2020. [Google Scholar]
- Natural Resource Management Ministerial Council; Environment Protection and Heritage Council. Australian Health Ministers’ Conference. Australian Guidelines for Water Recycling: Managing Health and Environmental Risks. 2006. Available online: https://www.waterquality.gov.au/sites/default/files/documents/water-recycling-guidelines-full-21.pdf (accessed on 20 January 2022).
- Aiello, R.; Cirelli, G.; Consoli, S. Effects of reclaimed wastewater irrigation on soil and tomato fruits: A case study in Sicily (Italy). Agric. Water Manag. 2007, 93, 65–72. [Google Scholar] [CrossRef]
- Rebhun, M. Desalination of reclaimed wastewater to prevent salinization of soils and groundwater. Desalination 2004, 160, 143–149. [Google Scholar] [CrossRef]
- Dikinya, O.; Areola, O. Comparative analysis of heavy metal concentration in secondary treated wastewater irrigated soils cultivated by different crops. Int. J. Environ. Sci. Technol. 2010, 7, 337–346. [Google Scholar] [CrossRef] [Green Version]
- Jahantigh, M. Impact of recycled wastewater irrigation on soil chemical properties in an arid region. Pak. J. Biol. Sci. 2008, 11, 2264–2268. [Google Scholar] [CrossRef]
- Adrover, M.; Farrús, E.; Moyà, G.; Vadell, J. Chemical properties and biological activity in soils of Mallorca following twenty years of treated wastewater irrigation. J. Environ. Manage. 2012, 95, 188–192. [Google Scholar] [CrossRef]
- Candela, L.; Fabregat, S.; Josa, A.; Suriol, J.; Vigués, N.; Mas, J. Assessment of soil and groundwater impacts by treated urban wastewater reuse. A case study: Application in a golf course (Girona, Spain). Sci. Total Environ. 2007, 374, 26–35. [Google Scholar] [CrossRef]
- Chen, W.; Lu, S.; Pan, N.; Jiao, W. Impacts of long-term reclaimed water irrigation on soil salinity accumulation in urban green land in Beijing. Water Resour. Res. 2013, 49, 7401–7410. [Google Scholar] [CrossRef]
- Klay, S.; Charef, A.; Ayed, L.; Houman, B.; Rezgui, F. Effect of irrigation with treated wastewater on geochemical properties (saltiness, C, N and heavy metals) of isohumic soils (Zaouit Sousse perimeter, Oriental). Desalination 2010, 253, 180–187. [Google Scholar] [CrossRef]
- Lin, Y.; Qian, Y. Mineral composition of Kentucky bluegrass under recycled water irrigation on golf courses. HortScience 2019, 54, 357–361. [Google Scholar] [CrossRef]
- Rahman, M.; Hagare, D.; Maheshwari, B. Framework to assess sources controlling soil salinity resulting from irrigation using recycled water: An application of Bayesian Belief Network. J. Clean. Prod. 2015, 105, 406–419. [Google Scholar] [CrossRef]
- Xu, J.; Wu, L.; Chang, A.; Zhang, Y. Impact of long-term reclaimed wastewater irrigation on agricultural soils: A preliminary assessment. J. Hazard. Mater. 2010, 183, 780–786. [Google Scholar] [CrossRef]
- Al-Hamaiedeh, H.; Bino, M. Effect of treated grey water reuse in irrigation on soil and plants. Desalination 2010, 256, 115–119. [Google Scholar] [CrossRef]
- Alshammary, S.F.; Qian, Y.L.; Wallner, S.J. Growth response of four turfgrass species to salinity. Agric. Water Manag. 2004, 66, 97–111. [Google Scholar] [CrossRef]
- Bernstein, L. Effects of Salinity and Sodicity on Plant Growth. Annu. Rev. Phytopathol. 1975, 13, 295–312. [Google Scholar] [CrossRef]
- Grewal, H.; Maheshwari, B.L. Treated effluent and saline water irrigation influences soil properties, yield, water productivity and sodium content of snow peas and celery. J. Plant Nutr. 2013, 36, 1102–1119. [Google Scholar] [CrossRef]
- Shoalhaven Water. Reclamation Annual Report 2019-20; Shoalhaven City Council: Shoalhaven, Australia, 2021.
- Tsagarakis, K. Recycled water valuation as a corollary of the 2000/60/EC water framework directive. Agric. Water Manag. 2005, 72, 1–14. [Google Scholar] [CrossRef]
- Alrajhi, A.; Beecham, S.; Bolan, N.S.; Hassanli, A. Evaluation of soil chemical properties irrigated with recycled wastewater under partial root-zone drying irrigation for sustainable tomato production. Agric. Water Manag. 2015, 161, 127–135. [Google Scholar] [CrossRef]
- Aiken, J. A Soil Microbial Response to Urban Wastewater Application: Bacterial Communities and Soil Salinity. Ph.D. Thesis, Western Sydney University, Sydney, Australia, 2006. [Google Scholar]
- Stevens, D.; McLaughlin, M.; Kelly, M. Effects of long-term irrigation with reclaimed water on soils of the Northern Adelaide Plains, South Australia. Soil Res. 2003, 41, 933–948. [Google Scholar] [CrossRef] [Green Version]
- Aiken, J.; Derry, C.; Attwater, R. Impact of improved recycled water quality on a Sydney irrigation scheme. Water 2010, 37, 86–90. [Google Scholar]
- Derry, C.; Attwater, R. Risk perception relating to effluent reuse on a university campus. Water 2006, 33, 57–62. [Google Scholar]
- Derry, C.; Attwater, R.; Booth, S. Rapid health-risk assessment of effluent irrigation on an Australian university campus. Int. J. Hyg. Environ. Health 2006, 209, 159–171. [Google Scholar] [CrossRef] [PubMed]
- Rahman, M.M.; Hagare, D.; Maheshwari, B.; Dillon, P. Impacts of prolonged drought on salt accumulation in the root zone due to recycled water irrigation. Water. Air. Soil Pollut. 2015, 226, 90. [Google Scholar] [CrossRef]
- Rahman, M.; Hagare, D.; Maheshwari, B. Bayesian Belief Network analysis of soil salinity in a peri-urban agricultural field irrigated with recycled water. Agric. Water Manag. 2016, 176, 280–296. [Google Scholar] [CrossRef]
- Rahman, M.; Hagare, D.; Maheshwari, B.; Dillon, P.; Kibria, G. Modelling of the impact of future climate changes on salt accumulation in paddocks of different soil types due to recycled water irrigation. Water Sci. Technol. Water Supply 2016, 16, 653–666. [Google Scholar] [CrossRef]
- Shahrivar, A.; Rahman, M.; Hagare, D.; Maheshwari, B. Variation in kikuyu grass yield in response to irrigation with secondary and advanced treated wastewaters. Agric. Water Manag. 2019, 222, 375–385. [Google Scholar] [CrossRef]
- Booth, C.; Attwater, R.; Derry, C.; Simmons, B. The Hawkesbury water reuse scheme. Water 2003, 5, 42–44. [Google Scholar]
- McDonald, R.C.; Isbell, R.F.; Speight, J.G.; Walker, J.; Hopkins, M.S. Australian Soil and Land Survey Handbook: Field Handbook, 2nd ed.; Inkata Press: Melbourne, Austrilia, 1990. [Google Scholar]
- Madsen, M.; Chandler, D.G.; Reynolds, W.D. Accounting for bias and boundary condition effects on measurements of saturated core hydraulic conductivity. Soil Sci. Soc. Am. J. 2008, 72, 750–757. [Google Scholar] [CrossRef]
- Rayment, G.; Higginson, F. Australian Laboratory Handbook of Soil and Water Chemical Methods; Inkata Press Pty Ltd.: Melbourne, Austrilia, 1992. [Google Scholar]
- Decagon Devices. GS3 Water Content, EC and Temperature Sensors. 2015. Available online: www.ictinternational.com/content/uploads/2014/03/GS3-ManualWeb1.pdf (accessed on 20 January 2022).
- Metcalf, L.; Eddy, H.; Tchobanoglous, G. Wastewater Engineering: Treatment, Disposal, and Reuse, 3rd. ed.; McGraw Hill: New York, NY, USA, 1991. [Google Scholar]
- Stevens, D.P.; Smolenaars, S.; Kelly, J. Irrigation of Amenity Horticulture with Recycled Water: A Handbook for Parks, Gardens, Lawns, Landscapes, Playing Fields, Golf Courses and Other Public Open Spaces. 2008. Available online: https://waterportal.com.au/swf/images/swf-files/42m---2026-recycled-water-handbook-for-the-amenity-horticulture-industry_handbook.pdf (accessed on 20 January 2022).
- Kanzari, S.; Hachicha, M.; Bouhlila, R.; Battle-Sales, J. Simulation of water and salts dynamics in Bouhajla (Central Tunisia): Exceptional rainfall effect. Soil Water Res. 2012, 7, 36–44. [Google Scholar] [CrossRef] [Green Version]
- Ramos, T.; Šimůnek, J.; Gonçalves, M.; Martins, J.; Prazeres, A.; Castanheira, N.L.; Pereira, L.S. Field evaluation of a multicomponent solute transport model in soils irrigated with saline waters. J. Hydrol. 2011, 407, 129–144. [Google Scholar] [CrossRef]
- Moriasi, D.; Arnold, J.; Van Liew, M.; Bingner, R.L.; Harmel, R.D.; Veith, T.L. Model evaluation guidelines for systematic quantification of accuracy in watershed simulations. Trans. Am. Soc. Agric. Biol. Eng. 2007, 50, 885–900. [Google Scholar]
- MINITAB Statistical Software; Release 16; MINITAB: State College, PA, USA, 2000.
- Aboukila, E.F.; Norton, J.B. Estimation of saturated soil paste salinity from soil-water extracts. Soil Sci. 2017, 182, 107–113. [Google Scholar] [CrossRef]
- Kargas, G.; Chatzigiakoumis, I.; Kollias, A.; Spiliotis, D.; Massas, I.; Kerkides, P. Soil Salinity Assessment Using Saturated Paste and Mass Soil: Water 1:1 and 1:5 Ratios Extracts. Water 2018, 10, 1589. [Google Scholar] [CrossRef] [Green Version]
- Visconti, F.; de Paz, J.M.; Rubio, J.L. What information does the electrical conductivity of soil water extracts of 1 to 5 ratio (w/v) provide for soil salinity assessment of agricultural irrigated lands? Geoderma 2010, 154, 387–397. [Google Scholar] [CrossRef]
- Gonçalves, M.C.; Šimůnek, J.; Ramos, T.B.; Martins, J.C.; Neves, M.J.; Pires, F.P. Multicomponent solute transport in soil lysimeters irrigated with waters of different quality. Water Resour. Res. 2006, 42. [Google Scholar] [CrossRef] [Green Version]
- Bresler, E.; McNeal, B.L.; Carter, D.L. Transportation and Distribution of Salts. In Saline and Sodic Soils; Springer: Berlin, Germany, 1982; pp. 79–165. [Google Scholar]
- Oanzen, H.H.; Chang, C. Cation concentrations in the saturation extract and soil solution extract of soil salinized with various sulfate salts. Commun. Soil Sci. Plant Anal. 1988, 19, 405–430. [Google Scholar] [CrossRef]
Figure 1.
Map showing the location of D33 and Yarramundi paddock within the campus of Western Sydney University, Hawkesbury (the shaded area shows Western Sydney University campus).
Figure 1.
Map showing the location of D33 and Yarramundi paddock within the campus of Western Sydney University, Hawkesbury (the shaded area shows Western Sydney University campus).

Figure 2.
Schematic of the column set up to monitor the impact of irrigation water type on the salt accumulation in D33 and Yarramundi soil profile.
Figure 2.
Schematic of the column set up to monitor the impact of irrigation water type on the salt accumulation in D33 and Yarramundi soil profile.

Figure 3.
Cumulative salt mass stored in columns (averaged over the results from three columns) and variation of EC of leachate during the study period using TW, RW, and SW as irrigation water for (a) D33 paddock soil (b) Yarramundi paddock soil.
Figure 3.
Cumulative salt mass stored in columns (averaged over the results from three columns) and variation of EC of leachate during the study period using TW, RW, and SW as irrigation water for (a) D33 paddock soil (b) Yarramundi paddock soil.

Figure 4.
Variation of bulk electrical conductivity at 0.2 m depth measured by GS3 sensor in soil columns using TW, RW, and SW as irrigation water (VWC and ECbulk averaged over a day) for (a) D33 paddock soil (b) Yarramundi paddock soil.
Figure 4.
Variation of bulk electrical conductivity at 0.2 m depth measured by GS3 sensor in soil columns using TW, RW, and SW as irrigation water (VWC and ECbulk averaged over a day) for (a) D33 paddock soil (b) Yarramundi paddock soil.

Figure 5.
Salinity profile in terms of EC1:5 using TW, RW, and SW as irrigation water in (a) D33 paddock soil columns and (b) Yarramundi paddock soil columns after the study period of 330 days. The dotted line shows the initial EC1:5; the error bars show the minimum and maximum value of EC1:5 in columns irrigated with specific irrigation water.

Figure 6.
Salinity profile in terms of ECe using TW, RW, and SW as irrigation water in (a) D33 paddock soil columns and (b) Yarramundi paddock soil columns after the study period of 330 days. The dotted line and error bars show the initial ECe and the minimum and maximum value of ECe, respectively.
Figure 6.
Salinity profile in terms of ECe using TW, RW, and SW as irrigation water in (a) D33 paddock soil columns and (b) Yarramundi paddock soil columns after the study period of 330 days. The dotted line and error bars show the initial ECe and the minimum and maximum value of ECe, respectively.

Figure 7.
Relationships between EC1:5 and ECe for soil samples collected from depths 0 to 0.3 m after 330 days of column study from (a) D33 soil columns for all data (b) D33 soil columns for ECe data ranged between 0 and <10 dS/m and EC1:5 data ranged between 0 and <1.5 dS/m. (c) Yarramundi soil columns for all data (d) Yarramundi soil columns for ECe data ranged between 0 and <10 dS/m and EC1:5 data ranged between 0 and <2.5 dS/m.

Figure 8.
Salinity profile in terms of soluble cations (a–d) using TW, RW, and SW as irrigation water in D33 paddock (a–d) and Yarramundi (e–h) soil columns after the study period of 330 days. The dotted line and error bars show the initial value of cation, and the minimum and maximum values of measured cation, respectively.

Figure 9.
Relationships of concentration of total cation (Csum) with ECe, and concentration of individual cation in the saturated paste extract from soil samples collected from depths 0 to 0.3 m after 330 days of column study from (a) D33 paddock soil columns (b) Yarramundi paddock soil columns.
Figure 9.
Relationships of concentration of total cation (Csum) with ECe, and concentration of individual cation in the saturated paste extract from soil samples collected from depths 0 to 0.3 m after 330 days of column study from (a) D33 paddock soil columns (b) Yarramundi paddock soil columns.


Table 1.
Soil and water analysis method.
| Parameter | Method | Reference |
|---|---|---|
| Mechanical texture of soil | Hydrometer method | [36] |
| Saturated hydraulic conductivity | Constant head method | [37] |
| Electrical conductivity | EC1:5 (Method 3A1) ECe (Method 2D1) | [38] |
| Field bulk density | Method 2A1 | [38] |
| Soluble cations | Method 14H1 | [38] |
| Exchangeable cations | Method 15D3 | [38] |
| Soil pH | Method 4A1 | [38] |
Table 2.
Physico-chemical properties of soil collected from paddocks in the study area.
| Parameter | Measured Value | |
|---|---|---|
| D33 Paddock | Yarramundi Paddock | |
| Soil type | Silty loam | Loamy sand |
| Field moisture content (g/g) | 0.09 ± 0.001 | 0.06 ± 0.001 |
| Field Bulk Density (g/cm3) | 1.62 ± 0.02 | 1.68 ± 0.01 |
| EC1:5 (dS/m) | 0.06 ± 0.001 | 0.03 ± 0.001 |
| ECe (dS/m) | 0.82 ± 0.08 | 0.28 ± 0.01 |
| pH1:5 | 6.01 ± 0.06 | 5.35 ± 0.05 |
| pHSE | 7.16 ± 0.2 | 6.95 ± 0.11 |
| Dissolved cations | ||
| Na+ (mEq/L) | 1.319 | 0.497 |
| Ca2+ (mEq/L) | 0.135 | 0.258 |
| Mg2+ (mEq/L) | 1.406 | 0.158 |
| K+ (mEq/L) | 0.976 | 0.502 |
| Sodium adsorption ratio (SAR) | 1.50 | 1.09 |
| Exchangeable cations | ||
| Na+ (cmolC/kg air dry soil) | 0.055 | 0.001 |
| Ca2+ (cmolC/kg air dry soil) | 1.089 | 0.277 |
| Mg2+ (cmolC/kg air dry soil) | 0.188 | 0.030 |
| K+ (cmolC/kg air dry soil) | 0.046 | 0.047 |
| Cation exchange capacity (CEC) | 1.378 | 0.355 |
Table 3.
Relationships for predicting ECe from measured values of EC1:5 proposed by some researchers.
Publisher’s Note: MDPI stays neutral with regard to jurisdictional claims in published maps and institutional affiliations. |
© 2022 by the authors. Licensee MDPI, Basel, Switzerland. This article is an open access article distributed under the terms and conditions of the Creative Commons Attribution (CC BY) license (https://creativecommons.org/licenses/by/4.0/).
Share and Cite
MDPI and ACS Style
Rahman, M.M.; Shahrivar, A.A.; Hagare, D.; Maheshwari, B. Impact of Recycled Water Irrigation on Soil Salinity and Its Remediation. Soil Syst. 2022, 6, 13. https://0-doi-org.brum.beds.ac.uk/10.3390/soilsystems6010013
AMA Style
Rahman MM, Shahrivar AA, Hagare D, Maheshwari B. Impact of Recycled Water Irrigation on Soil Salinity and Its Remediation. Soil Systems. 2022; 6(1):13. https://0-doi-org.brum.beds.ac.uk/10.3390/soilsystems6010013
Chicago/Turabian StyleRahman, Muhammad Muhitur, Alireza Aghajani Shahrivar, Dharmappa Hagare, and Basant Maheshwari. 2022. "Impact of Recycled Water Irrigation on Soil Salinity and Its Remediation" Soil Systems 6, no. 1: 13. https://0-doi-org.brum.beds.ac.uk/10.3390/soilsystems6010013