Article

The Effect of Manure from Cattle Fed Barley- vs. Corn-Based Diets on Greenhouse Gas Emissions Depends on Soil Type

1
Department of Renewable Resources, Faculty of Agricultural, Life and Environmental Sciences, University of Alberta, 442 Earth Sciences Building, Edmonton, AB T6G 2E3, Canada
2
Agriculture and Agri-Food Canada, Lethbridge Research and Development Centre, 5403 1st Ave. S., Lethbridge, AB T1J 4B1, Canada
*
Author to whom correspondence should be addressed.
Submission received: 31 March 2022 / Revised: 17 May 2022 / Accepted: 18 May 2022 / Published: 21 May 2022

Abstract

:
Efforts to reduce greenhouse gas (GHG) emissions from cattle production have led to modifications of livestock diet composition aimed at reducing CH4 emissions from enteric fermentation. These diet modifications can result in varied manure types that may differentially affect GHG emissions when applied to soil. The purpose of this experiment was to examine the effect of different manure types on GHG emissions. We conducted an incubation experiment, comparing the manure from livestock fed a corn-based diet (CM) to that from livestock fed a traditional barley-based diet (BM). The manures were applied to three soil types (with varied soil fertility and pH) and compared to a control (without manure application). Carbon dioxide (CO2) emissions were greater from CM than from BM across all soil types (29.1 and 14.7 mg CO2-C kg−1, respectively). However, CM resulted in lower N2O emissions relative to BM in the low fertility soil (4.21 and 72.67 μg N2O-N kg−1, respectively) and in lower CH4 emissions relative to BM in the two acidic soils (0.5 and 2.5 μg CH4-C kg−1, respectively). Total GHG emissions (sum of CO2, N2O, and CH4) were similar between CM and BM across all soil types, but CM (unlike BM) had 52–66% lower emissions in the low fertility soil relative to both CM and BM in the high fertility soil. Our study shows that manure and soil type interact to affect GHG emissions and that CM may mitigate N2O emissions relative to BM when applied to low fertility soils.

1. Introduction

Globally, cattle production contributes more greenhouse gas (GHG) emissions than other livestock production systems [1]. In Canada, manure management was the third largest source of GHGs, releasing 7.9 Mt CO2 eq of GHG emissions out of 59 Mt CO2 eq from agricultural practices [2]. The rumen of cattle is characterized by a diverse microbial community that carries out the necessary metabolic activities needed for feed digestion [3,4]. Therefore, the nutrients present in the diet and the ability of cattle to digest and absorb them can vary between feeds, raising the potential for diet manipulation to reduce GHG emissions from livestock [5,6].
While much of the research related to diet manipulation has focused on mitigating enteric methane (CH4) emissions, there is also a need to examine the potential carry-over effects to manure. Because manure is an essential organic fertilizer for many producers, it is critical to evaluate the impact of different cattle diets on soil GHG emissions to ensure that a change in diet made in order to decrease enteric CH4 emissions does not lead to increased GHG emissions from the manure [5,7,8].
In western Canada, the beef cattle industry mainly uses barley grain and silage in background and finishing diets [7,9]. However, there has been a rapid expansion of corn silage production in recent years due to the availability of short-season hybrids and longer growing seasons [6,10]. Barley silage is higher in crude protein concentration (13% versus 8% of dry matter) than in corn silage but contains 5–15% less digestible energy and 30% less starch concentration [9,10,11,12]. Given the economic benefit of this new diet composition, Chibisa and Beauchemin [10] conducted a study and determined that it is possible to include corn in cattle diet without compromising animal performance or carcass quality.
Improving our understanding of amending soil with different manure types will help develop sustainable livestock management strategies. Although several studies [13,14] have investigated the influence of feeding cattle various supplements on manure properties when applied to soil, to our knowledge, no studies have investigated the manure of cattle fed corn diets compared to that of cattle fed barley diets used as a soil amendment. Therefore, the objectives of this incubation experiment were to (i) determine the effect of manure from beef cattle fed barley- or corn-based diets in terms of GHG emissions from various soil types; and (ii) determine the relationships between C and N dynamics and GHG emissions.

2. Materials and Methods

This experiment was carried out as a laboratory incubation with four replications using one of three manure treatments: (1) from cattle fed a corn-silage based backgrounding diet (CM), (2) from cattle fed a barley silage-based diet (BM), or a no-manure control (CK) applied to three soil types [15]: (1) Orthic Black Chernozem (OBC), (2) Dark Brown Chernozem (DBC), and (3) Orthic Gray Luvisol (OGL) in a completely randomized design. The chemical properties of the soil and manure types are provided in Table 1.
The two types of manure were produced from a feedlot study conducted at Agriculture and Agri-Food Canada (AAFC) in Lethbridge, Alberta, Canada, as described by Chibisa and Beauchemin [10]. The 160 cattle were allocated to 16 pens, with 8 cattle pens fed a backgrounding diet consisting of 60% barley silage and the remaining pens fed a backgrounding diet comprised of 90% corn silage (dry matter basis). The concentrate proportion in the diets differed to provide similar digestible energy content, and both diets were formulated to supply approximately 13.5% crude protein (dry matter basis), with canola meal and urea used as protein sources. The cattle were fed their respective backgrounding diets for 105 days. An ionophore feed additive (monensin, 28 mg kg−1 dry matter) was included in all diets. Manure samples for the study were collected near the end of the backgrounding phase from the pen floor (bedding materials were largely avoided). The manure samples used for the incubation were freeze-dried to maintain chemical properties, ensure consistency, and provide a more homogeneous mixture [16].
Samples of the three soil types were collected from 0–15 cm in depth at sites in Alberta, Canada, in late spring 2017. The soils were collected at AAFC’s Beaverlodge Research and Development Centre (54°58′51.1′′ N 117°24′30.7′′ W), Lacombe Research and Development Centre (52°26′49.9′′ N 113°45′23.2′′ W), and Lethbridge Research and Development Centre (49°42′22.4′′ N 112°45′29.2′′ W) for OGL, OBC, and DBC soils, respectively. The OGL, OBC, and DBC soils had a clay loam texture, silty loam texture, and clay loam texture, respectively. The OGL and OBC soils were from fields under cereal–canola production for over 30 years, and the DBC soil was from a field under forage (alfalfa/grass) production. The soils were air-dried at room temperature in the lab and passed through a 2-mm sieve.
To determine moisture content, the soil samples and manure amendment were dried at 105 °C for 48 h [17]. Then, 200 g (dry-weight basis) of soil was placed in each of the 36 (3 manure treatments × 3 soil types × 4 replications) 1 L Mason jars. Each sample was adjusted to 60% water-filled pore space using a 20 mL syringe to distribute deionized water evenly over the soil’s surface inside the Mason jar. Water-filled pore space was calculated as
%   water filled   pore   space = SWC   ×   BD 1 ( BD PD )
where SWC is the soil water content (g g−1), BD is the bulk density (1.00 Mg m−3), and PD is the particle density (2.65 Mg m−3) [18,19,20]. The jars were covered with aluminum foil with four small holes during the incubation (except during the gas sampling procedure, as detailed below) to allow for gas exchange and to minimize water loss.
The soils were pre-incubated for seven days in the incubation chamber at 25 °C [21]. Following the pre-incubation, 16.64 g of manure (dry-weight basis) was added to the soil. At the same time, deionized water was added to bring the soil and manure back to 60% water-filled pore space, and then the Mason jars were placed back into the chamber for the remainder of the 70 day incubation. The amount of manure added was equivalent to the standard field application of 160 Mg ha−1 (dry-weight basis) of organic manure, an amount typical for barley forage production [22]. The water lost from evaporation was replaced weekly to return the samples to the prescribed water-filled pore space. The jars were adjusted to 60% water-filled pore space from day 1 to day 14 and then adjusted to maintain 80% water-filled pore space from day 14 to day 70. We included this change to understand the potential influence of manure amendments on GHG emissions under a range of water content conditions.
Approximately 15 g (air-dried equivalent) of the soil samples were collected to determine the total N, total C, organic carbon (OC), and C/N ratio on days 1, 35, and 70 of the incubation. In addition, another 10 g (air-dried equivalent) of the soil samples were collected for the measurement of available N (NO3-N and NH4+-N). These measurements were performed every three days for the first week, then on a weekly schedule for two weeks, and finally on a bi-weekly basis for the remainder of the study.
For the measurements of available N, the soil samples were extracted with 0.5 M K2SO4 solutions at a 1:5 (w:v) soil-to-extract ratio, shaken at 250 rpm for one hour, and then filtered using Whatman No. 42 filter papers [23,24]. Available N was measured by colorimetric analysis from the filtrate [25]. Soil pH was determined using a pH meter (Thermo Fisher Scientific, Waltham, MA, USA) using a 1:5 ratio of soil:deionized water weight [17]. For soil with pH > 7.2, the inorganic C was removed by treating the soil with 6 M HCl prior to determining the OC content [26,27]. The samples were dried at 70 °C, ground with a mortar and pestle, and analyzed for total C and N concentrations using a dry combustion technique in an automated CN analyzer (Carlo Erba, Milan, Italy) [28].
The gas samples were collected with a 20 mL syringe from each Mason jar and transferred to a pre-evacuated 12 mL exetainer vial (t0). Then, the Mason jar lid was tightly sealed for 24 h, after which gas samples were collected again through a butyl rubber stopper in the jar lid (t24) [17]. This sampling procedure was repeated on days 1, 4, 7, 21, 35, 49, and 70 of incubation. The difference between t24 and t0 was used to calculate the GHG fluxes (equation 2). The CO2, CH4, and N2O concentrations in the samples were measured with a Varian CP-3800 gas chromatograph (Varian, Palo Alto, CA, USA) equipped with a thermal conductivity detector, a flame ionization detector, and an electron capture detector.
Atmospheric CO2, N2O, and CH4 fluxes in mg C kg−1 h−1, μg N kg−1 h−1, and μg C kg−1 h−1 were calculated by comparing the gas density at the standard state to the changes in gas concentrations during the incubation. The flux was calculated as
F l u x = ρ c V 273 K W   t ( 273 K + T )
where   ρ = density at the standard state, c = change in concentration during the incubation (parts per billion by volume (ppbv)), t = incubation time (24 h), W = soil mass (200 g), V = headspace volume in the jar, and T = incubation temperature (25 °C) [29].
Dissolved N2O was calculated according to Moraghan and Buresh [30] and added to the measured N2O flux to determine the total atmospheric N2O flux. The total atmospheric CO2 and CH4 fluxes were represented by the measured CO2 and CH4 fluxes only. The total GHG flux was calculated as the sum of the CO2, N2O, and CH4 fluxes, with the latter two GHGs assessed as CO2-equivalents. Global warming potential coefficients of 265 and 28 were used for N2O and CH4, respectively, to determine CO2-equivalents [31]. The cumulative emissions for each GHG and the total GHG emissions were calculated by summing CO2, N2O, CH4, and the total GHG emissions over the incubation period.
All statistical analyses were performed using R v. 1.1 (R Core Team, 2020), with statistical significance set at α = 0.05 for all tests. The normality of distribution and homoscedasticity were checked with Shapiro and F-tests, respectively, and because these met all assumptions, no transformations were made for these data. For data with non-homogeneous variances, such as N2O, CH4, and total GHG emissions, autoregressive models were used. A two-way ANOVA was used to analyze the effect of soil type, manure type, and their interaction on the cumulative GHG emissions. To determine which comparisons were significant, the data were further analyzed using a Tukey–Kramer test. The relationships between the initial amended and non-amended soil properties (on day 1 of the incubation) and the cumulative GHG emissions were examined using Spearman’s rank correlation.

3. Results and Discussion
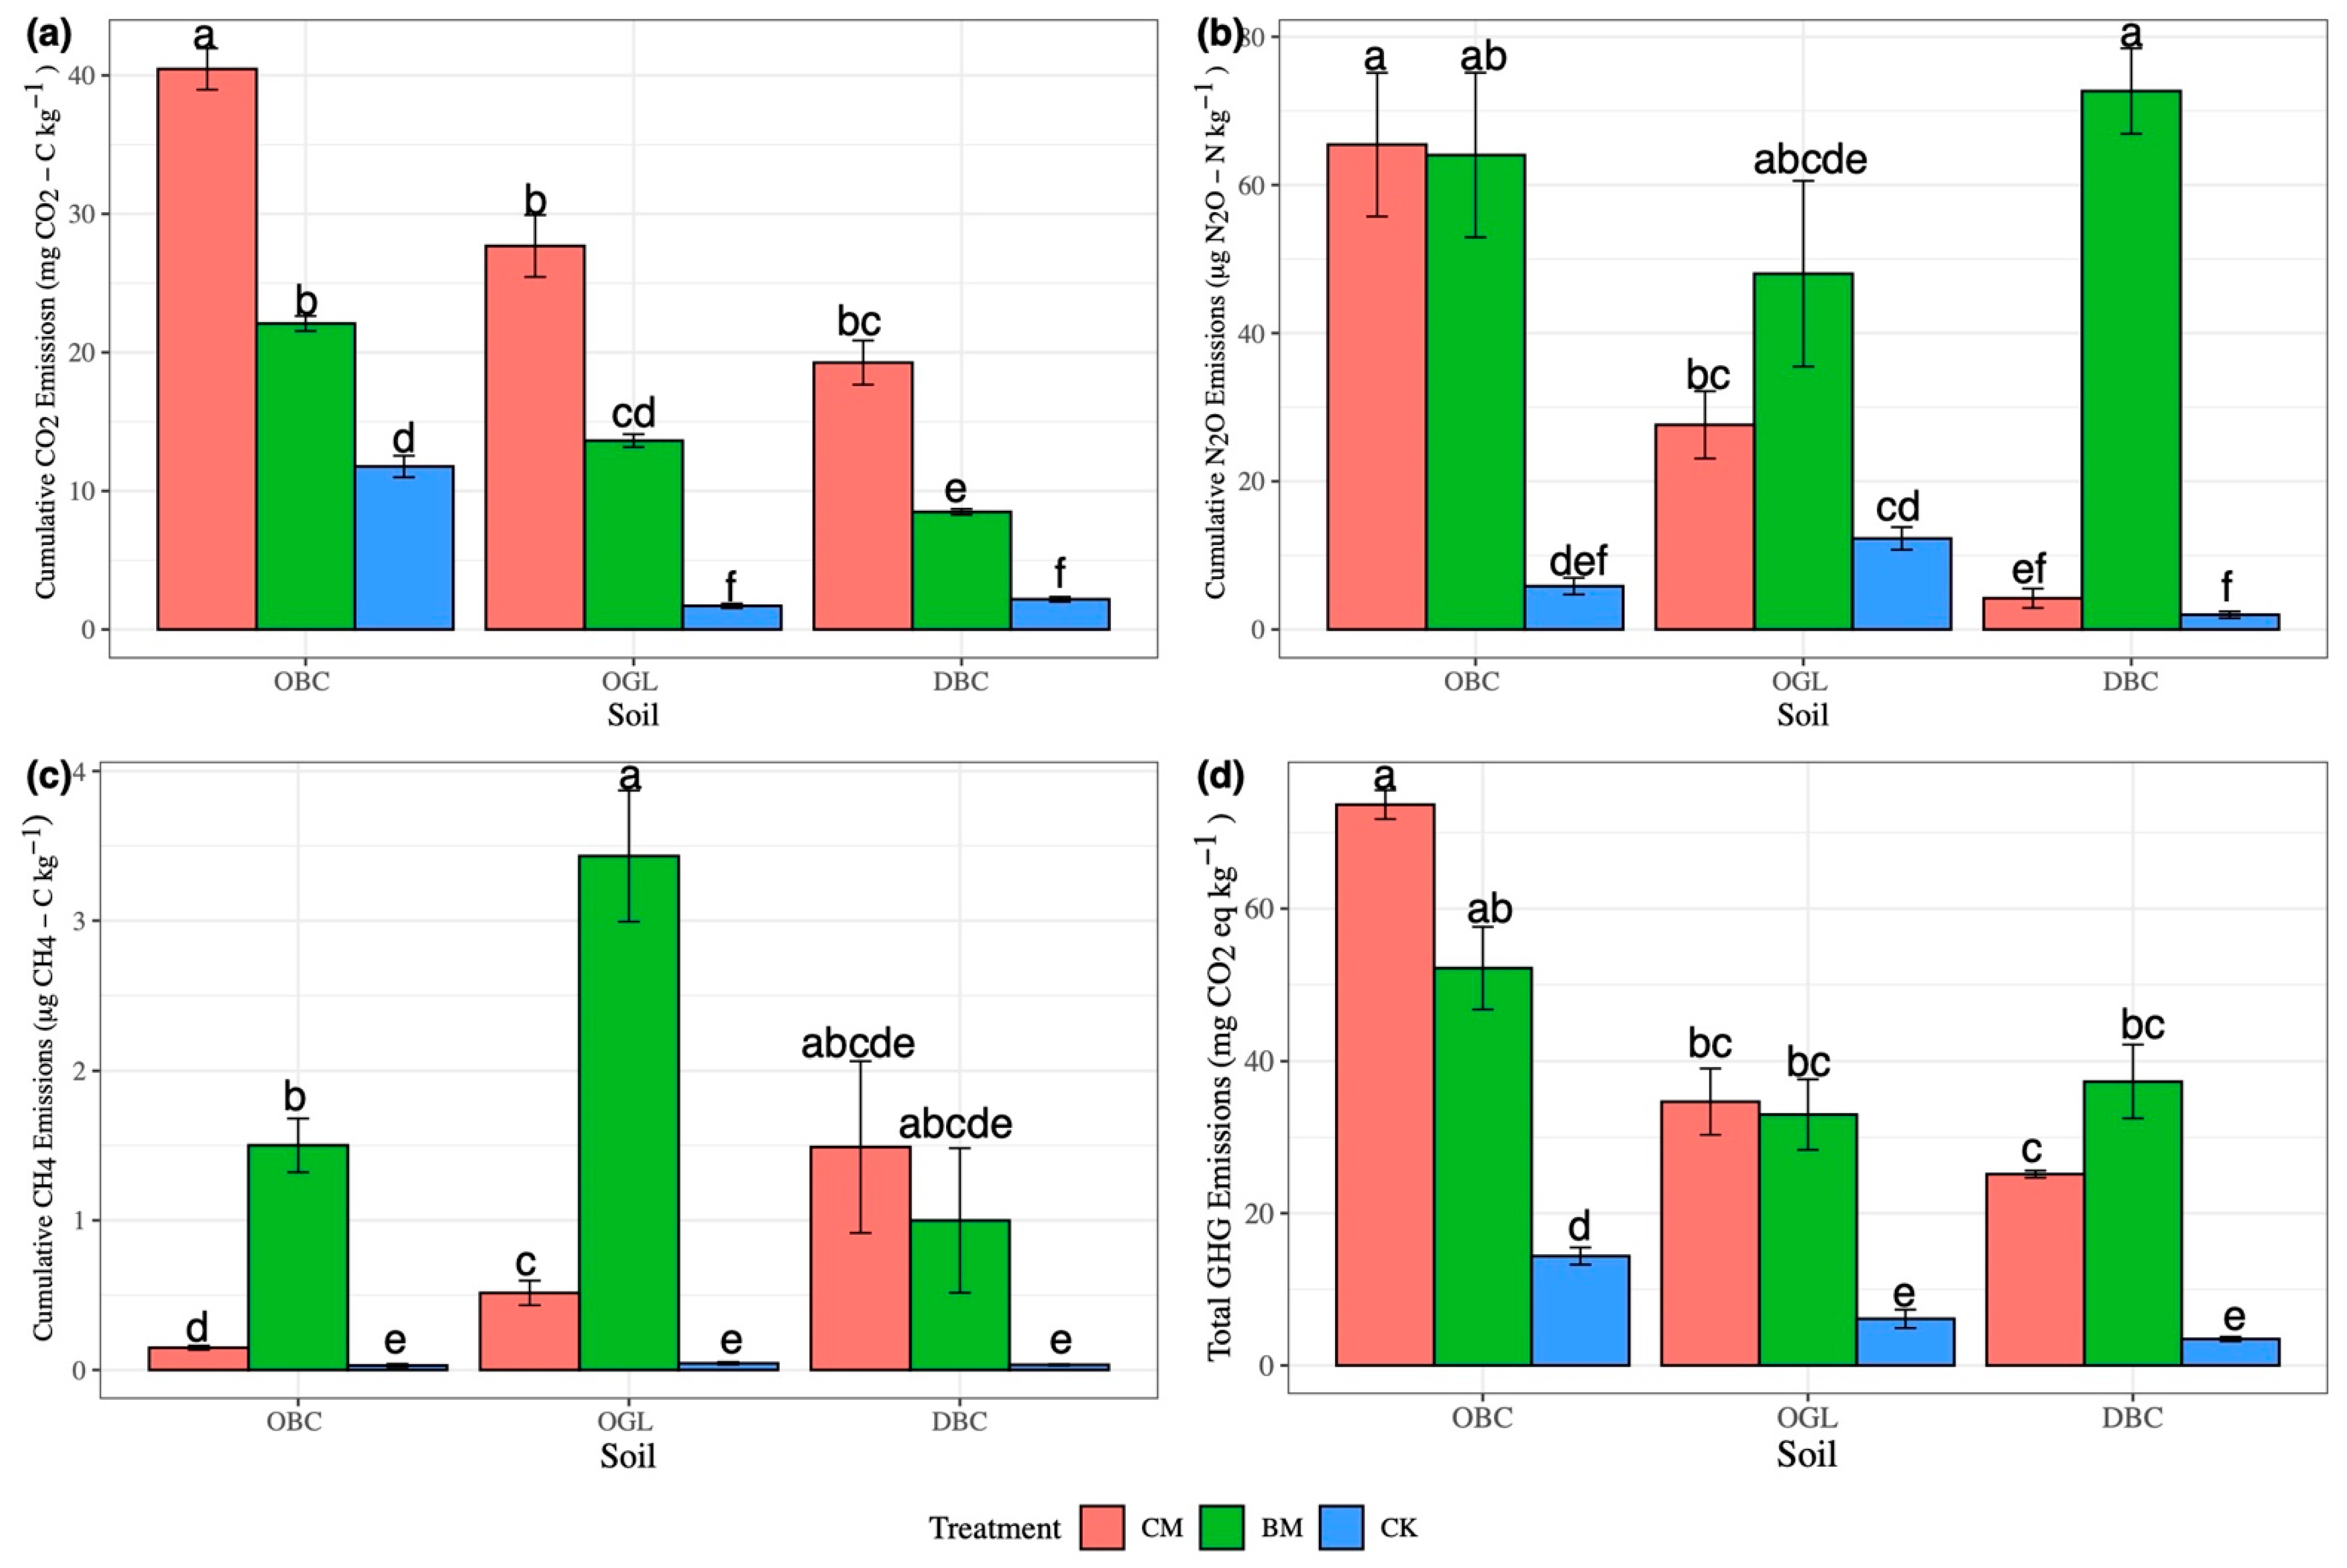
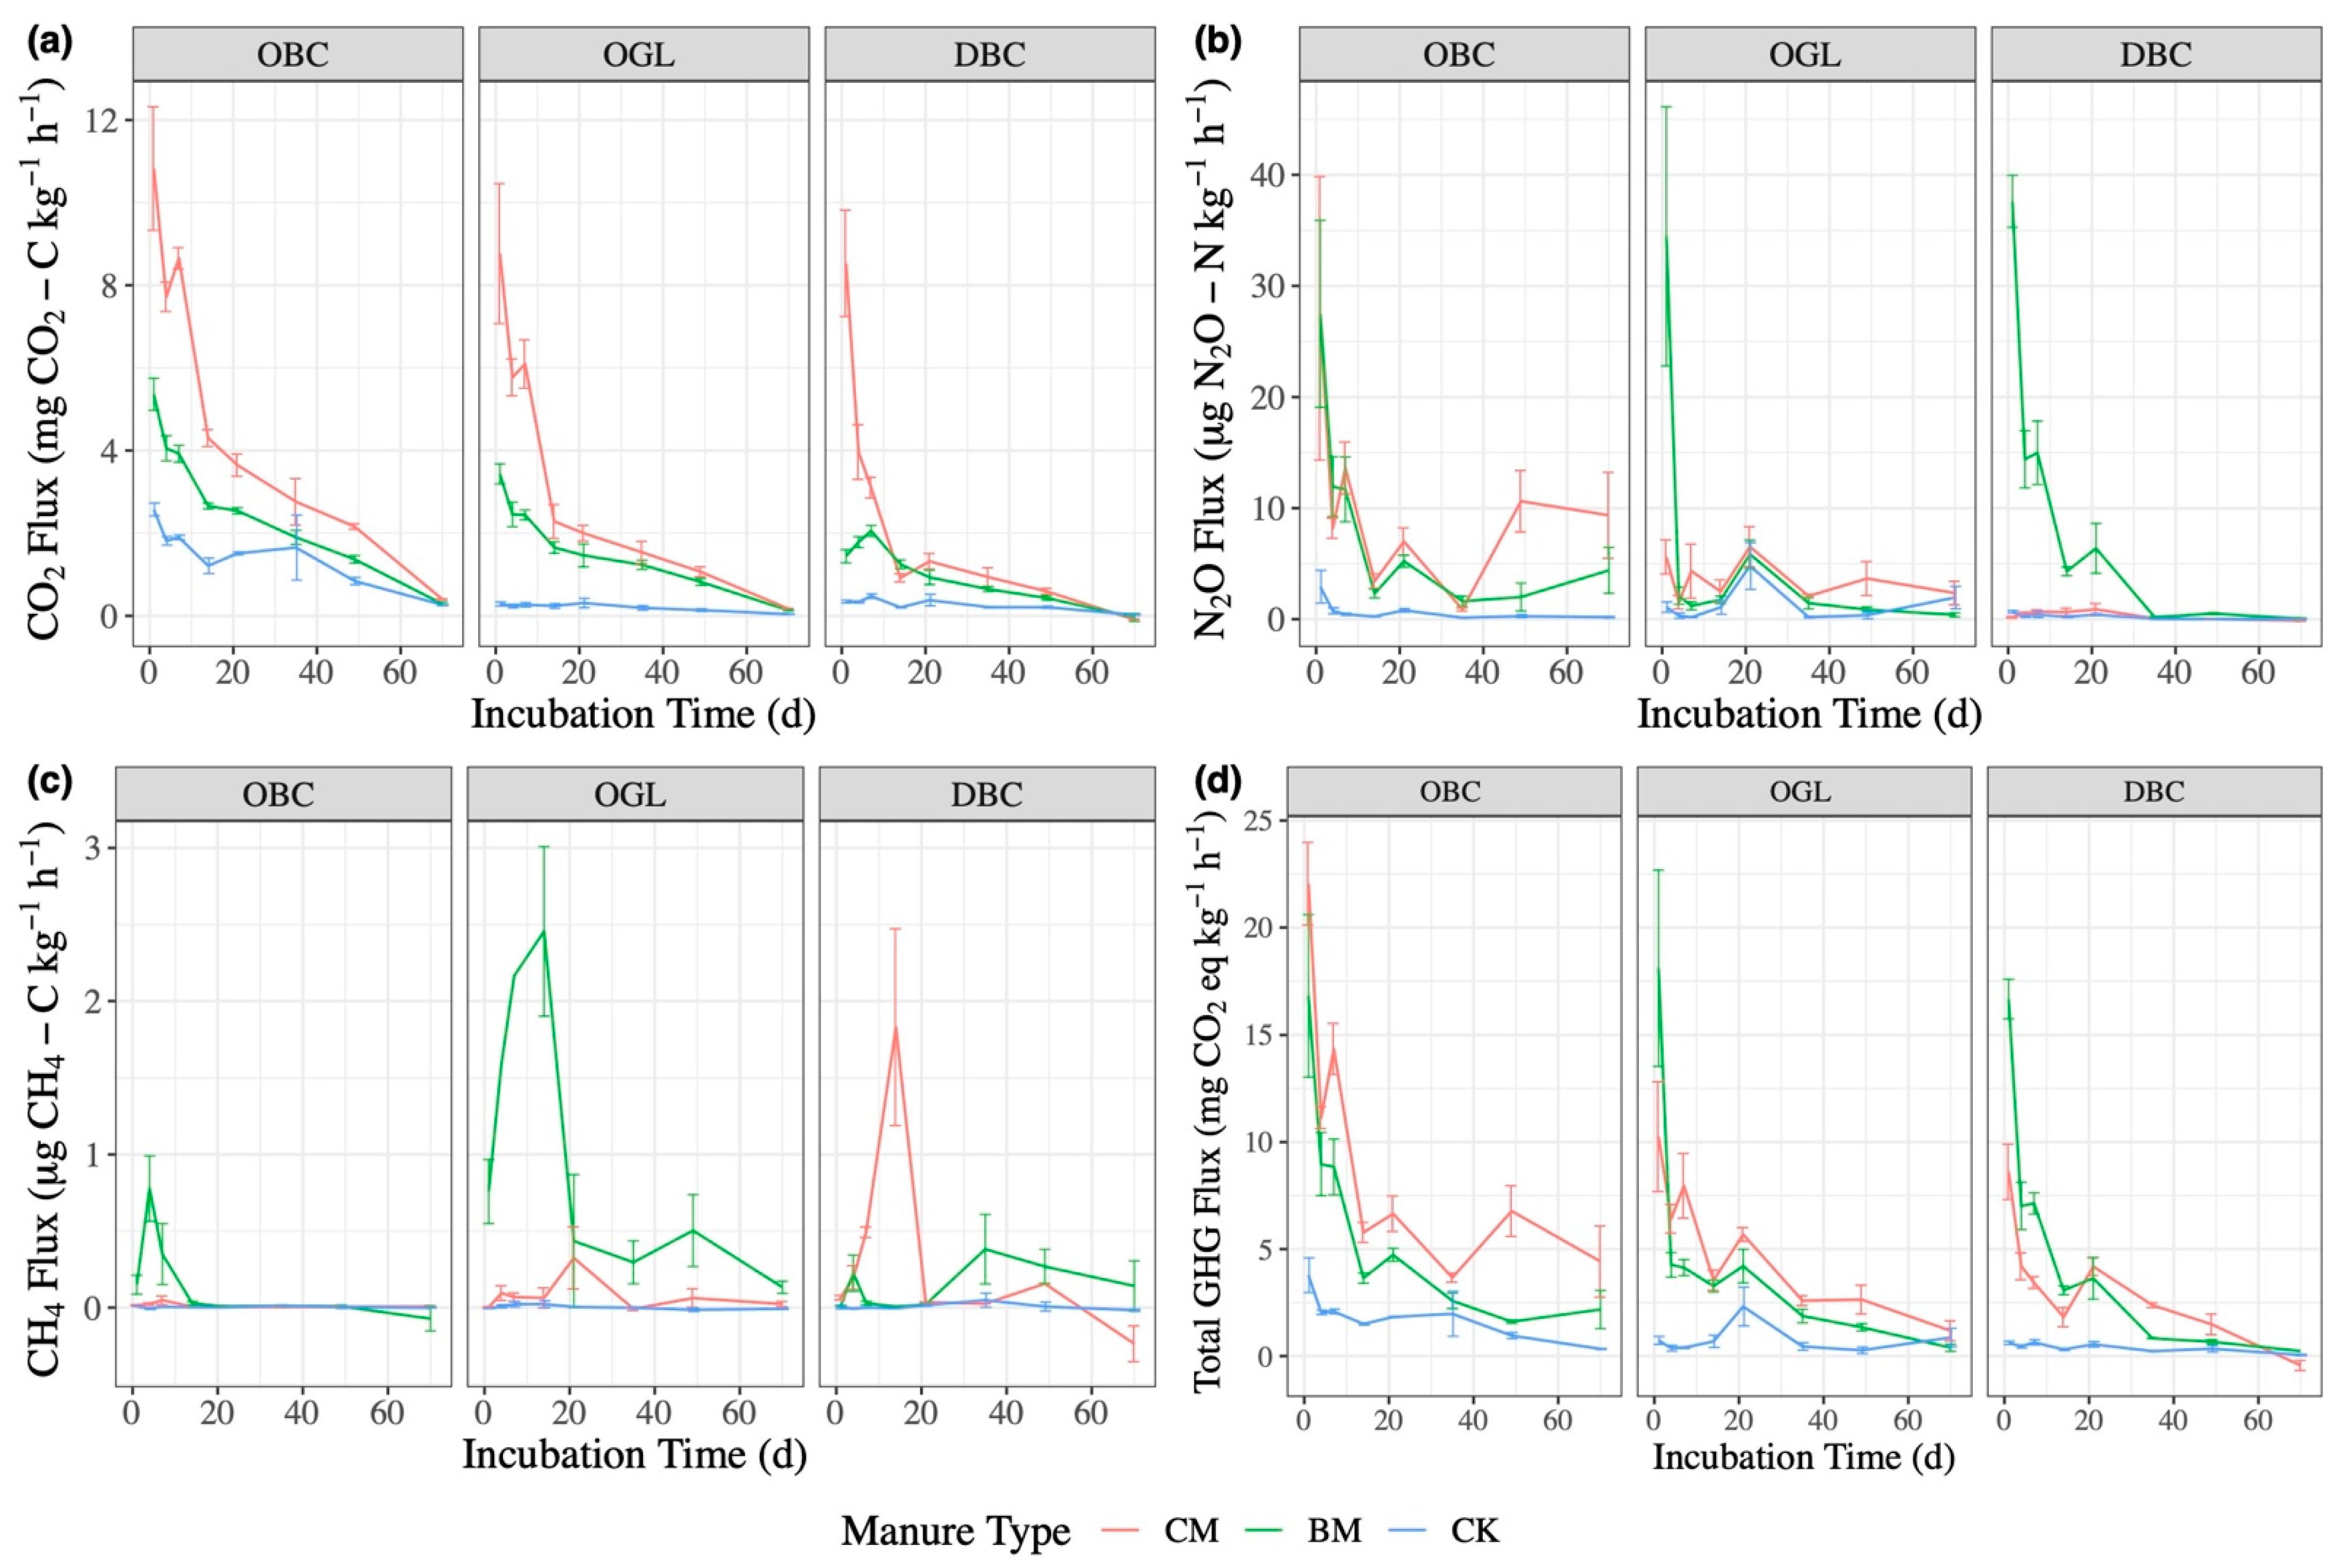
3.1. CO2 Emissions

Soil type showed a significant interaction with diet type for CO2 emissions (p < 0.001; Table 2). CM resulted in greater CO2 emissions (29.13 mg CO2-C kg−1) than BM (14.73 mg CO2-C kg−1) across all soil types (Figure 1a). The initial OC content was greater in CM than in BM in the OBC and OGL soils (Figure 2c), potentially making more OC available for mineralization and releasing greater CO2 emissions from the CM, especially at the beginning of the incubation (Figure 3a). The initial (day 1) OC content and cumulative CO2 emissions were positively related (p = 0.008; Table 3), supporting this scenario. Although the OC content was similar or lower in CM relative to that in BM in the DBC soil (Figure 2c), the initial C/N ratio was substantially greater for CM in this soil (Figure 2b), which may have promoted the mineralization of OC, releasing greater CO2 emissions from the CM [3,16]. Another potential reason for the differences in the CM and BM CO2 emissions is the OC quality and stability in the manures [32,33]. For example, the corn silage diet is less digestible in cattle rumen than the barley silage diet because the corn diet contains less starch concentrate than the barley diet (27% and 35% of dry matter, respectively) [10,12], which may result in different OC qualities in subsequent manure. Future studies should investigate the OC stability of the manures and the effect on microbial communities and activities when applied to the soil.
The OBC soil showed significantly greater CO2 emissions (24.76 mg CO2-C kg−1, on average) than the OGL (14.33 mg CO2-C kg−1, on average) and DBC soil (9.98 mg CO2-C kg−1, on average; Figure 1a), possibly due to the higher OC content of the OBC soil (Table 1 and Figure 2c) that allowed for greater microbial activity [24]. Additionally, the OBC soil had higher available N (Table 1 and Figure 2d) than the other soils, which may have led to priming effects, increasing CO2 emissions [34]. The non-amended soils had less cumulative CO2 emissions than the manure-amended soils (Figure 1a). Because the manure had high OC (Table 1), it added a fresh source of OC that likely resulted in enhanced soil microbial activity and priming effects, increasing CO2 emissions [34,35]. This fresh and labile OC would have declined over time, accounting for the peak in CO2 emissions at the beginning of the incubation and the subsequent decline (Figure 3a). It is also likely that the microbial communities transferred from the livestock digestive tracks to the manure did not survive when applied to the soil due to incompatibility and competition with the soil microbiome and environment, which could have accounted for some of the initial release of CO2 emissions [36]. For the manure-amended soils, the OC and total N contents varied more than expected at the different sampling dates, especially in the OBC soil, for which the OC and total N contents surprisingly increased in the middle of the experiment (Figure 2a,c). This variation is potentially due to the high OC and total N content in the manures and some heterogeneity in the soil–manure mixture.

3.2. N2O Emissions

Soil type showed a significant interaction with diet type for N2O emissions (p < 0.001; Table 2). In the DBC soil, which was the soil with the lowest fertility (in terms of OC and N; Table 1 and Figure 2), CM resulted in lower N2O emissions than BM (4.21 and 72.67 μg N2O-N kg−1, respectively; Figure 1b). This may have been due to differences in the manure amendment properties such as available N (Table 1) and OC quality and their interactions with the soils affecting OC (especially labile OC), total N, and available N (Figure 2). Available N was greater in the BM than in the CM manure (Table 1) as well as generally greater in the BM than in the CM amended soils (Figure 2d). Higher available N in BM relative to CM in the soils with lower fertility (OGL and DBC), especially at the beginning of the incubation (Figure 2d), likely resulted in the high observed N2O emissions across all soils shortly after the BM amendment (Figure 3b) [20]. The initial (day 1) available N and cumulative N2O emissions were positively related (p < 0.001; Table 3), supporting this scenario. The differences in the microbial communities that were present in the manures and their ability to survive in soils of varying fertility would have also differentially affected N2O emissions, especially at the beginning of the incubation [36].
In the OBC soil, the trends and cumulative N2O emissions were similar between the BM and CM amendments and were significantly higher than those from CK (Figure 1b and Figure 3b). Anaerobic microenvironments potentially caused by the addition of manure, as well as increased N availability resulting from mineralization of manure N (especially at the beginning of the incubation), likely promoted denitrification and increased N2O emissions (Figure 2d and Figure 3b) [37]. This is especially true in the OBC soil due to its higher OC and N content (Table 1 and Figure 2), where manure addition may have led to priming effects, increasing the available N through the mineralization of OC and thus N2O emissions [34,37]. Additionally, anaerobic microenvironments were potentially created as labile OC was consumed by the microorganisms, favoring conditions for increased N2O emissions [37]. The initial (day 1) OC content and total N were positively related to the cumulative N2O emissions (p = 0.027 and 0.004; Table 3), supporting this scenario. As a soil with moderate fertility, the OGL manure-amended soils had similar N2O emissions to each other and to CK, with a similar (but non-significant) trend as the low fertility DBC soil (Figure 1b).

3.3. CH4 Emissions

Soil type showed a significant interaction with diet type for CH4 emissions (p < 0.001; Table 2). The barley manure-amended OGL (3.43 μg CH4-C kg−1) and OBC (1.50 μg CH4-C kg−1) soils had higher CH4 emissions than the CM amendments (OGL 0.51 μg CH4-C kg−1 & OBC 0.15 μg CH4-C kg−1) (Figure 1c). Both the OGL and OBC soils were acidic (pH of 4.92 and 5.75, respectively), while the DBC soil was neutral (pH of 7.26) (Table 1). The stress of the acidic environment due to both the slightly lower pH of the CM amendment relative to that of the BM amendment (pH of 8.31 and 8.42, respectively) and the acidic soil may have resulted in the lower CH4 emissions for CM in acidic soils relative to those for BM [38]. Cattle fed corn diets may have lower fecal pH due to the greater post-ruminal fermentation of feed within the digestive tract of the animals compared with those fed barley diets [5,39]. Additionally, the corn diet contained greater neutral detergent fiber than the barely diet (45 and 34% of dry matter, respectively), which could have increased volatile fatty acid production in the cattle hindgut, and methanogenic Archaea is usually hindered under high volatile fatty acid concentrations and low pH [40].
The greatest CH4 emissions came from manure-amended soils, with negligible CH4 emissions from the CK amendments across all soil types (Figure 1c and Figure 3c). Except towards the end of the incubation, the CH4 flux was generally positive (Figure 3c). Because soils act as sinks for CH4 if they are well aerated [8,41,42], the larger positive CH4 fluxes for CM and BM were likely caused by the addition of organic matter sealing the surface of the soil, reducing pore space and corresponding to available oxygen for the microorganisms [24,41]. The general decline in the CH4 fluxes over the duration of the incubation may reflect an initial mass die-off of the microbial communities that were present in the manures [36] or the decomposition of labile OC over time. Additionally, the soil may have become more porous over time, resulting in a decrease in methanogenesis [24]. A lack of consistent change in the CH4 fluxes across soil types and treatments after the water-filled pore space change at day 14 from 60 to 80% suggests that the water content change did not meaningfully affect microbial communities or activity. Although aerobic conditions are present in up to 60% of water-filled pore space, manure addition may have changed this to a lower boundary [37], reducing aeration and resulting in the observed higher positive CH4 fluxes from the manure-amended soils from days 1 through 14 (Figure 3c). Increased CH4 emissions from manure-amended soils due to reduced aeration should be directly tested in future field trials, especially as we face increased precipitation events due to climate change [31].

3.4. Total GHG Emissions

Soil type showed a significant interaction with diet type for the total GHG emissions (sum of CO2, N2O, and CH4, with the latter two GHGs assessed as CO2-equivalents) (p < 0.001; Table 2). The total GHG emissions were primarily driven by the CO2 and N2O emissions, with only a minor role played by the CH4 emissions (Figure 1 and Figure 3). The total GHG emissions were similar between CM and BM across all soil types, while the total GHG emissions were consistently lowest for CK (Figure 1d). However, unlike BM, CM had 52–66% lower total GHG emissions in the DBC (low fertility) soil relative to both CM and BM in the OBC (high fertility) soil (Figure 1d). The total GHG emissions were highest for CM and CK in the OBC (high fertility) soil (Figure 1d). The greater effect of soil fertility on the total GHG emissions from CM relative to BM may have been due to differences in the manure amendment microbial communities and properties such as available N and pH (Table 1), as well as OC quality and their interactions with the different soils affecting microbial communities and activity.

4. Conclusions

The effect of cattle diet type on the GHG emissions from manure-amended soil was dependent on soil type. The cattle fed corn silage-based rather than barley silage-based backgrounding diets generated increased CO2 emissions but reduced CH4 (in acidic soils) and N2O (in the soil with the lowest fertility) emissions. Given the rapid expansion of corn silage production and the economic benefit of this relatively new diet composition for cattle in western Canada, these findings provide important insight into the potential effect of the next stage in the life cycle of a corn-based diet on GHG emissions. Our results suggest that the manure from cattle fed a corn-based diet may be able to mitigate N2O emissions relative to the manure from cattle fed a barley-based diet when applied to low fertility soils. Applying the manure from cattle fed a corn-based diet to low fertility soils also appears to be advantageous for reducing the total GHG emissions relative to applying the manure from cattle fed corn- or barley-based diets to high fertility soils. Further research, including field studies and life cycle analyses, is needed to assess the best management practices related to the use of the manure from cattle fed corn-based diets as a soil amendment.

Author Contributions

Conceptualization and methodology: X.H. and S.X.C.; investigation and writing—original draft: T.L.W.; interpretation and writing: C.D.G.; editing: C.D.G., T.L.W., K.A.B., and S.X.C.; resources and supervision, X.H. and S.X.C. All authors have read and agreed to the published version of the manuscript.

Funding

This study was financially supported by Agriculture and Agri-Food Canada, the Canadian Beef Cattle Research Council, the Natural Science and Engineering Research Council of Canada (NSERC), and the University of Alberta.

Institutional Review Board Statement

Not applicable.

Informed Consent Statement

Not applicable.

Data Availability Statement

The data are contained within the article.

Acknowledgments

The authors would like to thank Peter Blenis and Jaime Pinzon for their assistance with the statistical analyses, as well as Carmen Roman-Perez for her feedback.

Conflicts of Interest

The authors declare no conflict of interest. The funders had no role in the design of the study; in the collection, analyses, or interpretation of data; in the writing of the manuscript; or in the decision to publish the results.

References

  1. De Vries, M.; de Boer, I.J.M. Comparing Environmental Impacts for Livestock Products: A Review of Life Cycle Assessments. Livest. Sci. 2010, 128, 1–11. [Google Scholar] [CrossRef]
  2. Environment and Climate Change Canada National Inventory Report 1990–2018: Greenhouse Gas Sources and Sinks in Canada: Executive Summary; Environment and Climate Change Canada: Gatineau, QC, Canada, 2020.
  3. Van Vliet, P.C.J.; Reijs, J.W.; Bloem, J.; Dijkstra, J.; de Goede, R.G.M. Effects of Cow Diet on the Microbial Community and Organic Matter and Nitrogen Content of Feces. J. Dairy Sci. 2007, 90, 5146–5158. [Google Scholar] [CrossRef] [PubMed] [Green Version]
  4. Ozbayram, E.; Ince, O.; Ince, B.; Harms, H.; Kleinsteuber, S. Comparison of Rumen and Manure Microbiomes and Implications for the Inoculation of Anaerobic Digesters. Microorganisms 2018, 6, 15. [Google Scholar] [CrossRef] [PubMed] [Green Version]
  5. Spicer, L.A.; Theurer, C.B.; Sowe, J.; Noon, T.H. Ruminal and Post-Ruminal Utilization of Nitrogen and Starch from Sorghum Grain-, Corn- and Barley-Based Diets by Beef Steers. J. Anim. Sci. 1986, 62, 521–530. [Google Scholar] [CrossRef]
  6. Guyader, J.; Baron, V.; Beauchemin, K. Corn Forage Yield and Quality for Silage in Short Growing Season Areas of the Canadian Prairies. Agronomy 2018, 8, 164. [Google Scholar] [CrossRef] [Green Version]
  7. Beauchemin, K.A.; McGinn, S.M. Methane Emissions from Feedlot Cattle Fed Barley or Corn Diets. J. Anim. Sci. 2005, 83, 653–661. [Google Scholar] [CrossRef] [Green Version]
  8. Eckard, R.J.; Grainger, C.; de Klein, C.A.M. Options for the Abatement of Methane and Nitrous Oxide from Ruminant Production: A Review. Livest. Sci. 2010, 130, 47–56. [Google Scholar] [CrossRef]
  9. Hassanat, F.; Gervais, R.; Massé, D.I.; Petit, H.V.; Benchaar, C. Methane Production, Nutrient Digestion, Ruminal Fermentation, N Balance, and Milk Production of Cows Fed Timothy Silage- or Alfalfa Silage-Based Diets. J. Dairy Sci. 2014, 97, 6463–6474. [Google Scholar] [CrossRef]
  10. Chibisa, G.E.; Beauchemin, K.A. Effects of Feeding Corn Silage from Short-Season Hybrids and Extending the Backgrounding Period on Production Performance and Carcass Traits of Beef Cattle. J. Anim. Sci. 2018, 96, 2490–2503. [Google Scholar] [CrossRef]
  11. Hunt, C.W. Factors Affecting the Feeding Quality of Barley for Ruminants. Anim. Feed Sci. Technol. 1996, 62, 37–48. [Google Scholar] [CrossRef]
  12. Gibb, D.J.; McAllister, T.A. Corn Compared to Barley in Feedlot Diets. In Proceedings of the 3rd Canadian Barley Symposium, Red Deer, AB, Canada, 19–20 June 2003. [Google Scholar]
  13. Weber, T.L.; Hao, X.; Gross, C.D.; Beauchemin, K.A.; Chang, S.X. Effect of Manure from Cattle Fed 3-Nitrooxypropanol on Anthropogenic Greenhouse Gas Emissions Depends on Soil Type. Agronomy 2021, 11, 371. [Google Scholar] [CrossRef]
  14. Romero, C.M.; Redman, A.-A.P.H.; Terry, S.A.; Hazendonk, P.; Hao, X.; McAllister, T.A.; Okine, E. Molecular Speciation and Aromaticity of Biochar-Manure: Insights from Elemental, Stable Isotope and Solid-State DPMAS 13C NMR Analyses. J. Environ. Manag. 2021, 280, 111705. [Google Scholar] [CrossRef] [PubMed]
  15. Soil Classification Working Group. The Canadian System of Soil Classification; Agriculture and Agri-Food Canada Publication: Ottowa, ON, Canada, 1998; ISBN 0-660-17404-9.
  16. Calderón, F.J.; McCarty, G.W.; Van Kessel, J.A.S.; Reeves, J.B. Carbon and Nitrogen Dynamics during Incubation of Manured Soil. Soil Sci. Soc. Am. J. 2004, 68, 1592–1599. [Google Scholar] [CrossRef]
  17. Cai, Y.; Chang, S.X.; Ma, B.; Bork, E.W. Watering Increased DOC Concentration but Decreased N2O Emission from a Mixed Grassland Soil under Different Defoliation Regimes. Biol. Fertil. Soils 2016, 52, 987–996. [Google Scholar] [CrossRef]
  18. Jones, C.A. Effect of Soil Texture on Critical Bulk Densities for Root Growth. Soil Sci. Soc. Am. J. 1983, 47, 1208–1211. [Google Scholar] [CrossRef]
  19. Franzluebbers, A.J. Microbial Activity in Response to Water-Filled Pore Space of Variably Eroded Southern Piedmont Soils. Appl. Soil Ecol. 1999, 11, 91–101. [Google Scholar] [CrossRef]
  20. Li, P.; Lang, M.; Li, C.; Hao, X. Nitrous Oxide and Carbon Dioxide Emissions from Soils Amended with Compost and Manure from Cattle Fed Diets Containing Wheat Dried Distillers’ Grains with Solubles. Can. J. Soil Sci. 2016, 97, 522–531. [Google Scholar] [CrossRef] [Green Version]
  21. Murphy, D.V.; Recous, S.; Stockdale, E.A.; Fillery, I.R.P.; Jensen, L.S.; Hatch, D.J.; Goulding, K.W.T. Gross Nitrogen Fluxes in Soil: Theory, Measurement and Application of 15N Pool Dilution Techniques. In Advances in Agronomy; Elsevier: Amsterdam, The Netherlands, 2003; Volume 79, pp. 69–118. [Google Scholar]
  22. Sadeghpour, A.; Ketterings, Q.M.; Vermeylen, F.; Godwin, G.S.; Czymmek, K.J. Soil Properties under Nitrogen- vs. Phosphorus-Based Manure and Compost Management of Corn. Soil Sci. Soc. Am. J. 2016, 80, 185–195. [Google Scholar] [CrossRef] [Green Version]
  23. Vance, E.D.; Brookes, P.C.; Jenkinson, D.S. An Extraction Method for Measuring Soil Microbial Biomass C. Soil Biol. Biochem. 1987, 19, 703–707. [Google Scholar] [CrossRef]
  24. Pattey, E.; Trzcinski, M.K.; Desjardins, R.L. Quantifying the Reduction of Greenhouse Gas Emissions as a Result of Composting Dairy and Beef Cattle Manure. Nutr. Cycl. Agroecosystems 2005, 72, 173–187. [Google Scholar] [CrossRef]
  25. Norman, A.G.; Bremner, J.M. Inorganic Forms of Nitrogen. In Methods of Soil Analysis. Part 2: Chemical and Microbiological Properties; Soil Science Society of America and American Society of Agronomy: Madison, WI, USA, 1965; pp. 672–676. ISBN 978-0-89118-204-7. [Google Scholar]
  26. Ramnarine, R.; Voroney, R.P.; Wagner-Riddle, C.; Dunfield, K.E. Carbonate Removal by Acid Fumigation for Measuring the δ13C of Soil Organic Carbon. Can. J. Soil Sci. 2011, 91, 247–250. [Google Scholar] [CrossRef] [Green Version]
  27. Premrov, A.; Cummins, T.; Byrne, K.A. Bulk-Density Modelling Using Optimal Power-Transformation of Measured Physical and Chemical Soil Parameters. Geoderma 2018, 314, 205–220. [Google Scholar] [CrossRef]
  28. Bremner, J.M. Total Nitrogen. In Methods of Soil Analysis. Part 2. Chemical and Microbiological Properties Soil Analysis; Soil Science Society of America and American Society of Agronomy: Madison, WI, USA, 1965; pp. 1149–1178. [Google Scholar]
  29. Van Zwieten, L.; Kimber, S.A.; Morris, S.A.; Downie, A.B.; Berger, E.A.; Rust, J.A.; Scheer, C.D. Influence of Biochars on Flux of N2O and CO2 from Ferrosol. Aust. J. Soil Res. 2010, 48, 555–568. [Google Scholar] [CrossRef]
  30. Moraghan, J.T.; Buresh, R. Correction for Dissolved Nitrous Oxide in Nitrogen Studies. Soil Sci. Soc. Am. J. 1977, 41, 1201–1202. [Google Scholar] [CrossRef]
  31. IPCC. Climate Change 2014: Synthesis Report. Contribution of Working Groups I, II and III to the Fifth Assessment Report of the Intergovernmental Panel on Climate Change; IPCC: Geneva, Switzerland, 2014; ISBN 92-9169-113-5. [Google Scholar]
  32. Hwang, H.Y.; Kim, S.H.; Kim, M.S.; Park, S.J.; Lee, C.H. Co-Composting of Chicken Manure with Organic Wastes: Characterization of Gases Emissions and Compost Quality. Appl. Biol. Chem. 2020, 63, 3. [Google Scholar] [CrossRef]
  33. Shakoor, A.; Shakoor, S.; Rehman, A.; Ashraf, F.; Abdullah, M.; Shahzad, S.M.; Farooq, T.H.; Ashraf, M.; Manzoor, M.A.; Altaf, M.M.; et al. Effect of Animal Manure, Crop Type, Climate Zone, and Soil Attributes on Greenhouse Gas Emissions from Agricultural Soils—A Global Meta-Analysis. J. Clean. Prod. 2021, 278, 124019. [Google Scholar] [CrossRef]
  34. Kuzyakov, Y.; Friedel, J.K.; Stahr, K. Review of Mechanisms and Quantification of Priming Effects. Soil Biol. Biochem. 2000, 32, 1485–1498. [Google Scholar] [CrossRef]
  35. Gregorich, E.G.; Rochette, P.; McGuire, S.; Liang, B.C.; Lessard, R. Soluble Organic Carbon and Carbon Dioxide Fluxes in Maize Fields Receiving Spring-Applied Manure. J. Environ. Qual. 1998, 27, 209–214. [Google Scholar] [CrossRef]
  36. Coelho, J.J.; Hennessy, A.; Casey, I.; Bragança, C.R.S.; Woodcock, T.; Kennedy, N. Biofertilisation with Anaerobic Digestates: A Field Study of Effects on Soil Microbial Abundance and Diversity. Appl. Soil Ecol. 2020, 147, 103403. [Google Scholar] [CrossRef]
  37. Roman-Perez, C.C.; Hernandez-Ramirez, G. Nitrous Oxide Production and Nitrogen Transformations in a Soil Amended with Biosolids. Can. J. Soil Sci. 2021, 1–14. [Google Scholar] [CrossRef]
  38. Domsch, K.H.; Anderson, T.-H. The Metabolic Quotient for CO2 (QCO2) as a Specific Activity Parameter to Assess the Effects of Environmental Conditions, Such as pH, on the Microbial Biomass of Forest Soils. Soil Biol. Biochem. 1993, 25, 393–395. [Google Scholar] [CrossRef]
  39. Ørskov, E.R. Starch Digestion and Utilization in Ruminants. J. Anim. Sci. 1986, 63, 1624–1633. [Google Scholar] [CrossRef] [PubMed]
  40. Staley, B.F.; de los Reyes, F.L.; Barlaz, M.A. Effect of Spatial Differences in Microbial Activity, pH, and Substrate Levels on Methanogenesis Initiation in Refuse. Appl. Environ. Microbiol. 2011, 77, 2381–2391. [Google Scholar] [CrossRef] [PubMed] [Green Version]
  41. Sampanpanish, P. Effect of Organic Fertilizer on CO2, CH4 and N2O Emissions in a Paddy Field. Mod. Appl. Sci. 2012, 6, 239. [Google Scholar] [CrossRef]
  42. Thangarajan, R.; Bolan, N.S.; Tian, G.; Naidu, R.; Kunhikrishnan, A. Role of Organic Amendment Application on Greenhouse Gas Emission from Soil. Sci. Total Environ. 2013, 465, 72–96. [Google Scholar] [CrossRef] [PubMed]
Figure 1. Effects of manure type on cumulative (a) CO2, (b) N2O, (c) CH4, and on (d) total GHG emissions (sum of CO2, N2O, and CH4) across three soil types. Soil type: OBC, Orthic Black Chernozem; OGL, Orthic Gray Luvisol; and DBC, Dark Brown Chernozem. Manure type: CM, manure from cattle fed a corn silage-based backgrounding diet; BM, manure from cattle fed a barley silage-based backgrounding diet; and CK, control (soil without amendments). The letters denote significant differences across soils and treatments, with columns that do not share the same letter being significantly different from each other (α = 0.05). Vertical bars indicate standard errors of the means (n = 4).
Soilsystems 06 00047 g001
Figure 2. Effects of manure type on (a) total nitrogen (N), (b) carbon (C) to N ratio, (c) organic C, and (d) available N across three soil types throughout the incubation. Soil type: OBC, Orthic Black Chernozem; OGL, Orthic Gray Luvisol; and DBC, Dark Brown Chernozem. Manure type: CM, manure from cattle fed a corn silage-based backgrounding diet; BM, manure from cattle fed a barley silage-based backgrounding diet; and CK, control (soil without amendments). Vertical bars indicate standard errors of the means (n = 4).
Soilsystems 06 00047 g002
Figure 3. Effects of manure type on (a) CO2, (b) N2O, (c) CH4, and (d) total GHG fluxes (sum of CO2, N2O, and CH4) across three soil types throughout the incubation. Soil type: OBC, Orthic Black Chernozem; OGL, Orthic Gray Luvisol; and DBC, Dark Brown Chernozem. Manure type: CM, manure from cattle fed a corn silage-based backgrounding diet; BM, manure from cattle fed a barley silage-based backgrounding diet; and CK, control (soil without amendments). Vertical bars indicate standard errors of the means (n = 4).
Soilsystems 06 00047 g003
Table 1. Chemical properties of the soil and manure types used in the incubations (means ± SE) (n = 3).
ParameterpH **TNOCC/NAN
(g kg−1)(g kg−1) (mg kg−1)
Manure Type *
CM8.31 ± 0.0217.0 ± 2.39238 ± 33.414.1 ± 0.6151.6 ± 0.53
BM8.42 ± 0.0118.2 ± 0.20247 ± 14.913.6 ± 0.7054.9 ± 0.71
Soil Type
OBC5.75 ± 0.055.05 ± 0.2261.6 ± 2.9412.2 ± 0.0614.93 ± 0.59
OGL4.92 ± 0.022.29 ± 0.0832.9 ± 1.3514.4 ± 0.308.71 ± 0.34
DBC7.26 ± 0.031.51 ± 0.0618.0 ± 0.5815.9 ± 0.289.85 ± 0.54
Note: Abbreviations: AN, available nitrogen; TN, total nitrogen; OC, organic carbon. Soil type: DBC, Dark Brown Chernozem; OBC, Orthic Black Chernozem; OGL, Orthic Gray Luvisol. Manure type: BM, manure from cattle fed a barley silage-based backgrounding diet; CM, manure from cattle fed a corn silage-based backgrounding diet.* TN, OC, and AN are expressed on a dry-matter basis. ** Soil pH was measured in a 1:5 soil:water ratio.
Table 2. Results of two-way ANOVAs (p-values) testing the effects of manure type (M), soil type (S), and their interactions (S x M) on cumulative greenhouse gas (GHG) emissions (n = 4).
Source of VariationSMS × M
CO2 emissions<0.001<0.001<0.001
N2O emissions<0.001<0.001<0.001
CH4 emissions0.155<0.001<0.001
Total GHG emissions (sum of CO2, N2O, and CH4)<0.001<0.001<0.001
Table 3. Spearman’s rank correlation coefficients of relationships between the cumulative CO2, N2O, and CH4 emissions and the initial amended and non-amended soil properties across the three soils (on day 1 of the incubation) (n = 12). * p < 0.05; ** p < 0.01; *** p < 0.001.
VariableTotal NitrogenCarbon/NitrogenOrganic CarbonAvailable Nitrogen
CO20.59 **−0.52 *0.57 **0.42 *
N2O0.61 **−0.200.49 *0.76 ***
CH40.10−0.250.070.62 **
Publisher’s Note: MDPI stays neutral with regard to jurisdictional claims in published maps and institutional affiliations.

