
Three-Phase State Estimation for Distribution-Grid Analytics


Department of Energy Technology, Aalborg University, 9220 Aalborg, Denmark
*
Author to whom correspondence should be addressed.
Clean Technol. 2021, 3(2), 395-408; https://0-doi-org.brum.beds.ac.uk/10.3390/cleantechnol3020022
Submission received: 19 February 2021
/
Revised: 19 March 2021
/
Accepted: 2 April 2021
/
Published: 1 May 2021
(This article belongs to the Special Issue Smart Grid Technologies)
Abstract
:Power-distribution grids consist of assets such as transformers, cables, and switches, of which the proper utilization is essential for the provision of a secure and reliable power supply to end customers. Distribution-system operators (DSOs) are responsible for the operation and maintenance of these assets. Due to the increased use of renewable sources such as wind and solar, grid assets are prone to operation conditions outside safe boundaries, such as overloading, large voltage unbalance, and a rise in voltage. At present, distribution grids are poorly monitored by DSOs, and the above-mentioned problems may thereby go unnoticed until the failure of a critical asset occurs. The deployment of smart meters in distribution grids has enabled measurements of grid variables such as power, current, and voltage. However, their measurements are used only for billing purposes, and not for monitoring and improving the operating condition of distribution grids. In this paper, a state-estimation algorithm is proposed that utilizes smart-meter data for offline analysis, and estimates the loading of grid assets and power losses. Single- and three-phase state-estimation algorithms are compared through simulation studies on a real-life low-voltage distribution grid using measured smart-meter data. The three-phase state-estimation algorithm based on the nonlinear weighted least-squares method was found to be more accurate in estimating cable loading and line power losses. The proposed method is useful for DSOs to analyze power flows in their distribution grids and take necessary actions such as grid upgrades or the rerouting of power flows.
1. Introduction
In electric power systems, distribution grids play a major role in supplying electricity to end customers. The responsible entities for their operation and management are distribution-grid operators (DSOs). The increasing rate of the integration of renewable-source-based power generators, which have a distributed nature, caused a major change in the operation of distribution grids [1]. From a passive, unidirectional power-consumption mode, distribution grids are becoming active due to the presence of photovoltaic (PV), wind, and electric vehicles [2]. Due to the integration of renewable sources, distribution grids are experiencing unprecedented challenges such as voltage rise, reverse power flows, and the short-term overloading of cables and transformers. Inverter-based renewable-power generation and nonlinear loads present at distribution grids may increase harmonic distortion to unacceptable levels, which can increase grid power losses. Higher-order current harmonics are the main source of capacitive cable losses. The impact of harmonics on grid power losses was assessed in [3]. The presence of harmonics can have destructive impact on grid components, including distribution transformers. A study on the impact of grid harmonics on a substation transformer can be found in [4]. Monitoring and automation functionalities in distribution grids, especially at low-voltage (LV) grids, are very limited at present. A typical small or medium-sized DSO has more than 2000 secondary substations spread over a large geographical area. Grid assets, including substation transformers and cables, are not monitored on a regular basis due to a lack of adequate measurement infrastructures. DSO personnel typically carry out breakdown maintenance in the case of cable failures, short circuits, or the tripping of circuit breakers. However, due to the aforementioned green-energy transition in distribution grids, advanced asset-management techniques based on data analytics are required to maintain the reliability of a power supply.
The high penetration of renewable sources in distribution grids may cause grid congestion [5,6]. For example, power outputs from PV systems may overload a few cables and cause overvoltages for a short period of time, especially during noon when PV generation is at its peak, and load consumption is low [7,8]. Short-term congestion may go unnoticed if grid power flows are not continuously monitored, and proper control measures are not undertaken [9]. Grid assets that are operated under stressed conditions may prematurely fail, leading to an increase in DSO operating expenditure. Several countries realized that the implementation of smart grids is the cornerstone of the green-energy transition leading to a low-carbon economy [10]. The implementation of advanced energy-management systems by DSOs requires the continuous monitoring of grid assets and their better utilization [11,12]. At present, DSOs are not fully aware of grid power losses and the loading of grid assets such as cables and substation transformers. Typically, DSOs approximately compute grid power losses by subtracting the sum of net power consumption from total supplied power from the substation transformer. However, loss estimation may not be accurate due to, for example, measurement errors and nontechnical losses [13]. The loading of cables and substation transformers could be computed by using measurement data and solving power-flow equations using the Newton–Raphson method. Nevertheless, errors could be high due to uncertainty in grid topology and parameters, measurement errors, cable aging, and power theft.
Advanced smart-metering infrastructures and the automation of controllable assets such as transformers and switches are being implemented to cope with the increasing demand for monitoring and controling distribution grids. Smart meters are currently being deployed, replacing conventional energy meters as part of the digitalization of electrical infrastructures; they can measure various electrical quantities along with customers’ energy consumption. In Europe, smart meters are almost 100% deployed in Nordic countries [14]. At present, those smart meters are used for billing purposes, but there is a growing interest among DSOs to utilize data from smart meters for smart grid applications, including asset management. From customer premises, smart-meter data are collected in data concentrators located at LV substations, and are available to DSOs via dedicated head-end servers. It usually takes about 6 hours or more to obtain data from all smart meters under a given data concentrator to the DSO control center in a typical LV distribution grid if meshed radio-frequency (RF) communication networks are used [15]. Smart meters, if needed, can measure various electrical quantities such as voltage, current, and power consumption and generation in all three phases [16]. Smart meters can record data at a high time resolution (typically 15 min) [15].
Measurements from smart meters installed at customer premises can be used for a variety of applications in active distribution grids. For example, smart-meter data can be utilized for the analysis of power flows in cables. A review of applications of smart-meter data, and their methodologies and challenges can be found in [17]. In [18], data from smart meters were utilized to estimate the line parameters of distribution grids. Distribution-system state-estimation (DSSE) algorithms can make use of smart-meter data for the real-time monitoring and control of distribution grids, as discussed in [19]. DSSE algorithms are an important tool and enabler of smart grid applications, as illustrated in [20,21,22,23,24]. Using data from a few smart meters and pseudomeasurements in the rest of the nodes, the near real-time monitoring of LV distribution grids is possible, as discussed in [25,26]. Smart-meter data can also be used for computing nontechnical losses, as demonstrated in [27].
DSOs can implement DSSE algorithms using energy readings and additional measurements from smart meters, which makes the monitoring and maintenance of grid assets comparatively easy, thus improving the reliability of the grid operation. It also enables DSOs to be proactive in making grid upgrades, if necessary. In our previous paper [26], a single-phase DSSE algorithm based on the nonlinear weighted least-squares (NWLS) method was proposed that uses smart-meter data for the near real-time monitoring of LV grids. Compared to near real-time monitoring application, the purpose of asset management is to accurately estimate grid energy losses and the loading of grid assets (transformer and cables). The above-mentioned estimation can be carried out offline once per day or week, and it is assumed that energy readings from all smart meters are available. Additional measurements, such as of voltage at the end nodes, may also be used as inputs to the DSSE algorithm. These additional measurements improve the accuracy of the DSSE algorithm, as illustrated in the simulation cases presented in our previous paper [26].
The nonlinear weighted least-squares (NWLS)-based three-phase state-estimation technique was employed in [28,29,30,31] for the monitoring of distribution grids. In [28], a three-phase state-estimation algorithm was proposed that used the aggregated smart-meter data of several LV grids for estimating the states of a MV grid. However, the accuracy of the proposed method compared to that of a single-phase state-estimation algorithm is not evaluated. In [29], low-cost measurement devices instead of smart meters were used for three-phase state estimation. As the accuracy of those meters was relatively low, data collected from them could not be used for asset management. The measurement dataset used in the work of [29] was also generated using a MATLAB program, which may not represent real end-user consumption patterns in a real-world distribution grid. In [30], three-phase component models of transformers, loads, lines, and distributed-generation (DG) units were developed, and a method for generating pseudomeasurements was proposed. The authors in [30] indicated that single-phase state-estimation methods are not applicable to real-world distribution grids, as load unbalances are generally high. However, a detailed comparison of the results obtained from single- and three-phase state estimation algorithm was not provided. In [31], a three-phase state-estimation algorithm was used for the full observability of distribution grids and for estimating line energy losses. However, the proposed method used only substation measurements and pseudomeasurements generated from customer energy bills. The maximal error in the active power-flow estimates reported in [31] was more than 1% due to the usage of pseudomeasurements with higher uncertainty. Ways to improve the state estimation and satisfy the accuracy requirements of asset-management applications were not investigated in [30,31].
The main contributions of this paper are as follows.
- Guidelines are provided on the utilization of historical smart-meter data collected at customer connection boxes of LV distribution grids for asset management.
- An improved NWLS method is proposed on the basis of three-phase state estimation (3 DSSE) algorithm to be executed offline for the estimation of energy losses, and the loading of lines and substation transformer.
- The accuracy of single- and three-phase state-estimation algorithms is compared and quantified, applied to the state estimation of a real-world LV distribution grid with actual smart-meter measurement data.
The organization of the paper is as follows. Section 2 discusses the utilization of smart-meter data for offline computing grid power losses and asset loading. In Section 3, a three-phase grid model and details about the formulation of the three-phase DSSE algorithm are given. Simulation studies of the proposed state-estimation algorithm on a representative LV grid are outlined in Section 4. A discussion about the implementation of DSSE in a real-life LV grid is provided in Section 5, and the paper is concluded in Section 6.
2. Asset Management Based on Offline Analysis of Smart-Meter Data
DSOs are key players for this transition, as they own and manage distribution-grid infrastructures [32]. In order to have a return on the investment on smart grid technologies, DSOs need insight from the collected smart-meter data, and to develop methods to keep track of the performance and risk of the assets. Asset planning and management are becoming important tasks for DSOs to deliver reliable and quality power to their customers [33]. The loading of grid assets such as substation transformers and cables is not uniform due to fluctuating power generation from renewable sources and power-intensive loads such as heat pumps and electric vehicles. The loading of an asset above its thermal rating may lead to permanent damage and cause a fire or explosion. Due to the high penetration of Distributed energy resources (DERs) at distribution grids, current flows in lines or cables may widely vary according to power flows leading to overloaded conditions. As a result, it is important for DSOs to monitor the line currents and estimate their levels with respect to, for example, the power-consumption pattern and seasonal variations [34]. Active power losses in the grid may also vary according to season, solar radiation or wind speed, temperature, and type of the day (weekend, weekdays, or holidays). One of the main objectives of DSOs is to optimally use grid assets and implement smart grid applications such as automatic grid reconfiguration and automatic voltage regulation. Hence, lines or cables that are more sensitive to power variations need to be identified by analyzing variations in power flows [8].
At present, the majority of the DSOs have not yet implemented state-estimation algorithms to calculate line power losses in their distribution grids, although DSSE functionality is envisaged by them as per [35]. A simple typically used calculation method is to sum up the energy consumption at all customer connection points and subtract it from the energy supplied from the substation transformer [36]. This method is formulated in Equation (1).
where is the measured energy at the substation, and is the sum of the energy readings from all smart meters in that LV grid. However, the above calculation may not be accurate due to uncertainties such as measurement errors and nontechnical losses. Smart-meter data can be analyzed by state-estimation algorithms to reveal crucial information about asset utilization. The 3 DSSE can be applied on historical power-consumption data to compute the power losses and loading of substation transformers and cables [29]. Information from such analyses can be used by DSOs to increase the hosting capacity of the grid, defer expensive grid upgrades, and improve the power quality [17,37].
The 1 DSSE algorithm works on the basis of positive-sequence powers and voltages; hence, voltage or current violations above the specified limits in one or two phases may remain unnoticed [38]. One of the best solutions is to execute a state-estimation algorithm on each phase, yielding a three-phase DSSE algorithm that can estimate grid variables at all three phases [30,39]. The key points of the 3 DSSE algorithm are as follows. Inputs to 3 DSSE algorithm are per-phase powers and voltages compared to positive-sequence quantities in a 1 DSSE. The three phases are independently treated in the DSSE algorithm without any mutual couplings, although it is possible to handle them in our proposed model. Sensitivity analysis performed for the near real-time monitoring application reported in our previous work [26] is good for the 3 DSSE. In view of this fact, additional measurements in the form of three-phase node voltages at the far end nodes are made available to 3 DSSE. The block diagram of DSSE application for asset management is shown in Figure 1.
3. Mathematical Formulation of Grid Model and DSSE
In LV distribution grids, residential customers with single-phase-type loads are predominant, and loads may not be balanced in all three phases. Due to the connection and type of loads (single-phase loads or loads connected between two phases), load unbalances may not be negligible [31]. A single-phase positive-sequence model of the grid does not take into account of the load unbalances. Hence, a three-phase grid model is formulated in this paper as follows.
3.1. Three-Phase Model of Distribution-Grid Topology
In this paper, the following two types of elements present in a three-phase distribution grid are modeled [40]: (i) series elements including three-phase cables and substation transformers; and (ii) shunt elements comprising three-phase star-connected constant power loads, and cable shunt capacitances. The schematic diagram of a three-phase line model is shown in Figure 2.
At each node n and each phase , let us define the phase to neutral voltage by , and the current flowing out from the node by . Let us define vectors and that collect voltages and currents at node n, respectively. Voltages and currents in all nodes are collected in vectors . The current at each node can be computed from the voltage and powers as given in Equation (2).
Branch currents, i.e., currents flowing in the cables can be calculated from Equation (3).
where is the shunt admittance of the cable, and is the series impedance between nodes j and k. Since variable represents a three-phase line, it is a matrix consisting of self-impedance and mutual impedance between phases, as given by (4) [41].
Currents and voltages in the above three-phase model can be expressed as follows.
AC power-flow equations that represent nodal power injections can be written as follows [42].
where is the corresponding phase, and .
3.2. Representation of Electrical Loads
In current distribution grids, ungrounded Y- and D-connected nonlinear loads are prevalent; however, in this work, they are represented with a simple constant per-phase PQ injection bus model.
3.3. Three-Phase State-Estimation Algorithm
Let N be the number of nodes in the LV grid. Let the three-phase node phase to neutral voltages in phasor form be considered as state variables that are collected in vector of size , where the subscript indicates the corresponding phase. As node voltages (NV) in polar form are considered to be state variables, the state-estimation algorithm is called polar NV-DSSE [39]. Let variable M denote the number of smart meters measuring the active and reactive powers in all three phases at customer premises represented by vector . Power measurements are related to state variables i.e., voltage phasors by the expression in (7).
where is a nonlinear function described in Equation (6), and variable represents the random measurement noise. In this work, measurement noise was assumed to be white with normal probability distribution . Measurement covariance matrix was assumed to be constant in this work. Let the expected measurement be expressed as , and residual vector is calculated as per Equation (8).
The NWLS method minimizes the sum of squares of the residuals as provided in (9).
where, is the weighting matrix and it is defined as follows.
In the above matrix, diagonal elements are weights of measurements and were chosen to be the inverse of the variances of measurement errors, i.e., [43]. In other words, weights were proportional to the accuracy of the measurements. The higher the accuracy of the measurements (which indicates less errors in the measured values) is, the higher the values of weights are. For example, let us consider voltage measurements with an accuracy of 1%. Assuming that errors in voltage measurements are white noise and Gaussian-distributed with standard deviation equal to one-third of the measurement accuracy, then the value of weights is [16].
The objective function defined in Equation (9) is solved using the Gauss–Newton method on the basis of the iterative equations provided in Equation (11).
where k is the iteration index, and is the Jacobian matrix computed from . The flowchart for the execution of the NWLS method is shown in Figure 3.
According to the analysis described in [39], the polar NV DSSE takes slightly fewer iterations on an average for convergence compared to other forms, such as branch current DSSE, although the execution time is much higher in NV DSSE due to less sparsity in Jacobian matrices.
4. Simulation Studies
In this section, simulation cases are presented for the estimation of cable loading and power losses using smart-meter data measured from a representative LV grid.
4.1. LV Grid Used for Case Studies
Figure 4 shows the schematic diagram of an LV distribution grid in Thisted, Denmark that was used for simulation studies in this paper. This LV grid consisted of a secondary substation with a transformer of rating 10/0.4 kV, 630 KVA, and 5 feeders. The main and longest feeder, Feeder 5, consisted of 13 nodes and it is shown in Figure 4. The four other feeders are represented as a lump load at the secondary side of the substation transformer. Feeder 5 comprises 23 customers with a majority of residential and nonresidential loads such as schools, farms, and pumping stations. Nodes represent junction boxes (JBs) at which several customers were connected by means of private cables.
Smart-meter data collected from the above grid for a 1 year period during 2018 were three-phase active and reactive power generation and consumption. The three-phase active and reactive power profiles measured at all customer connection points (CCBs) are provided as inputs to a model of the LV grid developed in the ePHASORsim module of an OPAL-RT simulator for load flow analysis. Private cables between JBs and the CCBs were not modeled and were ignored in all analyses in this work. The resultant three-phase voltages and current phasors from OPAL-RT simulations were considered to be true values for comparison with the estimates of the 1 and 3 DSSE algorithms. For the 1 DSSE algorithm, positive-sequence voltages were computed from the true three-phase voltages of OPAL-RT simulations for comparison.
In this paper, three case studies were carried out to numerically validate and compare the proposed 3 DSSE algorithm, and they are described in the following sections. To incorporate uncertainty in measurements, Gaussian white noise with a standard deviation of pu was added to all smart-meter energy measurements. For the line parameters, we considered a uniform distribution of errors with standard deviation pu, which corresponded to a maximal variation of in the line resistances and reactances. Simulation results in our previous paper [26] showed that, by using voltage measurements from end nodes of the feeder, the accuracy of the DSSE algorithm can be improved. Hence, in this paper, node voltages at end nodes JB11, JB13, and JB09 are provided as additional inputs to the 1 and 3 DSSE algorithms in the study cases below. Gaussian white noise with standard deviation of pu was added to these voltage measurements [26].
4.2. Case 1: Estimation of Node Voltages
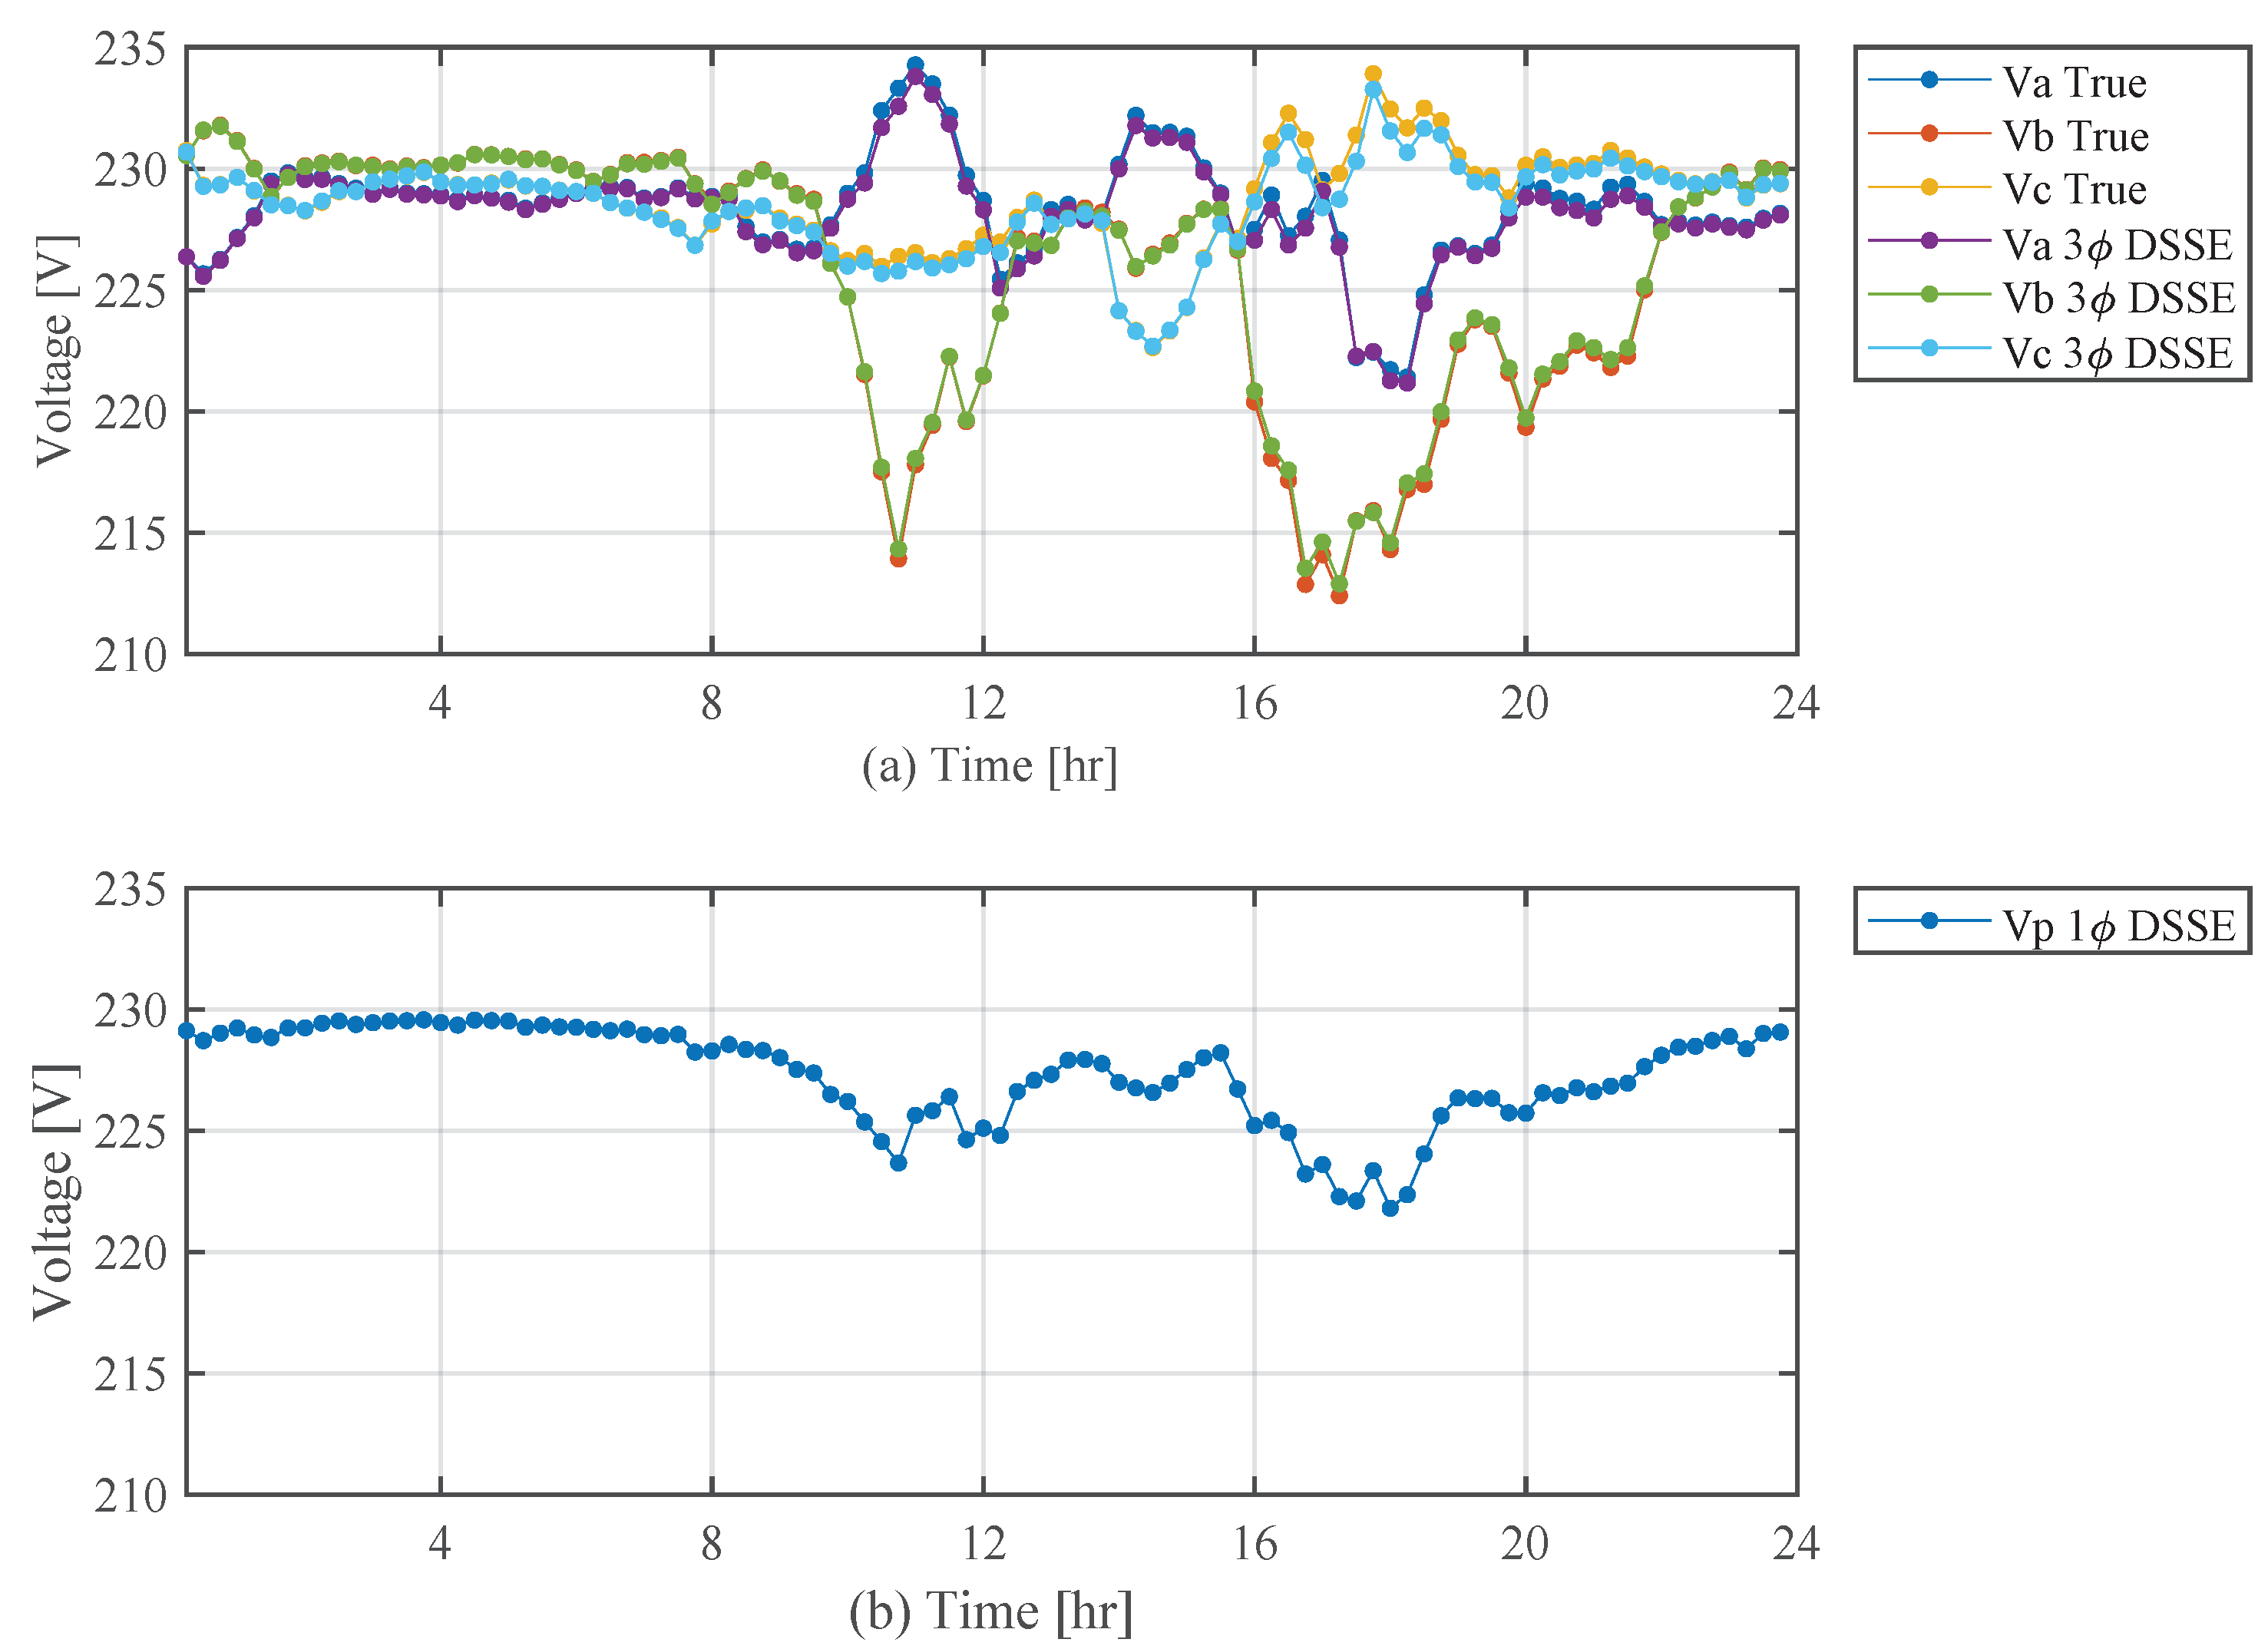
In this case study, active and reactive powers measured at individual phases of each customer connection point on a typical winter day are provided as inputs. Voltages at end nodes (JB11, JB13 and JB09) are provided as additional inputs to the DSSE algorithms. Node voltages were estimated using the 1 and 3 DSSE algorithms and compared. The 1 DSSE algorithm estimates only the positive-sequence values of the node voltages, while the 3 DSSE algorithm estimates node voltages at individual phases. Results were compared with the true values of three-phase voltages obtained from offline simulations using the ePhasor RT-Lab tool and are shown in Figure 5. Figure 5a shows that the estimated three-phase voltages of the 3 DSSE algorithm at node JB11 closely matched their corresponding true values.
Figure 5b shows the positive-sequence voltage profile estimated by the 1 DSSE algorithm. Although the maximal variation in individual phase voltages was around 9.5%, the corresponding change in the positive-sequence voltage was just 3.5%. Hence, 3 DSSE algorithm is clearly more suitable for analyzing the voltage profiles of highly unbalanced distribution grids.
Figure 6 shows the absolute error in the positive-sequence voltage values in the 1 DSSE and 3 DSSE algorithms compared to their true values, with errors being comparatively less in the 3 DSSE.
4.3. Case 2: Estimation of Cable Loading
In this case study, currents through the cables were calculated from the estimated voltages of the DSSE algorithm, grid topology, and cable parameters. To calculate the cable loading in percentage, the following relation was used.
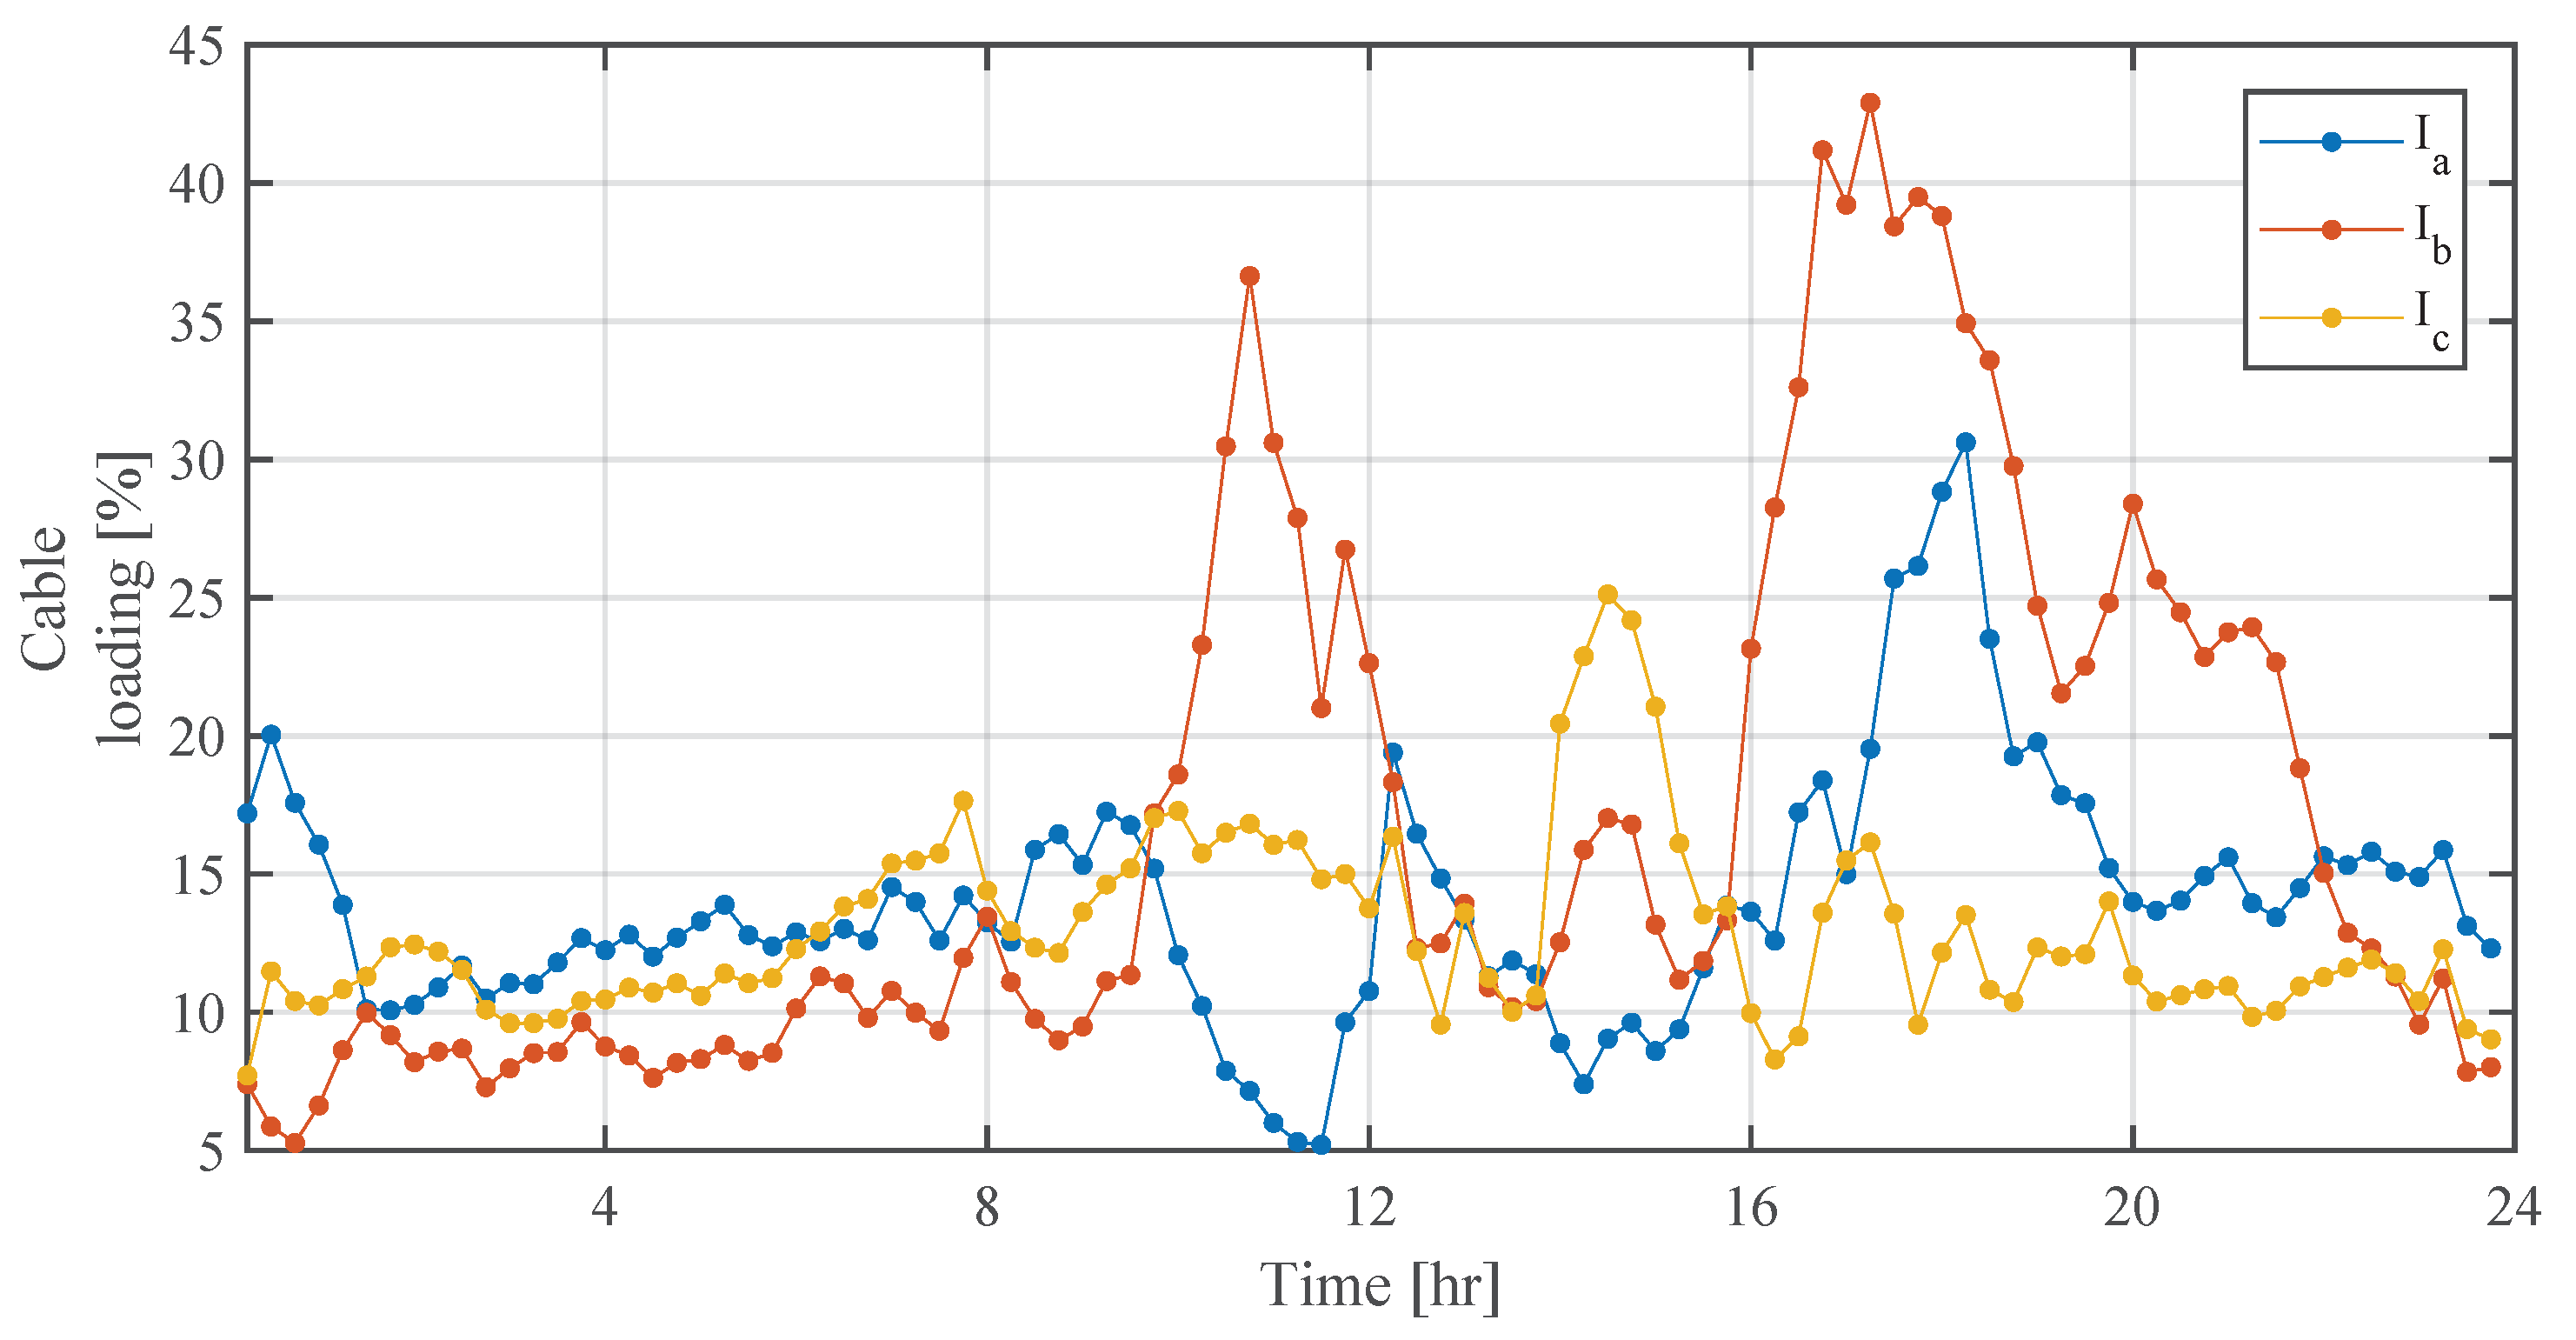
where is the calculated current through the cable, and is the rated current of the cable. For instance, currents through the cable between nodes T2 and JB1, of which the rated current is kA, are shown in Figure 7.
From the above figure, it is evident that the peak loading of cables was different among the three phases, which could only be estimated by a 3 DSSE algorithm.
A comparison of the computational burden of the DSSE algorithms is shown in Table 1.
Table 1 shows that the average number of iterations are almost the same in both DSSE algorithms; however, execution time was three times larger in 3 DSSE, as state variables were estimated in all phases. Nonetheless, longer execution time is not a drawback, as the proposed 3 DSSE is used in the offline analysis of smart-meter data.
4.4. Case 3: Estimation of Active Energy Losses
In this simulation case, estimated active power losses in all the cables of the representative LV grid by the 1 DSSE and 3 DSSE were compared with the true values on a typical winter day, and results are plotted in Figure 8. Energy losses are compared in Figure 8a, errors in the loss estimation in Figure 8b, and powers supplied from the substation transformer are plotted in the Figure 8c.
Similar to the case with estimated node voltages, 3 DSSE performed better in estimating active power losses of the grid. Power flows at the substation were less estimated by both the 1 and the 3 DSSE algorithm, which resulted in them underestimating power losses. However, 3 DSSE algorithm provided slightly more accurate power losses because of the treatment of power flows in individual phases.
To further assess the accuracy of the proposed 3 DSSE algorithm, active energy losses were computed for all three methods, namely, 1 DSSE, 3 DSSE, and smart-meter-reading-based loss calculation as per Equation (1) for a full 1 year of smart-meter data. A summary of the comparison of active energy losses is provided in Table 2.
Table 2 shows that 3 DSSE performed better than other methods did. The 3 DSSE algorithm overestimated losses. As uncertainty in cable parameters was modeled as uniform distribution that added a maximal 10% increase in cable lengths, estimated losses by 3 DSSE were higher than the true values. However, the accuracy of the 3 DSSE algorithm was better than that of other methods, and it is recommended to implement 3 DSSE for the calculation of grid power losses and loading condition of grid assets.
5. Discussion
In this paper, simulation studies showed that cable loading and power losses in LV distribution grids can be accurately estimated by the offline analysis of smart-meter data. The capability of smart meters to measure and record individual phase voltages, currents, and powers in four quadrants was utilized for the above-mentioned purpose. The two variants of DSSE algorithm, namely, 1 and 3 DSSE, were applied to the estimation of line currents and loss calculation, and their results were compared. Compared to a near real-time monitoring application in which smart-meter data need to be obtained and processed close to real time, asset-management applications could use historical smart-meter data for analysis., e.g., past 1 day, week, or month, depending on the requirements of the DSO. Because of the time constraint in grid monitoring applications, smart-meter data are collected only from few smart meters at critical locations, and pseudomeasurements are used in the rest of the nodes. However, in asset management, all collected smart-meter data can be used for offline analysis. The computation time of the DSSE algorithm is also not of concern. The 1 DSSE algorithm uses a single-phase-equivalent model of the distribution grid, which has the limitation of considering nodes with loads connected at only one or two phases, and lines that connect only a single phase or two phases between nodes. The above disadvantage is overcome by using three-phase modeling of the distribution grid, which was formulated in Section 3. The 3 DSSE algorithm uses the three-phase grid model and estimates grid states in individual phases. As load unbalances are common in distribution grids due to the use of single-phase loads, the 3 DSSE algorithm is preferrable for the accurate estimation of line currents and power losses. From the simulation studies in Section 4, the following were observed.
- Per-phase voltages or currents estimated by 3 DSSE algorithm showed voltage or current variations in the corresponding phases. However, such variations were not observed in their positive-sequence values estimated by the 1 DSSE algorithm.
- Using the 3 DSSE algorithm, accuracy in the estimation of active energy losses can be improved by a factor of three compared to the 1 DSSE algorithm.
6. Conclusions
In this paper, the utilization of smart-meter data for the offline analysis and estimation of node voltages, cable currents, and active energy losses was addressed. A 3 DSSE algorithm was proposed using the nonlinear weighted least-squares method for estimating voltages, currents, and active power losses at each phase. Simulation studies performed on a real-life LV distribution grid used the measured smart-meter data. Uncertainties in the measurements and cable parameters were considered in the simulation studies. The results of the proposed 3 DSSE algorithm were compared with those of a 1 DSSE algorithm. A comparison of the positive-sequence voltages showed that, using 3 DSSE algorithm, estimation accuracy was improved from 0.41% to about 0.12%. Improvement in estimation accuracy was especially higher when load unbalances were high. The cable loading estimated by the proposed DSSE algorithm showed that the loading was uneven among phases, for instance, the maximal loading of phase a was 47% while that of phase c was just 25%. This information is important for DSOs to redistribute and balance loads among phases. On the estimation of active energy losses, the proposed 3 DSSE algorithm had an error of 6.6% compared to the arithmetic sum of all meter measurements and the 1 DSSE algorithm method, in which errors in estimation were more than 20%.
Simulation results proved that the proposed method is useful for DSOs in the management of grid assets. In this paper, only the possibilities of using smart-meter data for asset-management applications were studied. The power-quality indices of LV grids, such as voltage total harmonic distortion (THD), were not analyzed in this work due to the lack of data from smart-meter measurements. In our future works, power quality will be assessed by collecting high time and frequency resolution data from smart meters. The proposed state-estimation method can be extended to other applications, such as grid-planning studies and fault management, and will be a part of our future works.
Author Contributions
K.N., the main author of this article, prepared the draft. F.I., the coauthor, provided technical inputs, reviewed the draft, and supervised the work. F.I. was also responsible for the administration and funding acquisition of projects RemoteGRID and Net2DG. All authors have read and agreed to the published version of the manuscript.
Funding
This research was funded by the RemoteGRID project funded through the ForskEL program, grant no. 12399; and the Net2DG project European Union’s Horizon 2020 research and innovation program under grant agreement no. 774145.
Institutional Review Board Statement
Not applicable.
Informed Consent Statement
Not applicable.
Data Availability Statement
Not applicable.
Acknowledgments
The authors would like to thank Rolf Kirk and Michael Lyhne from Thy-Mors Energi A/S, Denmark for providing smart meter data and the LV grid data for use in the study reported in this paper.
Conflicts of Interest
The authors declare no conflict of interest.
Abbreviations
The following abbreviations are used in this manuscript:
| CCB | Customer connection box |
| DER | Distributed energy resources |
| DSO | Distribution system operator |
| DSSE | Distribution-system state estimation |
| ICT | Information and communication technologies |
| JB | Junction box |
| LV | Low-voltage |
| MAE | Mean absolute error |
| MV | Medium-voltage |
| NV | Node voltages |
| NWLS | Nonlinear Weighted Least Square |
| PMU | Phasor measurement unit |
| pu | per unit |
| PV | Photovoltaic |
| RTU | Remote terminal unit |
| THD | Total harmonic distortion |
| 1 | Single-phase |
| 3 | Three-phase |
References
- Mathiesen, B.; Lund, H. Comparative analyses of seven technologies to facilitate the integration of fluctuating renewable energy sources. IET Renew. Power Gener. 2009, 3, 190. [Google Scholar] [CrossRef]
- Samuelsson, O.; Repo, S.; Jessler, R.; Aho, J.; Karenlampi, M.; Malmquist, A. Active distribution network—Demonstration project ADINE. In Proceedings of the 2010 IEEE PES Innovative Smart Grid Technologies Conference Europe (ISGT Europe), Gothenburg, Sweden, 11–13 October 2010; pp. 1–8. [Google Scholar] [CrossRef]
- Ghorbani, M.J.; Mokhtari, H. Impact of harmonics on power quality and losses in power distribution systems. Int. J. Electr. Comput. Eng. 2015, 5, 166–174. [Google Scholar] [CrossRef]
- Rad, M.S.; Kazerooni, M.; Ghorbany, M.J.; Mokhtari, H. Analysis of the grid harmonics and their impacts on distribution transformers. In Proceedings of the 2012 IEEE Power and Energy Conference at Illinois—PECI 2012, Champaign, IL, USA, 24–25 February 2012; p. 4. [Google Scholar] [CrossRef]
- Bollen, M.; Hassan, F. Integration of Distributed Generation in the Power System; John wiley and Sons: Hoboken, NJ, USA, 2011. [Google Scholar]
- Walling, R.A.; Saint, R.; Dugan, R.C.; Burke, J.; Kojovic, L.A. Summary of distributed resources impact on power delivery systems. IEEE Trans. Power Deliv. 2008, 23, 1636–1644. [Google Scholar] [CrossRef]
- Nainar, K.; Pokhrel, B.R.; Pillai, J.R.; Bak-Jensen, B.; Frederiksen, K.H.B. Demand Response in Low Voltage Distribution Networks with High PV Penetration. In Proceedings of the UPEC 2017, Crete, Greece, 28–31 August 2017. [Google Scholar]
- Armendariz, M.; Broden, D.; Honeth, N.; Nordström, L. A method to identify exposed nodes in low voltage distribution grids with High PV penetration. IEEE Power Energy Soc. Gen. Meet. 2015. [Google Scholar] [CrossRef]
- Nainar, K.; Pillai, J.R.; Bak-Jensen, B.; Simpson-Porco, J.W. Predictive control of flexible resources for demand response in active distribution networks. IEEE Trans. Power Syst. 2019, 34, 2957–2969. [Google Scholar] [CrossRef]
- Järventausta, P.; Repo, S.; Rautiainen, A.; Partanen, J. Smart grid power system control in distributed generation environment. Annu. Rev. Control 2010, 34, 277–286. [Google Scholar] [CrossRef]
- Berizzi, A.; Bovo, C.; Ilea, V.; Merlo, M.; Monfredini, G.; Subasic, M.; Arrigoni, C.; Zanellini, F.; Corti, F.; Rochira, I. Advanced functions for DSOs control center. In Proceedings of the 2013 IEEE Grenoble Conference—POWERTECH 2013, Grenoble, France, 16–20 June 2013. [Google Scholar] [CrossRef]
- Schneider, J.; Gaul, A.J.; Neumann, C.; Hogräfer, J.; Wellßow, W.; Schwan, M.; Schnettler, A. Asset management techniques. Int. J. Electr. Power Energy Syst. 2006, 28, 643–654. [Google Scholar] [CrossRef] [Green Version]
- CIRED. Reduction of technical and non-technical losses in distribution networks. In Proceedings of the International Conference on Electricity Distribution, Glasgow, UK, 12–15 June 2017; p. 114. [Google Scholar]
- Zhou, S.; Brown, M.A. Smart meter deployment in Europe: A comparative case study on the impacts of national policy schemes. J. Clean. Prod. 2017, 144, 22–34. [Google Scholar] [CrossRef]
- Kemal, M.S.; Ruben, S.; Olsen, R.L.; Iov, F.; Schwefel, H.P. On the trade-off between timeliness and accuracy for low voltage distribution system grid monitoring utilizing smart meter data. Int. J. Electr. Power Energy Syst. 2020, 121, 106090. [Google Scholar] [CrossRef]
- Pau, M.; Patti, E.; Barbierato, L.; Estebsari, A.; Pons, E.; Ponci, F.; Monti, A. Low voltage system state estimation based on smart metering infrastructure. In Proceedings of the 2016 IEEE International Workshop on Applied Measurements for Power Systems (AMPS), Aachen, Germany, 28–30 September 2016; pp. 1–6. [Google Scholar]
- Wang, Y.; Chen, Q.; Hong, T.; Kang, C. Review of smart meter data analytics: Applications, methodologies, and challenges. IEEE Trans. Smart Grid 2019, 10, 3125–3148. [Google Scholar] [CrossRef] [Green Version]
- Wang, W.; Yu, N. Parameter Estimation in Three-Phase Power Distribution Networks Using Smart Meter Data. In Proceedings of the 2020 International Conference on Probabilistic Methods Applied to Power Systems (PMAPS), Liege, Belgium, 18–21 August 2020; pp. 1–6. [Google Scholar] [CrossRef]
- Ahmad, F.; Rasool, A.; Ozsoy, E.; Sekar, R.; Sabanovic, A.; Elitaş, M. Distribution system state estimation-A step towards smart grid. Renew. Sustain. Energy Rev. 2018, 81, 2659–2671. [Google Scholar] [CrossRef] [Green Version]
- Primadianto, A.; Lu, C.N. A review on distribution system state estimation. IEEE Trans. Power Syst. 2017, 32, 1. [Google Scholar] [CrossRef]
- Wang, G.; Giannakis, G.B.; Chen, J.; Sun, J. Distribution system state estimation: An overview. Front. Inf. Technol. Electron. 2019, 20, 4–17. [Google Scholar] [CrossRef]
- Huang, Y.F.; Werner, S.; Huang, J.; Kashyap, N.; Gupta, V. State estimation in electric power grids: Meeting new challenges presented by the requirements of the future grid. IEEE Signal Process. Mag. 2012, 29, 33–43. [Google Scholar] [CrossRef] [Green Version]
- Zhang, Z.; Liu, M.; Xiao, S. A survey on state estimation algorithm of distribution grid. In Proceedings of the 2012 Spring Congress on Engineering and Technology—SCET 2012, Xi’an, China, 27–30 May 2012; pp. 1–4. [Google Scholar]
- Dehghanpour, K.; Wang, Z.; Wang, J.; Yuan, Y.; Bu, F. A survey on state estimation techniques and challenges in smart distribution systems. IEEE Trans. Smart Grid 2019, 10, 2312–2322. [Google Scholar] [CrossRef] [Green Version]
- Abdel-Majeed, A.; Braun, M. Low voltage system state estimation using smart meters. In Proceedings of the 2012 47th International Universities Power Engineering Conference (UPEC), Uxbridge, UK, 4–7 September 2012; pp. 1–6. [Google Scholar]
- Nainar, K.; Iov, F. Smart meter measurement-based state estimation for monitoring of low-voltage distribution grids. Energies 2020, 13, 5367. [Google Scholar] [CrossRef]
- Persson, M.; Lindskog, A. Detection and localization of non-technical losses in distribution systems with future smart meters. In Proceedings of the 2019 IEEE Milan PowerTech, Milan, Italy, 23–27 June 2019. [Google Scholar] [CrossRef]
- Ni, F.; Nguyen, P.H.; Cobben, J.F.; Van den Brom, H.E.; Zhao, D. Three-phase state estimation in the medium-voltage network with aggregated smart meter data. Int. J. Electr. Power Energy Syst. 2018, 98, 463–473. [Google Scholar] [CrossRef]
- Khan, M.A.; Hayes, B. Three phase state estimation in power distribution networks by integrating IEEE-1588 with smart meters. In Proceedings of the 2019 International Conference on Smart Grid Synchronized Measurements and Analytics (SGSMA), College Station, TX, USA, 21–23 May 2019. [Google Scholar] [CrossRef]
- Ranković, A.; Maksimović, B.M.; Sarić, A.T. A three-phase state estimation in active distribution networks. Int. J. Electr. Power Energy Syst. 2014, 54, 154–162. [Google Scholar] [CrossRef]
- Soares, T.M.; Bezerra, U.H.; De Lima Tostes, M.E. Full-observable three-phase state estimation algorithm applied to electric distribution grids. Energies 2019, 12, 1327. [Google Scholar] [CrossRef] [Green Version]
- Picciariello, A.; Alvehag, K.; Soder, L. Impact of Network Regulation on the Incentive for DG Integration for the DSO: Opportunities for a Transition Toward a Smart Grid. IEEE Trans. Smart Grid 2015, 6, 1730–1739. [Google Scholar] [CrossRef]
- Mallet, P.; Granström, P.O.; Hallberg, P.; Lorenz, G.; Mandatova, P. Power to the people!—European Perspectives on the Future of Electric Distribution. IEEE Power Energy Mag. 2014, 12, 51–64. [Google Scholar] [CrossRef]
- Papathanassiou, S.; Hatziargyriou, N.; Anagnostopoulos, P.; Aleixo, L.; Buchholz, B.; Carter-Brown, C.; Drossos, N.; Enayati, B.; Fan, M.; Gabrion, V.; et al. Capacity of Distribution Feeders for Hosting Distributed Energy Resources; Cigre C6.24; CIGRE: Paris, France, 2014; p. 148. [Google Scholar]
- Pilo, F.; Silvestro, F.; Mauri, G.; Taylor, J.; Bak-Jensen, B.; Braun, M.; Kampf, E. Control and Automation Systems at the TSO-DSO interface: A survey on the actual functionalities and DSO requirements. In Proceedings of the CIGRE Symposium 2017, Dublin, Ireland, 29 May–2 June 2017; Cigre WG C6.25. pp. 1–10. [Google Scholar]
- Iov, F.; Ciontea, C. WP 5.1 Report—First Integrated Deployment at Lab and Testbed. Net2DG Project. Technical Report. 2019. Available online: www.net2dg.eu (accessed on 2 April 2021).
- Dzafic, I.; Henselmeyer, S.; Neisius, H.T. High performance State Estimation for smart grid distribution network operation. Innov. Smart Grid 2011, 1–6. [Google Scholar] [CrossRef]
- Primadianto, A.; Lin, W.T.; Lu, C.N. Performance comparison of distribution system state estimation methods. In Proceedings of the 2016 IEEE Innovative Smart Grid Technologies-Asia (ISGT-Asia), Melbourne, Australia, 28 November–1 December 2016; pp. 1121–1126. [Google Scholar] [CrossRef]
- Pau, M.; Pegoraro, P.A.; Sulis, S. Performance of three-phase WLS distribution system state estimation approaches. In Proceedings of the 2015 IEEE International Workshop on Applied Measurements for Power Systems (AMPS), Aachen, Germany, 23–25 September 2015; pp. 138–143. [Google Scholar] [CrossRef]
- Kersting, W.H. Distribution System Modeling and Analysis; CRC Press: Boca Raton, FL, USA, 2012; p. 455. [Google Scholar]
- Bazrafshan, M.; Gatsis, N. Comprehensive modeling of three-phase distribution systems via the bus admittance matrix. IEEE Trans. Power Syst. 2017, 33, 2015–2029. [Google Scholar] [CrossRef] [Green Version]
- Saadat, H. Power System Analysis; WCB/McGraw-Hill: Singapore, 1999. [Google Scholar]
- Baran, M.E.; Kelley, A.W. State estimation for real-time monitoring of distribution systems. IEEE Trans. Power Syst. 1994, 9, 1601–1609. [Google Scholar] [CrossRef]
Figure 1.
Block diagram of the three-phase distribution-system state estimation (DSSE) for offline analysis of low-voltage (LV) grids.
Figure 1.
Block diagram of the three-phase distribution-system state estimation (DSSE) for offline analysis of low-voltage (LV) grids.

Figure 2.
Three-phase line model.

Figure 3.
Flowchart of nonlinear weighted least-squares (NWLS)-based 3 DSSE algorithm.

Figure 4.
Representative LV grid used in simulation studies.

Figure 5.
Plot of grid states of (a) individual phase voltages by 3 DSSE algorithm compared with their true values; (b) positive-sequence voltages by 1 DSSE algorithm.
Figure 5.
Plot of grid states of (a) individual phase voltages by 3 DSSE algorithm compared with their true values; (b) positive-sequence voltages by 1 DSSE algorithm.

Figure 6.
Estimated absolute errors in positive-sequence voltages at node JB11.

Figure 7.
Estimated loading of cable C01 between nodes T2 and JB1.

Figure 8.
Plot of (a) Estimated active power loss, (b) errors in estimated active power loss, and (c) active power supplied from substation transformer.
Figure 8.
Plot of (a) Estimated active power loss, (b) errors in estimated active power loss, and (c) active power supplied from substation transformer.


Table 1.
Comparison of computational times in Case 1.
| Method | Average Iteration Number | Average Execution Time (ms) |
|---|---|---|
| 1 DSSE | 3.44 | 2.3 |
| 3 DSSE | 3.49 | 6.8 |
Table 2.
Comparison of active energy loss estimation for 1 year.
| True Value | Loss Calculation Based on (1) | Single-Phase DSSE | Three-Phase DSSE | |
|---|---|---|---|---|
| Energy losses [MWh] | 2.47 | 1.86 | 1.93 | 2.64 |
| Absolute difference [%] | - | 24.82 | 21.75 | 6.66 |
Publisher’s Note: MDPI stays neutral with regard to jurisdictional claims in published maps and institutional affiliations. |
© 2021 by the authors. Licensee MDPI, Basel, Switzerland. This article is an open access article distributed under the terms and conditions of the Creative Commons Attribution (CC BY) license (https://creativecommons.org/licenses/by/4.0/).
Share and Cite
MDPI and ACS Style
Nainar, K.; Iov, F. Three-Phase State Estimation for Distribution-Grid Analytics. Clean Technol. 2021, 3, 395-408. https://0-doi-org.brum.beds.ac.uk/10.3390/cleantechnol3020022
AMA Style
Nainar K, Iov F. Three-Phase State Estimation for Distribution-Grid Analytics. Clean Technologies. 2021; 3(2):395-408. https://0-doi-org.brum.beds.ac.uk/10.3390/cleantechnol3020022
Chicago/Turabian StyleNainar, Karthikeyan, and Florin Iov. 2021. "Three-Phase State Estimation for Distribution-Grid Analytics" Clean Technologies 3, no. 2: 395-408. https://0-doi-org.brum.beds.ac.uk/10.3390/cleantechnol3020022