
Numerical Investigation for Power Generation by Microbial Fuel Cells Treating Municipal Wastewater in Guelph, Canada

Civil and Environmental Engineering, University of Waterloo, Waterloo, ON N2L 3G1, Canada
*
Author to whom correspondence should be addressed.
Clean Technol. 2024, 6(2), 497-512; https://0-doi-org.brum.beds.ac.uk/10.3390/cleantechnol6020026
Submission received: 23 February 2024
/
Revised: 11 April 2024
/
Accepted: 16 April 2024
/
Published: 19 April 2024
Abstract
:Significant research endeavors have focused on microbial fuel cell (MFC) systems within wastewater treatment protocols owing to their unique capacity to convert chemical energy from waste into electricity while maintaining minimal nutrient concentrations in the effluent. While prior studies predominantly relied on empirical investigations, there remains a need to explore modeling and simulation approaches. Assessing MFC systems’ performance and power generation based on real wastewater data is pivotal for their practical implementation. To address this, a MATLAB model is developed to elucidate how MFC parameters and constraints influence system performance and enhance wastewater treatment efficiency. Leveraging actual wastewater data from a municipal plant in Guelph, Canada, six sets of MFC models are employed to examine the relationship between power generation and six distinct parameters (inflow velocity, membrane thickness, internal resistance, anode surface area, feed concentration, and hydraulic retention time). Based on these analyses, the final model projects a total power generation of 50,515.16 kW for the entire wastewater treatment plant in a day, capable of supporting approximately 2530 one-person households. Furthermore, the model demonstrates a notably higher chemical oxygen demand (COD) removal rate (75%) compared to the Guelph WWTP. This comprehensive model serves as a valuable tool for future simulations in similar wastewater treatment plants, providing insights for optimizing performance and aiding in practical applications.
1. Introduction
1.1. Research Motivation
Against the backdrop of economic advancement and the swift pace of urbanization, concerns about water sanitation have emerged as fundamental requirements for humanity and the environment on a global scale. Wastewater treatment remains an essential priority that is not solely limited to developing nations; instead, it stands as a fundamental requirement for safeguarding the environment and preserving the integrity of water bodies, which serve as vital sources of drinking water across the globe. The contamination of ground and surface water bodies contributes significantly to the primary origins of wastewater. Given the rapid strides in industrialization, more than the prevailing approach to wastewater treatment is needed to cater to the escalating demands for water sanitation. Additionally, the existing technologies for wastewater treatment confront substantial hurdles in terms of excessive expenses and energy consumption.
The energy demand for wastewater treatment varies between 0.5 and 2 kWh per cubic meter (kWh∙m−3), contingent on factors such as the treatment method and the wastewater composition. It is worth noting that the energy content within wastewater is approximately three to ten times higher than the energy needed for its treatment [1]. The energy present in domestic wastewater can be categorized into two types: chemical energy and thermal energy. Chemical energy, constituting approximately 26% of the total, exists in the form of carbon (measured as chemical oxygen demand, COD) as well as nutrient compounds such as nitrogen (N) and phosphorous (P). Through harnessing this latent chemical energy, the wastewater treatment process can be transformed from an energy-consuming endeavor into one that generates energy or operates independently in terms of energy, while mitigating environmental pollution [1].
In light of the imperative for sustainability and economic viability, microbial fuel cells (MFCs) have garnered substantial attention within the scientific community as a more viable solution for addressing wastewater treatment challenges [1]. Compared to traditional active sludge wastewater treatment processes, MFCs have a higher conversion efficiency from substrates to energy and a higher volume reduction [2]. Moreover, a higher recovery rate of value-added products such as silver (Ag) or chromium (Cr) and lower GHG emissions also increases the sustainability of the wastewater treatment process using MFCs [3,4,5].
A fuel cell represents an electrochemical apparatus that directly transforms the inherent chemical energy within its reactants (fuel and oxidant) into electrical energy. Unlike batteries, a fuel cell operates as an energy converter, capable of generating continuous electric energy output, provided that the fuel and oxidant are consistently supplied in principle [6]. Like other fuel cells, MFCs can transfer chemical energy from wastewater into electricity by oxidizing carbohydrates to carbon dioxide (CO2) and allowing biochemical reduction to transport electrons [7]. Electrons and protons are generated in MFCs due to the degradation of substrates on the anode side. These electrons and protons are then transported through a resistor and a membrane to the cathode, reacting with oxygen to produce electricity [8,9].
The Guelph Water Resource Recovery Centre, previously known as the Wastewater Treatment Plant (WWTP), is managed by the Wastewater Services Division of the City of Guelph, Ontario, Canada. This center is responsible for treating various types of wastewater, including domestic, commercial, institutional, and industrial wastewater, from both the City of Guelph and the nearby Township of Guelph/Eramosa [10]. The average total daily flow for 2022 was 50.651 MLD based on the annual report. This study aims to investigate the power generation potential via MFCs treating municipal wastewater in the City of Guelph. In the following sections, the basics of MFCs treating wastewater are first introduced, and the actual wastewater data of the City of Guelph is analyzed using the activated sludge model number 1 (ASM1) model. Next, major factors influencing the power generation of the MFC are investigated by numerical experiments. Finally, an optimal model is developed to simulate the potential power generation and COD removal rate for the actual wastewater treatment plant in Guelph, Canada.
1.2. Current Wastewater Treatment Method
The direct discharge of wastewater from diverse sources, including domestic, agricultural, and industrial facilities, is the primary driver behind various adverse environmental effects. These impacts encompass issues like the eutrophication of surface waters, hypoxia, and the proliferation of algal blooms that disrupt potential drinking water supplies. Existing wastewater treatment methods are resource intensive, both in terms of energy and chemicals. They necessitate substantial investments but do not yield any revenue. The energy requirements for wastewater treatment processes range from 0.5 to 2 kWh per cubic meter (kWh∙m−3) of treated wastewater, especially for removing carbon and a portion of nitrogen [1]. During treatment, significant quantities of greenhouse gases like carbon dioxide (CO2) and nitrous oxide (N2O), along with other volatile substances, are released into the atmosphere. Additionally, this process generates excess sludge that demands further disposal measures. For instance, the production of every kilowatt-hour (kWh) of electricity produces 0.9 kg of CO2. Furthermore, considering the treatment of 1000 tons of wastewater, around 1500 tons of greenhouse gases are emitted [1].
In many parts of the world, the activated sludge process is the most commonly used method for treating wastewater. This process is efficient and fast, but it has its downsides. It demands significant amounts of chemicals and energy, making its setup and maintenance costly. For instance, a substantial portion (up to 75%) of the energy expenses in a wastewater treatment plant is due to the need for aeration. Moreover, the handling and disposing of the leftover sludge can account for about 60% of the overall operational costs [11]. On the flip side, anaerobic treatment has been found to be applicable in treating concentrated industrial wastewater and excess sludge from wastewater treatment plants. This technique has been honed over time, effectively treating wastewater and generating valuable bioenergy. In the past, wastewater treatment mainly aimed to ensure that the released water met specific cleanliness standards (by eliminating elements like carbon and nutrients) and that the remaining sludge could be safely used on land. However, given the concerns about dwindling fossil fuels, environmental pollution, and the scarcity of resources, including water, there is a significant drive to discover more sustainable approaches to wastewater treatment and utilization. As a result, the design and operation of wastewater treatment systems are evolving. The emphasis is shifting from simply eliminating pollutants to finding methods to recover resources from the wastewater, minimizing energy usage, and even gaining some energy benefits from the process [12].
1.3. Microbial Fuel Cell
Compared to other wastewater treatment methods, microbial fuel cells present a range of advantages across various fronts. They provide energy benefits such as direct electricity generation and energy savings through anaerobic treatment that eliminate the need for aeration. MFCs also offer low sludge production and can be applied in centralized and decentralized systems. From an environmental perspective, MFCs contribute to water reclamation, have a minimal carbon footprint, and produce lower volumes of sludge for disposal. On the economic front, they generate revenue through energy production and the creation of value-added products like chemicals. MFCs also exhibit cost-effective operation by reducing operational expenses and eliminating the need for downstream processes. Moreover, they come with operational merits, including the self-generation of microorganisms, strong resilience against environmental stressors, and suitability for real-time monitoring and control [13]. MFCs generate electricity directly from organic substances in wastewater, eliminating the need to separate, purify, or convert energy byproducts. In contrast, processes like anaerobic digestion produce methane and hydrogen, but these need to undergo separation and purification before they can be effectively utilized; in this case, MFCs stand out as environmentally friendly solutions because they produce clean electricity directly [14].
An MFC comprises three main components: an anode, a proton exchange membrane (PEM), and a cathode. The anode and cathode are linked by an electric wire to establish a circuit. Within MFCs, the microbes in the anode chamber produce protons, which are then transported through the PEM to the cathode chamber, where they combine with oxygen. Regardless of the fuel cell type, anodes need to be constructed from materials that are both environmentally safe, resistant to fouling, and capable of efficiently conducting electrons [13,15,16].
Electrons and protons generated through microbial metabolism within the anodic chamber embark on a journey to the cathode chamber, combining with oxygen to produce water. Alternatively, mediators or shuttle systems can facilitate electron transfer to the anode [17]. This transfer can occur through direct membrane transport, or nanowires synthesized by bacteria. Chemical mediators can be introduced to MFCs to enable bacterial electricity production, although specific systems operate without such mediators [17].
MFC devices transform chemical energy into electrical energy via the oxidation of carbon and other organic substances with the assistance of Electrochemically Active Bacteria (EABs). The predominant microbial participants in MFCs often encompass the Geobacter and Shewanella species [17,18]. Moreover, photosynthetic bacteria, including efficient candidates like Anabaena and Nostoc, find utility in MFC operation. Notably, mixed microbial cultures sourced from various environments—from domestic and industrial wastewater to marine, lake, and pond sediments and anaerobic sludge—have been harnessed within MFCs for their biocatalytic prowess [19].
A proton exchange membrane acts as a separator between the two electrodes in a fuel cell, the anode and cathode. Not only does this membrane facilitate the transport of ions from the anode to the cathode, enabling the reactions within the fuel cell to proceed [20], but it also has a unique function in MFCs, which is to prevent the migration of waste substances metabolized at the anode from reaching the cathode. This membrane shields the cathode from fouling and ensures that the reactions at the cathode are not disrupted [20,21]. The proton exchange membrane is made from various unique materials, such as biopolymers and carbon sheets produced from activated carbon, making it semi-permeable. To avoid biofouling by microorganisms in wastewater, the membrane is fabricated using sulfonated graphene oxide and polyvinylidene fluoride [22].
Cathodes use electrons and ions from the anode to sustain the cell reaction. In microbial fuel cells, cathodes typically do not have microorganisms, except in cases where methane production is the goal and methanogens are introduced near the cathode [15]. The cathode plays a crucial role in the microbial fuel cell, as the reactions occurring at this electrode determine the energy output [23]. These reactions depend on an oxidant, usually oxygen or air, which is supplied to the cathode compartment to facilitate the reaction and utilize the products generated at the anode [15]. Figure 1 shows the basic setup of a microbial fuel cell.
MFC is a tool for generating electrical energy from organic matter using the catabolic activity of microorganisms. At the anode, organic matter is oxidized by electrochemically active microorganisms and releases electrons [24]. The generated electrons are then transferred to the cathode through an external circuit and generate electricity. Many models are designed for MFC, but they can be roughly divided into two categories: double-chamber and single-chamber [25].
2. Methods
2.1. Modeling
To model an MFC in the wastewater treatment process, both MFCs structure and wastewater conditions need to be considered since the output of the MFCs depends not only on the internal condition of the MFC but also on the wastewater properties [26]. Six parameters, including inflow velocity (Qs), membrane thickness (Lf), MFCs internal resistance (Ω), hydraulic retention time (HRT), anode surface area, and feed concentration, were discussed in the study.
The choice of substrates is a pivotal factor in MFC, significantly influencing electricity generation. MFC technology offers the flexibility to employ diverse substrates for enhancing energy production, including both individual compounds and intricate blends derived from organic components found in wastewater. The primary objective of all treatment procedures is to minimize water pollutants, rendering them suitable for both practical use and environmental preservation.
To simplify the simulation of MFCs, it is assumed that wastewater is oxidized in the anode, and a reduction in dissolved oxygen is present in the cathode. In an anode chamber, the chamber is operated under anoxic or anaerobic conditions, where a Monod-type equation is adopted. Based on the wastewater properties of the Guelph WWTP, several compounds are recognized as substrates for MFC. Equations (1)–(3) represent the anode reaction based on different substrates (acetate, butyric, and propionic acid) separately. Equation (4) shows the cathode reaction.
CH3COOH + 2H2O → 2CO2 + 8H+ + 8e−
CH3CH2COOH + 4H2O → 3CO2 + 14H+ + 14e−
CH3CH2CH2CH2COOH + 8H2O → 5CO2 + 36H+ + 36e−
O2 + 4e− + 2H2O → 4OH−
Furthermore, since both anode and cathode reactions are electrochemical reactions and are controlled by electrical potential, the Butler–Volmer expression is applied for simulation [27]. Moreover, the Nernst–Monod term was used for the rate of microbial reaction Equation (5),
Equation (5) comprises symbols representing various parameters: stands for the maximum specific substrate consumption rate (mgCOD∙(mgVS∙day)−1). represents the volume fraction of active bacteria within the biofilm (dimensionless). KSED signifies the half-maximum rate of substrate concentration (mgCOD∙cm−3). F is the Faraday constant; R stands for the ideal gas constant. T represents the temperature in Kelvin (K). SED is the concentration of substrate (mgCOD∙cm−3).
In order to define the maximum voltage under different parameters, the bioelectrochemical kinetics and charge and mass balance of the fuel cell are applied. Compared to the forward reaction, the reverse reaction in MFCs is insignificant, and only the forward reaction will be used in the simulation [28]. Equations (6) and (7) represent the rate of reaction in the anode and cathode, respectively:
where ka and kc are the rate constants of the anode and cathode reaction under standard conditions, ηa and ηc are the overpotential at the anode and cathode. X represents the concentration of biomass in the anode chamber. In contrast, Ca and Co represent the substrate concentration in the anode and the dissolved oxygen concentration in the cathode. Ka and Ko represent the half velocity rate constant for the substrate and dissolved oxygen, respectively. There are also several constants in the equation: F, the Faraday constant; R, the gas constant; and T, for operating temperature. Moreover, α represents the charge-transfer coefficient of the anode reaction, and β is the charge-transfer coefficient of the cathodic reaction [28].
Equation (8) illustrates the substrate mass balance within the anolyte, while the movement of the substrate to the biofilm is characterized by the alteration in substrate concentration within the bulk of the anolyte:
where Vanode, Aanode SED,sol and JED represent the volume of the anode chamber (cm3), the surface area of anode electrode (cm2), concentration of substrate in bulk anolyte (mgCOD∙cm−3) and flux of substrate entering the biofilm (mgCOD∙(cm−2∙day)), respectively [29].
It is also assumed that carbon dioxide and acetate do not diffuse into the membrane, and the gas phase formed by releasing carbon dioxide bubbles is not considered. Therefore, four components in the anode compartment need to be balanced, i.e., substrate, dissolved CO2, hydrogen ions, and biomass. In comparison, the cathode compartment has two components, i.e., dissolved oxygen and hydroxide ion. After mass balancing and charge transfer, the current density and the flux of ions transferring the membrane can be simulated [30] by using Equation (9) where zn is the charge number of the nth species; Nn is the superficial flux of the nth species, and the cell voltage can be simulated by using Equation (10) [28]:
where and d are the thickness of the membrane and the distance between the electrodes. km and ks are the conductivities of the membrane and the solution, respectively, and U0 is the open-circuit voltage.
2.2. Data
All analyses in this study are based on the wastewater data from Guelph WWTP. The Guelph WWTP initiates its process with preliminary screening and grit removal, followed by primary treatment through sedimentation. Subsequently, a secondary treatment phase employs conventional and extended activated sludge methods, complemented by a two-stage tertiary treatment involving rotating biological contactors (RBC) and sand filtration. The liquid extracted during dewatering follows a separate treatment procedure, Anammox, designed to lower ammonia concentrations. Before being directed to primary digesters, the waste-activated sludge is compacted. In terms of disinfection, sodium hypochlorite is incorporated into the treated water, and prior to releasing the water into the receiving body, sodium bisulfite is introduced to eliminate chlorine [10]. Wastewater enters the facility through two main sanitary trunk sewers and is elevated to the Headworks using Archimedes screw pumps for initial treatment involving screening and grit removal. After the Headworks stage, the flow is divided among four designated plants with capacities of 16,000, 13,000, 13,000, and 22,000 cubic meters per day, respectively [10]. The wastewater undergoes primary and secondary treatment through conventional activated sludge processes. Chemical phosphorus removal is accomplished by using a system that injects ferric chloride at two different points. The secondary effluent from Plants 1, 2, and 3 comes together upstream of rotating biological contactors (RBCs), which facilitate ammonia removal through nitrification. For Plant 4, ammonia removal happens during the secondary treatment.
Plant 4’s secondary effluent is managed based on its flow rate. If the flow rate is below a certain threshold, it is directed to the RBCs. Once the combined flow from Plant 4 and the RBCs reaches a certain point, excess flow from Plant 4 is sent directly to tertiary sand filters. The filtered effluent goes through disinfection using sodium hypochlorite, followed by de-chlorination using sodium bisulfite before being released into the Speed River. The sludge generated in the primary clarifiers is thickened, while waste-activated sludge (WAS) settling in the secondary clarifiers is thickened using a rotating drum thickener (RDT). After thickening, the sludge undergoes anaerobic digestion in primary digesters and then flows to secondary digesters via gravity. The digested sludge is drawn and dewatered from there using belt filter presses [10].
Connected with the electrochemical reactions, a sequence of biochemical processes involving microbial cells occurs in a suspended state and as an attached biofilm. Given that the MFC model is designed to simulate an anaerobic anode system utilizing a microbial community extracted from an anaerobic wastewater treatment process, the biochemical model is founded on the International Water Association’s activated sludge model number 1 (ASM1) [31]. This involves the conversion of glucose into short-chain carboxylic acids (such as butyric and propionic acids), followed by the generation of acetate and, subsequently, the process of methanogenesis, including the conversion of hydrogen. Additionally, it is presumed that an electroactive microbial community (X) can oxidize acetate using a mediator as an electron acceptor, thereby contributing to electrical current production [32]. By applying the raw wastewater data into ASM1, a more detailed input acid concentration for MFC can be simulated. Table 2 summarizes the detailed input concentration generated by ASM1.
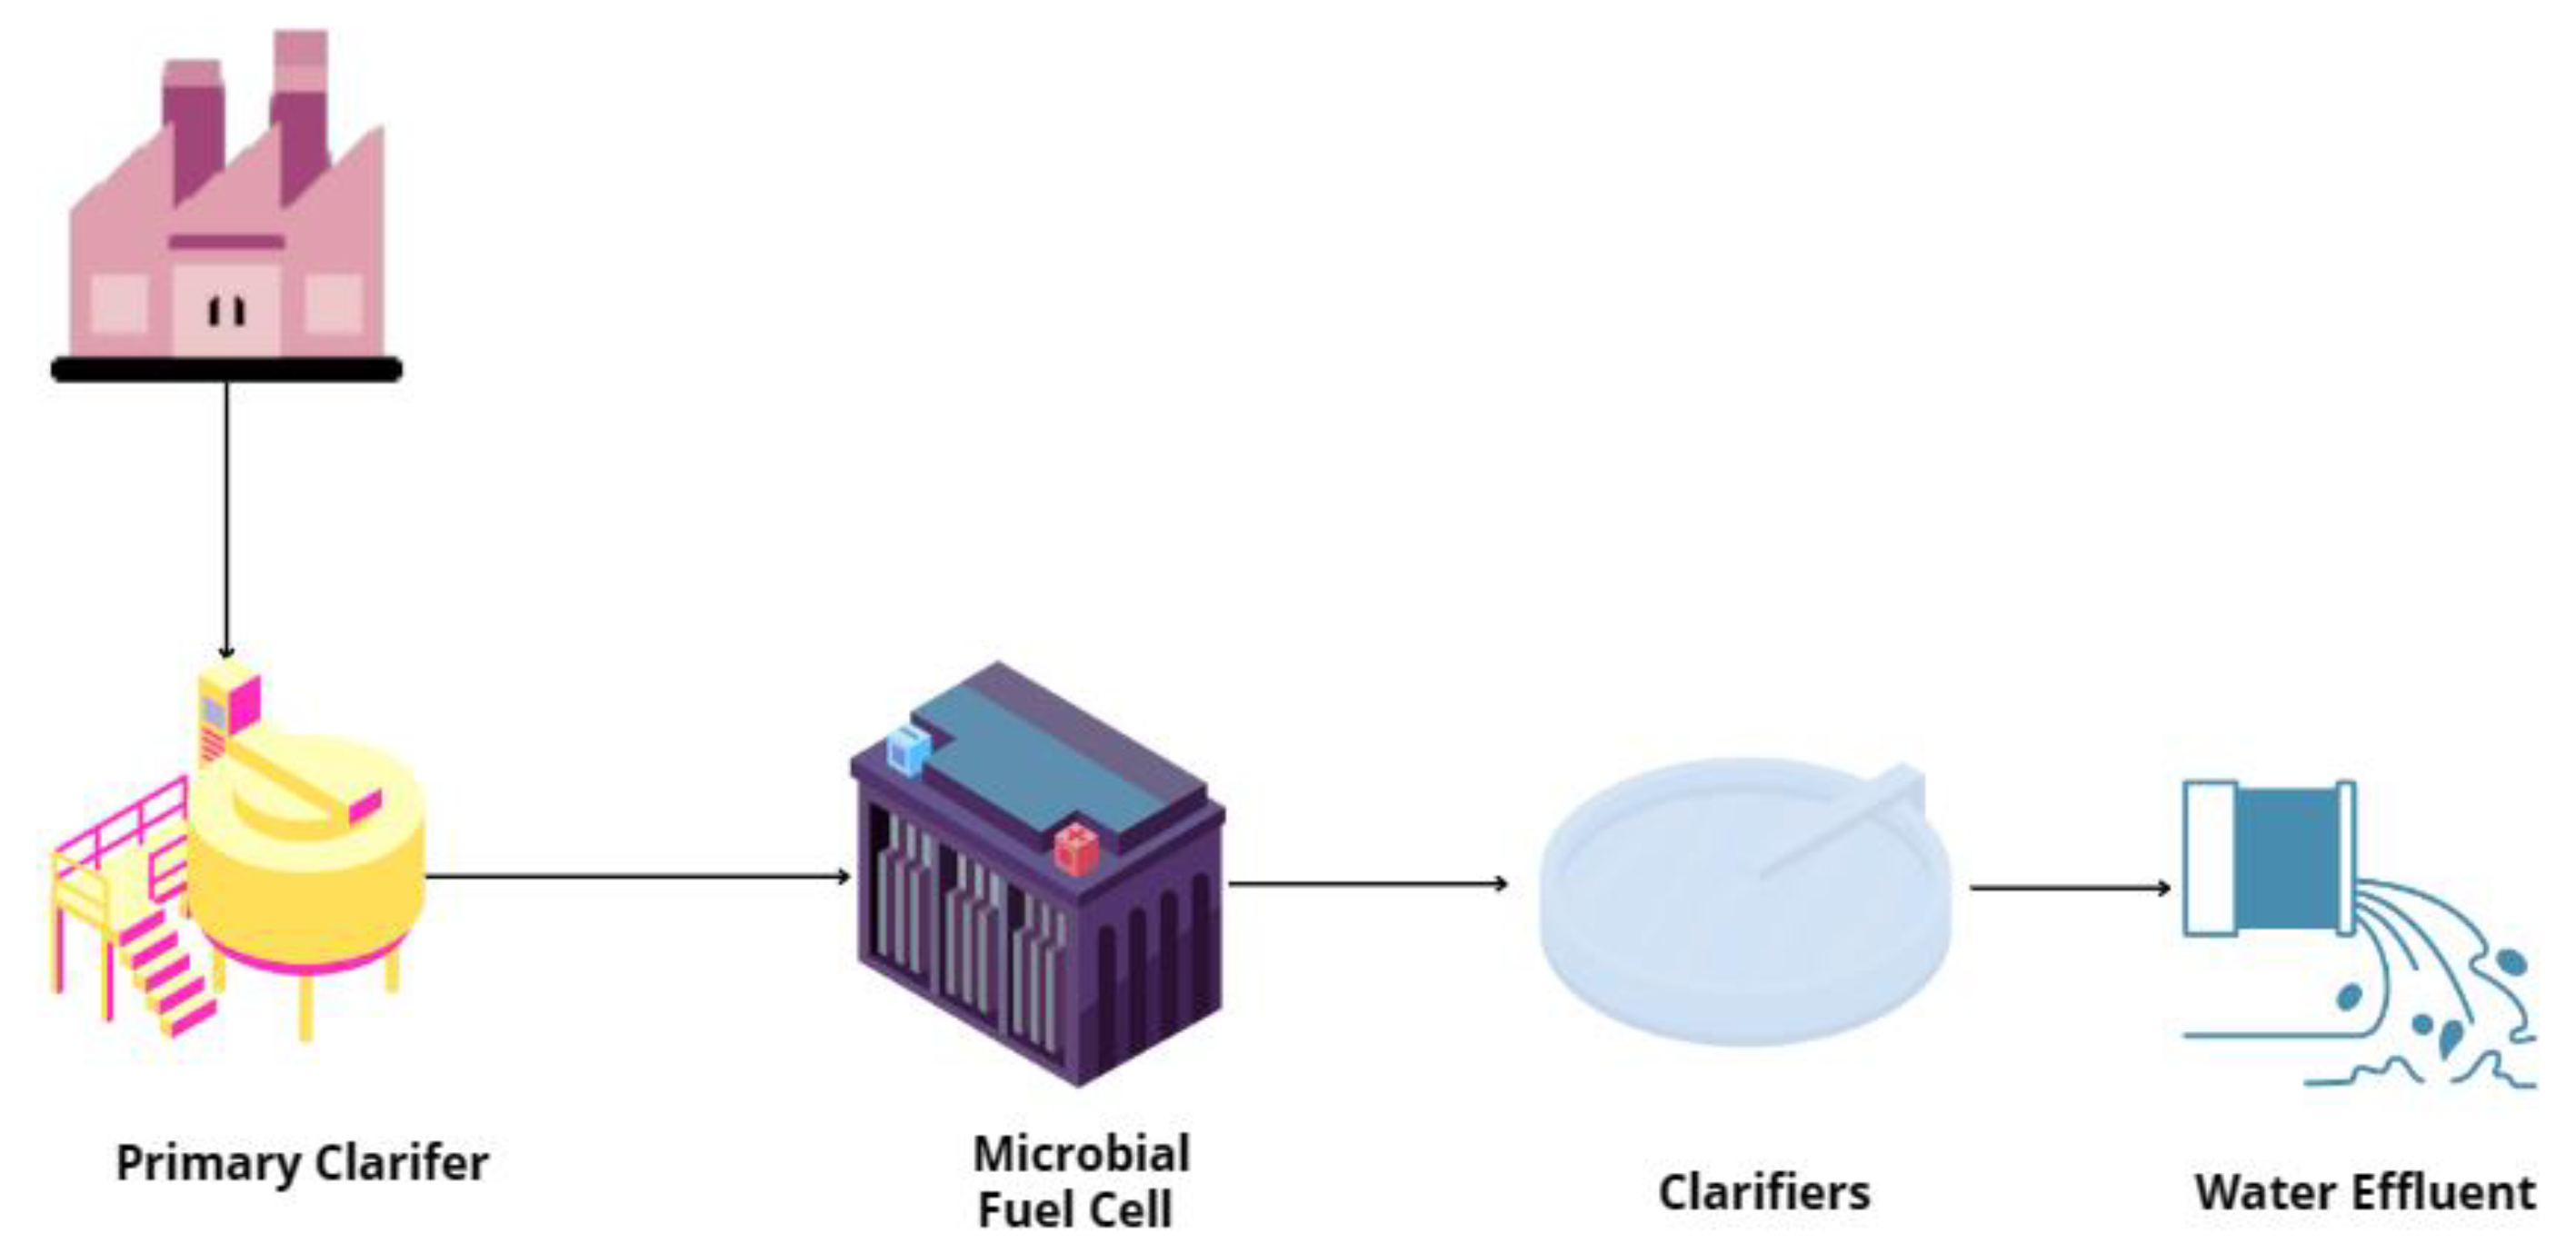
Furthermore, building upon the foundational Guelph wastewater treatment plant procedure, a revised schematic integrating an MFC system has been developed, as shown in Figure 2. Following the primary clarification stage, the wastewater stream is directed towards the MFCs system instead of the conventional aeration basins, aimed at enhancing energy efficiency. The study also includes an evaluation of the COD removal rate, comparing the original WWTP process with the newly proposed design incorporating MFCs. The MFC shown in the flowsheet represents the stacked MFC system.
All fixed operating conditions and parameters used during the simulations are listed in Table 3 for the modeling system. Since the electrical conductivity of the aqueous solution (ks) is not sensitive to the simulation result, ks is assumed based on theoretical data during the simulation and parameters of the capacitances of the anode and cathode.
3. Results and Discusstion
3.1. Parameter Testing
Before simulating the power generation for the wastewater treatment plant, several different pre-tests focusing on different parameters are generated using the MATLAB model to test the model and find the best model to maximize the power output. Moreover, to increase the accuracy of each test, the raw wastewater data applied for the pre-test is only for 1 L. The first test aims to find the relationship between inflow velocity and voltage output. The operational time for MFC is set as a constant of 12 h, and three different velocities are chosen as the variables, Qs equal to 5 mm∙s−1, 10 mm∙s−1 and 20 mm∙s−1.
As shown in Figure 3, the maximum voltage output for Qs equal to 20 mm∙s−1 is the highest, which is 0.1785 V, while the other two tests only have a maximum voltage output of around 0.173 to 0.174 V. Increased inflow velocities encourage improved mixing of wastewater within the MFC, leading to a more even distribution of substrates across the anode surface. This enhanced mixing prevents localized depletion of substrates, which might otherwise hinder bacterial activity and the production of electrons. It is noteworthy that even though the differences between each simulation case are only around 0.01, this is still a very significant change, as the simulation cases are evaluated on a small scale. The change would become more noticeable and significantly influence the output after applying the full scale of wastewater data.
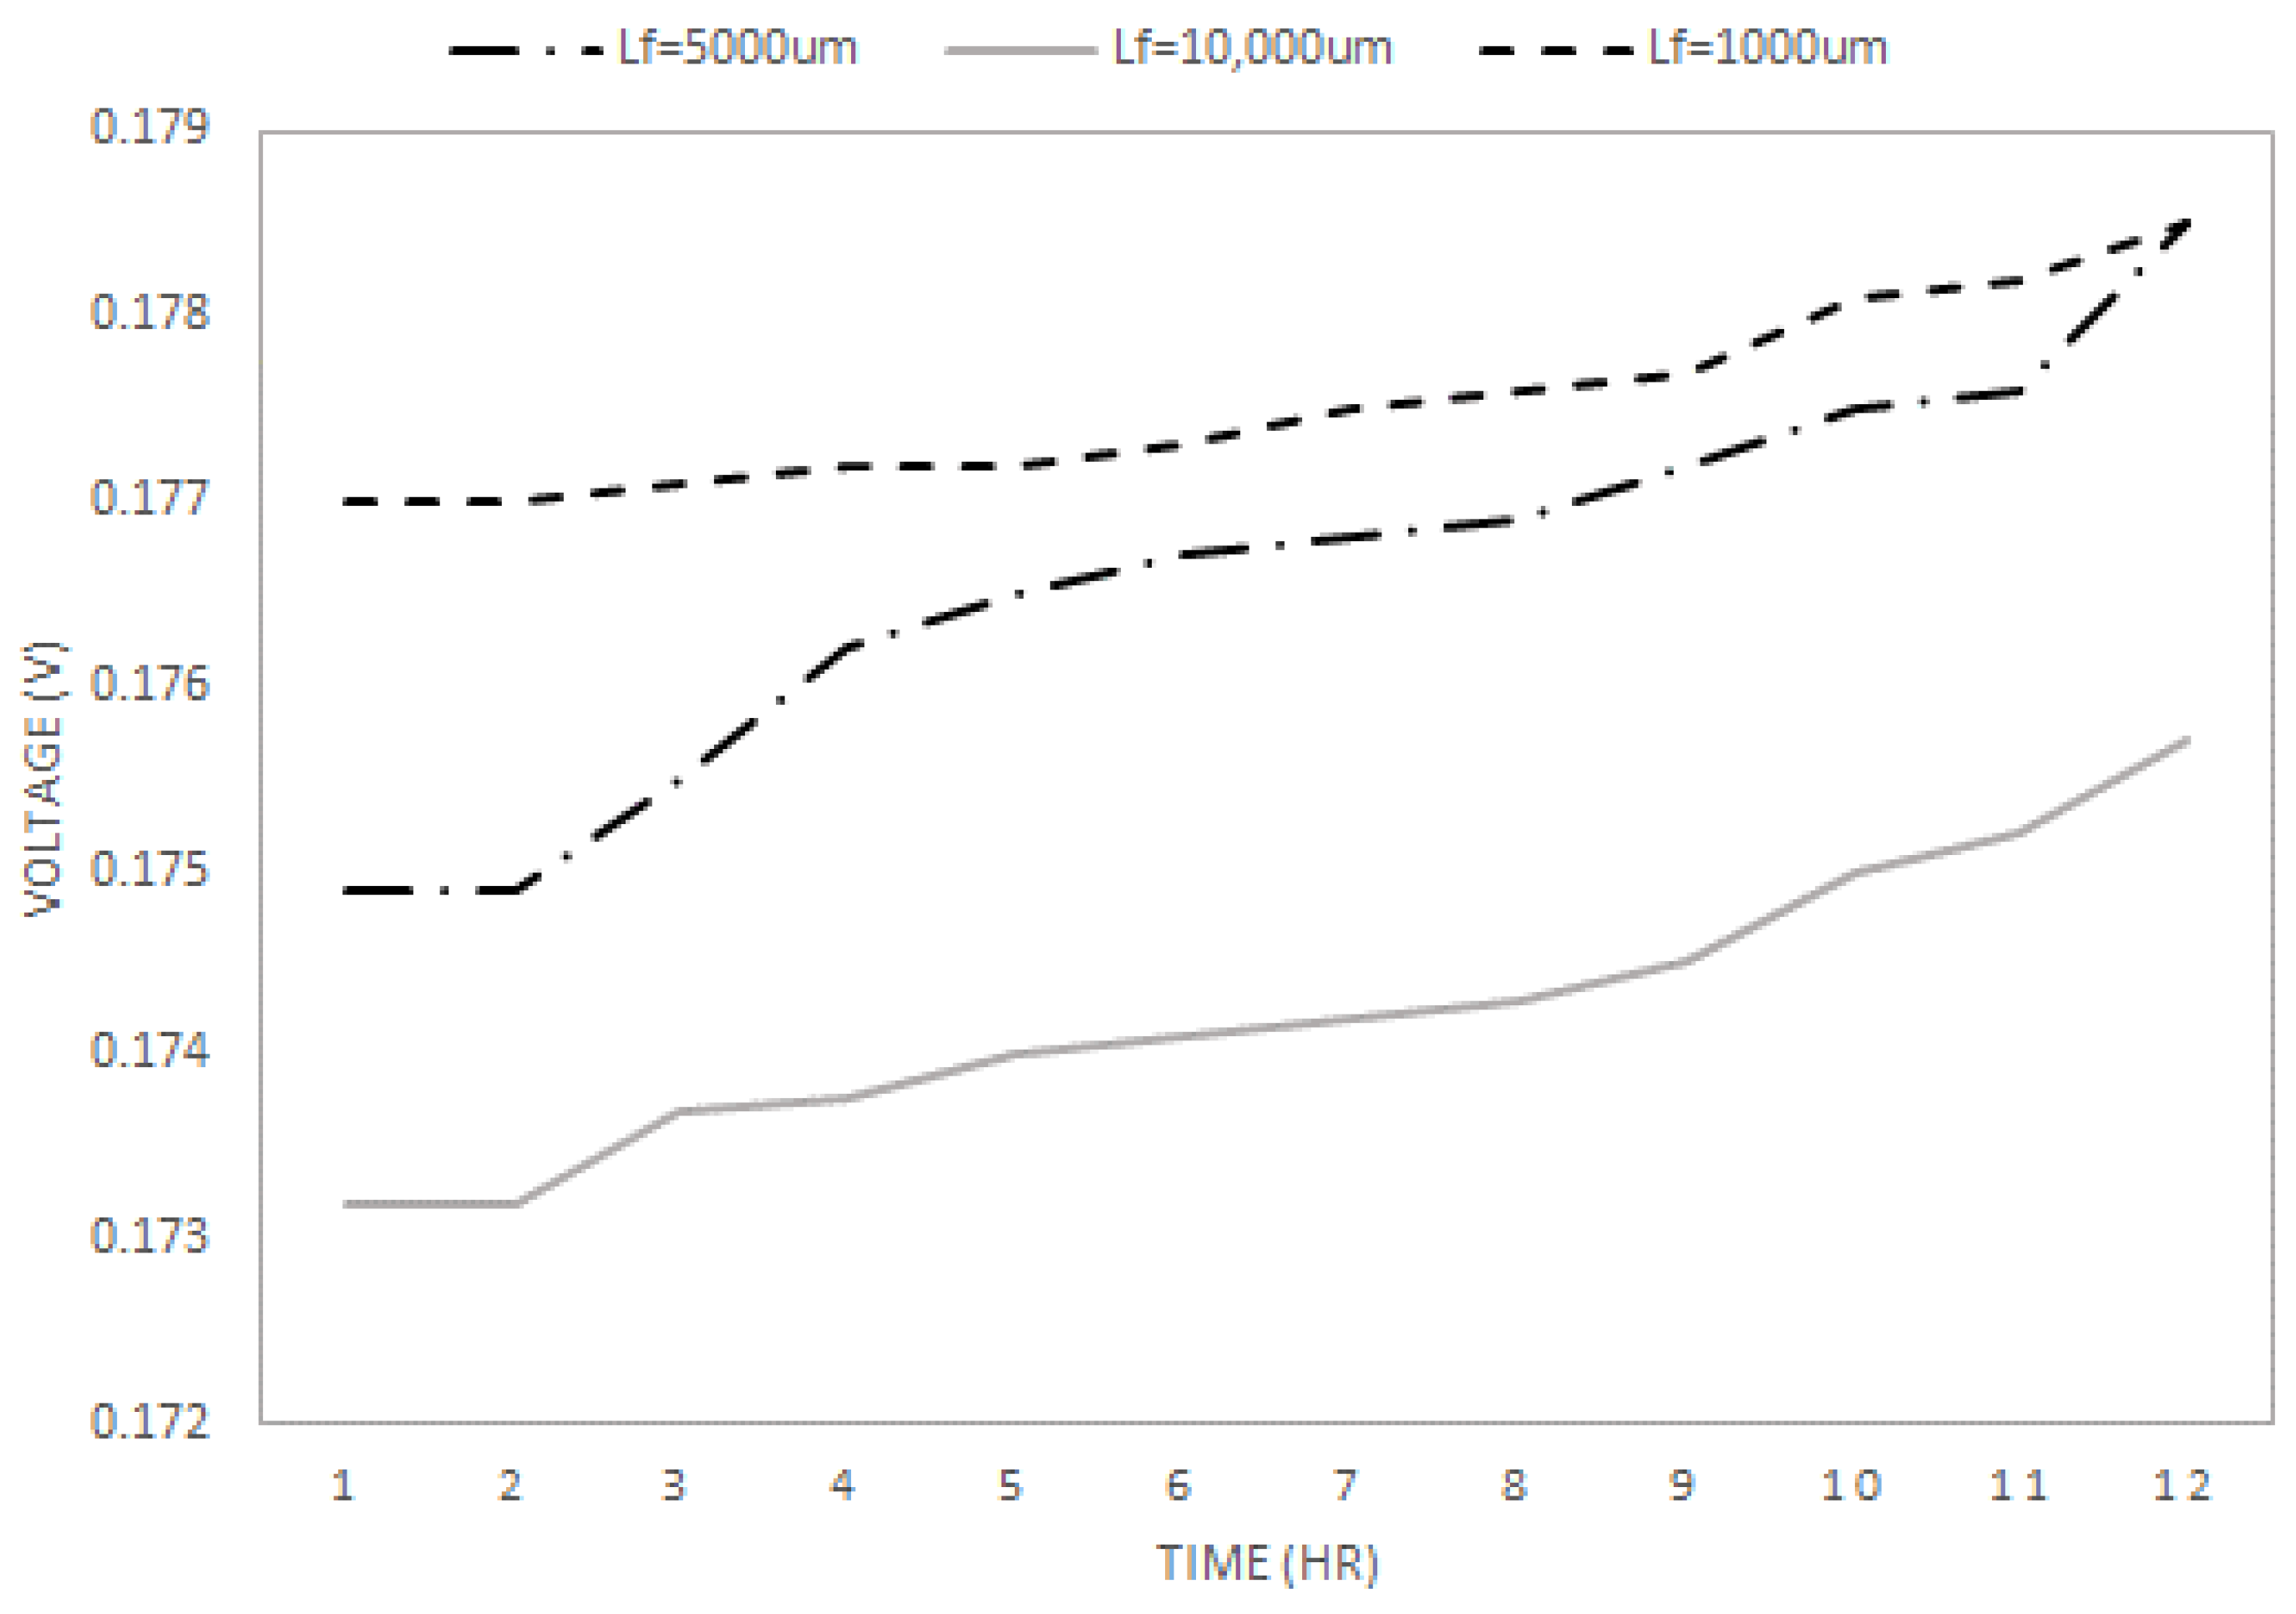
The second test applies constant Qs of 20 mm∙s−1 in the simulation to test the relationship between membrane thickness (Lf) and voltage output. Lf is chosen among 1000 µm, 5000 µm, and 10,000 µm. As shown in Figure 4, both the 1000 µm membrane and 5000 µm membrane lead to the highest voltage output of 0.1786 V, around 0.02 V higher than the 10,000 µm membrane. However, it can be seen that the start-up voltage of the 1000 µm membrane is much higher than the 5000 µm membrane, and it takes the 5000 µm membrane around 5 h to reach the same voltage output level as the 1000 µm membrane. Considering that, in reality, a shorter start-up time significantly increases the efficiency of the MFC system and helps increase the total voltage generation.
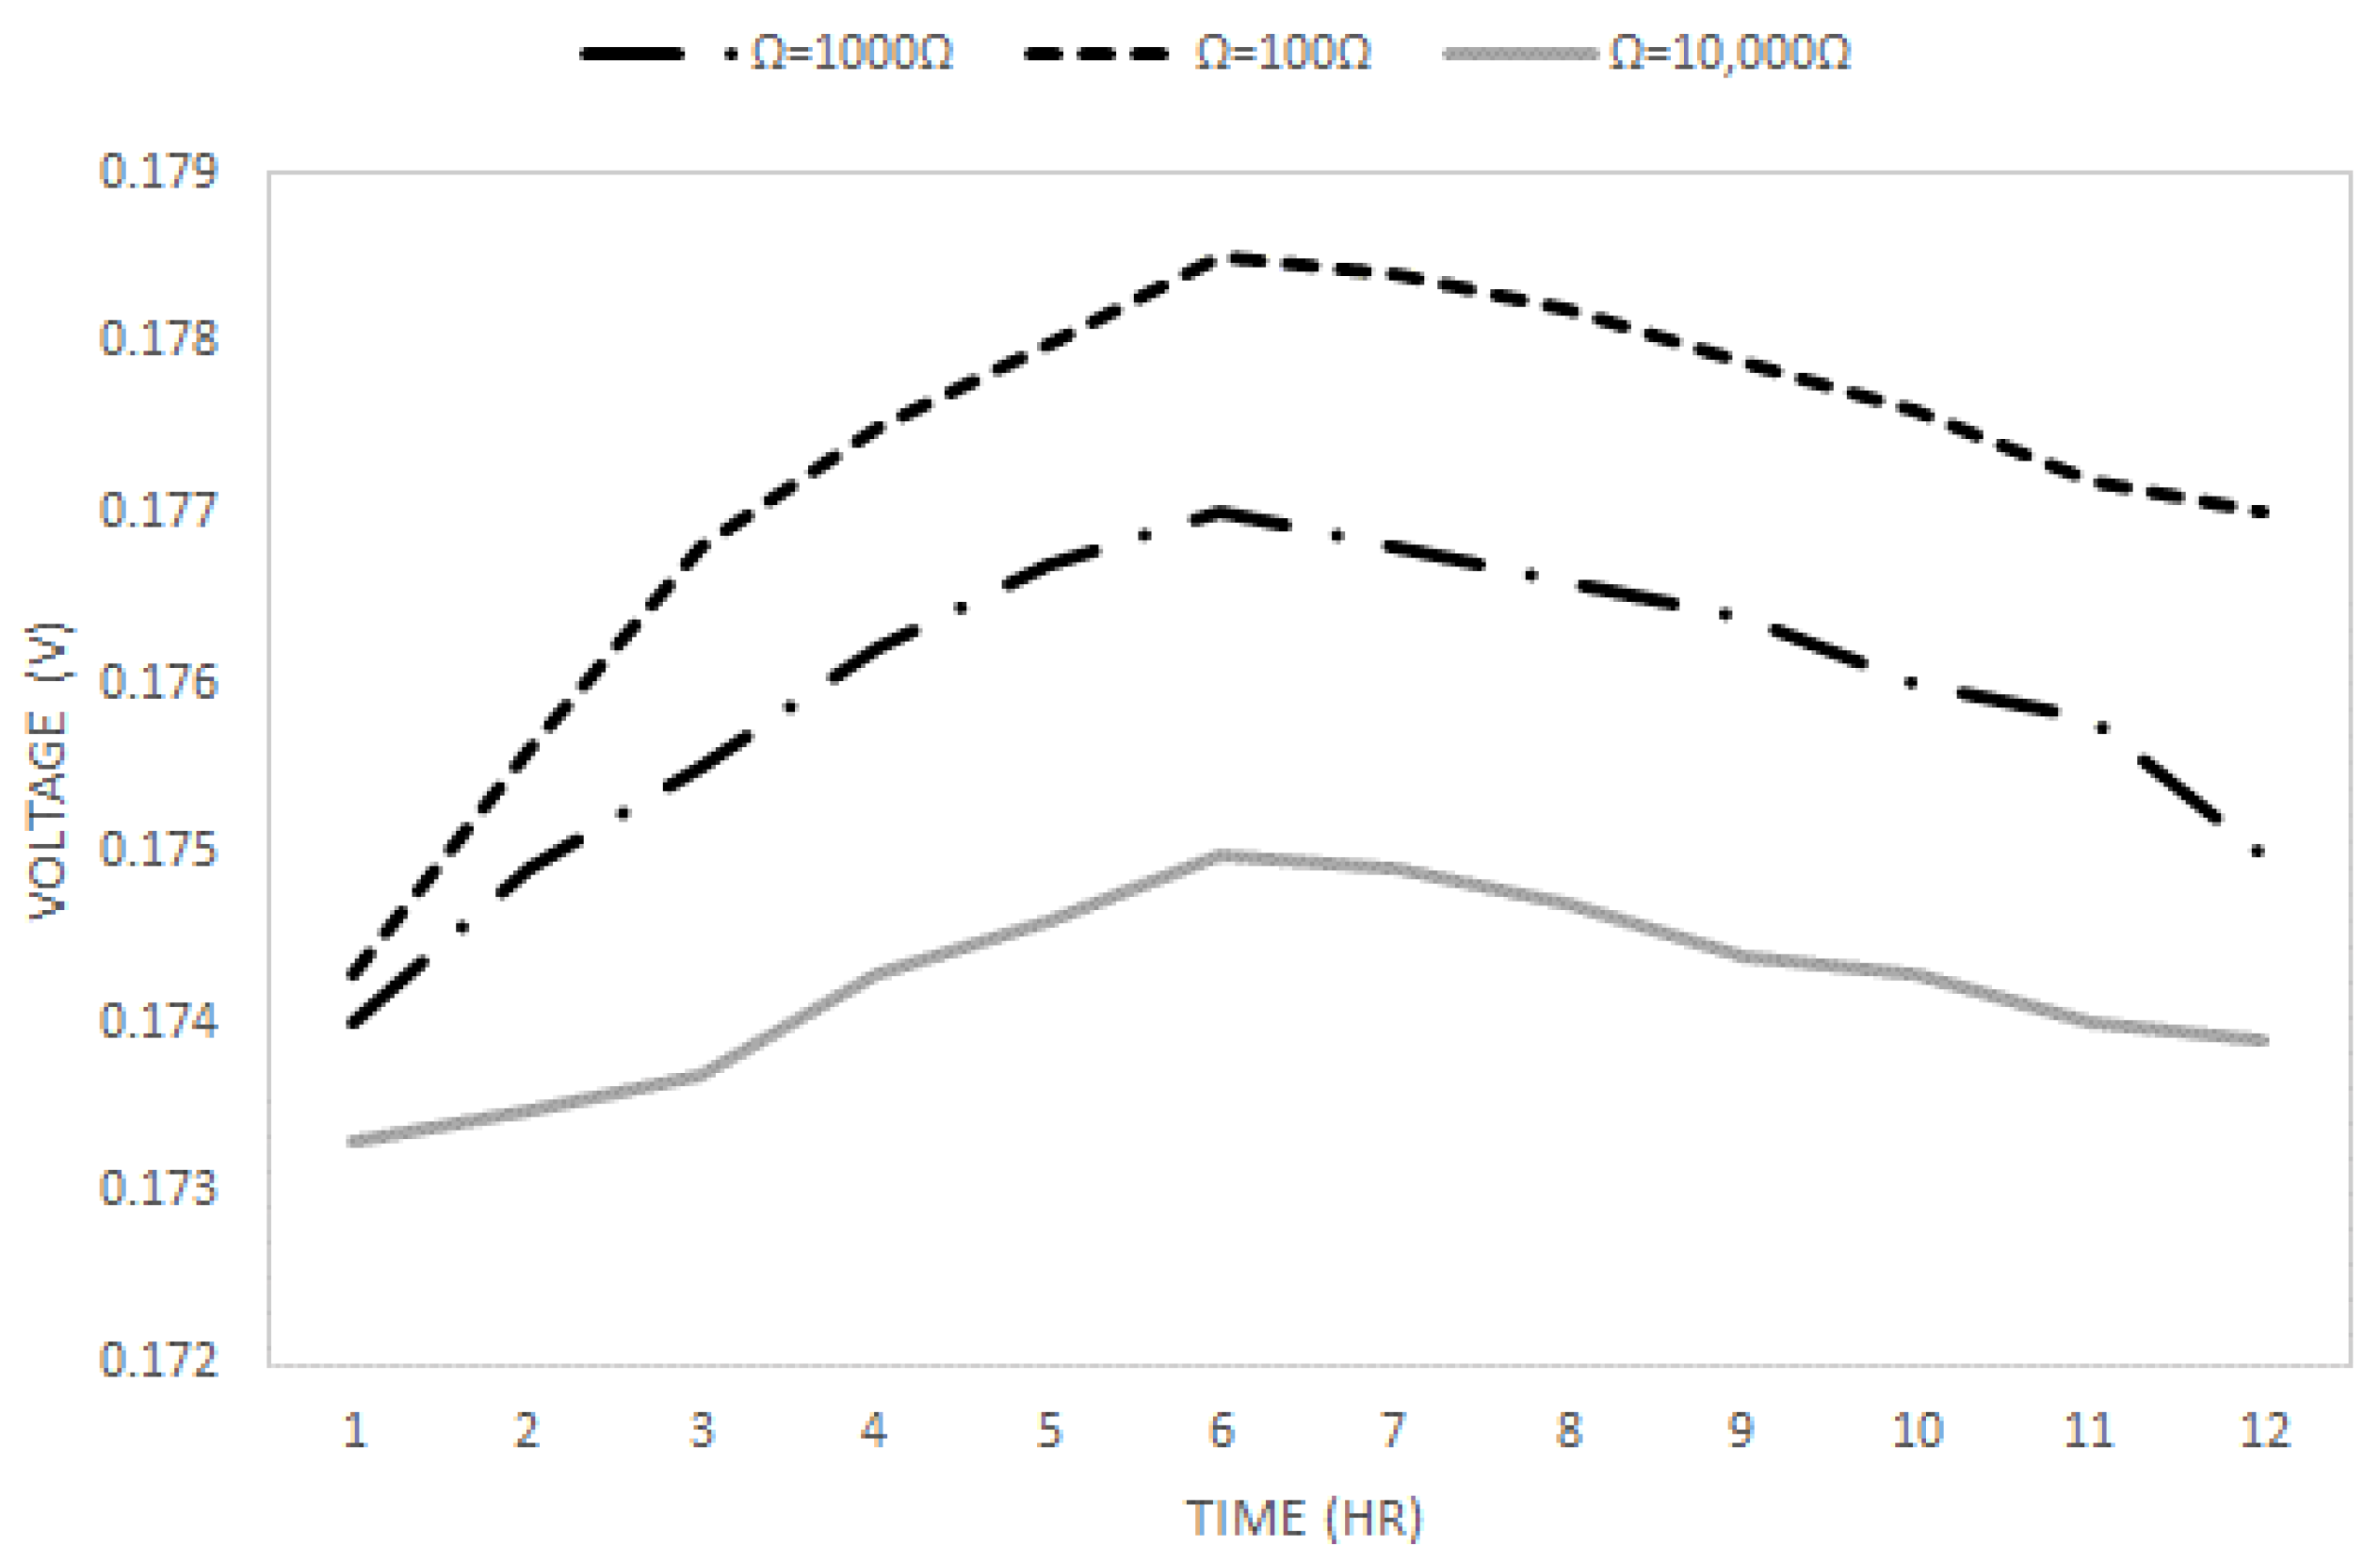
Pre-test 3 focuses on the internal resistance of the MFC after taking an inflow velocity of 20 mm∙s−1 and a membrane thickness of 1000 µm as constants. 100 Ω, 1000 Ω, and 10,000 Ω are selected in this test.
The final voltage generation difference between different internal resistances is not as significant as in the previous two tests, as shown in Figure 5. The maximum output ranges from 0.1745 to 0.1787 V, and 100 Ω has the highest voltage output of 0.1787 V. As mentioned previously, the case with the shortest start-up time is chosen to maximize the output when the maximum voltage output is similar.
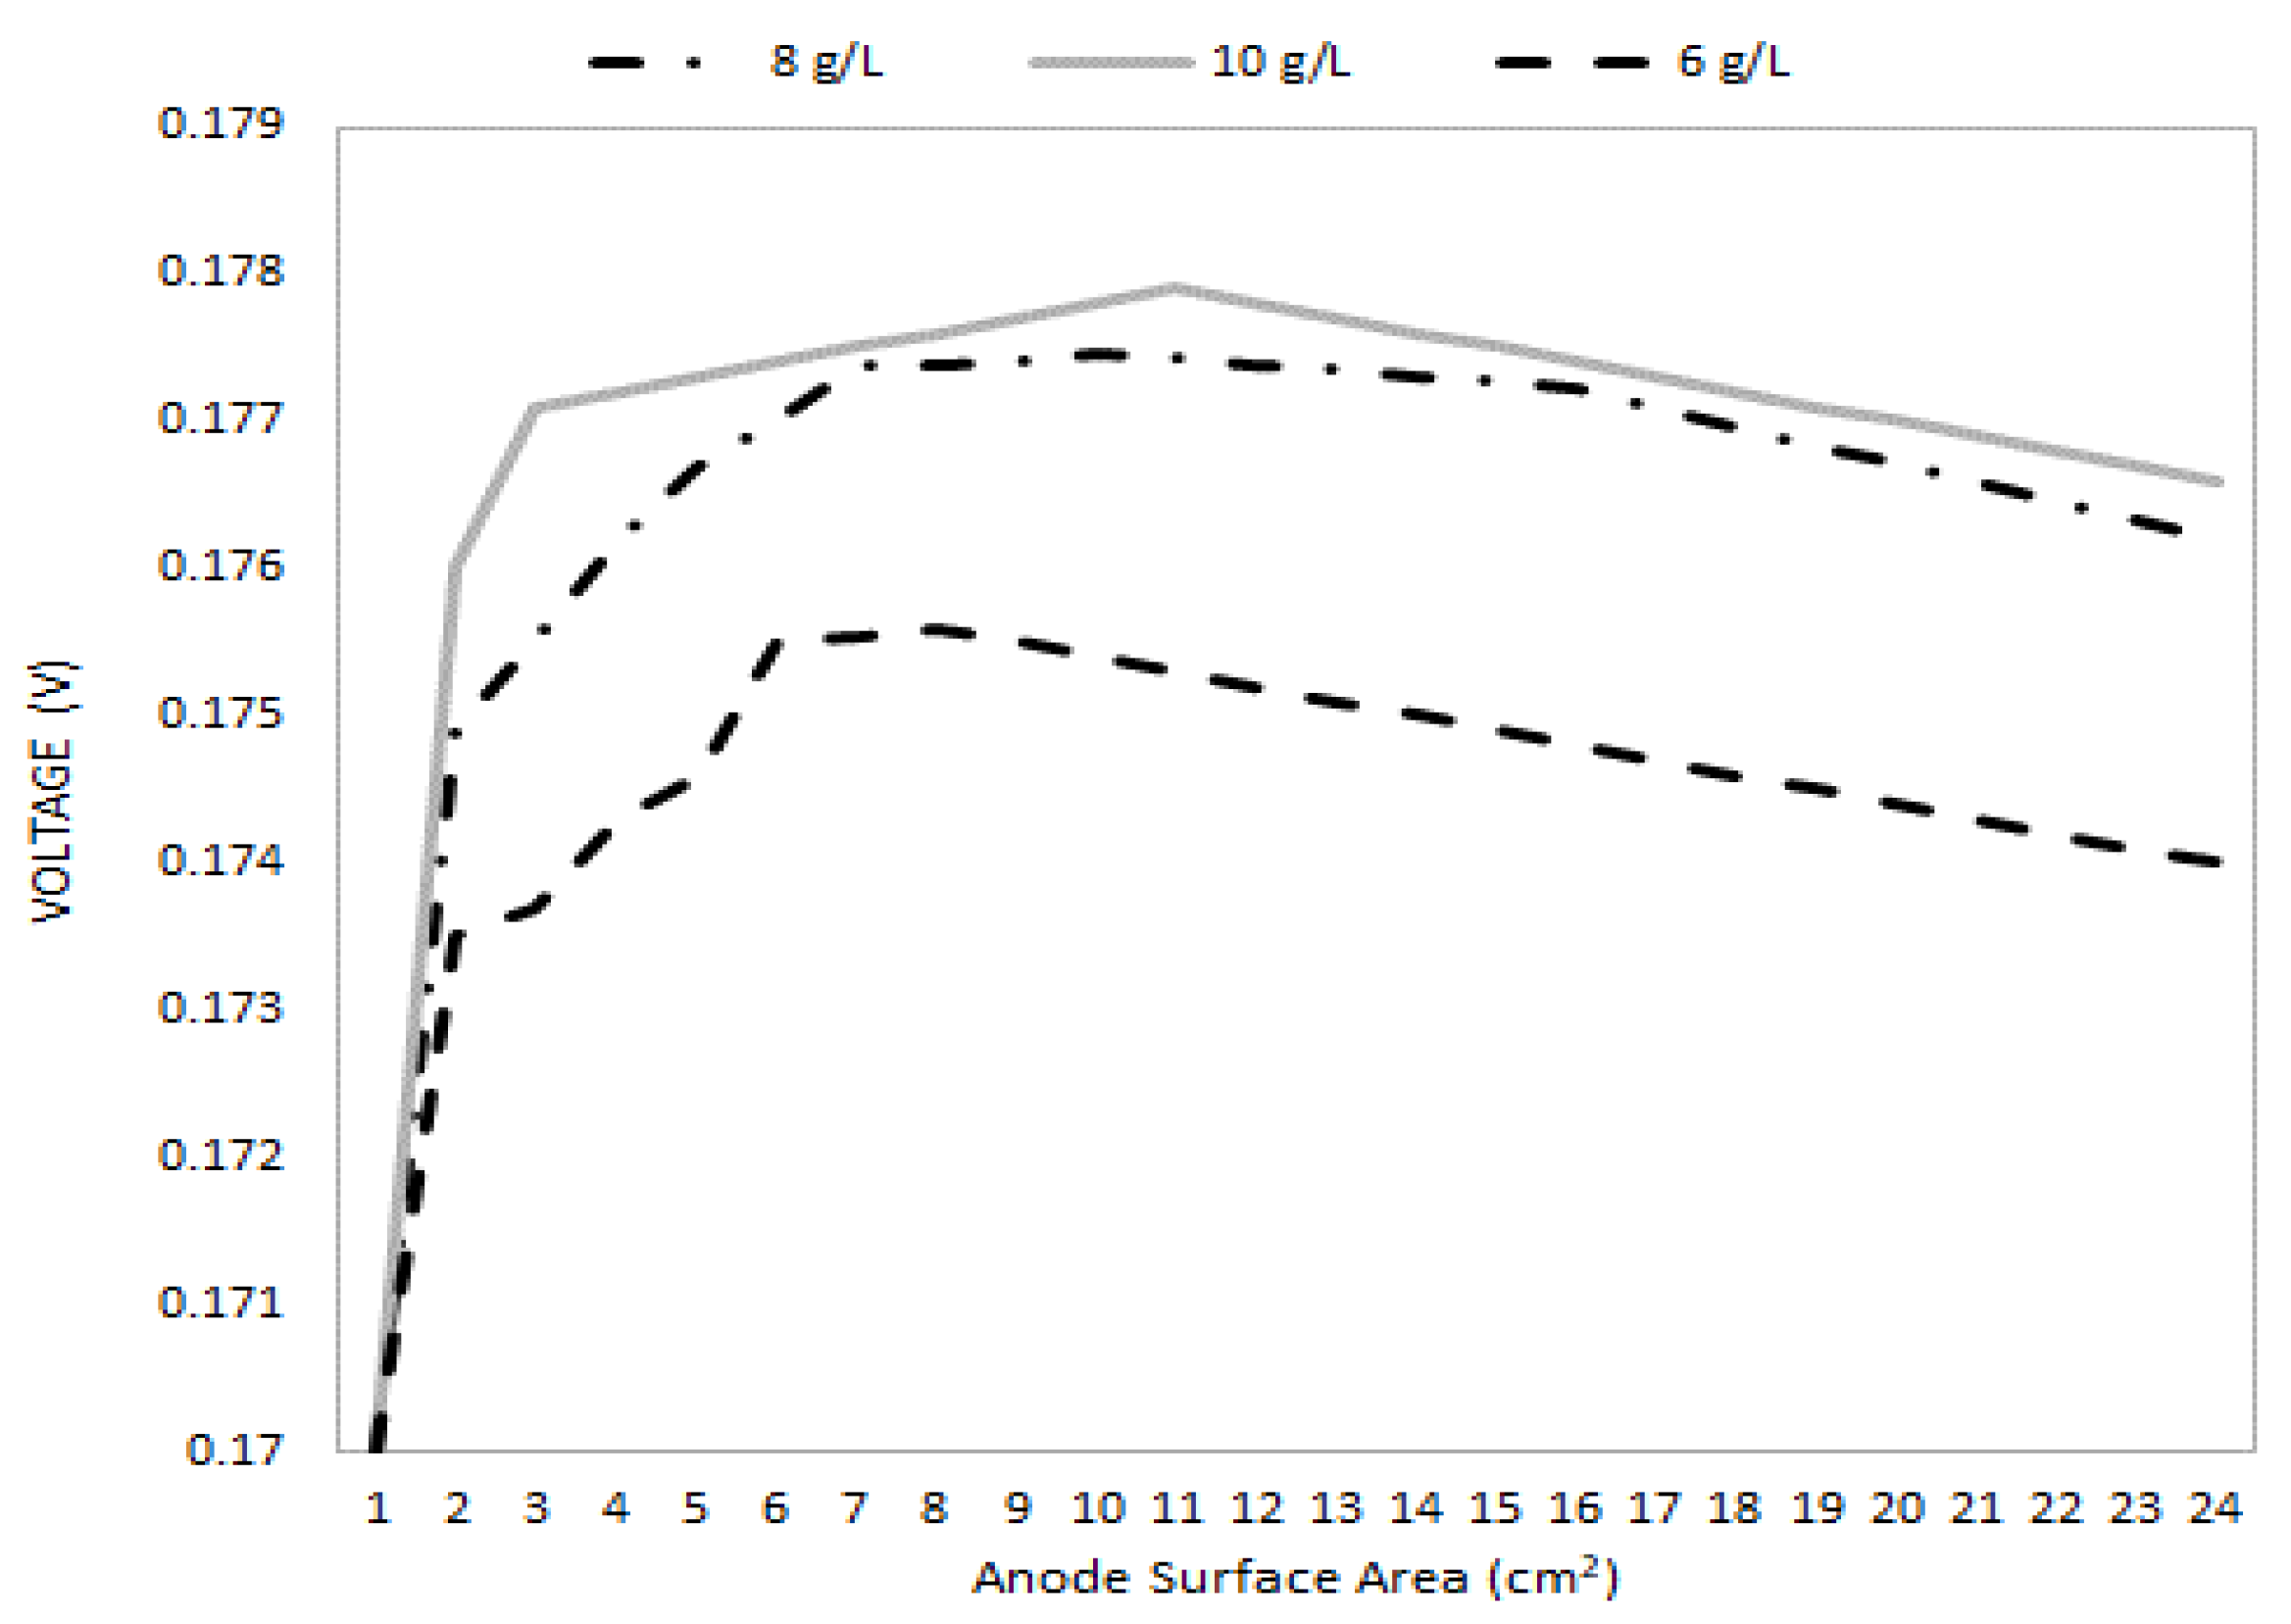
Test 4 focuses on the relationship between the anode surface area and the voltage output. Increasing the surface area of the anode results in a higher surface area for the biofilm and more active sites available for the reaction. The microorganisms within the biofilm function as chemical sites for the reaction. This test investigated the impact of anode surface area across a range from 1 to 24 cm2, and the modeling results, in terms of power and power density (power per unit area of the anode electrode surface), for three initial substrate concentrations, are depicted in Figure 6. As illustrated in Figure 6, increasing the anode surface area increased the generated power.
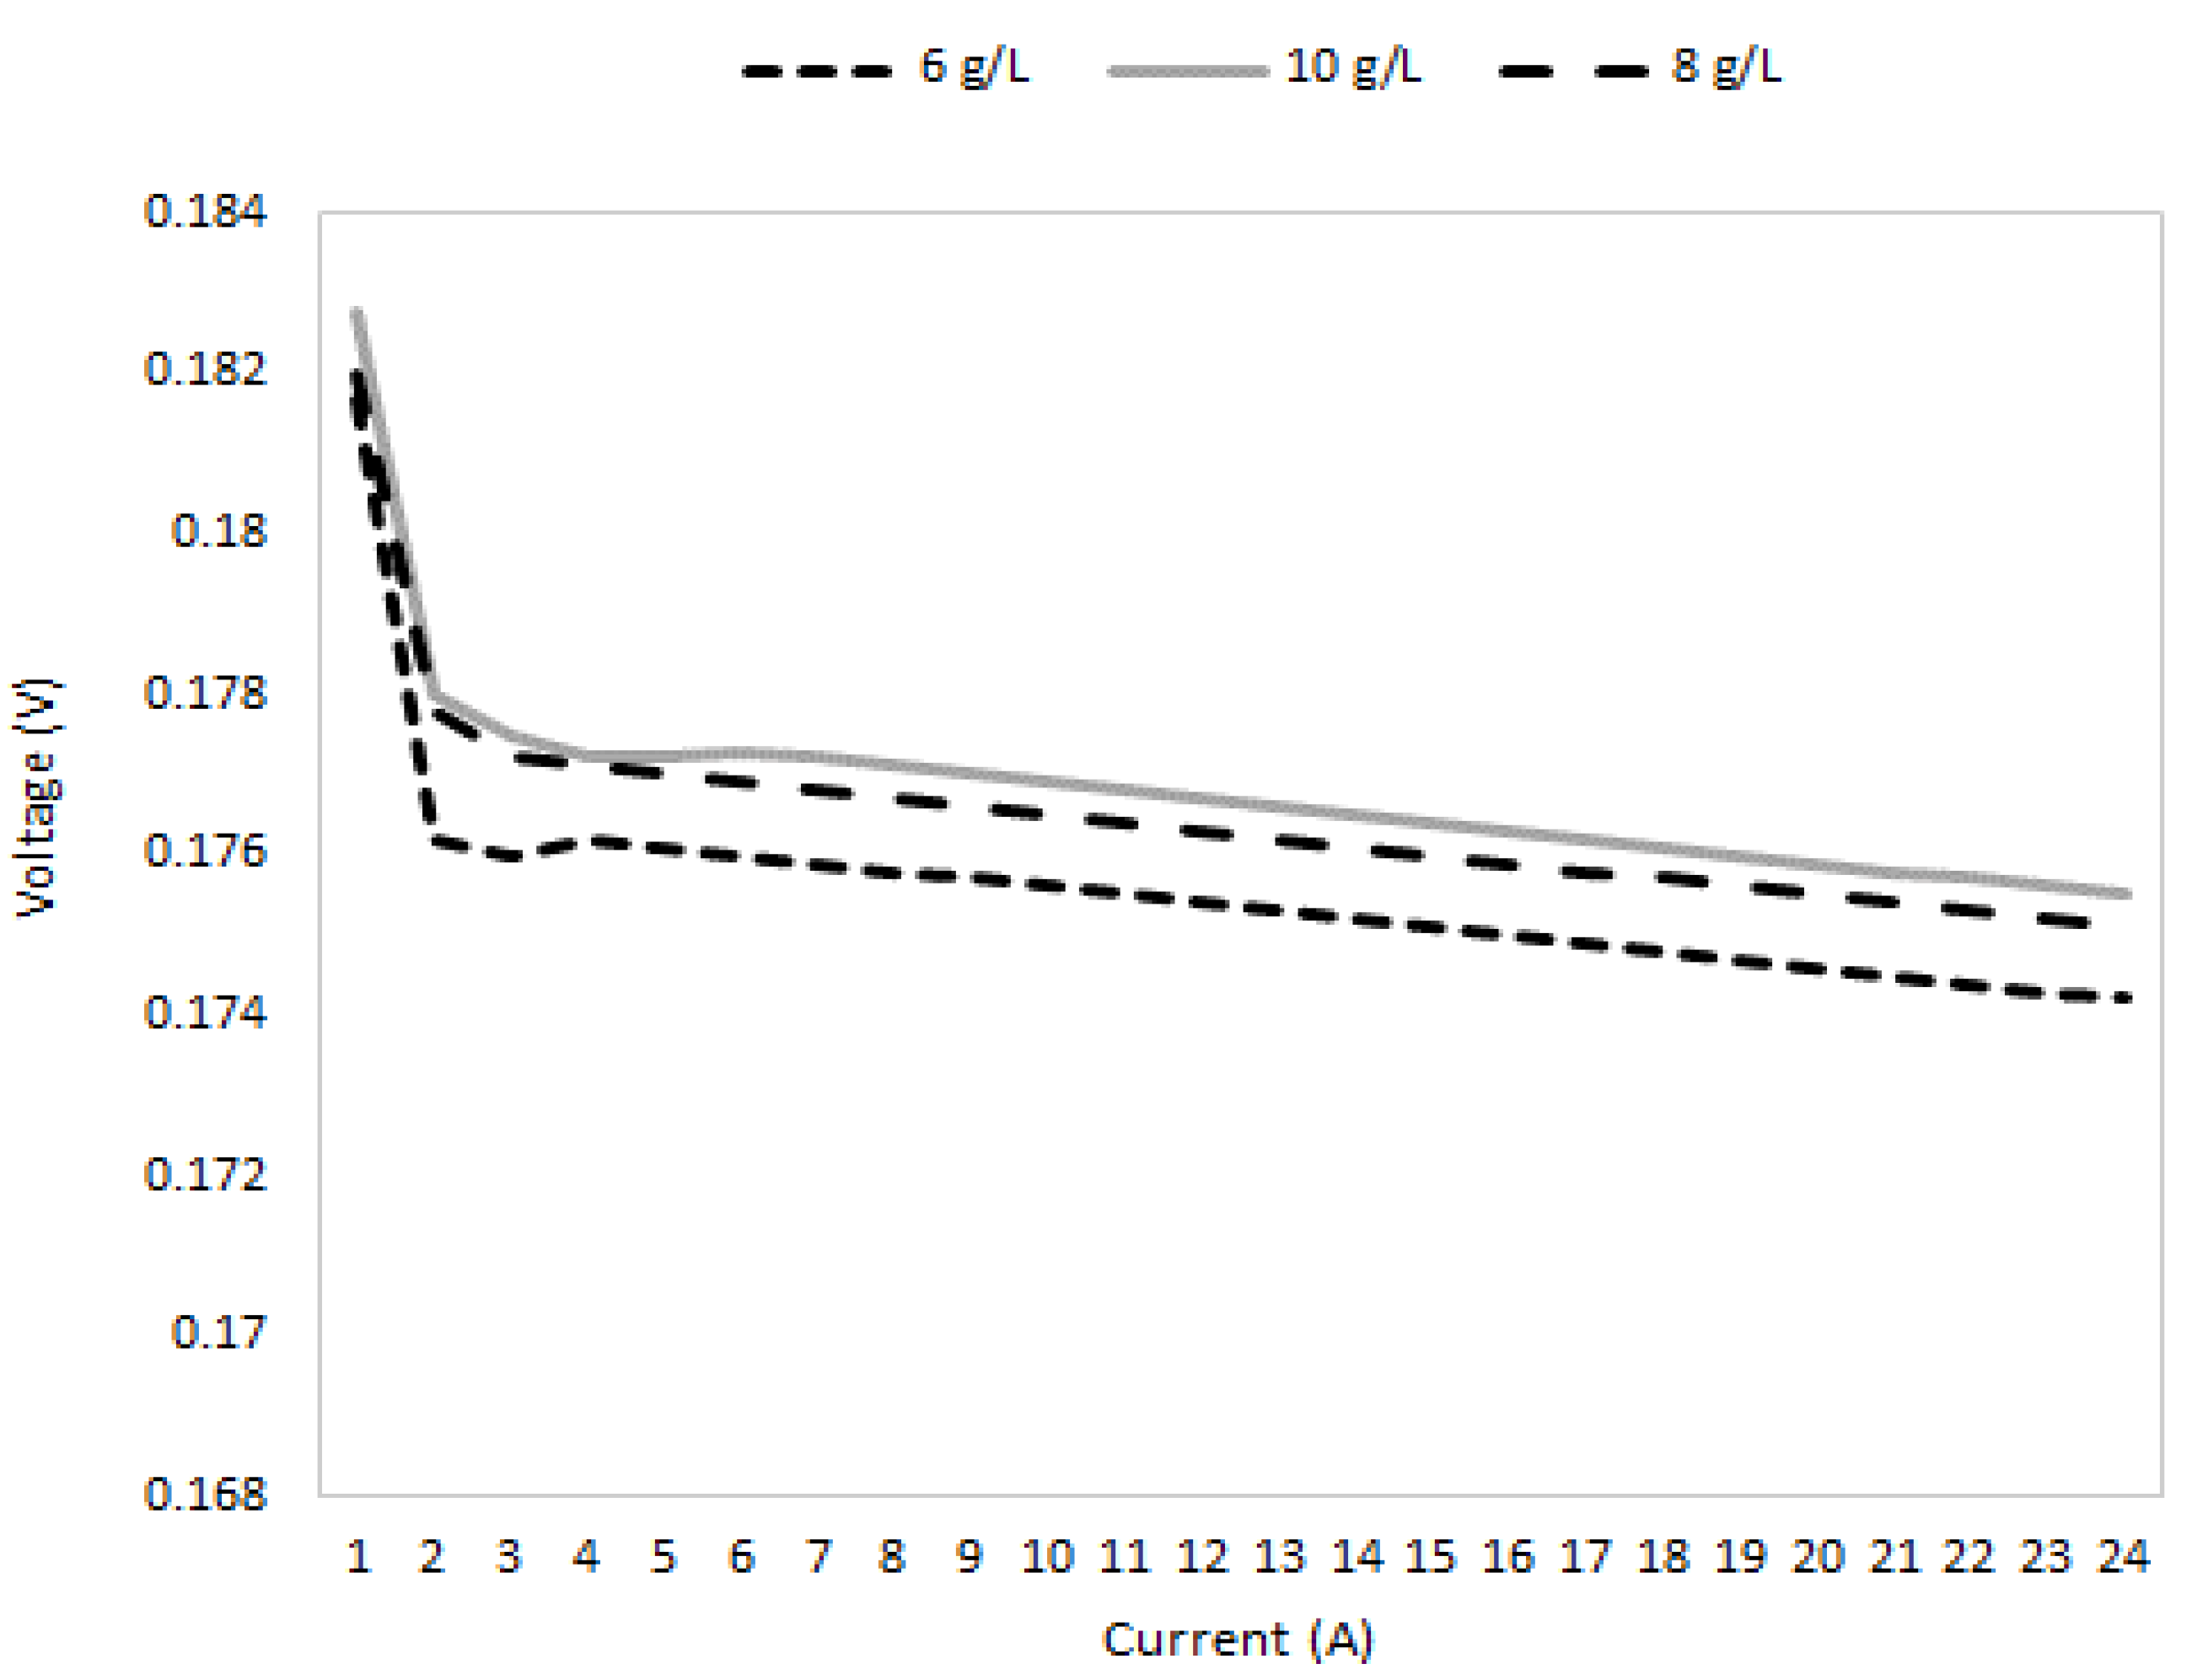
A study to examine how the feed concentration affects the electrical is also conducted. Three different substrates with different initial COD concentrations were examined in this test. According to the data presented in Figure 7, it is evident that feed concentrations in the lower range had a substantial impact on the generated power, specifically, when the feed concentrations were maintained within the lower range, a significant impact on the power output of MFCs was observed. This effect can be attributed to the availability of substrates for microbial metabolism [33]. At lower feed concentrations, the availability of organic matter as a substrate for bacterial oxidation may be limited, leading to reduced microbial activity and consequently lower power generation in MFCs. Therefore, maintaining optimal feed concentrations within the lower range is crucial for maximizing the power output and efficiency of MFC systems, as previously observed in studies by Wang et al. [33]. However, as the feed concentration increased into the higher range, the influence of feed concentration on power generation decreased.
Three different HRTs were chosen as parallel simulations in Test 6. The cell voltage rises as the hydraulic retention time (HRT) decreases. This is because a shorter HRT boosts microbial fuel cell (MFC) power generation by removing non-exoelectrogenic microorganisms. As these non-exoelectrogens are flushed out, more organic matter becomes available for exoelectrogenic bacteria to utilize in power generation. Conversely, exoelectrogenic bacteria may also be washed away when the HRT is longer, resulting in reduced power generation, as shown in Figure 8.
3.2. Sensitivity Analysis for Pre-Test Parameters
Sensitivity analysis plays a crucial role in enhancing the accuracy and reliability of mathematical models across various fields. By systematically studying how changes in input parameters affect model outputs, sensitivity analysis helps identify critical factors driving system behavior, quantify uncertainties, validate, and calibrate models effectively. In this case, the sensitivity analysis was applied to each parameter that was simulated in the above section to prove the accuracy and feasibility of the model.
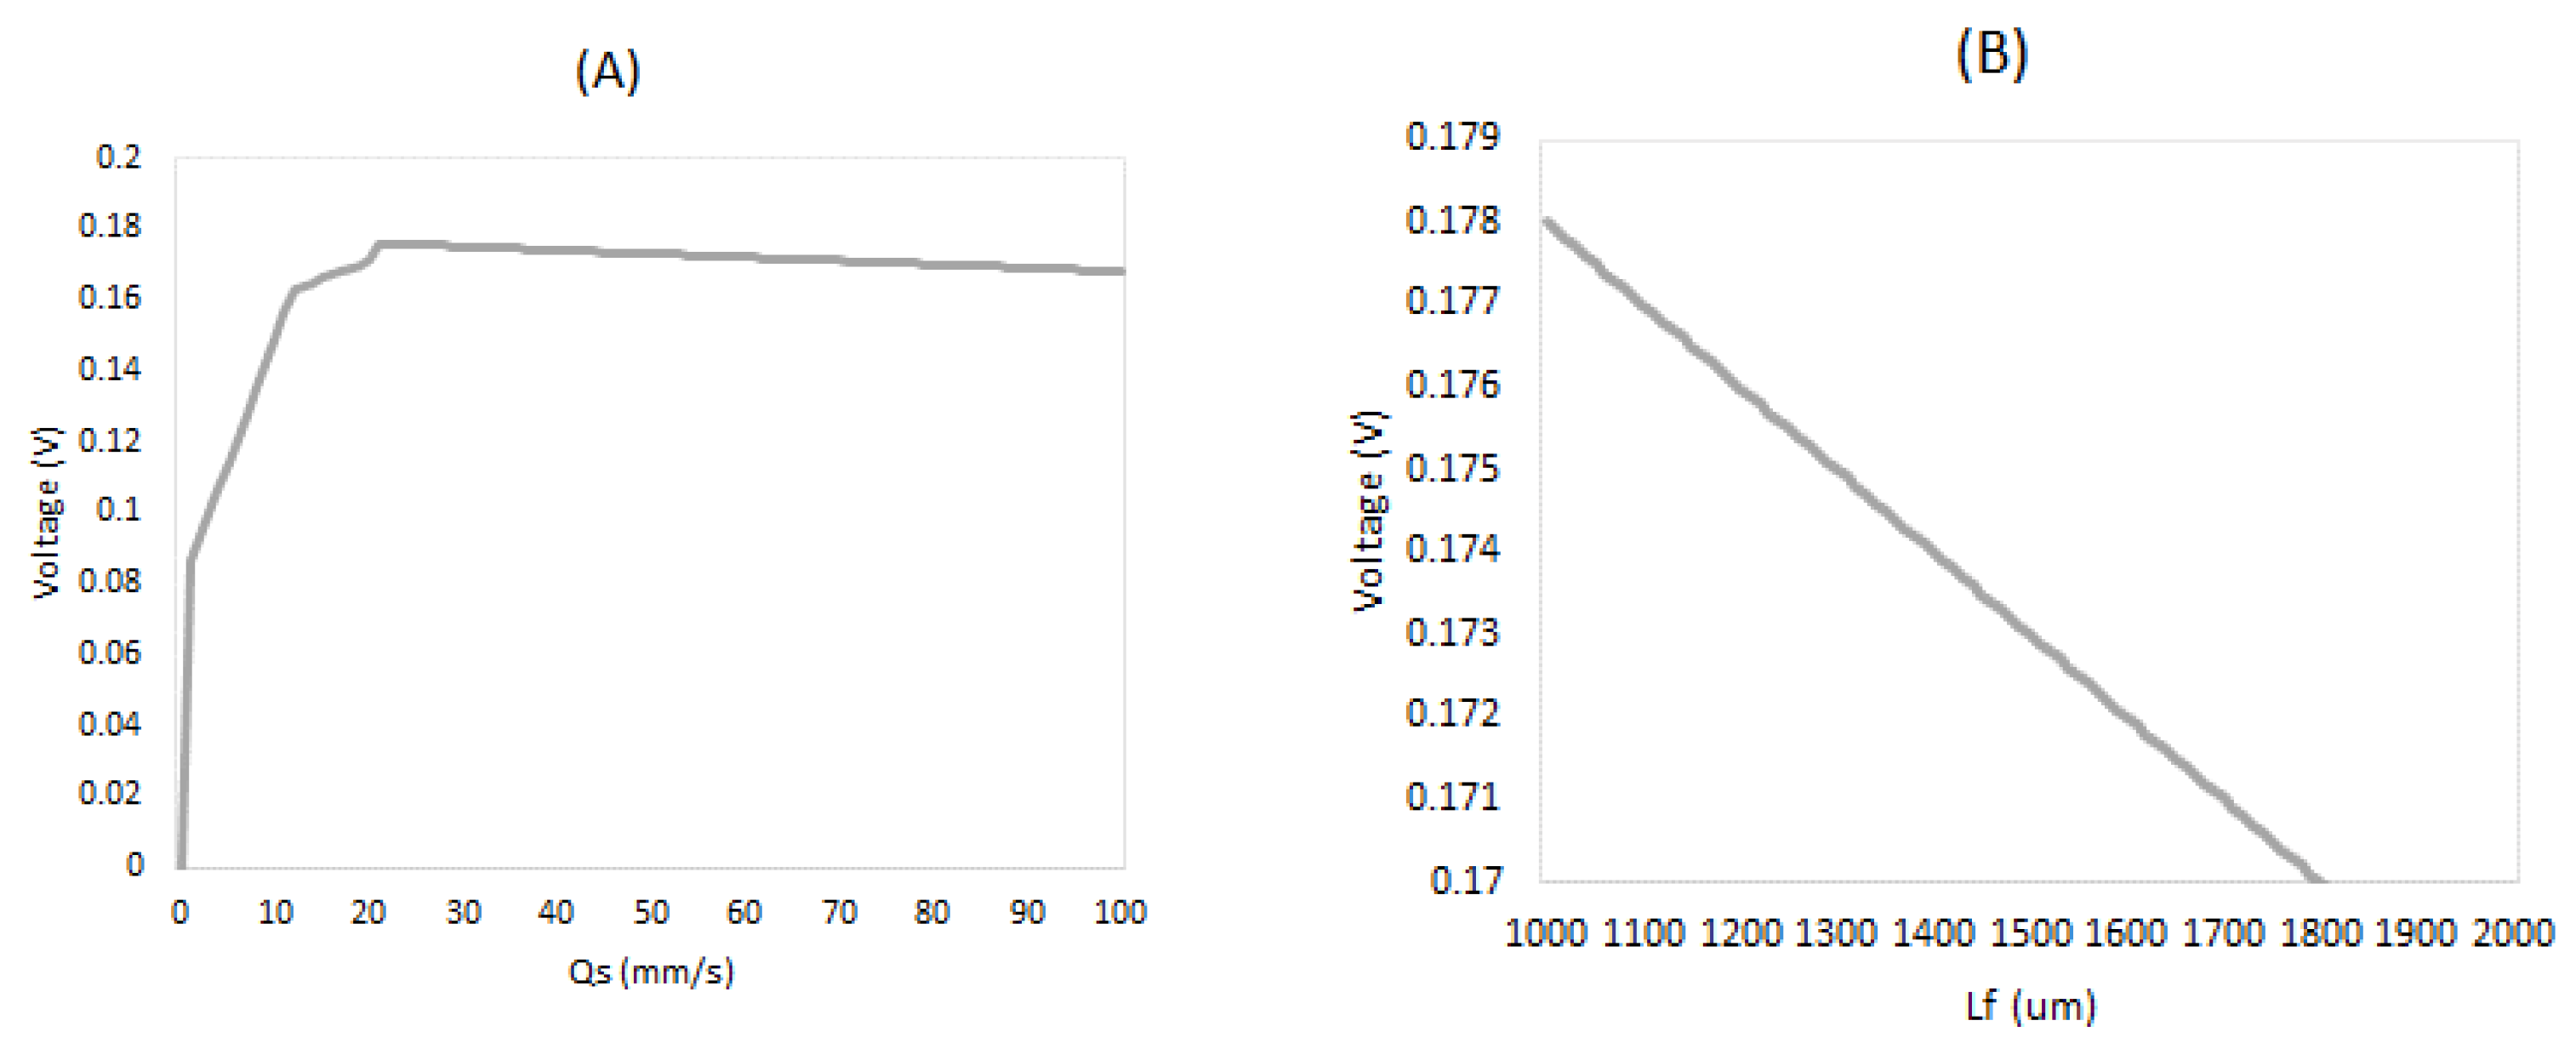
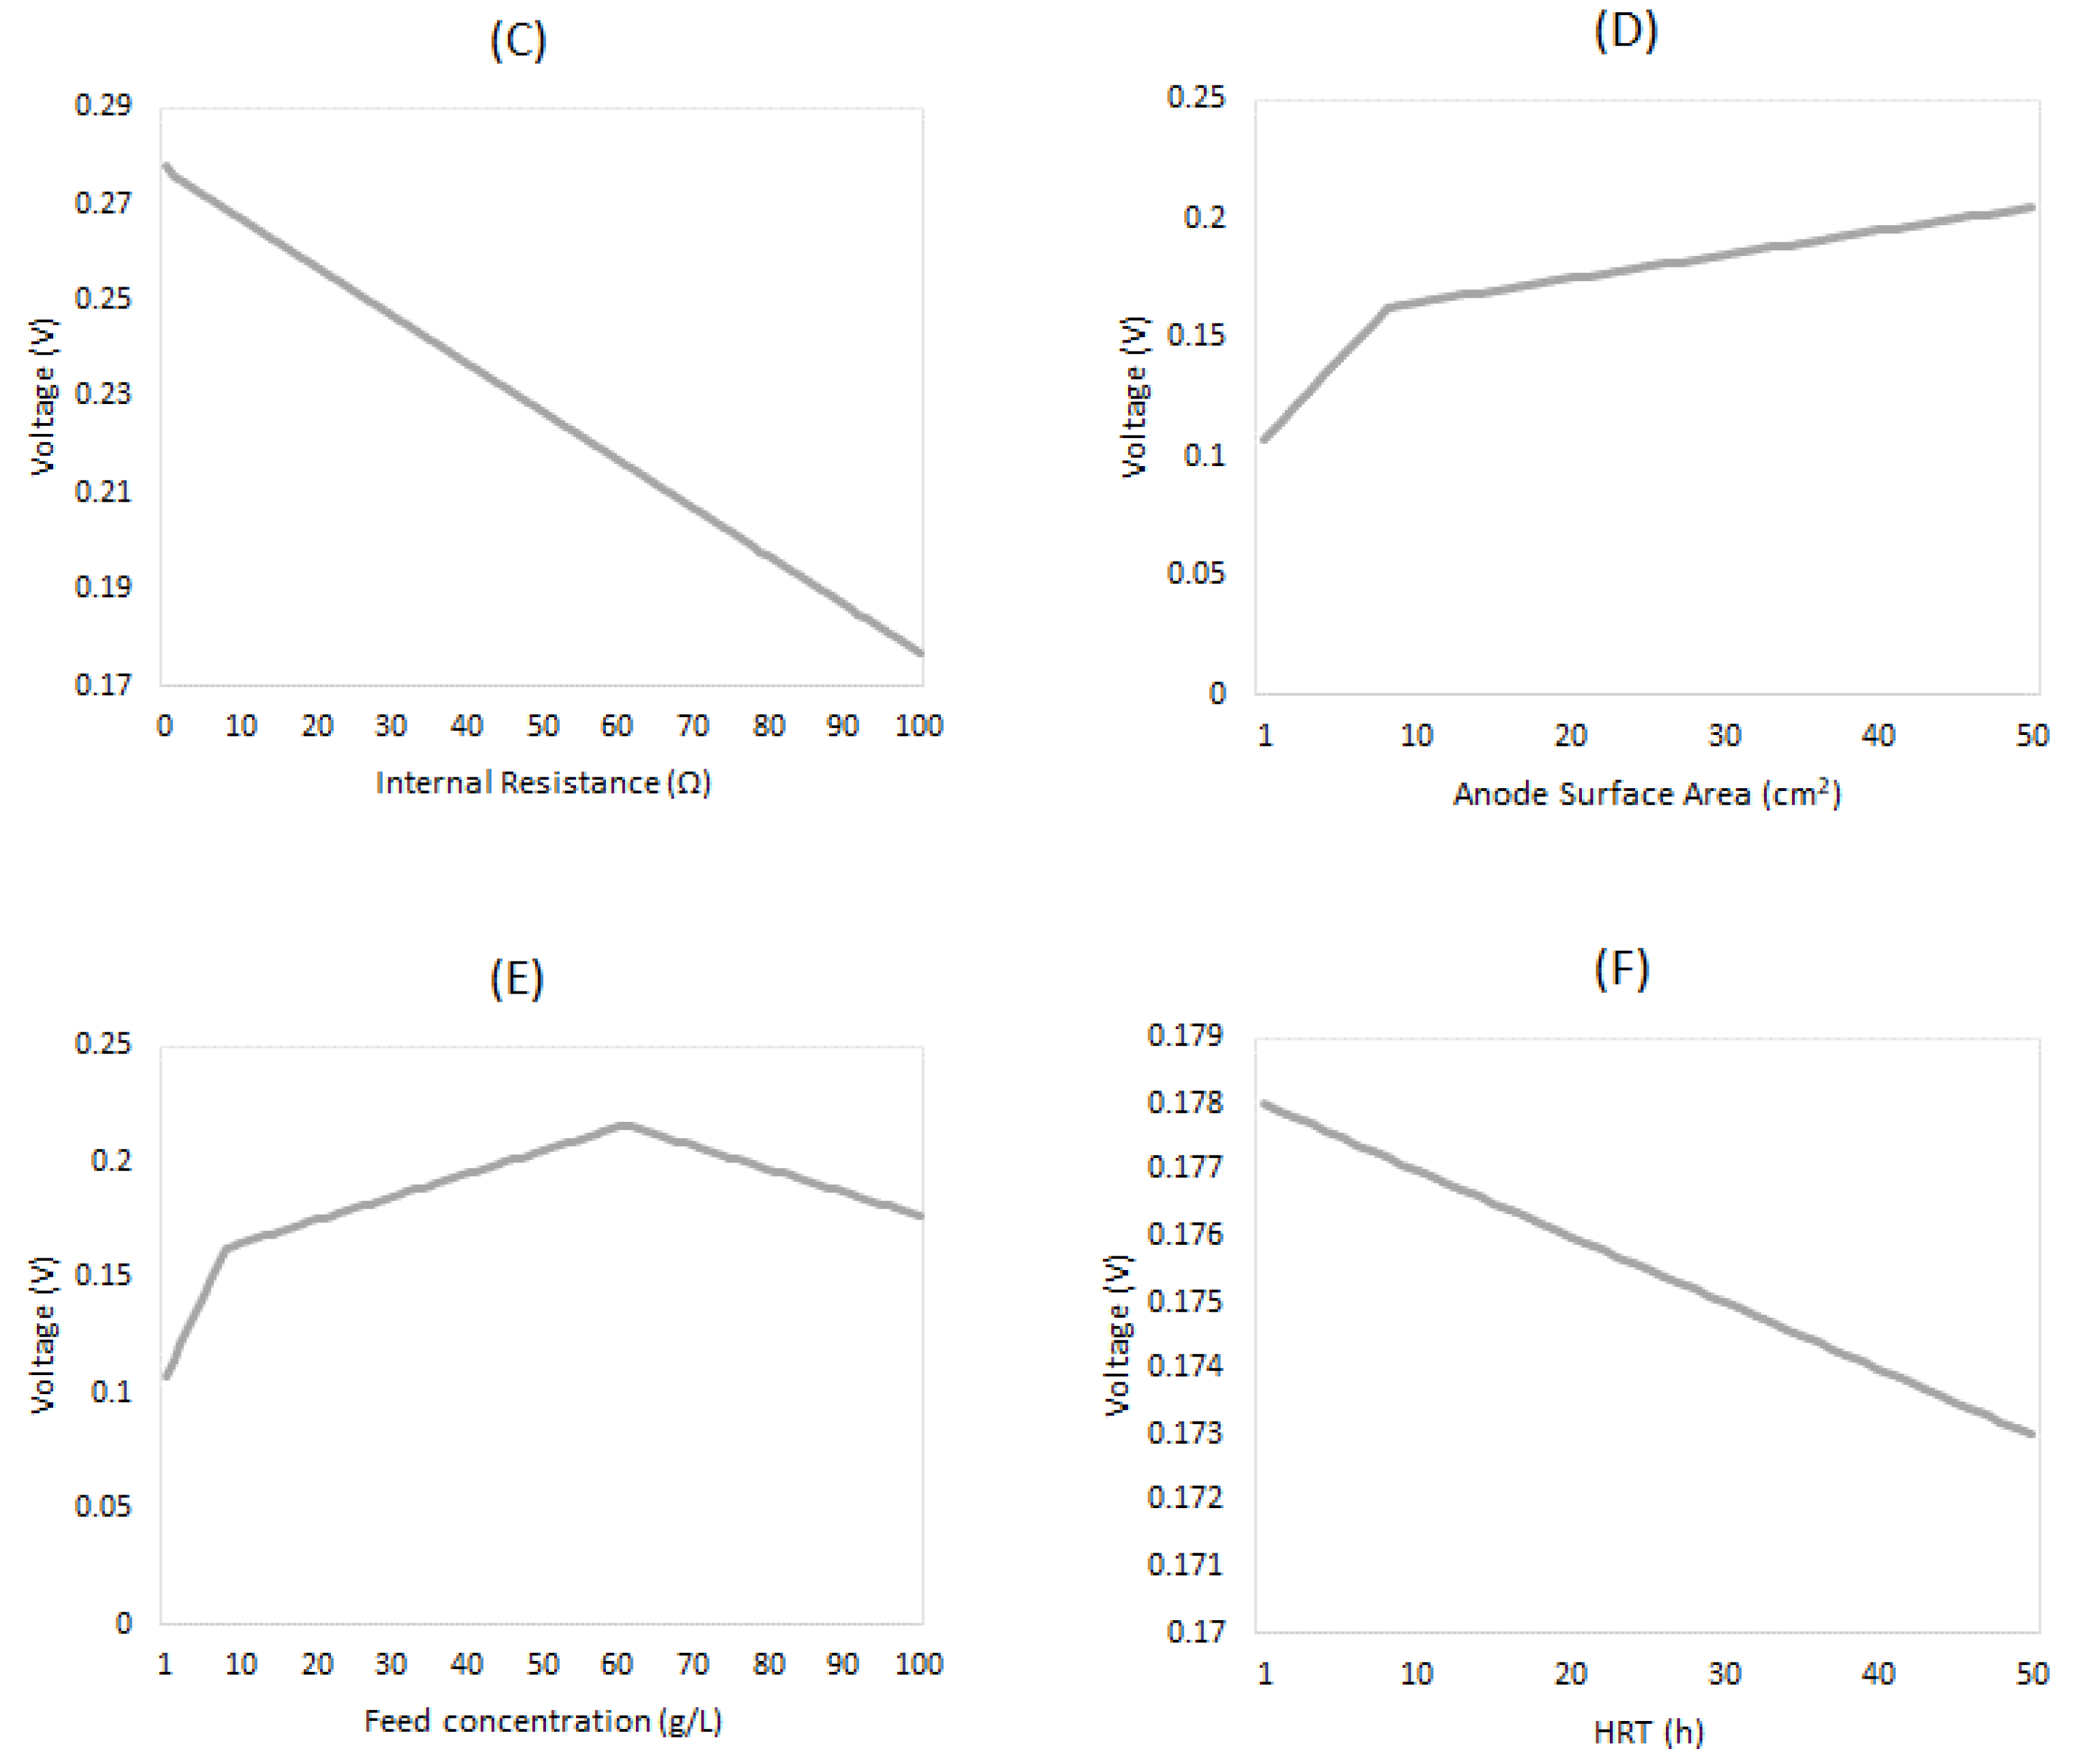
The inflow velocity, representing the rate of fresh feedstock delivery, exerts a significant impact on the availability of substrates crucial for microbial metabolism within the MFC, as well as the voltage output. However, after Qs reach a relativity high speed, the impacts on voltage output start to be minimized, as shown in Figure 9A. Conversely, the membrane thickness, a key structural component, governs ion transport and electrochemical reactions, with variations influencing voltage output due to associated diffusion limitations. Furthermore, internal resistance, encompassing ohmic and polarization resistances, intricately regulates electron transfer efficiency within the MFC, with higher resistance invariably leading to diminished voltage output. The anode surface area, serving as the substrate for microbial attachment and electron transfer, directly shapes voltage output by determining the number of active sites available for these processes.
Feed concentration directly affects voltage output in microbial fuel cells (MFCs) by influencing the availability of electron donors and acceptors. Higher concentrations increase microbial activity, enhancing electron transfer processes and voltage generation. However, as shown in Figure 9E, the impact on the voltage output will be negative when the initial concentration is overly high. HRT also negatively impacts voltage output. This is because a shorter HRT enhances power generation in microbial fuel cells by eliminating non-exoelectrogenic microorganisms.
Through sensitivity analysis of all model parameters, a comprehensive understanding of their individual contributions to MFC performance was attained. Additionally, testing a wider range of parameter values enhanced the simulation’s reliability and feasibility.
3.3. Power Generation for Guelph WWTP
After pre-testing of the models, the final model is conducted for the power generation simulation. The model still takes 1 L of the wastewater as the sample, and then the final total power generation is calculated.
The final simulation gives a maximum power generation of 998 mW in 12 h for 1 L of wastewater shown in Figure 10. Since the daily inflow of the wastewater in the treatment plant is 50.651 MLD [10], the total power generation for the Guelph wastewater treatment plant could reach 50,515.16 kWh per day by implementing testing data into Equation (11).
Based on Residential Energy Consumption Survey (RECS) datasets [34], average electricity usage for a one-person home is 20.11 kWh per day, which means by applying MFC to Guelph wastewater treatment plant, the electricity generated in one day can supply around 2530 one-person homes daily electricity usage.
Other than simulating the voltage output using the model, the COD removal rate can be calculated by analysis of the effluent wastewater properties. The effluent concentration for each input component is simulated in ASM1 and MATLAB models to compare the removal efficiency. Figure 11 shows the comparison of effluent concentration between MFCs and Guelph WWTP.
By comparing the effluent component concentration and the influent concentration, the Guelph wastewater treatment plant has a COD removal rate of around 25%. In comparison, MFCs have a COD removal rate of around 75%. (g∙L−1).
4. Conclusions
This study investigated how inflow velocity, membrane thickness, internal resistance, anode surface area, feed concentration, and HRT will influence the MFC power generation while treating wastewater at Guelph Wastewater Treatment Plant, Canada. The relationship between inflow velocity and voltage output is found to be in a positive correlation. Membrane thickness has a negative correlation relationship with voltage output. Moreover, the simulation shows that the membrane’s thickness will also affect the start-up time due to the resistance changes within the membrane; a thinner membrane leads to a shorter start time, leading to more total power generation in a fixed time period. The internal resistance of the MFC also has a negative correlation with power generation. Expanding the surface area of the anode leads to a greater area for biofilm formation and an increased number of active sites available for the reaction, even with different initial substrate concentrations; voltage generation increases with the expanded anode surface area. Lower feed concentrations significantly affect power generation in MFCs by limiting substrate availability for microbial metabolism, resulting in reduced microbial activity and power output. Moreover, reduced HRT yields enhanced energy generation output, whereas prolonged HRT should be avoided in the operation of microbial fuel cells.
With extensive pre-testing of various parameters under ideal conditions, the most efficient model forecasts a remarkable daily power generation of 50,515.16 kWh for the entire wastewater treatment plant, sufficient to sustain approximately 2530 one-person families. Moreover, the model underscores the substantial advantages of microbial fuel cells, or MFCs, showcasing a notably higher chemical oxygen demand (COD) removal rate of 75% compared to the current COD removal rate at the Guelph wastewater treatment plant. The insights gleaned from this model serve as a valuable reference for future simulations of wastewater treatment plants with similar properties, thereby facilitating optimization and enhancing the overall efficiency of waste-to-energy conversion.
Author Contributions
Writing, Y.L.; supervision, S.Y. All authors have read and agreed to the published version of the manuscript.
Funding
This research was funded by the Dean’s Office, Faculty of Engineering, University of Waterloo.
Institutional Review Board Statement
Not applicable.
Informed Consent Statement
Not applicable.
Data Availability Statement
Data are available upon request.
Acknowledgments
Support of City of Guelph and Sumant Patel, Manager, Operations Wastewater Services, City of Guelph is gratefully acknowledged.
Conflicts of Interest
The authors declare no conflicts of interest.
References
- Gude, V.G. Wastewater treatment in microbial fuel cells—An overview. J. Clean. Prod. 2016, 122, 287–307. [Google Scholar] [CrossRef]
- Zhang, Y.; Liu, M.; Zhou, M.; Yang, H.; Liang, L.; Gu, T. Microbial fuel cell hybrid systems for wastewater treatment and bioenergy production: Synergistic effects, mechanisms and challenges. Renew. Sustain. Energy Rev. 2019, 103, 13–29. [Google Scholar] [CrossRef]
- Li, W.-W.; Yu, H.-Q.; He, Z. Towards sustainable wastewater treatment by using microbial fuel cells-centered technologies. Energy Environ. Sci. 2014, 7, 911–924. [Google Scholar] [CrossRef]
- Jadhav, D.A.; Ray, S.G.; Ghangrekar, M.M. Third generation in bio-electrochemical system research—A systematic review on mechanisms for recovery of valuable by-products from wastewater. Renew. Sustain. Energy Rev. 2017, 76, 1022–1031. [Google Scholar] [CrossRef]
- Rabaey, K.; Verstraete, W. Microbial fuel cells: Novel biotechnology for energy generation. Trends Biotechnol. 2005, 23, 291–298. [Google Scholar] [CrossRef] [PubMed]
- Li, X.G. Principles of Fuel Cells; Taylor & Francis: New York, NY, USA, 2006. [Google Scholar]
- Rahimnejad, M.; Ghoreyshi, A.; Najafpour, G.; Younesi, H.; Shakeri, M. A novel microbial fuel cell stack for continuous production of clean energy. Int. J. Hydrogen Energy 2012, 37, 5992–6000. [Google Scholar] [CrossRef]
- Sharma, Y.; Li, B. Optimizing energy harvest in wastewater treatment by combining anaerobic hydrogen producing biofermentor (HPB) and microbial fuel cell (MFC). Int. J. Hydrogen Energy 2010, 35, 3789–3797. [Google Scholar] [CrossRef]
- Munoz-Cupa, C.; Hu, Y.; Xu, C.; Bassi, A. An overview of microbial fuel cell usage in wastewater treatment, resource recovery and energy production. Sci. Total Environ. 2021, 754, 142429. [Google Scholar] [CrossRef]
- “2022 Annual Performance Report”, City of Guelph, 2023. Available online: https://guelph.ca/wp-content/uploads/Guelph-WRRC-2022-Annual-Performance-Report_20220325.pdf (accessed on 1 April 2024).
- Sustarsic, M. Wastewater Treatment: Understanding the Activated Sludge Process. Chem. Eng. Prog. 2009, 105, 26–29. [Google Scholar]
- Bayo, J.J.D.l.T.; Pascual, J.M.; Rojo, J.C.T.; Toro, M.Z. Waste to Energy from Municipal Wastewater Treatment Plants: A Science Mapping. Sustainability 2022, 14, 16871. [Google Scholar] [CrossRef]
- Kumar, R.; Singh, L.; Zularisam, A.W.; Hai, F.I. Microbial fuel cell is emerging as a versatile technology: A review on its possible applications, challenges and strategies to improve the performances. Int. J. Energy Res. 2017, 42, 369–394. [Google Scholar] [CrossRef]
- Wang, Y.-K.; Sheng, G.-P.; Li, W.-W.; Huang, Y.-X.; Yu, Y.-Y.; Zeng, R.J.; Yu, H.-Q. Development of a Novel Bioelectrochemical Membrane Reactor for Wastewater Treatment. Environ. Sci. Technol. 2011, 45, 9256–9261. [Google Scholar] [CrossRef]
- Shreya, N.M.; Shreenag, M.U.; Patil, J.H.; Muralidhara, V.M. Wastewater Treatment Using Anaerobic Fluidized Bed Membrane Bioreactor Coupled with Microbial Fuel Cells for Circular Economy. ECS Trans. 2022, 107, 4435. [Google Scholar]
- Min, B.; Kim, J.; Oh, S.; Regan, J.M.; Logan, B.E. Electricity generation from swine wastewater using microbial fuel cells. Water Res. 2005, 39, 4961–4968. [Google Scholar] [CrossRef]
- Sreelekshmy, B. Exploration of Electrochemcially Active Bacterial Strains for Microbial Fuel Cells: An Innovation in Bioelectricity Generation. J. Pure Appl. Microbiol. 2020, 14, 103–122. [Google Scholar] [CrossRef]
- Fadzli, F.S.; Bhawani, S.A.; Mohammad, R.E.A. Microbial Fuel Cell: Recent Developments in Organic Substrate Use and Bacterial Electrode Interaction. J. Chem. 2021, 2021, 4570388. [Google Scholar] [CrossRef]
- Moharir, P.V.; Tembhurkar, A.R. Effect of recirculation on bioelectricity generation using microbial fuel cell with food waste leachate as substrate. Int. J. Hydrogen Energy 2018, 43, 10061–10069. [Google Scholar] [CrossRef]
- Ghasemi, M.; Sedighi, M.; Usefi, M.M.B. A comprehensive review on membranes in microbial desalination cells; processes, utilization, and challenges. Int. J. Energy Res. 2022, 46, 14716–14739. [Google Scholar] [CrossRef]
- Mitov, M.; Hubenova, Y. Microbial X cells—Innovative multipurpose bioelectrochemical systems. Bulg. J. Sci. Educ. 2015, 24, 404–416. [Google Scholar]
- Ahmadian-Alam, L.; Mahdavi, H. A novel polysulfone-based ternary nanocomposite membrane consisting of metal-organic framework and silica nanoparticles: As proton exchange membrane for polymer electrolyte fuel cells. Renew. Energy 2018, 126, 630–639. [Google Scholar] [CrossRef]
- Chao, D.; Zhou, W.H.; Xie, F.X.; Ye, C.; Li, H.; Jaroniec, M.; Qiao, S.Z. Roadmap for advanced aqueous batteries: From design of materials to applications. Sci. Adv. 2020, 5, eaba4098. [Google Scholar] [CrossRef]
- Watanabe, K. Recent Developments in Microbial Fuel Cell Technologies for Sustainable Bioenergy. J. Biosci. Bioeng. 2008, 106, 528–536. [Google Scholar] [CrossRef]
- Solanki, K.; Subramanian, S.; Basu, S. Microbial fuel cells for azo dye treatment with electricity generation: A review. Bioresour. Technol. 2013, 131, 564–571. [Google Scholar] [CrossRef]
- Oliveira, V.; Simões, M.; Melo, L.; Pinto, A. Overview on the developments of microbial fuel cells. Biochem. Eng. J. 2013, 73, 53–64. [Google Scholar] [CrossRef]
- Marcus, A.K.; Torres, C.I.; Rittmann, B.E. Conduction-based modeling of the biofilm anode of a microbial fuel cell. Biotechnol. Bioeng. 2007, 98, 1171–1182. [Google Scholar] [CrossRef]
- Zeng, Y.; Choo, Y.F.; Kim, B.-H.; Wu, P. Modelling and simulation of two-chamber microbial fuel cell. J. Power Sources 2010, 195, 79–89. [Google Scholar] [CrossRef]
- Karamzadeha, M.; Kadivarianb, H.; Kadivarianc, M.; Kazemic, A. Modeling the influence of substrate concentration, anode electrode surface area and external resistance in a start-up on the performance of microbial fuel cell. Bioresour. Technol. Rep. 2020, 12, 100559. [Google Scholar]
- IWA. ADM1 Model for BSM2, International Water Association (IWA) Task Group on Benchmarking of Control Strategies for WWTPs. 1 February 2002. Available online: https://0-scholar-google-com.brum.beds.ac.uk/scholar?q=ADM1%20model%20for%20BSM2,%20International%20Water%20Association%20%20Task%20Group%20on%20Benchmarking%20of%20Control%20Strategies%20for%20WWTPs,%20http:www.benchmarkwwtp.org (accessed on 8 August 2023).
- Henze, M.; Gujer, W.; Mino, T.; van Loosdrecht, M. Activated Sludge Models, ASM1, ASM2, ASM2d and ASM3; IWA Publishing: London, UK, 2006; Volume 5, pp. 65–73. [Google Scholar]
- Picioreanu, C.; Katuri, K.P.; Head, I.M.; van Loosdrecht, M.C.M.; Scott, K. Mathematical model for microbial fuel cells with anodic biofilms and anaerobic digestion. Water Sci. Technol. 2008, 57, 965–971. [Google Scholar] [CrossRef]
- Wang, J.; Song, X.; Wang, Y.; Zhao, Z.; Wang, B.; Yan, D. Effects of electrode material and substrate concentration on the bioenergy output and wastewater treatment in air-cathode microbial fuel cell integrating with constructed wetland. Ecol. Eng. 2017, 99, 191–198. [Google Scholar] [CrossRef]
- Independent Statistics and Analysis 2020 RECS Survey Data. March 2023. Available online: https://www.eia.gov/consumption/residential/data/2020/#electronics (accessed on 1 January 2024).
Figure 1.
The basic setup for MFCs.

Figure 2.
Guelph WWTP design with MFCs system.

Figure 3.
Differences in voltage generation with time under different Qs.

Figure 4.
Differences in voltage generation with time under different Lf.

Figure 5.
Differences in voltage generation with time under different internal resistances.

Figure 6.
Voltage generation performance under different anode surface areas.

Figure 7.
Voltage generation performance under different feed concentrations.

Figure 8.
Voltage generation performance under different HRTs.

Figure 9.
(A) Main effects of the input Qs on the MFC voltage output obtained by the sensitivity analysis. (B) The main effects of the Lf on the MFC voltage output obtained by the sensitivity analysis. (C) The main effects of the internal resistance on the MFC voltage output obtained by the sensitivity analysis. (D) The main effects of the anode surface area on the MFC voltage output were obtained by the sensitivity analysis. (E) The main effects of the feed concentration on the MFC voltage output obtained by the sensitivity analysis. (F) The main effects of the HRT on the MFC voltage output obtained by the sensitivity analysis.


Figure 10.
Power generation by treating wastewater (1 L) from Guelph WWTP.

Figure 11.
Effluent wastewater properties.


Table 1.
Raw influent wastewater quality data, 2022.
| pH | CBOD5 (mg∙L−1) | BOD5 (mg∙L−1) | TSS (mg∙L−1) | TP (mg∙L−1) | TKN (mg∙L−1) | TAN (mg∙L−1) | |
|---|---|---|---|---|---|---|---|
| Annual Average | 7.53 | 204 | 225 | 278 | 5.09 | 35.9 | 23.9 |
Table 2.
ASM1 analysis for the raw wastewater.
| Symbol | Value | Unit | Description |
|---|---|---|---|
| Ssu | 69.12 | g∙L−1 | Monosaccharides |
| Sfa | 264.96 | g∙L−1 | Total LCFA |
| Sva | 74.88 | g∙L−1 | Total valerate |
| Sbu | 57.6 | g∙L−1 | Total butyrate |
| Spro | 40.32 | g∙L−1 | Total propionate |
| Sac | 23.04 | g∙L−1 | Total acetate |
| Sh2 | 5.76 | g∙L−1 | Hydrogen |
| Sch4 | 23.04 | g∙L−1 | Methane |
Table 3.
Parameters for model set-up and simulation.
| Symbol | Value | Unit | Description |
|---|---|---|---|
| F | 96,485.4 | Coulombs mol−1 | Faraday’s constant |
| R | 8.3144 | J mol−1 K−1 | Gas constant |
| T | 30 | Temperature | |
| ks | 6 | Ohm−1 m−1 | Electrical conductivity of the aqueous solution |
| Am | 0.5 | m2 | Area of membrane |
| Kbio | 0.05 | Sm−1 | Electrical conductivity of the membrane |
| U0 | 0.5 | volt | Cell open circuit potential |
| Yac [28] | 0.05 | - | Bacterial yield |
| Kdec [28] | 8.33 × 10⁻⁴ | h−1 | Decay constant for acetate utilizers |
| α | 0.068 | - | Charge transfer coefficient of anode |
| β | 0.773 | - | Charge transfer coefficient of cathode |
Disclaimer/Publisher’s Note: The statements, opinions and data contained in all publications are solely those of the individual author(s) and contributor(s) and not of MDPI and/or the editor(s). MDPI and/or the editor(s) disclaim responsibility for any injury to people or property resulting from any ideas, methods, instructions or products referred to in the content. |
© 2024 by the authors. Licensee MDPI, Basel, Switzerland. This article is an open access article distributed under the terms and conditions of the Creative Commons Attribution (CC BY) license (https://creativecommons.org/licenses/by/4.0/).
Share and Cite
MDPI and ACS Style
Li, Y.; Yin, S. Numerical Investigation for Power Generation by Microbial Fuel Cells Treating Municipal Wastewater in Guelph, Canada. Clean Technol. 2024, 6, 497-512. https://0-doi-org.brum.beds.ac.uk/10.3390/cleantechnol6020026
AMA Style
Li Y, Yin S. Numerical Investigation for Power Generation by Microbial Fuel Cells Treating Municipal Wastewater in Guelph, Canada. Clean Technologies. 2024; 6(2):497-512. https://0-doi-org.brum.beds.ac.uk/10.3390/cleantechnol6020026
Chicago/Turabian StyleLi, Yiming, and Shunde Yin. 2024. "Numerical Investigation for Power Generation by Microbial Fuel Cells Treating Municipal Wastewater in Guelph, Canada" Clean Technologies 6, no. 2: 497-512. https://0-doi-org.brum.beds.ac.uk/10.3390/cleantechnol6020026