
Correlation between Different Methods to Diagnose Foot Posture Condition


1
RoboCorp Laboratory, i2A, Polytechnic Institute of Coimbra, 3045-093 Coimbra, Portugal
2
Faculty of Sports, University of Porto, 4200-450 Porto, Portugal
3
Sector of Physiotherapy, School of Health Sciences, Polytechnic Institute of Leiria, 2411-901 Leiria, Portugal
4
Centre for Mechanical Engineering, Materials and Processes (CEMMPRE), University of Coimbra, 3030-788 Coimbra, Portugal
5
BodyKeeper Carlos Morgado Santos-Physiotherapy, Osteopathy, and Posturology Clinic, Nutrition and Psychology, 3030-489 Coimbra, Portugal
6
Faculty of Sport (FADEUP), CIFI2D, University of Porto, 4200-450 Porto, Portugal
7
Porto Biomechanics Laboratory (LABIOMEP-UP), University of Porto, 4200-450 Porto, Portugal
*
Author to whom correspondence should be addressed.
J 2021, 4(3), 233-243; https://0-doi-org.brum.beds.ac.uk/10.3390/j4030019
Submission received: 1 June 2021
/
Revised: 16 June 2021
/
Accepted: 21 June 2021
/
Published: 24 June 2021
(This article belongs to the Section Public Health & Healthcare)
Abstract
:Background: Authors refer to different methods to assess subjects’ foot posture. All methods present several limitations depending on the examiner or the chosen test. This study aims to investigate the relationship between different tests and Footprints parameters to diagnose subjects with a flat and neutral foot. Methods: The sample consisted of 37 participants, where 16 were included in the flatfoot group and 21 in the neutral foot group. Only subjects who presented a Navicular Drop Test value of >9 mm were included in the flatfooted group. All participants were submitted to Resting Calcaneal Stance Position and plantar pressure platform assessment for Footprints analysis. Associations between all tests and Footprints parameters were determined by Pearson’s correlation analysis. Results: Regarding both groups, significant correlations between tests were moderate to nearly perfect to identified both conditions of foot posture. All correlations were statistically significant (p < 0.05). Conclusions: The diagnosis accuracy of foot posture condition can be compromised depending on the used test. The Navicular Drop Test and the Resting Calcaneal Stance Position were shown to mislead foot posture condition assessment, unlike Footprints parameters that can be important evaluation tools in a clinical environment.
1. Introduction
The body requires sensitive inputs of lower limbs proprioceptive receptors relative to several environmental alterations [1,2,3] as several sensorimotor receptors’ feedback, namely plantar pressure, visual system, and vestibular alterations to maintain postural stability [1,4,5,6]. The foot skeleton alignment, known as foot posture, varies for each individual [7]. The foot complications are related to impaired mobility and postural stability, having a detrimental impact on the quality of life [2,8], and are also related to inadequate footwear use [9]. Those alterations are reported as a common concern in the community [2,8] as static and dynamic postural controls are required during daily living activities and can be impaired [10,11]. Thus, foot posture, through altered lower limb motion patterns, can induce injuries [12,13] and has been associated with abnormal foot motion during gait and posture [9,14,15,16,17,18,19]. In addition, foot posture variations can induce plantar pressure pattern alterations, which consequently alter the proximal lower limb joints’ range of motion [7,9]. Foot posture is usually classified into three categories, neutral (NF), cavus (CF), and flatfoot (FF), with respectively normal high and low medial longitudinal arch height. This last one is often characterized by calcaneus plantarflexion and eversion relative to the tibia, talus plantarflexion, navicular dorsiflexion, and forefoot supination [20,21,22]. In FF subjects, the medial longitudinal arch varies and can modify plantar pressure along the foot, which can affect shock absorption, muscular activity, stability, and, therefore, gait pattern [23,24].
Several methods are commonly used by practitioners to identify alterations to diagnose those conditions but present several limitations [23,24,25]. According to several authors, practitioners can use visual observation, radiographs, FootPrints, or clinical measurements [26]. The most and easily used test remains the Navicular Drop Test, which is used to quantify subjects’ hyperpronation. This test value describes the height differences between navicular tuberosity in a neutral position compared to the relaxed posture [23], where values higher than 9 mm are associated with FF condition [1], while others refer to values higher than 10 mm. Furthermore, values between 5 to 9 mm identify subjects with NF [1,27]. This test is considered a cheap, easy, and rapid method [24]. Other tests can be used to assess foot posture conditions, including the Arch Angle, Resting Calcaneal Stance Position, Arch Index, FootPrint Index, Chippaux-Smirak Index, or even the Staheli Index [23,24,25]. All the assessment methods have several limitations depending on the examiner or the chosen test [23,24,25,26]. FootPrints methods, according to Zuil-Escobar et al. (2019), are all non-invasive. The ink methods present several biases, such as inaccuracy, and are practitioner dependent, while digital systems are expensive although user-friendly and very useful in both clinical and investigation practice [23,24,26,28]. Finally, Resting Calcaneal Stance Position is a simple method and can be used quickly in a clinical environment using few resources [25]. No previously mentioned methods have any side effects on testes subjects [23,24].
Concerning all methods, the Arch Angle corresponds to the angle created between the medial line and the most medial aspect of the metatarsus, where values > 42° represent the FF condition [23,29,30]. The Resting Calcaneal Stance Position is the angle formed by the calcaneus, a perpendicular line to the ground, where values > 4° represent the FF condition [25]. The Arch Index corresponds to the ratio between the middle third area and the entire toeless FootPrint area. A higher value represents FF conditions [29,30]. The FootPrint Index is described in the literature by Cavanagh et al. (1987) as the ratio of the non-contact to the contact area, excluding the toes [30,31]. The authors identified values > 0.26 as hyperpronation conditions [29]. The Chippaux-Smirak Index represents the ratio between the midfoot area minimal distance and the forefoot area maximal distance [24,26,30], and finally, the Staheli Index refers to the minimal midfoot distance ratio to the maximal rearfoot distance [30].
In our research, only a few papers related both the sensibility and specificity of those tests. The Chippaux-Smirak Index presented an 87.6% sensitivity and an 88.4% specificity, and the Arch Index presented an 89.2% sensitivity and an 80.6% specificity [28]. Although modifications of the Navicular Drop Test, namely the Normalized Truncated Navicular Height, presented a sensitivity of 88.1% and a specificity of 99.5% [32], and the Navicular Index presented a 86% sensitivity and 75% specificity [33], few studies have investigated the associations between those tests. The Arch Index is the only method that depends on the toeless foot contact area while the others evaluate different fore- mid- or hindfoot parameters [23,34]. The papers that related correlations between few various tests present moderate to low values between tests but strong values for the inter- and intra-reliability, making them useful and easy to apply in the clinical environment [23,25,30]. However, they did not investigate several test correlations, such as the Resting Calcaneal Stance Position [23,24,30], Arch Index, or FootPrint Index [23,24].
Given the diversity of methods, this study aims to investigate the correlations between the Navicular Drop Test, Resting Calcaneal Stance Position, Arch Angle, FootPrint Index, Arch Index, Chippaux-Smirak Index, and Staheli Index among subjects with FF and NF conditions.
2. Materials and Methods
2.1. Participants
This observational, correlational descriptive study was carried out at the RoboCorp Laboratory—Physiotherapy, at the Polytechnic Institute of Coimbra after the Ethics Committee of Polytechnic Institute of Coimbra (13_CEPC2/2019) approval based on the revised version of the 2013 Declaration of Helsinki [35,36]. The sample size was calculated using the G * power 3.1.5 software (G* power 3.1.5, Kiel, Germany) based on the study previously published by Zuil-Escobar et al. (2018) [23]. A required sample size of 13 was determined by achieving an estimated alpha level of 0.05 and a power of 0.95. Consequently, 37 volunteer individuals aged between 18 and 35 years old were recruited for this scientific research. Before any assessment, all subjects were informed about the study’s purpose and procedures benefits, and risks involved were explained to each participant. Subjects were guaranteed that they could withdraw at any time without justification and asked to provide informed consent. Thirty-seven volunteers met eligibility (Table 1). The inclusion in the study was limited to subjects who presented bilateral FF and bilateral NF participants, aged between 18 to 40 years old. The FF group encompassed subjects that presented a > 9 mm Navicular Drop Test score while the NF group involved participants with a 5–9 mm Navicular Drop Test score. All participants were submitted to the Navicular Drop Test to identify whether they had a FF or a NF as this test is clinically used by practitioners worldwide. This procedure was realized by a single physiotherapist with more than 6 years’ experience in the use of these techniques. Thus, subjects who presented the following exclusion criteria were not included in this study: (a) ankle sprain in the last 6 months; (b) physiotherapy treatment program or history of ankle injury; (c) bone fracture associated with an ankle sprain, such as avulsion fracture or osteochondral; (d) ankle surgery; (e) subjects with unilateral FF and NF condition; (f) subjects aged less than 18 and higher than 40 years old; Then, the FF group consisted of 16 bilateral FF participants comprising a total of 32 feet while the NF group consisted of 21 bilateral NF subjects comprising a total of 42 feet.
2.2. Procedures
2.2.1. Assessment
Both NF and FF conditions were evaluated regarding the same assessment procedure bilaterally in a weight-bearing barefoot stance position. The navicular drop was evaluated using the Navicular Drop Test, where three measurements’ mean value defined the navicular drop. The practitioner placed a rigid plastic-made ruler perpendicularly to the ground and registered the ground-navicular bone distance (in millimeters). Then, the practitioner inverted the talus into a neutral position and repeated the procedure. The difference between both assessment positions quantified the navicular drop severity [1]. Then, the Rearfoot-to-leg angle was assessed using the Resting Calcaneal Stance Position test, where three measurements’ mean values defined the angle. This angle is formed by the longitudinal bisecting line of the calcaneus and the longitudinal bisecting line of the distal third of the leg, which was drawn by the investigator in a prone position, regarding the methodology previously used by Tsai et al. (2006). This angle was measured using a rigid plastic goniometer (Enraf-Nonius B.V, Rotterdam, The Netherlands) [37]. Finally, a bilateral digital FootPrint was recorded using a plantar pressure platform with a 100Hz frequency (PhysioSensing-Sensing Future Technologies, Coimbra, Portugal) for further analysis of specific FootPrint parameters, namely the Arch Angle, FootPrint Index, Arch Index, Chippaux-Smirak Index, and Staheli Index. The FootPrints assessment was realized with subjects in a relaxed upright position, and they were asked to maintain focus on a reference point for 5 s to stabilize the position before recording the data. If any participants failed to maintain their position, the trial was repeated.
2.2.2. Data Processing and Analysis
The primary outcomes collected were the Navicular Drop Test and the Resting Calcaneal Stance Position scores, which correspond to mobility foot tests of all subjects during a weight-bearing stance. As secondary outcomes were calculated through the FootPrint parameters, the Arch Angle, FootPrint Index, Arch Index, Chippaux-Smirak Index, and Staheli Index. The Navicular Drop Test and the Resting Calcaneal Stance Position scores were obtained using the mean results of the three collected scores, calculated using the IBM SPSS Statistics 27.0 software (IBM Corporation, Armonk, NY, USA). With the exception of those, all the FootPrints parameters resulting from the plantar pressure platform assessment were obtained through specific processing steps. All data were initially converted to an image format to be processed using the Image J software (National Institute for Health, Rockville, MD, USA). In addition, all Footprint parameters scores were calculated individually by the investigator regarding previously mentioned angles, entire foot contact area and, fore-mid and rearfoot toeless contact area.
2.3. Statistical Analysis
The data were statistically processed with the IBM SPSS Statistics 27.0 software (IBM Corporation, Armonk, NY, USA). The descriptive statistics, mean and standard deviation, were calculated for all variables regarding both groups, the NF, and FF groups. Associations between all tests and indexes were therefore established by Pearson’s correlation analysis. The level of significance was set at 5% (p < 0.05).
3. Results
3.1. Sample and Groups Characteristics
3.2. Neutral Foot Subjects
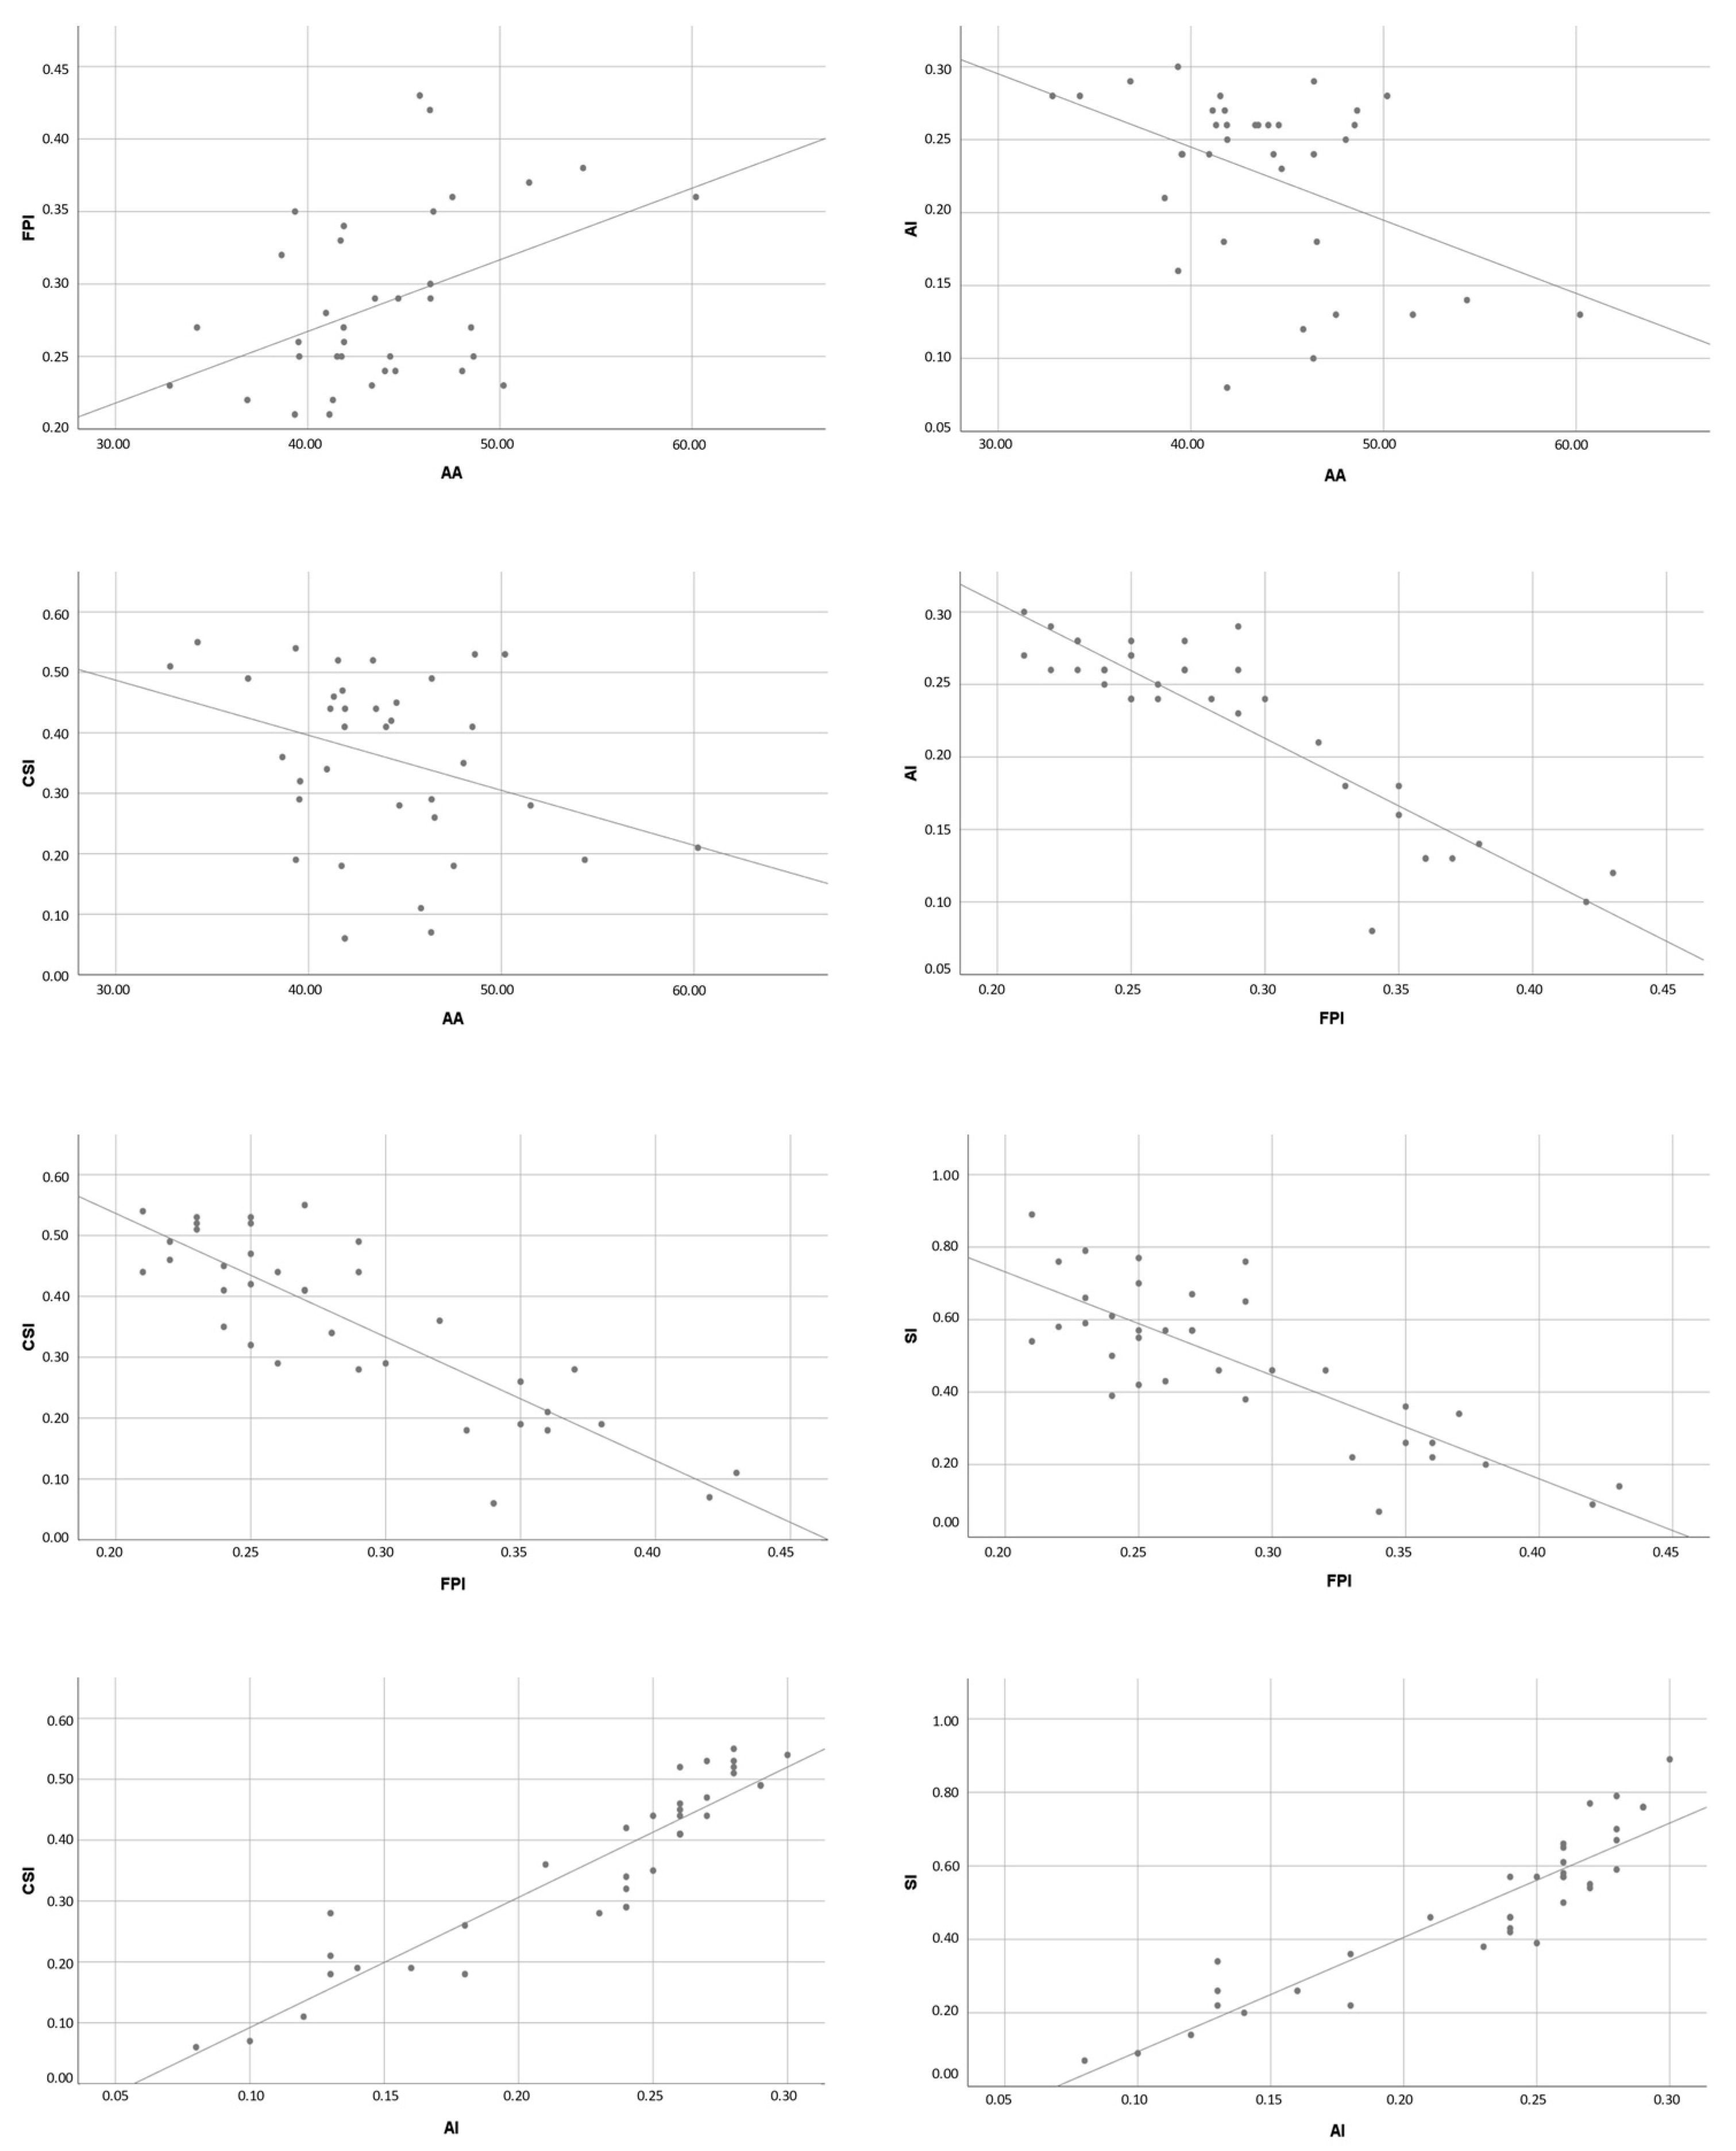
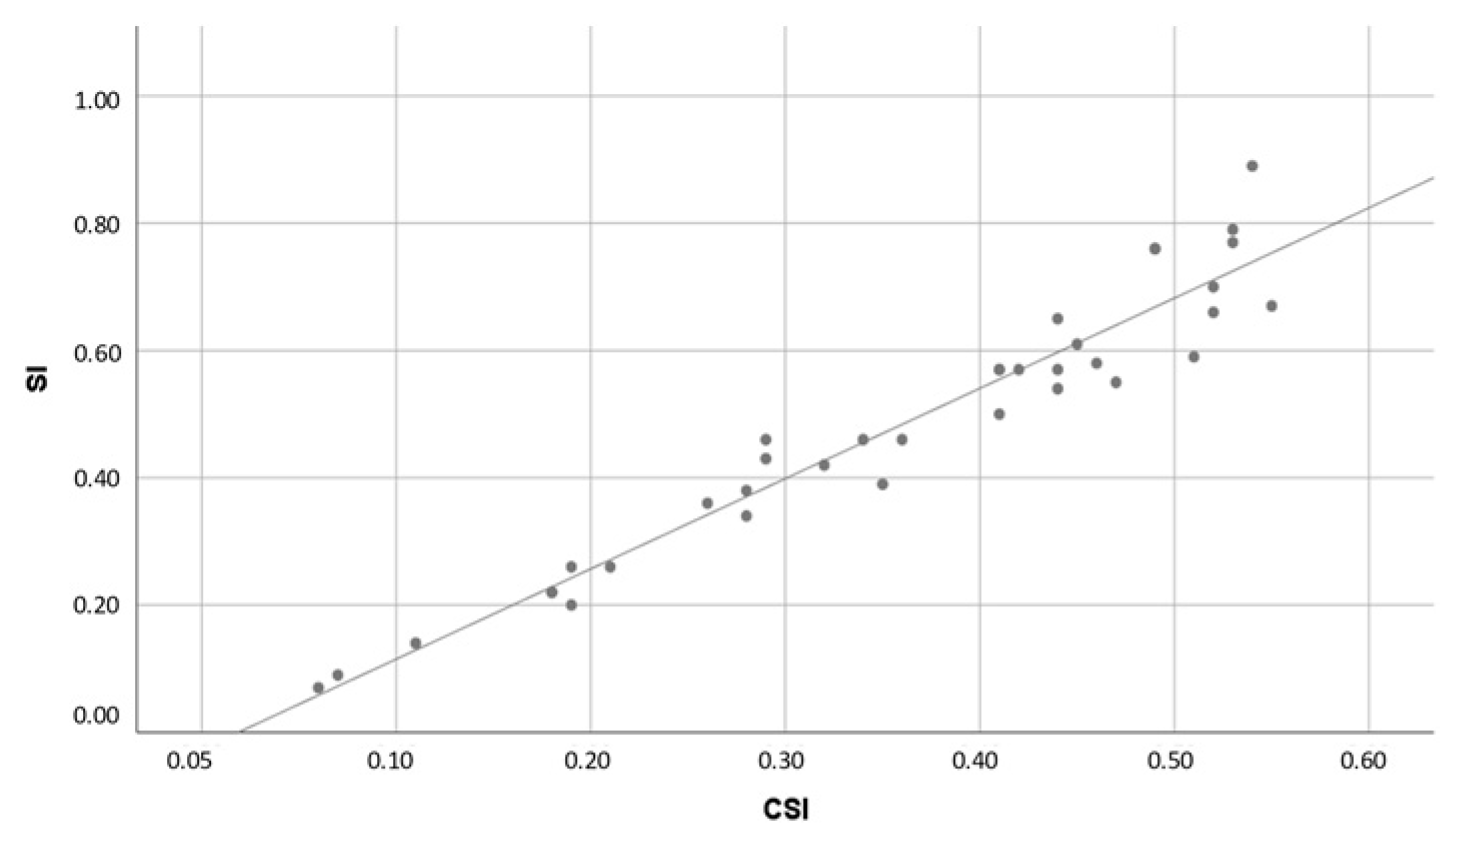
Considering the result values for the NF group, none of the correlations presented statistically significant results between Navicular Drop Test and the others (p > 0.05) as well as the Resting Calcaneal Stance Position correlations (p > 0.05). FootPrint parameters presented absolute values ranging from 0.341 to 0.965, corresponding to a moderate to nearly perfect correlation. All those correlations were statistically significant (p < 0.05) except for the Arch Angle/Staheli Index correlation (Table 3 and Figure 1).
3.3. Flat Foot Subjects
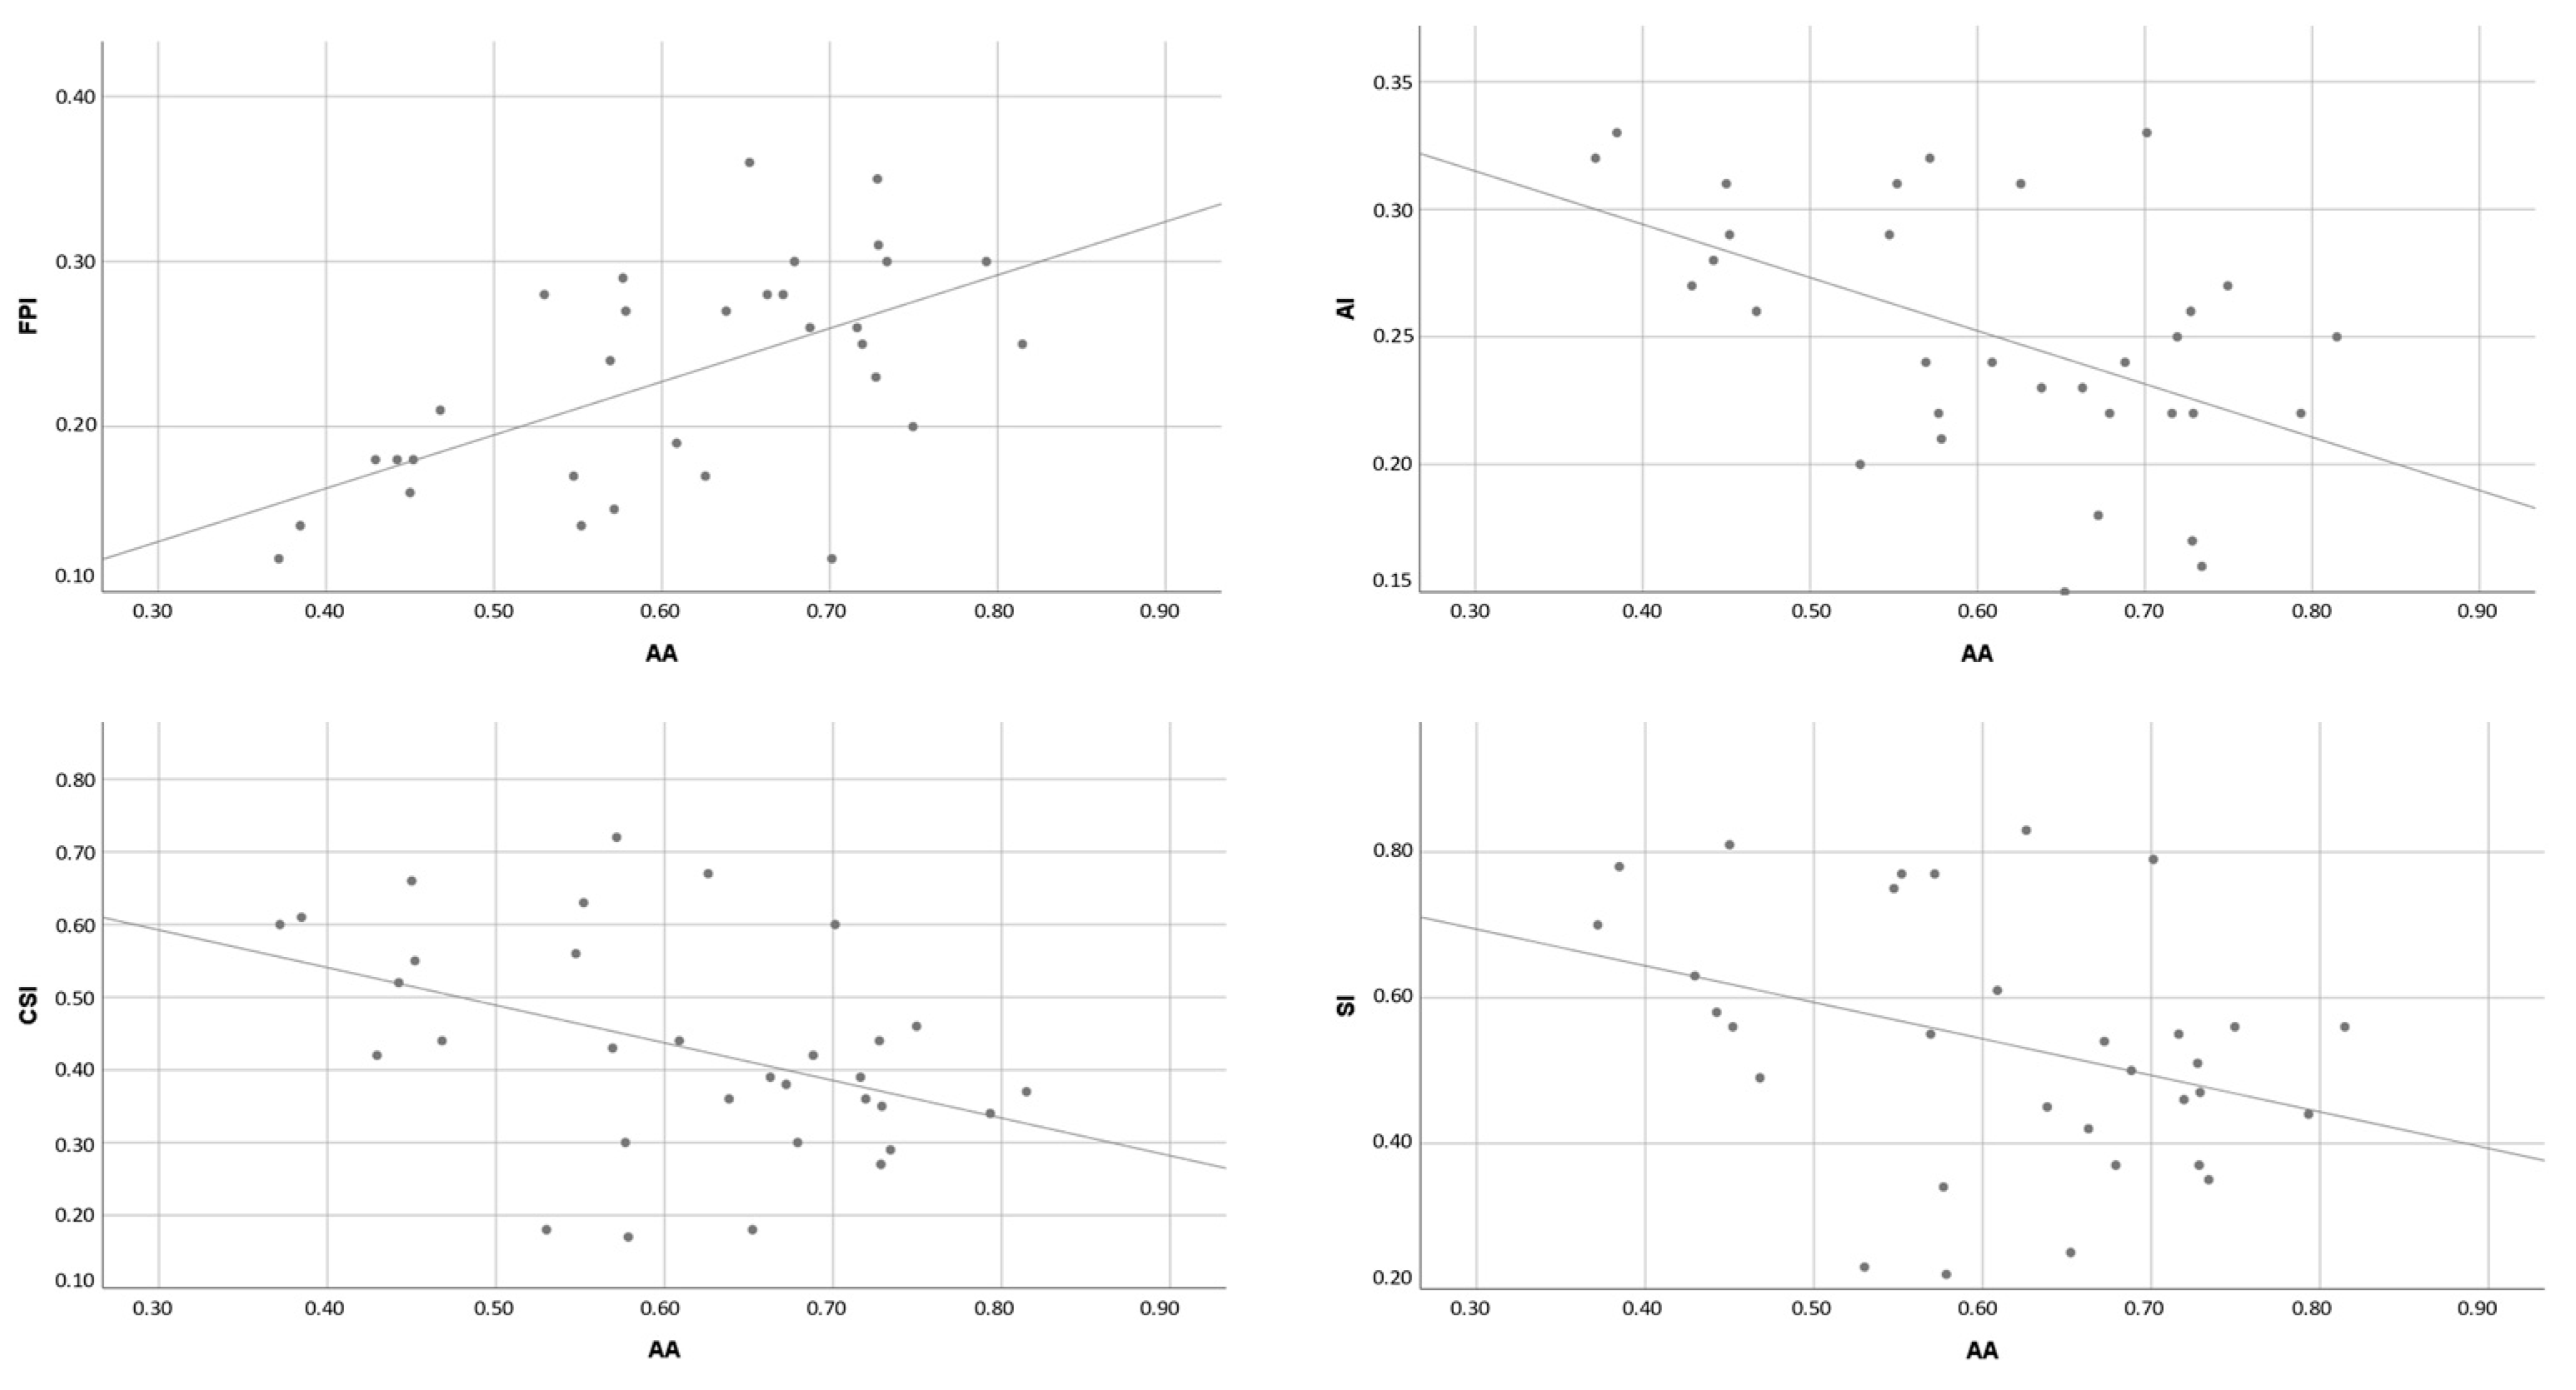
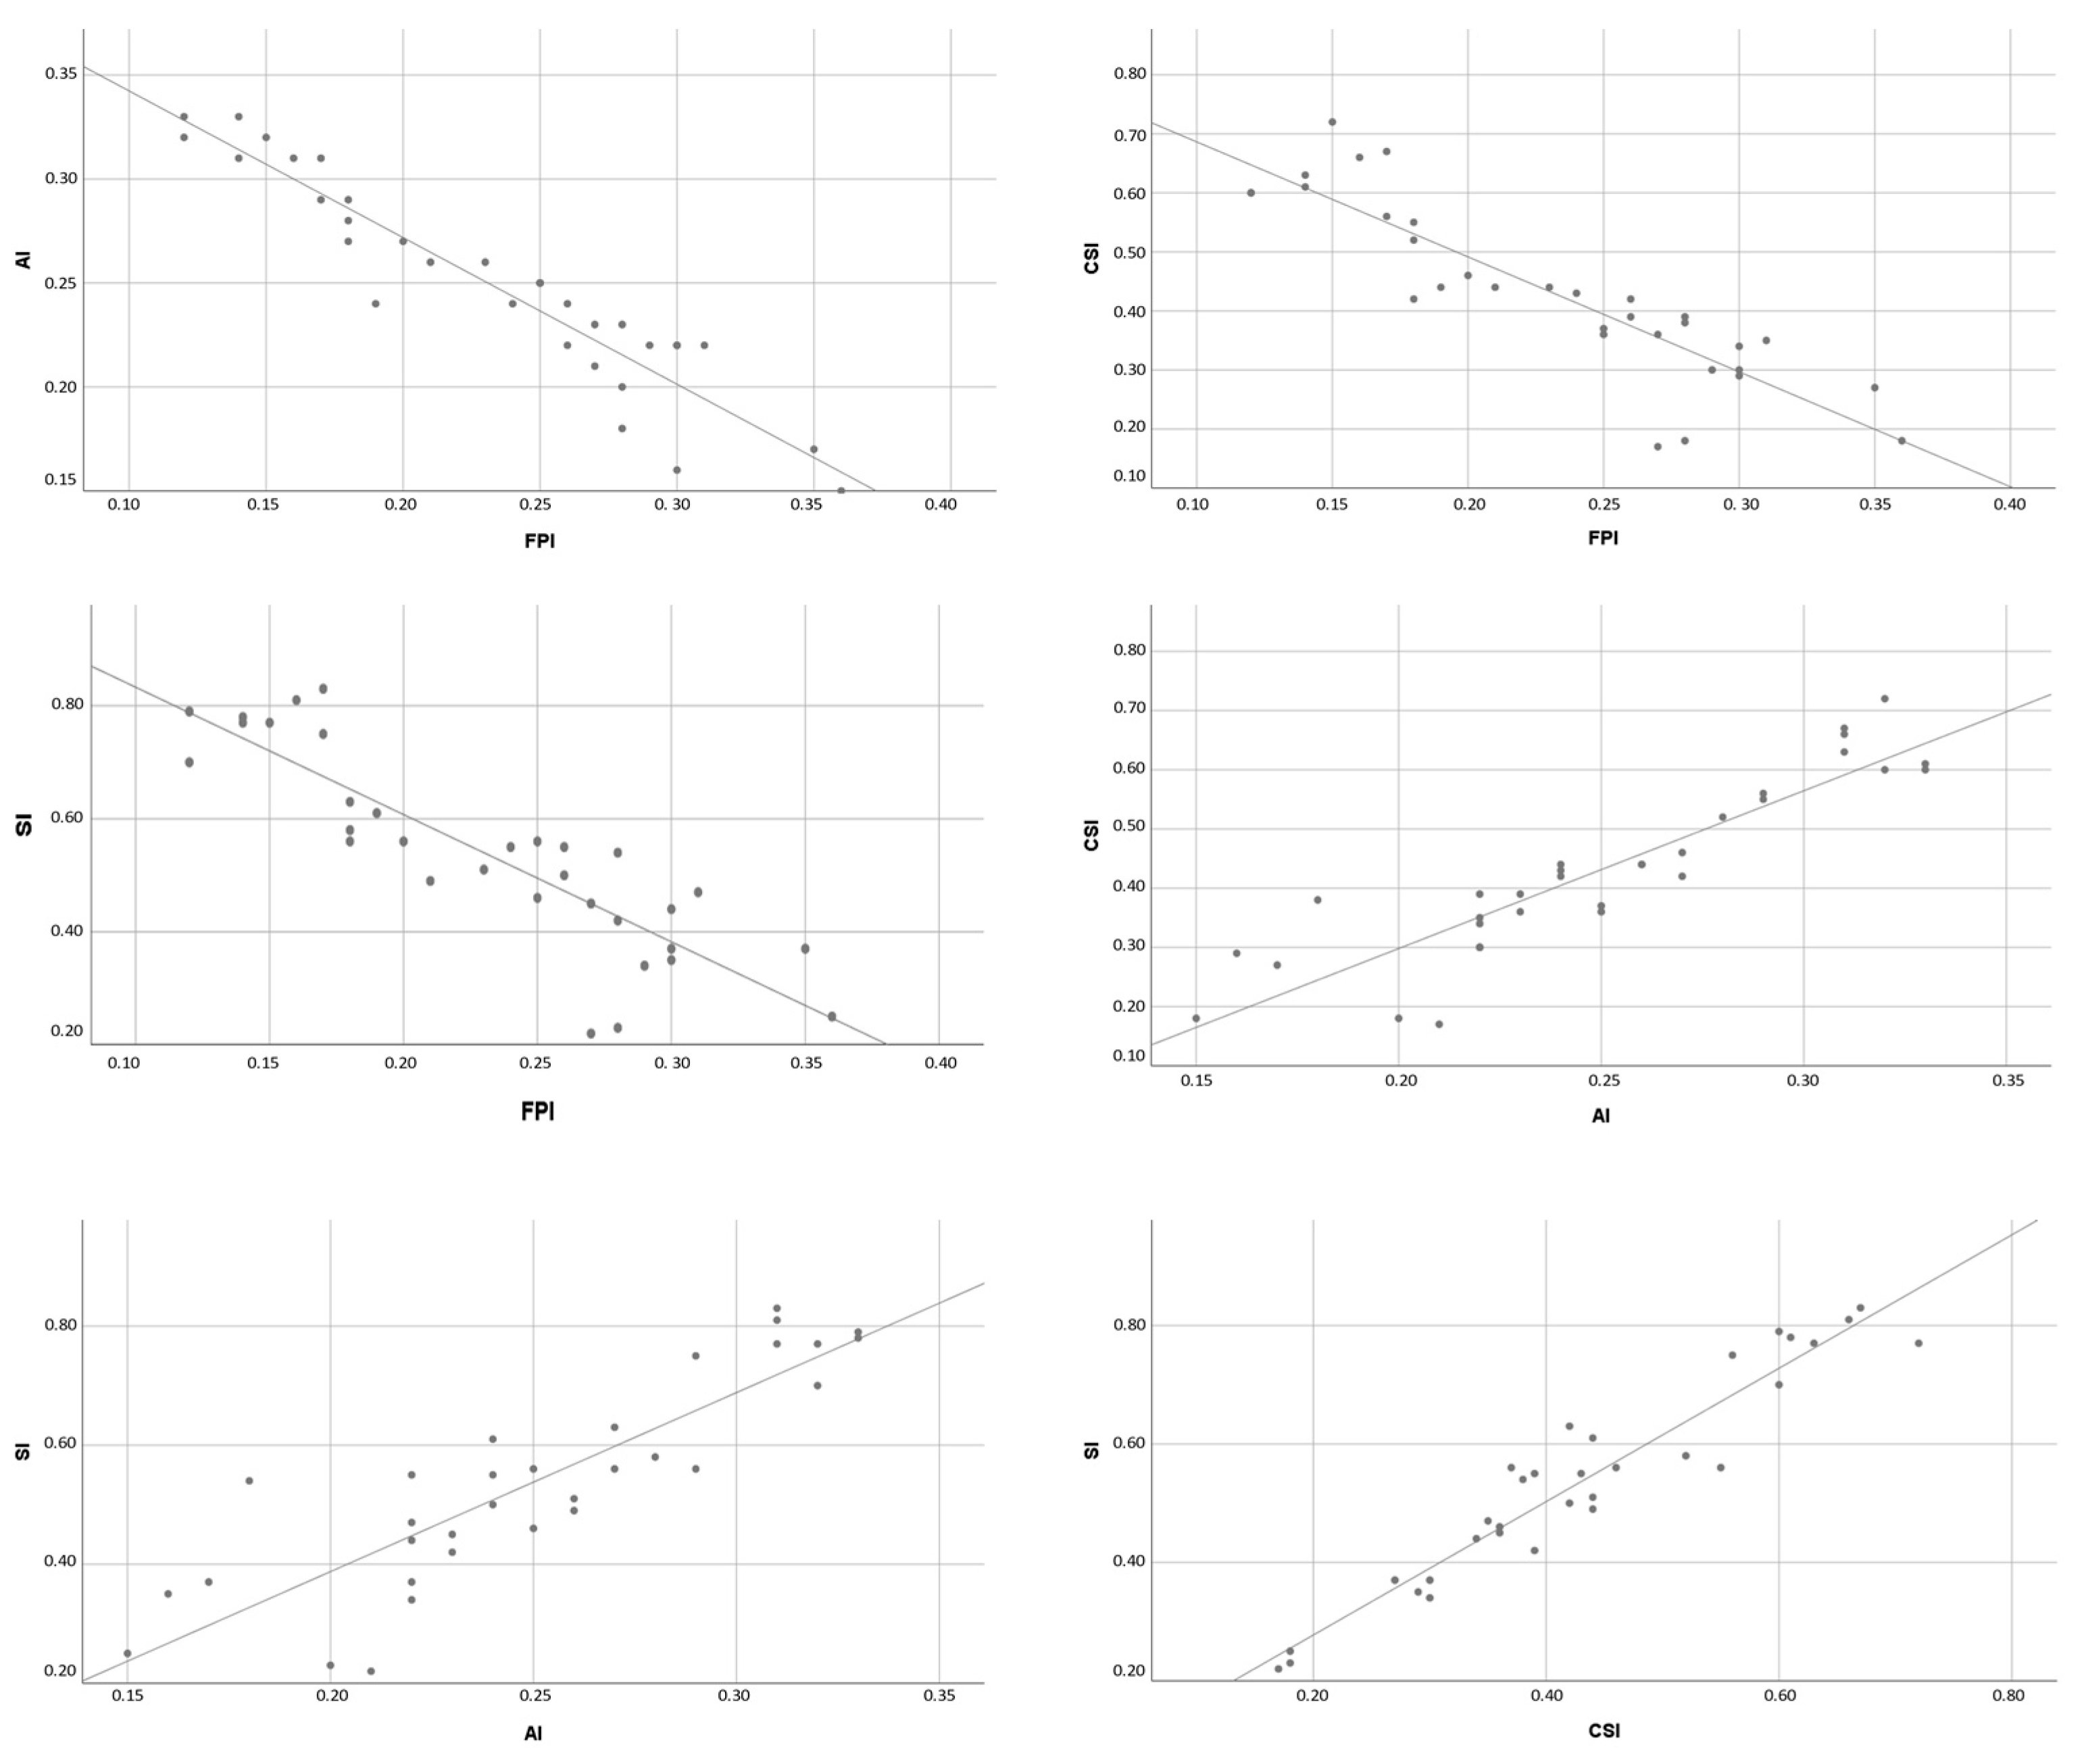
Regarding the FF group, none of all correlations presented statistically significant results between Navicular Drop Test and the others (p >0.05). Alongside these, the Resting Calcaneal Stance Position correlations did not present significant results (p > 0.05) either. Otherwise, the other tests, relative to the FootPrint assessment, showed absolute values ranging from 0.353 to 0.955, corresponding to moderate to nearly perfect correlation [38]. All those correlations were statistically significant (p < 0.05) (Table 4 and Figure 2).
4. Discussion
Many studies use these methods to assess foot posture, but few have made a correlation between them. Contrary to our study, previous works regarded just a few tests to assess accuracy, reliability, and correlations, or just with the inclusion of FF subjects or even without foot posture assessment inclusion criteria.
In FF subjects classified by the Navicular Drop Test, we did not find any statistically significant correlations between the Resting Calcaneal Stance Position and the Navicular Drop Test (p > 0.122/r = 0.279). In our research, no papers relating the association between those two previous tests were found. In addition, no statistically significant correlation was found between the Resting Calcaneal Stance Position and any FootPrint parameters (p > 0.05). Our results regarding the Navicular Drop Test correlations with the FootPrint parameters are controversial compared to the two previous papers. We did not find any statistically significant results in the FF (p > 0.05). Though, Zuil-Escobar et al. (2019) found in FF subjects, statistically significant results (p < 0.01) between the Navicular Drop Test and the Arch Angle (r = −0.732), Staheli Index (r = 0.788), and Chippaux-Smirak Index (r = 0.722) where absolute values corresponded to very high correlation values [24]. Alongside this, in another study, Zuil-Escobar et al. (2018) found in subjects without any foot posture inclusion criteria, the same statistically significant results (p < 0.05) for several correlations namely the Arch Angle (r = −0.643), Staheli Index (r = 0.633), and finally Chippaux-Smirak Index (r = 0.614) [23]. These results and this controversial finding can be due to functional alterations present in FF individuals. Literature shows that greater and complex mobility of the foot is present in FF compared to NF as well as a larger range of motion variability [1]. This greater foot mobility can also lead to further impairments, such as lower limb mechanical imbalance, decreased postural stability, or several pathological complications [1,27]. Furthermore, Alonso-Montero et al. (2020) stated the existence of great variability among foot posture based on the Footprint evaluation realized through the analysis of the angle between the fore- and rearfoot. They referred to a more precise need for footwear adequation to prevent further associated complications [9]. Moreover, the Navicular Drop Test and the Resting Calcaneal Stance Position are two tests that do not assess the foot area contact to the ground, instead of FootPrint parameters. Baumfeld et al. (2017) found that several tendons and muscle contracture can lead to increased load transfer from the hindfoot to the forefoot [39]. Similarly, Fernandez-Seguin et al. (2014) referred to controversial results regarding plantar pressure distribution in NF subjects between fore- and hindfoot distributed pressure load [40]. The Navicular Drop Test refers to midfoot mobility to assess foot posture while the Resting Calcaneal Stance Position, to the hindfoot. However, FootPrint parameters suggest the whole assessment of foot posture by sole load distribution. This can lead to an incorrect foot posture assessment, increasing the controversial assessment methods [8]. Concerning the FootPrint parameters, few indexes were investigated regarding the entire toeless foot contact with the ground in the FF group. Correlations between the Arch Angle and the remaining FootPrint parameters, which correspond to absolute moderate to high values (r = 0.353−0.590), presented statistically significant results (p < 0.05), respectively. Those results follow Zuil-Escobar et al. (2019), who found significant results among the Arch Angle/Staheli Index and Arch Angle/Chippaux-Smirak Index correlations. However, there was a discordance about the correlation coefficient since the authors found a higher coefficient respectively nearly perfect absolute scores (r = 0.901−0.930) [24]. Finally, all the correlations between the other FootPrint parameters, the FootPrint Index, Arch Index, Chippaux-Smirak Index, and Staheli Index, presented statistically significant results (p = 0.01) with absolute very high and nearly perfect coefficient scores (r = 0.875−0.964). The Chippaux-Smirak Index/Staheli Index correlation followed the results found by Zuil-Escobar et al. (2019), which was statistically significant (p = 0.01/r = 0.931) [24]. Therefore, since the Staheli Index is related to the mid-hindfoot and the Chippaux-Smirak Index to the fore-mid foot, this accordance among the Chippaux-Smirak Index/Staheli Index correlation can state an entire foot complex analysis and inner relationship.
Likewise, in the NF group, concerning the correlation between the Navicular Drop Test and the Resting Calcaneal Stance Position, we did not find a statistically significant correlation (p > 0.087/r = 0.267). In this group, the result seemed to be quite identical for the correlations of FootPrint Index, Arch Index, Chippaux-Smirak Index, and Staheli Index compared to the FF group. Yet only the Arch Angle/Staheli Index correlation did not show statistically significant results (p = 0.072/r = −0.303), while the other Arch Angle correlations showed statistically significant results (p < 0.05). These results are in discordance with those found by Zuil-Escobar et al. (2018). In their study, the authors related statistically significant results for the Arch Angle, Staheli Index, and Chippaux-Smirak Index correlations (p < 0.05), displaying absolute values ranging from 0.838 to 0.881, corresponding to a very high coefficient [23]. Likewise, the Staheli Index/Chippaux-Smirak Index correlation statistically significant result (p < 0.01/r = 0.965) follows those reported by Zuil-Escobar et al. (2018) who found a statistically significant positive very high correlation coefficient (p < 0.05/r = 0.881) [23]. Though, since the Arch Angle is characterized by the angle between the medial line and the most medial aspect of the midfoot area, the load distribution negatively influences this variable leading to a misunderstanding of the score and thereby, to foot posture assessment [23,29,30]. In addition, in NF subjects, using plantar pressure platforms, authors refer to a slightly higher load on the hindfoot relative to the mid-and forefoot [40]. Comparing the Arch Angle, Staheli Index, and Chippaux-Smirak Index tests, most authors analyze the foot contact area in various ways. The approaches of the different tests are different as the FootPrint Index and the Arch Index assess regarding all foot, the Chippaux-Smirak Index considers the fore-mid foot, and the Staheli Index the mid-hindfoot relationships. Since the foot is a multiple joints complex with different degrees of freedom, the discordance between tests can happen depending on the sample distribution and, therefore, mislead the Arch Angle accuracy.
Finally, analyzing the means value and standard deviation for each test (Table 2), some incoherence was found regarding the cut-off values of each foot posture assessment test. Some scores did not reach the cut-off values to diagnose foot posture conditions. For example, regarding the Arch Angle, values greater than 42° correspond to FF conditions [23,29,30]. However, in both groups of our study, the Arch Angle reached values greater than 42°, misleading the NF condition assessment. Interesting results were the FootPrint Index score on both groups. The NF present value was superior to 0.28 when the FF showed an opposite score which was 0.23, which is in contradiction to the cut-off value related previously [29]. Analyzing the Arch Index score, both mean scores represented the NF condition (0.21 < NF < 0.26), which was contradictory with the reference values that related 0.25 score as the FF condition [29,30,41]. Finally, both Chippaux-Smirak Index score means related to a NF condition in either group where the score was inferior to 0.45 and Staheli Index score related to CF in the NF group (CF < 0.5) and related to NF in the FF group (NF < 0.7) [24,26,30]. Those alterations of the mentioned test showed a false score which can mislead the evaluation and indeed can classify the foot posture antagonistically.
Although this study shares various foot posture test assessments and associations with each other, several limitations can compromise the results. Only subjects who presented bilateral FF conditions using the Navicular Drop Test participated in this study. However, as the foot complex lays on several joints and inter-associations, it will be interesting to evaluate the same correlation regarding the FootPrint parameters’ inclusion criterion instead of the Navicular Drop Test or the Resting Calcaneal Stance, whose assessment of foot posture is based on mobility. Furthermore, as stated previously, only subjects with a bilateral condition, whether FF or NF, were included in this study to include excluded temporary or functional alterations presented in unilateral conditions. Therefore unilateral FF or NF was excluded as stated previously in the exclusion criteria. Another study limitation is the non-characterization of subjects’ weight since several authors relate increased weight as a factor to develop higher foot arch values, i.e., FF condition. However, as the main purpose of this study was to investigate the correlation between the different diagnosis methods, the participants’ weight was not considered relevant as the study did not investigate condition assessment accuracy. Finally, the participants’ recruitment was realized according to convenience sampling methods. Thus, further studies with the inclusion of a random sampling process can ensure a more robust methodology.
5. Conclusions
Regarding both neutral foot and flatfoot groups, the correlations between those tests presented moderate to nearly perfect coefficient scores to identify neutral foot and flatfoot subjects while using FootPrint parameters. However, the combined use of several FootPrint parameters can be an important evaluation tool in the clinical environment with the understanding of several limitations and costs.
Author Contributions
Conceptualization, J.M., M.A.C. and F.S.; methodology, J.M. and M.A.C.; software, J.M., M.A.C. and C.S.; validation, J M. and M.A.C.; formal analysis, J.M. and M.A.C.: investigation, J.M. and M.A.C.; resources, M.A.C.; data curation, J.M. and M.A.C.; writing—original draft preparation, J.M.; writing—review and editing, M.A.C., F.S. and C.S.; visualization, J.M.; supervision, M.A.C. and F.S. All authors have read and agreed to the published version of the manuscript.
Funding
This research received no external funding.
Institutional Review Board Statement
The study was conducted according to the guidelines of the Declaration of Helsinki, and approved by the Ethics Committee of POLYTECHNIC INSTITUTE OF COIMBRA (13_CEPC2/2019-19/09/2019).
Informed Consent Statement
Informed consent was obtained from all subjects involved in the study.
Acknowledgments
ROBOCORP laboratory-i2a is co-funded by QREN under the Programa Mais Centro, of the Coordination Commission of the Central Region and the European Union through the European Regional Development Fund; Body Keeper Carlos Morgado Santos-Physiotherapy, Osteopathy and Posturology Clinic, Nutrition and Psychology (Coimbra, Portugal).
Conflicts of Interest
The authors declare no conflict of interest.
References
- Sung, P.S. The Sensitivity of Thresholds by Ground Reaction Force and Postural Stability in Subjects with and Without Navicular Drop. J. Foot Ankle Surg. 2018, 57, 742–746. [Google Scholar] [CrossRef]
- Sung, P.S.; Zipple, J.T.; Andraka, J.M.; Danial, P. The kinetic and kinematic stability measures in healthy adult subjects with and without flat foot. Foot 2017, 30, 21–26. [Google Scholar] [CrossRef] [PubMed]
- Rogers, M.W.; Mille, M. Balance perturbations. Handb. Clin. Neurol. 2018, 159, 85–105. [Google Scholar] [PubMed]
- Peterka, R.J. Sensory integration for human balance control. Handb. Clin. Neurol. 2018, 159, 27–42. [Google Scholar]
- Mackinnon, C.D. Sensorimotor anatomy of gait, balance, and falls. Handb. Clin. Neurol. 2018, 159, 3–26. [Google Scholar] [PubMed]
- Young, A.S.; Rosengren, S.M.; Welgampola, M.S. Disorders of the inner-ear balance organs and their pathways. Handb. Clin. Neurol. 2018, 159, 385–401. [Google Scholar] [PubMed]
- Angin, S.; Mickle, K.J.; Nester, C.J. Contributions of foot muscles and plantar fascia morphology to foot posture. Gait Posture 2018, 61, 238–242. [Google Scholar] [CrossRef]
- Sung, P.S. The ground reaction force thresholds for detecting postural stability in participants with and without flat foot. J. Biomech. 2016, 49, 60–65. [Google Scholar] [CrossRef]
- Alonso-Montero, C.; Torres-Rubio, A.; Padrós-Flores, N.; Navarro-Flores, E.; Segura-Heras, J.V. Footprint Curvature in Spanish Women: Implications for Footwear Fit. Int. J. Environ. Res. Public Health 2020, 17, 1876. [Google Scholar] [CrossRef] [Green Version]
- Nagai, K.; Yamada, M.; Uemura, K.; Yamada, Y.; Ichihashi, N.; Tsuboyama, T. Differences in muscle coactivation during postural control between healthy older and young adults. Arch. Gerontol. Geriatr. 2011, 53, 338–343. [Google Scholar] [CrossRef] [Green Version]
- López-López, D.; Vilar-Fernández, J.M.; Barros-García, G.; Losa-Iglesias, M.E.; Palomo-López, P.; Becerro-De-Bengoa-Vallejo, R.; Calvo-Lobo, C. Foot Arch Height and Quality of Life in Adults: A Strobe Observational Study. Int. J. Environ. Res. Public Health 2018, 15, 1555. [Google Scholar] [CrossRef] [PubMed] [Green Version]
- Buldt, A.K.; Murley, G.S.; Butterworth, P.; Levinger, P.; Menz, H.B.; Landorf, K.B. The relationship between foot posture and lower limb kinematics during walking: A systematic review. Gait Posture 2013, 38, 363–372. [Google Scholar] [CrossRef] [PubMed]
- Buldt, A.K.; Levinger, P.; Murley, G.S.; Menz, H.B.; Nester, C.J.; Landorf, K.B. Foot posture is associated with kinematics of the foot during gait: A comparison of normal, planus and cavus feet. Gait Posture 2015, 42, 42–48. [Google Scholar] [CrossRef] [PubMed]
- Eslami, M.; Damavandi, M.; Ferber, R. Association of Navicular Drop and Selected Lower-Limb Biomechanical Measures During the Stance Phase of Running. J. Appl. Biomech. 2014, 30, 250–254. [Google Scholar] [CrossRef] [PubMed]
- Twomey, D.; McIntosh, A.S.; Simon, J.; Lowe, K.; Wolf, S.I. Kinematic differences between normal and low arched feet in children using the Heidelberg foot measurement method. Gait Posture 2010, 32, 1–5. [Google Scholar] [CrossRef]
- Gross, K.D.; Felson, D.T.; Niu, J.; Hunter, D.J.; Guermazi, A.; Roemer, F.W.; Dufour, A.B.; Gensure, R.H.; Hannan, M.T. Association of flat feet with knee pain and cartilage damage in older adults. Arthritis Care Res. 2011, 63, 937–944. [Google Scholar] [CrossRef] [Green Version]
- Levinger, P.; Zeina, D.; Teshome, A.K.; Skinner, E.; Begg, R.; Abbott, J.H. A real time biofeedback using Kinect and Wii to improve gait for post-total knee replacement rehabilitation: A case study report. Disabil. Rehabil. Assist. Technol. 2016, 11, 251–262. [Google Scholar] [CrossRef]
- Hunt, A.E.; Smith, R.M. Mechanics and control of the flat versus normal foot during the stance phase of walking. Clin. Biomech. 2004, 19, 391–397. [Google Scholar] [CrossRef]
- Buldt, A.K.; Forghany, S.; Landorf, K.B.; Levinger, P.; Murley, G.S.; Menz, H.B. Foot posture is associated with plantar pressure during gait: A comparison of normal, planus and cavus feet. Gait Posture 2018, 62, 235–240. [Google Scholar] [CrossRef]
- Kosashvili, Y.; Fridman, T.; Backstein, D.; Safir, O.; Ziv, Y.B. The Correlation between Pes Planus and Anterior Knee or Intermittent Low Back Pain. Foot Ankle Int. 2008, 29, 910–913. [Google Scholar] [CrossRef]
- Caravaggi, P.; Sforza, C.; Leardini, A.; Portinaro, N.; Panou, A. Effect of plano-valgus foot posture on midfoot kinematics during barefoot walking in an adolescent population. J. Foot Ankle Res. 2018, 11, 1–9. [Google Scholar] [CrossRef] [PubMed]
- López-López, D.; Becerro-De-Bengoa-Vallejo, R.; Losa-Iglesias, M.E.; Palomo-López, P.; Rodríguez-Sanz, D.; Brandariz-Pereira, J.M.; Calvo-Lobo, C. Evaluation of foot health related quality of life in individuals with foot problems by gender: A cross-sectional comparative analysis study. BMJ Open 2018, 8, e023980. [Google Scholar] [CrossRef] [PubMed] [Green Version]
- Zuil-Escobar, J.C.; Martínez-Cepa, C.B.; Martín-Urrialde, J.A.; Gómez-Conesa, A. Medial Longitudinal Arch: Accuracy, Reliability, and Correlation Between Navicular Drop Test and Footprint Parameters. J. Manip. Physiol. Ther. 2018, 41, 672–679. [Google Scholar] [CrossRef] [PubMed]
- Zuil-Escobar, J.C.; Martínez-Cepa, C.B.; Martín-Urrialde, J.A.; Gómez-Conesa, A. Evaluating the Medial Longitudinal Arch of the Foot: Correlations, Reliability, and Accuracy in People with a Low Arch. Phys. Ther. 2018, 99, 364–372. [Google Scholar] [CrossRef] [PubMed]
- Cho, Y.; Park, J.-W.; Nam, K. The relationship between foot posture index and resting calcaneal stance position in elementary school students. Gait Posture 2019, 74, 142–147. [Google Scholar] [CrossRef]
- Khanna, N.; Premavathy, D. Assessing occurrence of flatfoot condition among student population. Drug Investig. Today 2019, 11, 2477–2480. [Google Scholar]
- Kim, J.-a.; Lim, O.-b.; Yi, C.-h. Difference in static and dynamic stability between flexible flatfeet and neutral feet. Gait Posture 2015, 41, 546–550. [Google Scholar] [CrossRef]
- Chen, K.C.; Yeh, C.J.; Kuo, J.F.; Hsieh, C.L.; Yang, S.F.; Wang, C.H. Footprint analysis of flatfoot in preschool-aged children. Eur. J. Pediatr. 2011, 170, 611–617. [Google Scholar] [CrossRef]
- Tahmasebi, R.; Karimi, M.T.; Satvati, B.; Fatoye, F. Evaluation of Standing Stability in Individuals with flatfeet. Foot Ankle Spec. 2015, 8, 168–174. [Google Scholar] [CrossRef]
- Queen, R.M.; Mall, N.A.; Hardaker, W.M.; Nunley, J.A. Describing the Medial Longitudinal Arch Using Footprint Indices and a Clinical Grading System. Foot Ankle Int. 2007, 28, 456–462. [Google Scholar] [CrossRef]
- CCavanagh, P.R.; Rodgers, M.M. The arch index: A useful measure from footprints. J. Biomech. 1987, 20, 547–551. [Google Scholar] [CrossRef]
- Aboelnasr, E.A.; El-Talawy, H.A.; Abdelazim, F.H.; Hegazy, F.A. Sensitivity and specificity of normalized truncated navicular height in assessment of static foot posture in children aged 6–12 years. Hong Kong Physiother. J. 2019, 39, 15–23. [Google Scholar] [CrossRef]
- Roth, S.; Roth, A.; Jotanovic, Z.; Madarevic, T. Navicular index for differentiation of flatfoot from normal foot. Int. Orthop. 2013, 37, 1107–1112. [Google Scholar] [CrossRef] [Green Version]
- Wong, C.K.; Weil, R.; De Boer, E. Standardizing Foot-Type Classification Using Arch Index Values. Physiother. Can. 2012, 64, 280–283. [Google Scholar] [CrossRef] [Green Version]
- Holt, G.R. Declaration of Helsinki—The World’s Document of Conscience and Responsibility. South. Med. J. 2014, 107, 407. [Google Scholar] [CrossRef]
- Vandenbroucke, J.P.; von Elm, E.; Altman, D.G.; Gøtzsche, P.C.; Mulrow, C.D.; Pocock, S.J.; Poole, C.; Schlesselman, J.J.; Egger, M. STROBE Initiative. Strengthening the Reporting of Observational Studies in Epidemiology (STROBE): Explanation and elaboration. Int. J. Surg. 2014, 12, 1500–1524. [Google Scholar] [CrossRef] [Green Version]
- Tsai, L.C.; Yu, B.; Mercer, V.S.; Gross, M.T. Comparison of different structural foot types for measures of standing postural control. J. Orthop. Sports Phys. Ther. 2006, 36, 942–953. [Google Scholar] [CrossRef] [Green Version]
- Hopkins, W.G. A scale of magnitudes for effect statistics. New View Stat. 2002, 502, 411. [Google Scholar]
- Baumfeld, D.; Baumfeld, T.; Da Rocha, R.L.; Macedo, B.; Raduan, F.; Zambelli, R.; Silva, T.A.A.; Nery, C. Reliability of Baropodometry on the Evaluation of Plantar Load Distribution: A Transversal Study. BioMed Res. Int. 2017, 2017, 1–4. [Google Scholar] [CrossRef] [PubMed] [Green Version]
- Fernández-Seguín, L.M.; Diaz Mancha, J.A.; Sánchez Rodríguez, R.; Escamilla Martínez, E.; Gómez Martín, B.; Ramos Ortega, J. Comparison of plantar pressures and contact area between normal and cavus foot. Gait Posture 2014, 39, 789–792. [Google Scholar] [CrossRef] [PubMed]
- Menz, H.B.; Fotoohabadi, M.R.; Wee, E.; Spink, M.J. Visual categorisation of the arch index: A simplified measure of foot posture in older people. J. Foot Ankle Res. 2012, 5, 1–10. [Google Scholar] [CrossRef] [PubMed]
Figure 1.
Significant correlations result in neutral foot subjects.


Figure 2.
Significant correlations result in flatfoot subjects.


Table 1.
Sample characteristics.
| N | Minimum | Maximum | Mean | Standard Deviation (SD) | |
|---|---|---|---|---|---|
| Age (years) | 37 | 18 | 35 | 23.10 | 4.30 |
| Height (m) | 1.47 | 1.85 | 1.70 | 9.55 | |
| Weight (kg) | 46.90 | 116.00 | 74.51 | 15.44 |
Characteristics of the entire sample.
Table 2.
Groups characteristics.
| Group | n | NDT (mm) | RCSP (º) | AA (º) | FPI (Score) | AI (Score) | CSI (Score) | SI (Score) |
|---|---|---|---|---|---|---|---|---|
| NF | 21 | 5.36 ± 2.31 | 2.15 ± 1.74 | 43.86 ± 5.34 | 0.28 ± 0.05 | 0.22 ± 0.06 | 0.36 ± 0.14 | 0.48 ± 0.20 |
| FF | 16 | 11.23 ± 1.45 | 4.72 ± 1.56 | 61.13 ± 12.21 | 0.23 ± 0.06 | 0.25 ± 0.05 | 0.43 ± 0.14 | 0.53 ± 0.17 |
Mean ± Standard Deviation; NF: neutral foot group; FF: flatfoot group; NDT: Navicular Drop Test; RCSP: Resting Calcaneal Stance Position; AA: Arch Angle; FPI: FootPrint Arch Index; AI: Arch Index; SI: Staheli Index; CSI: Chippaux-Smirak Index.
Table 3.
Pearson’s correlation values of the neutral foot group between all tests.
| RCSP | AA | FPI | AI | CSI | SI | ||
|---|---|---|---|---|---|---|---|
| NDT | Correlation value | 0.267 | −0.193 | −0.018 | −0.011 | −0.005 | −0.029 |
| p-value | 0.087 | 0.259 | 0.917 | 0.949 | 0.978 | 0.868 | |
| RCSP | Correlation value | −0.269 | 0.084 | −0.076 | −0.052 | −0.036 | |
| p-value | 0.112 | 0.627 | 0.658 | 0.764 | 0.834 | ||
| AA | Correlation value | 0.443 | −0.434 | −0.341 | −0.303 | ||
| p-value | 0.007 | 0.008 | 0.042 | 0.072 | |||
| FPI | Correlation value | −0.901 | −0.850 | −0.813 | |||
| p-value | 0.000 | 0.000 | 0.000 | ||||
| AI | Correlation value | 0.928 | 0.918 | ||||
| p-value | 0.000 | 0.000 | |||||
| CSI | Correlation value | 0.965 | |||||
| p-value | 0.000 | ||||||
NDT: Navicular Drop Test; RCSP: Resting Calcaneal Stance Position; AA: Arch Angle; FPI: FootPrint Index; AI: Arch Index; SI: Staheli Index; CSI: Chippaux-Smirak Index.
Table 4.
Pearson’s correlation values of the flatfoot group between all tests.
| RCSP | AA | FPI | AI | CSI | SI | ||
|---|---|---|---|---|---|---|---|
| NDT | Correlation value | 0.279 | 0.190 | 0.181 | −0.123 | −0.224 | −0.228 |
| p-value | 0.122 | 0.297 | 0.321 | 0.502 | 0.218 | 0.208 | |
| RCSP | Correlation value | −0.161 | 0.079 | −0.157 | −0.113 | −0.100 | |
| p-value | 0.378 | 0.668 | 0.390 | 0.539 | 0.584 | ||
| AA | Correlation value | 0.590 | −0.509 | −0.430 | −0.353 | ||
| p-value | 0.000 | 0.003 | 0.014 | 0.048 | |||
| FPI | Correlation value | −0.943 | −0.885 | −0.868 | |||
| p-value | 0.000 | 0.000 | 0.000 | ||||
| AI | Correlation value | 0.906 | 0.867 | ||||
| p-value | 0.000 | 0.000 | |||||
| CSI | Correlation value | 0.955 | |||||
| p-value | 0.000 | ||||||
NDT: Navicular Drop Test; RCSP: Resting Calcaneal Stance Position; AA: Arch Angle; FPI: FootPrint Arch Index; AI: Arch Index; SI: Staheli Index; CSI: Chippaux-Smirak Index.
Publisher’s Note: MDPI stays neutral with regard to jurisdictional claims in published maps and institutional affiliations. |
© 2021 by the authors. Licensee MDPI, Basel, Switzerland. This article is an open access article distributed under the terms and conditions of the Creative Commons Attribution (CC BY) license (https://creativecommons.org/licenses/by/4.0/).
Share and Cite
MDPI and ACS Style
Marouvo, J.; Castro, M.A.; Santos, C.; Sousa, F. Correlation between Different Methods to Diagnose Foot Posture Condition. J 2021, 4, 233-243. https://0-doi-org.brum.beds.ac.uk/10.3390/j4030019
AMA Style
Marouvo J, Castro MA, Santos C, Sousa F. Correlation between Different Methods to Diagnose Foot Posture Condition. J. 2021; 4(3):233-243. https://0-doi-org.brum.beds.ac.uk/10.3390/j4030019
Chicago/Turabian StyleMarouvo, Joel, Maria António Castro, Carlos Santos, and Filipa Sousa. 2021. "Correlation between Different Methods to Diagnose Foot Posture Condition" J 4, no. 3: 233-243. https://0-doi-org.brum.beds.ac.uk/10.3390/j4030019