
Hydrogen Production by Fluidized Bed Reactors: A Quantitative Perspective Using the Supervised Machine Learning Approach

 ,
,
Abstract
:1. Introduction
2. Analysis Approach
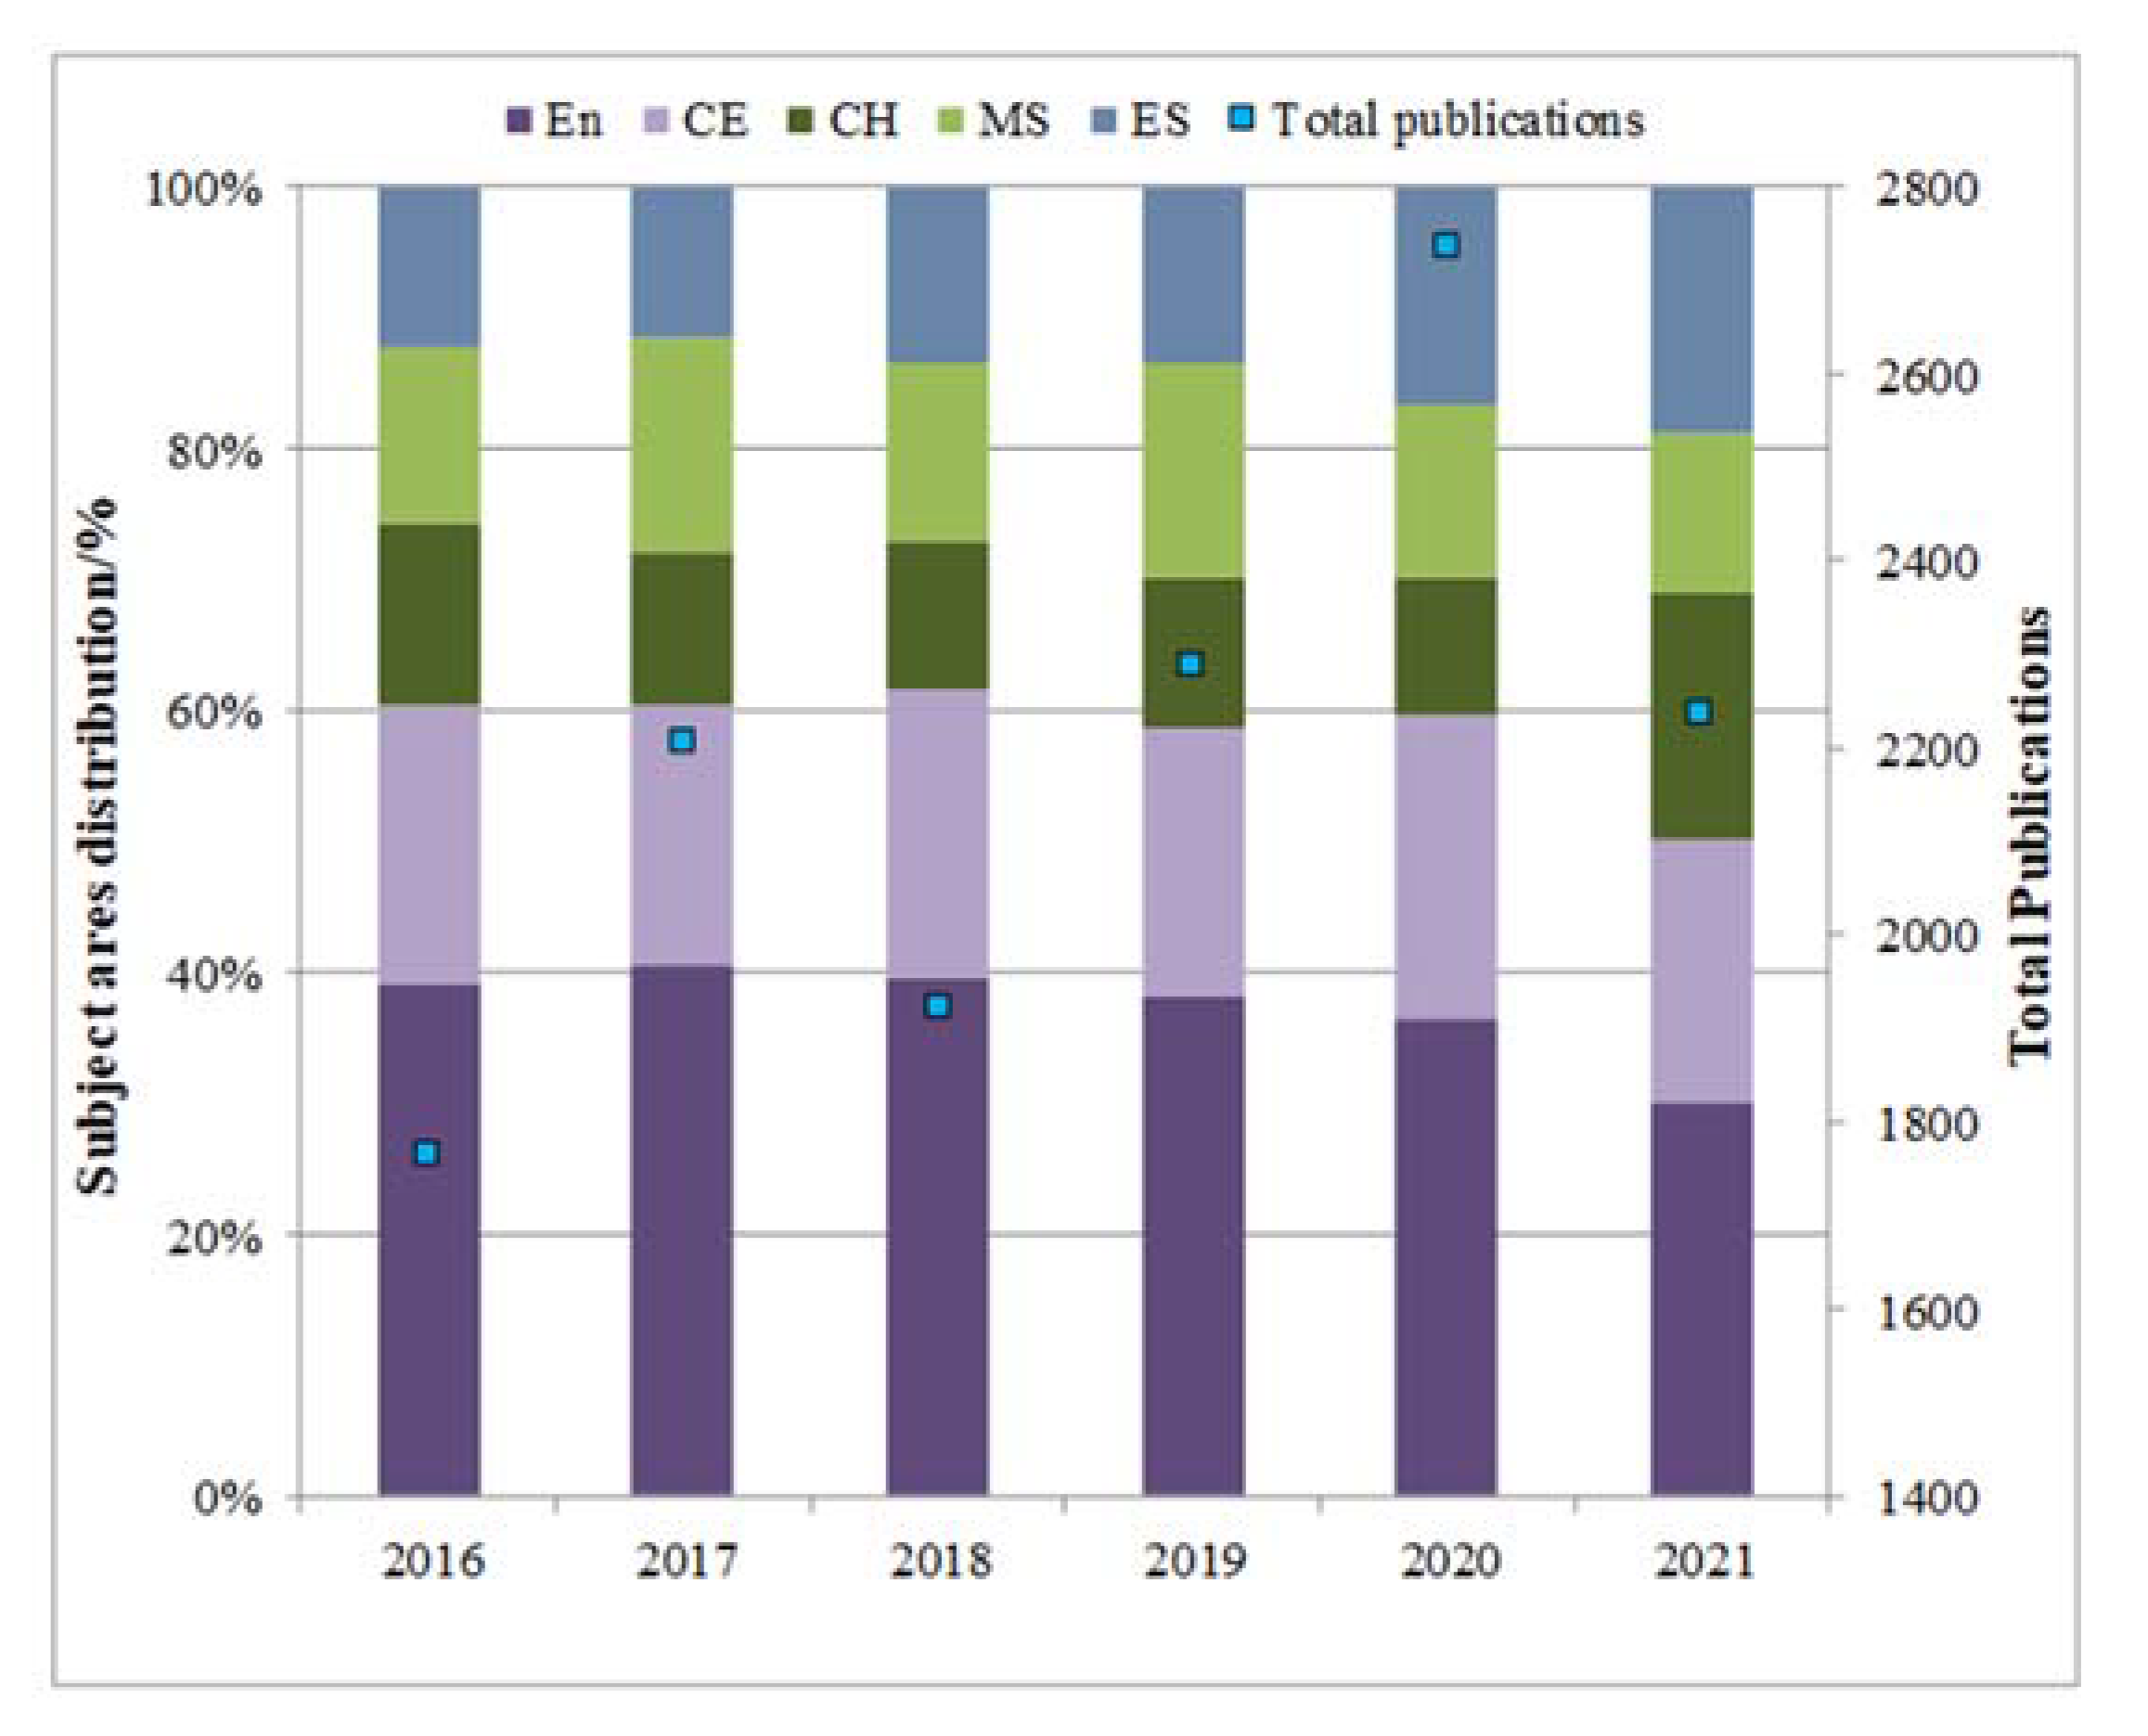
2.1. Literature Collections and Scoping
2.2. Methodology for Data Training and Predictions
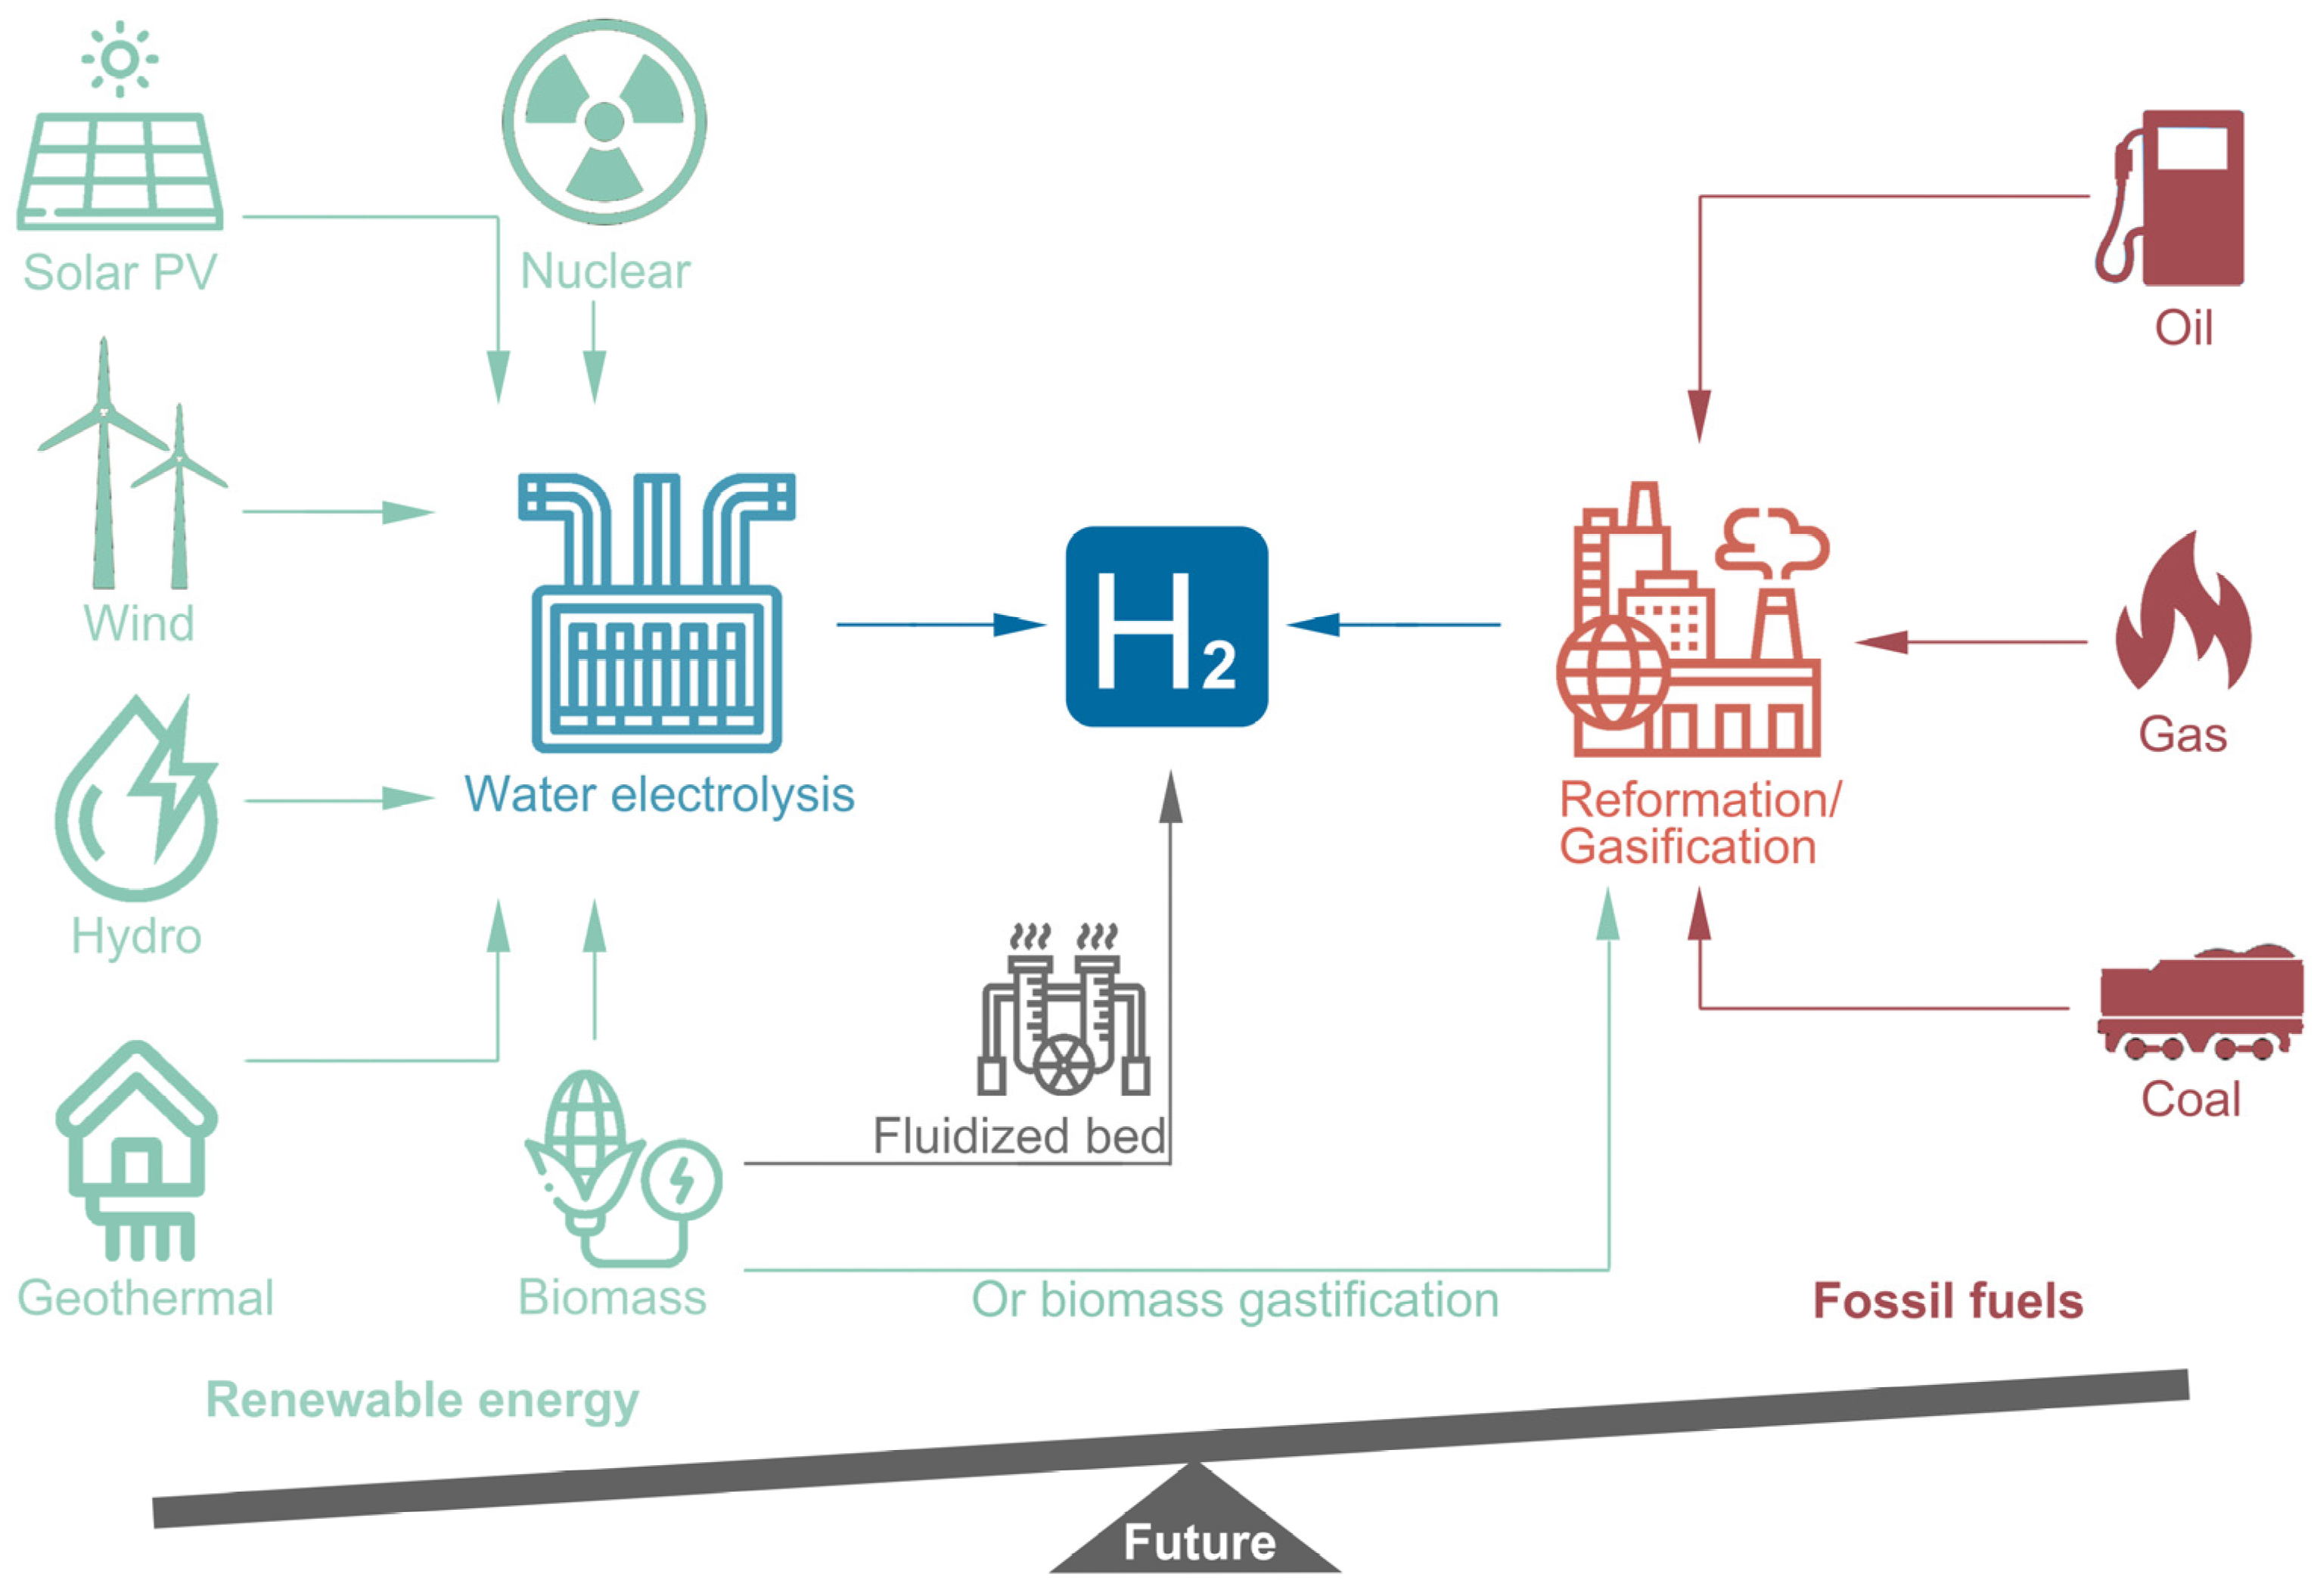
3. Source of Hydrogen
3.1. Steam Methane Reforming (SMR)
3.2. Electrolysis
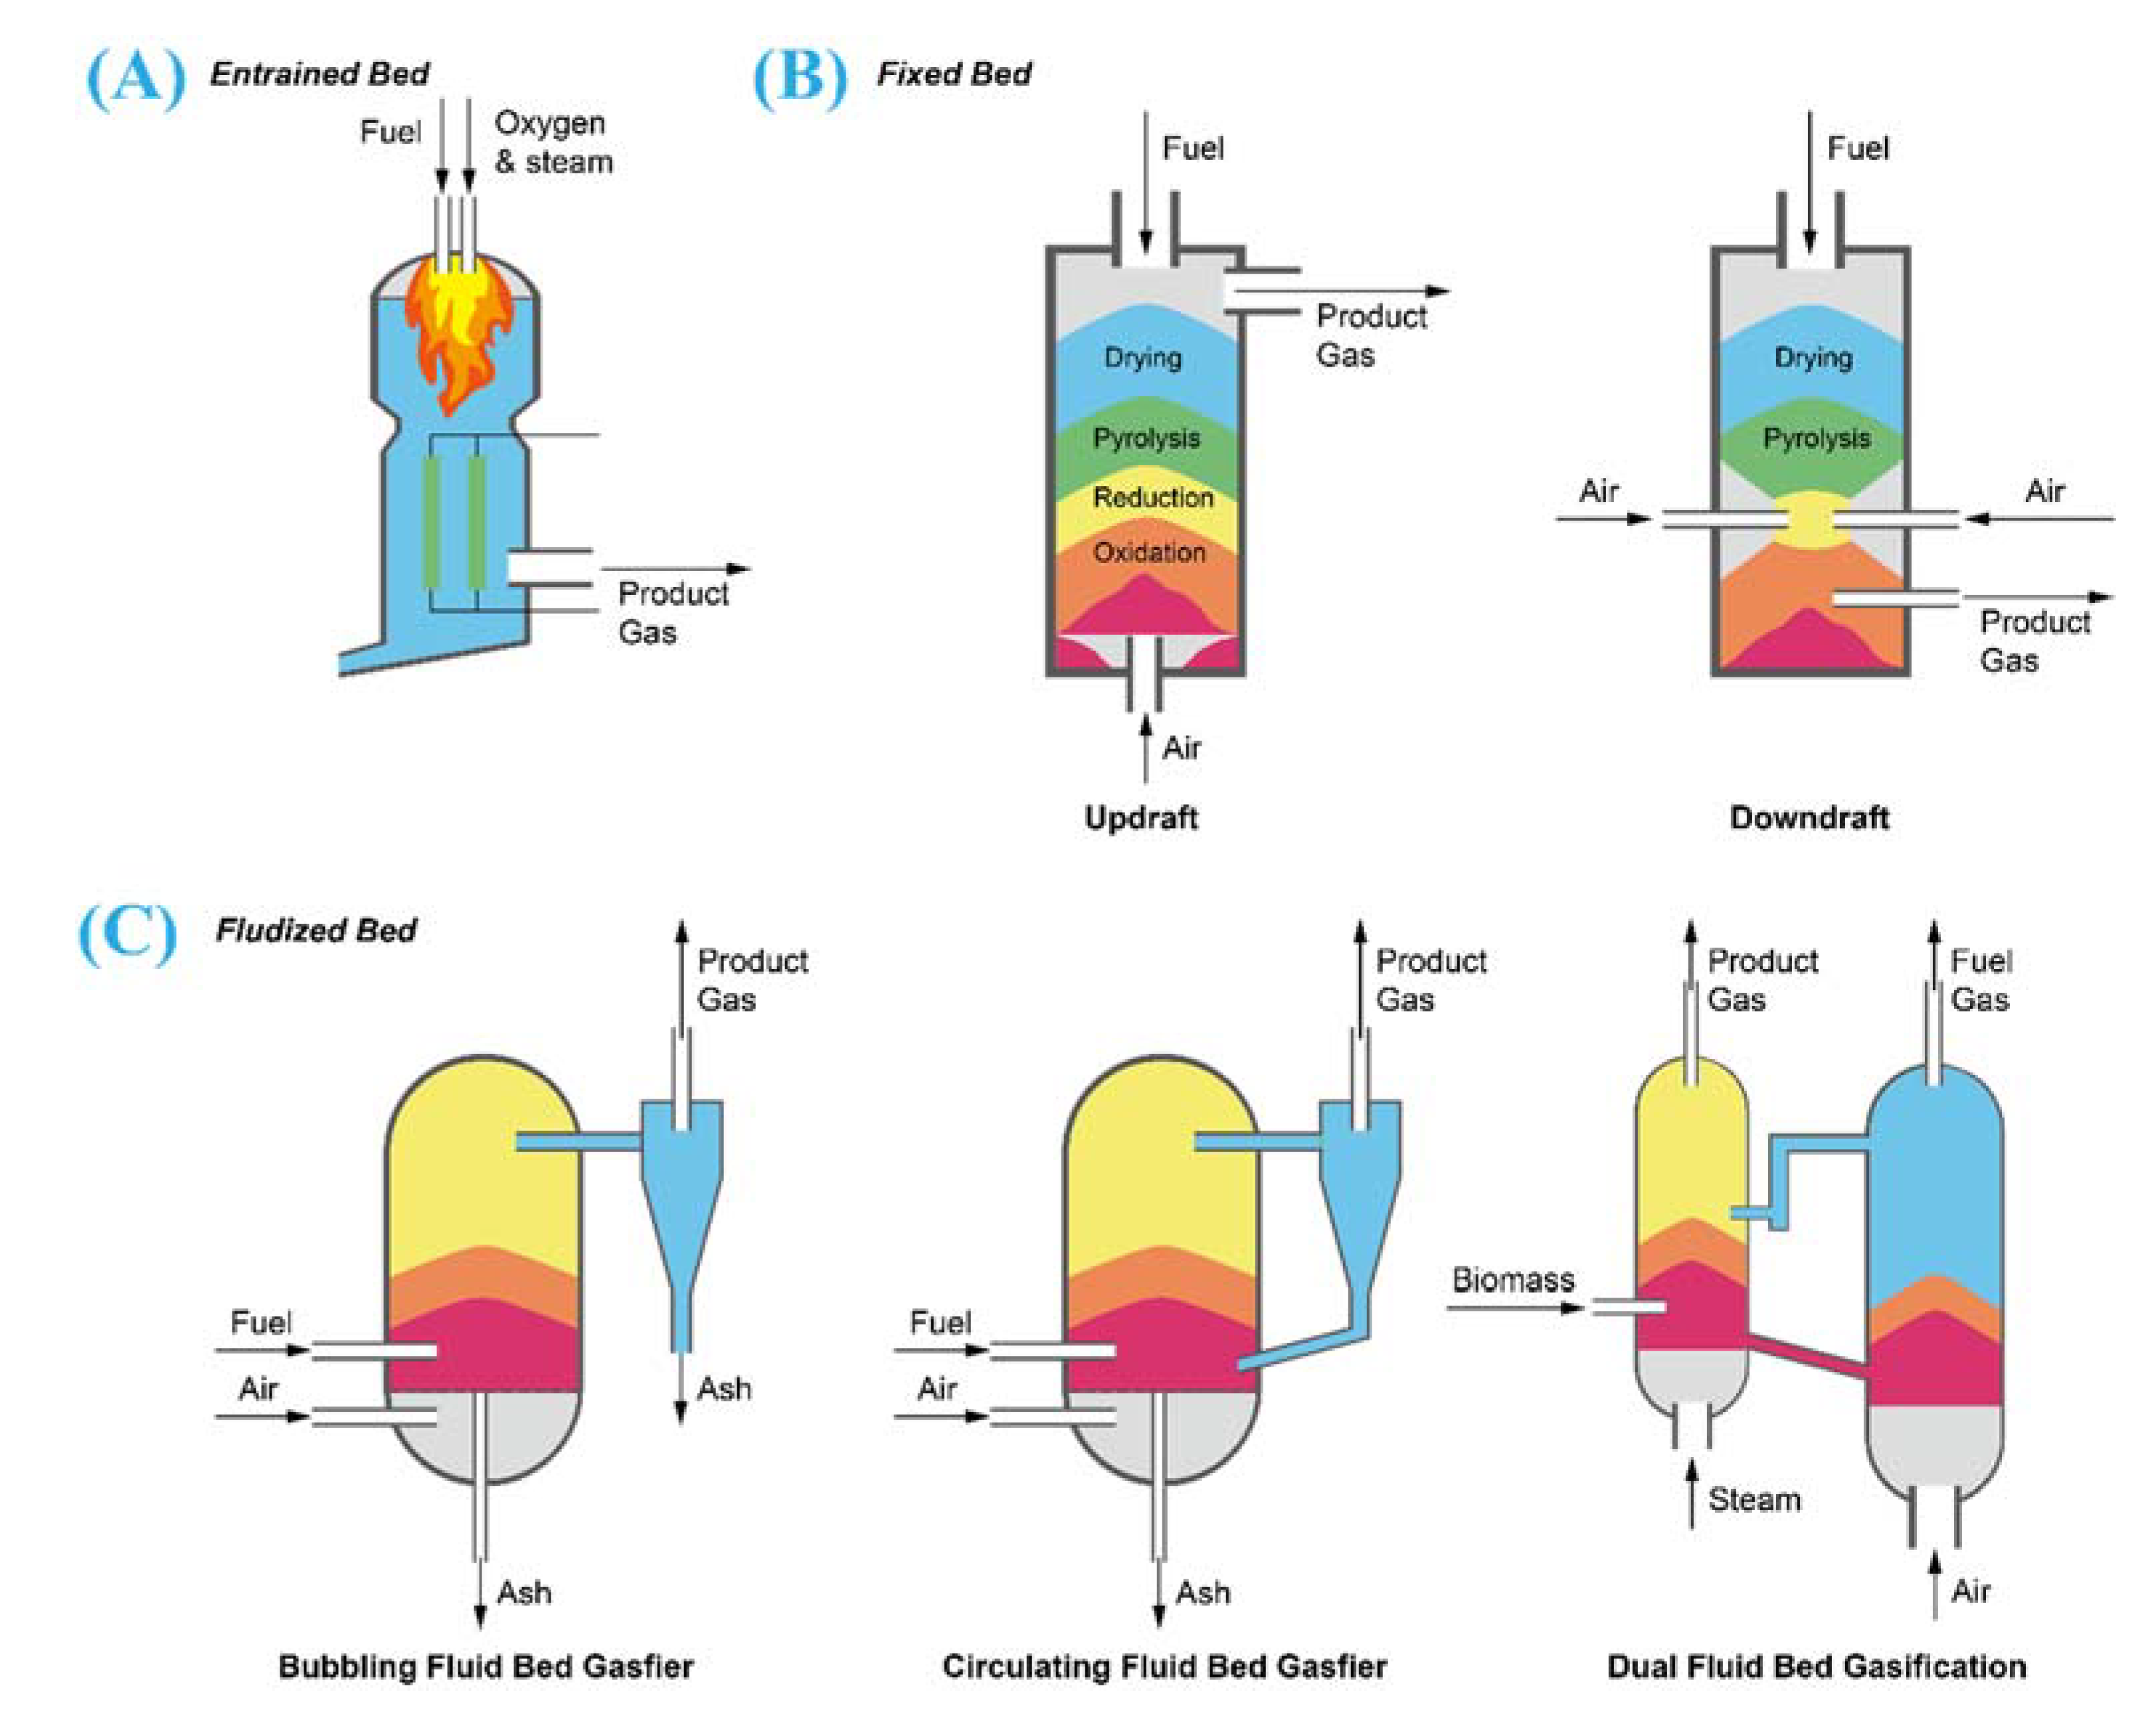
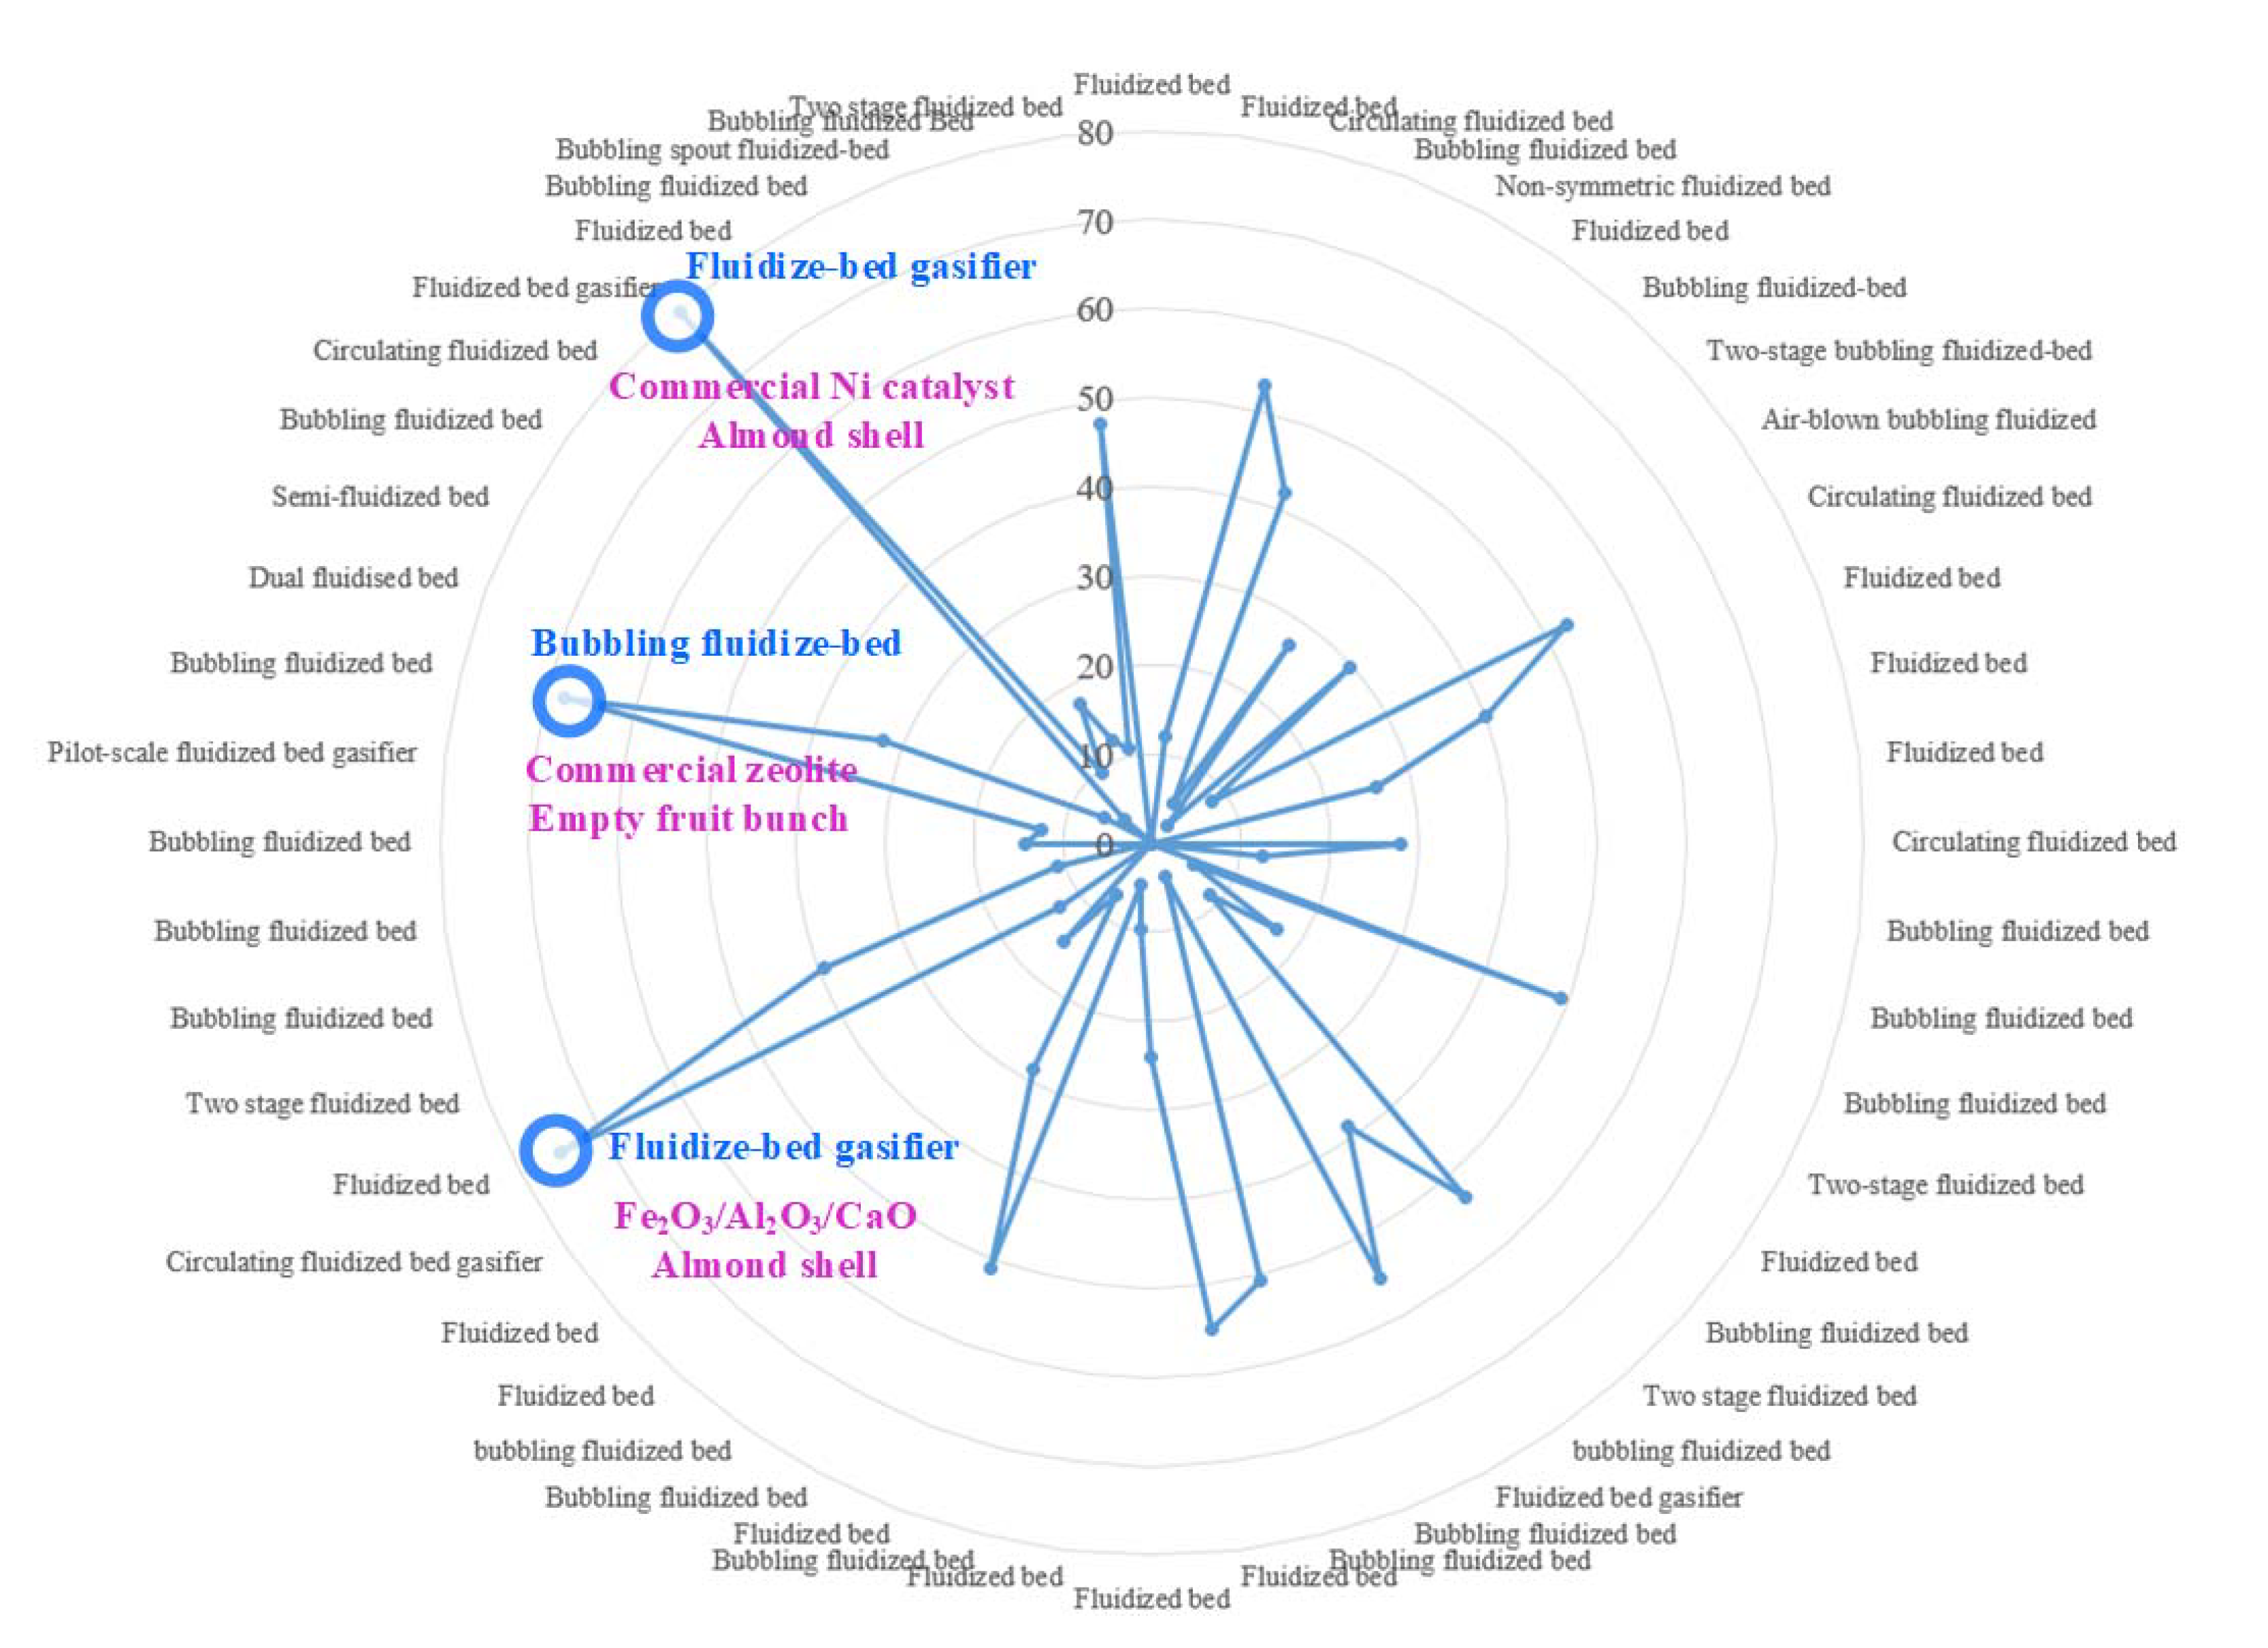
3.3. Gasification of Biomass
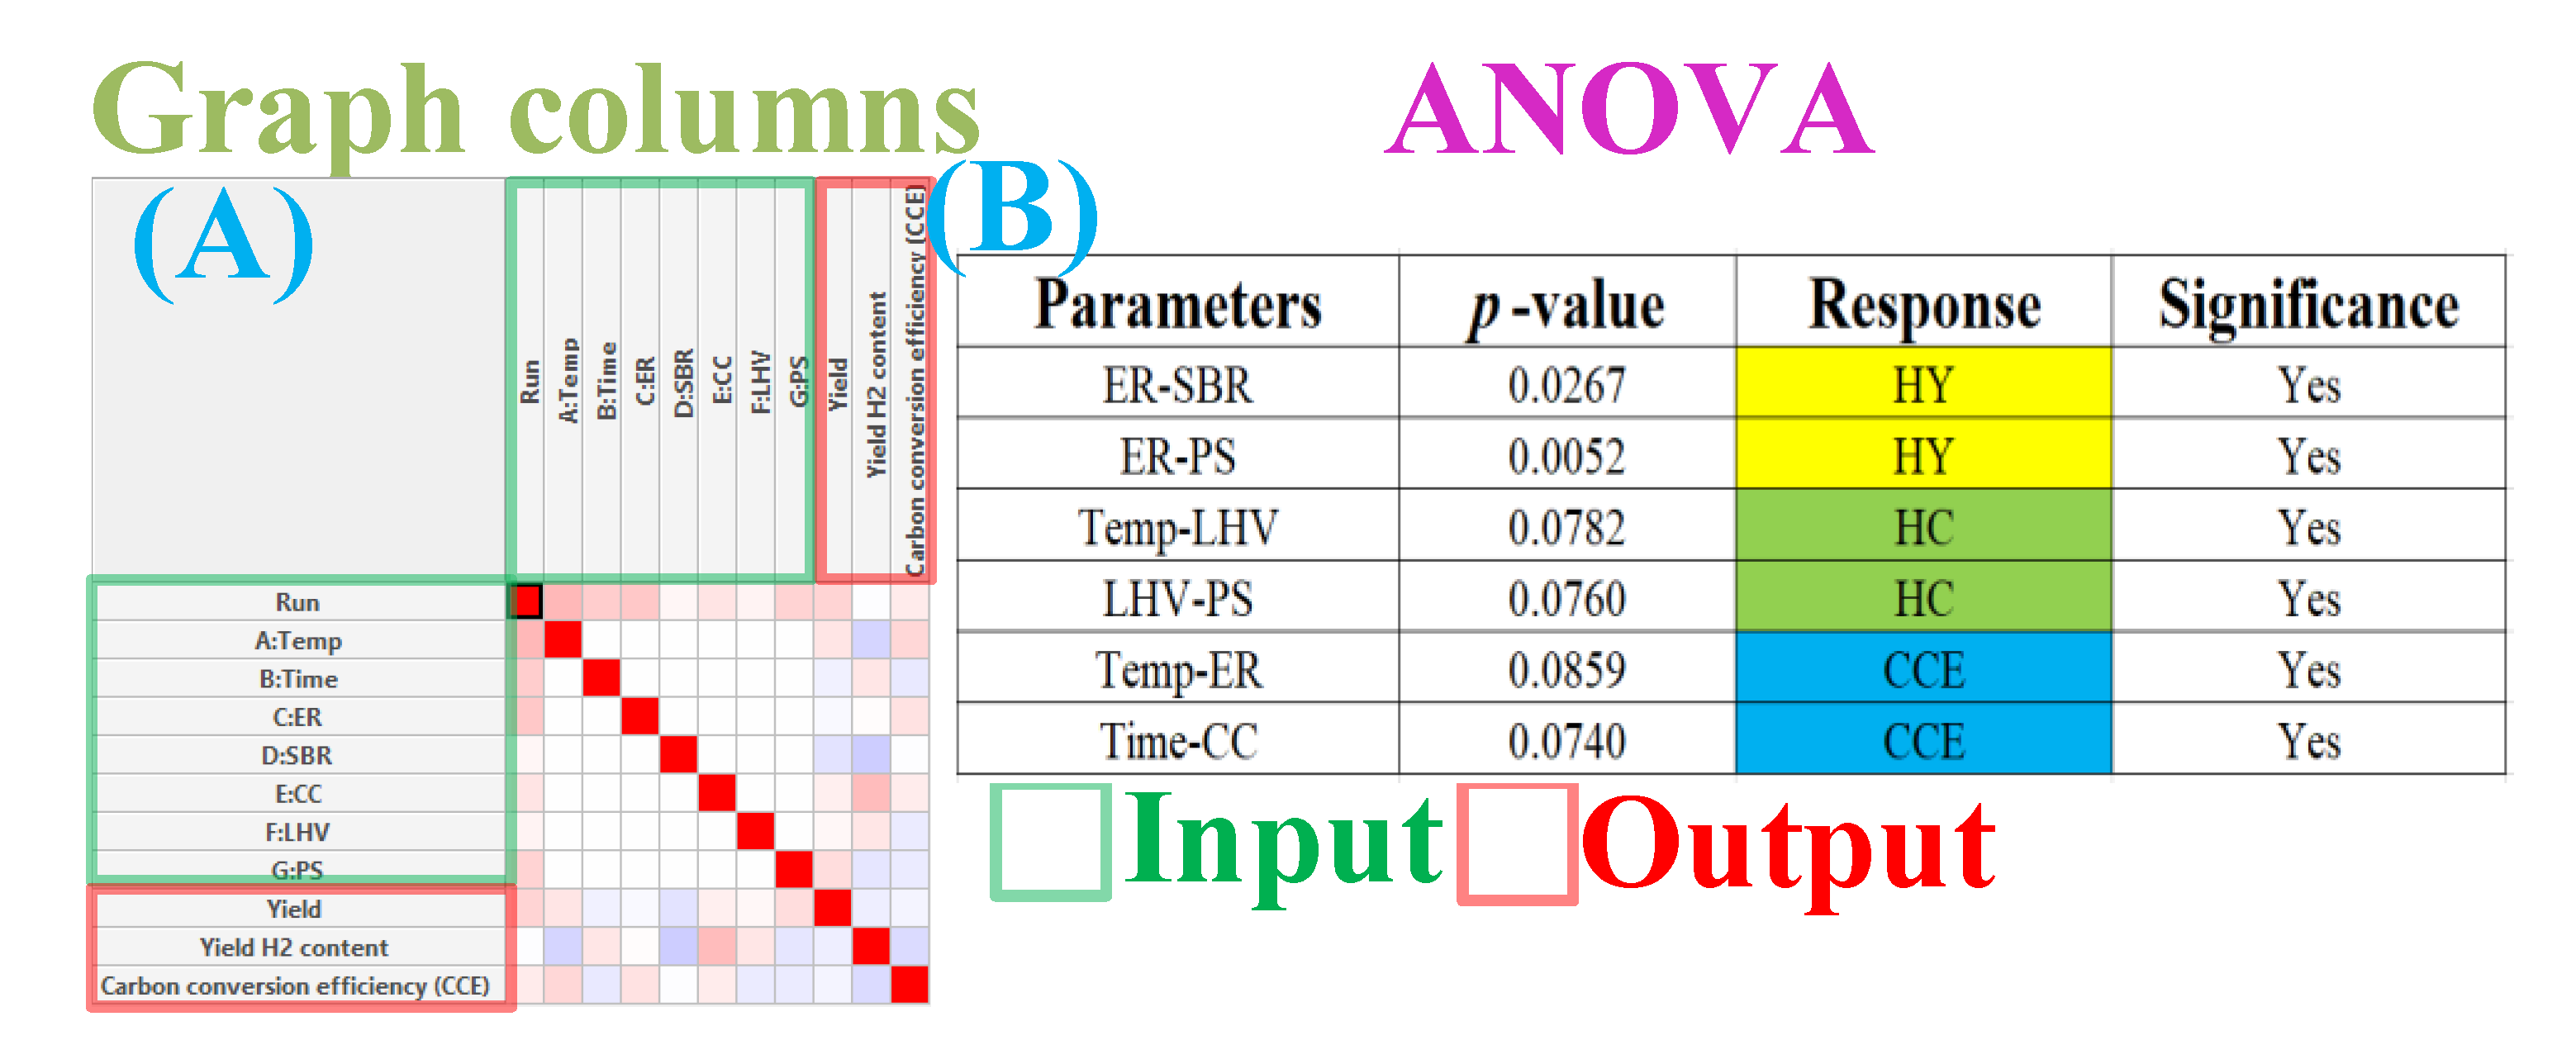
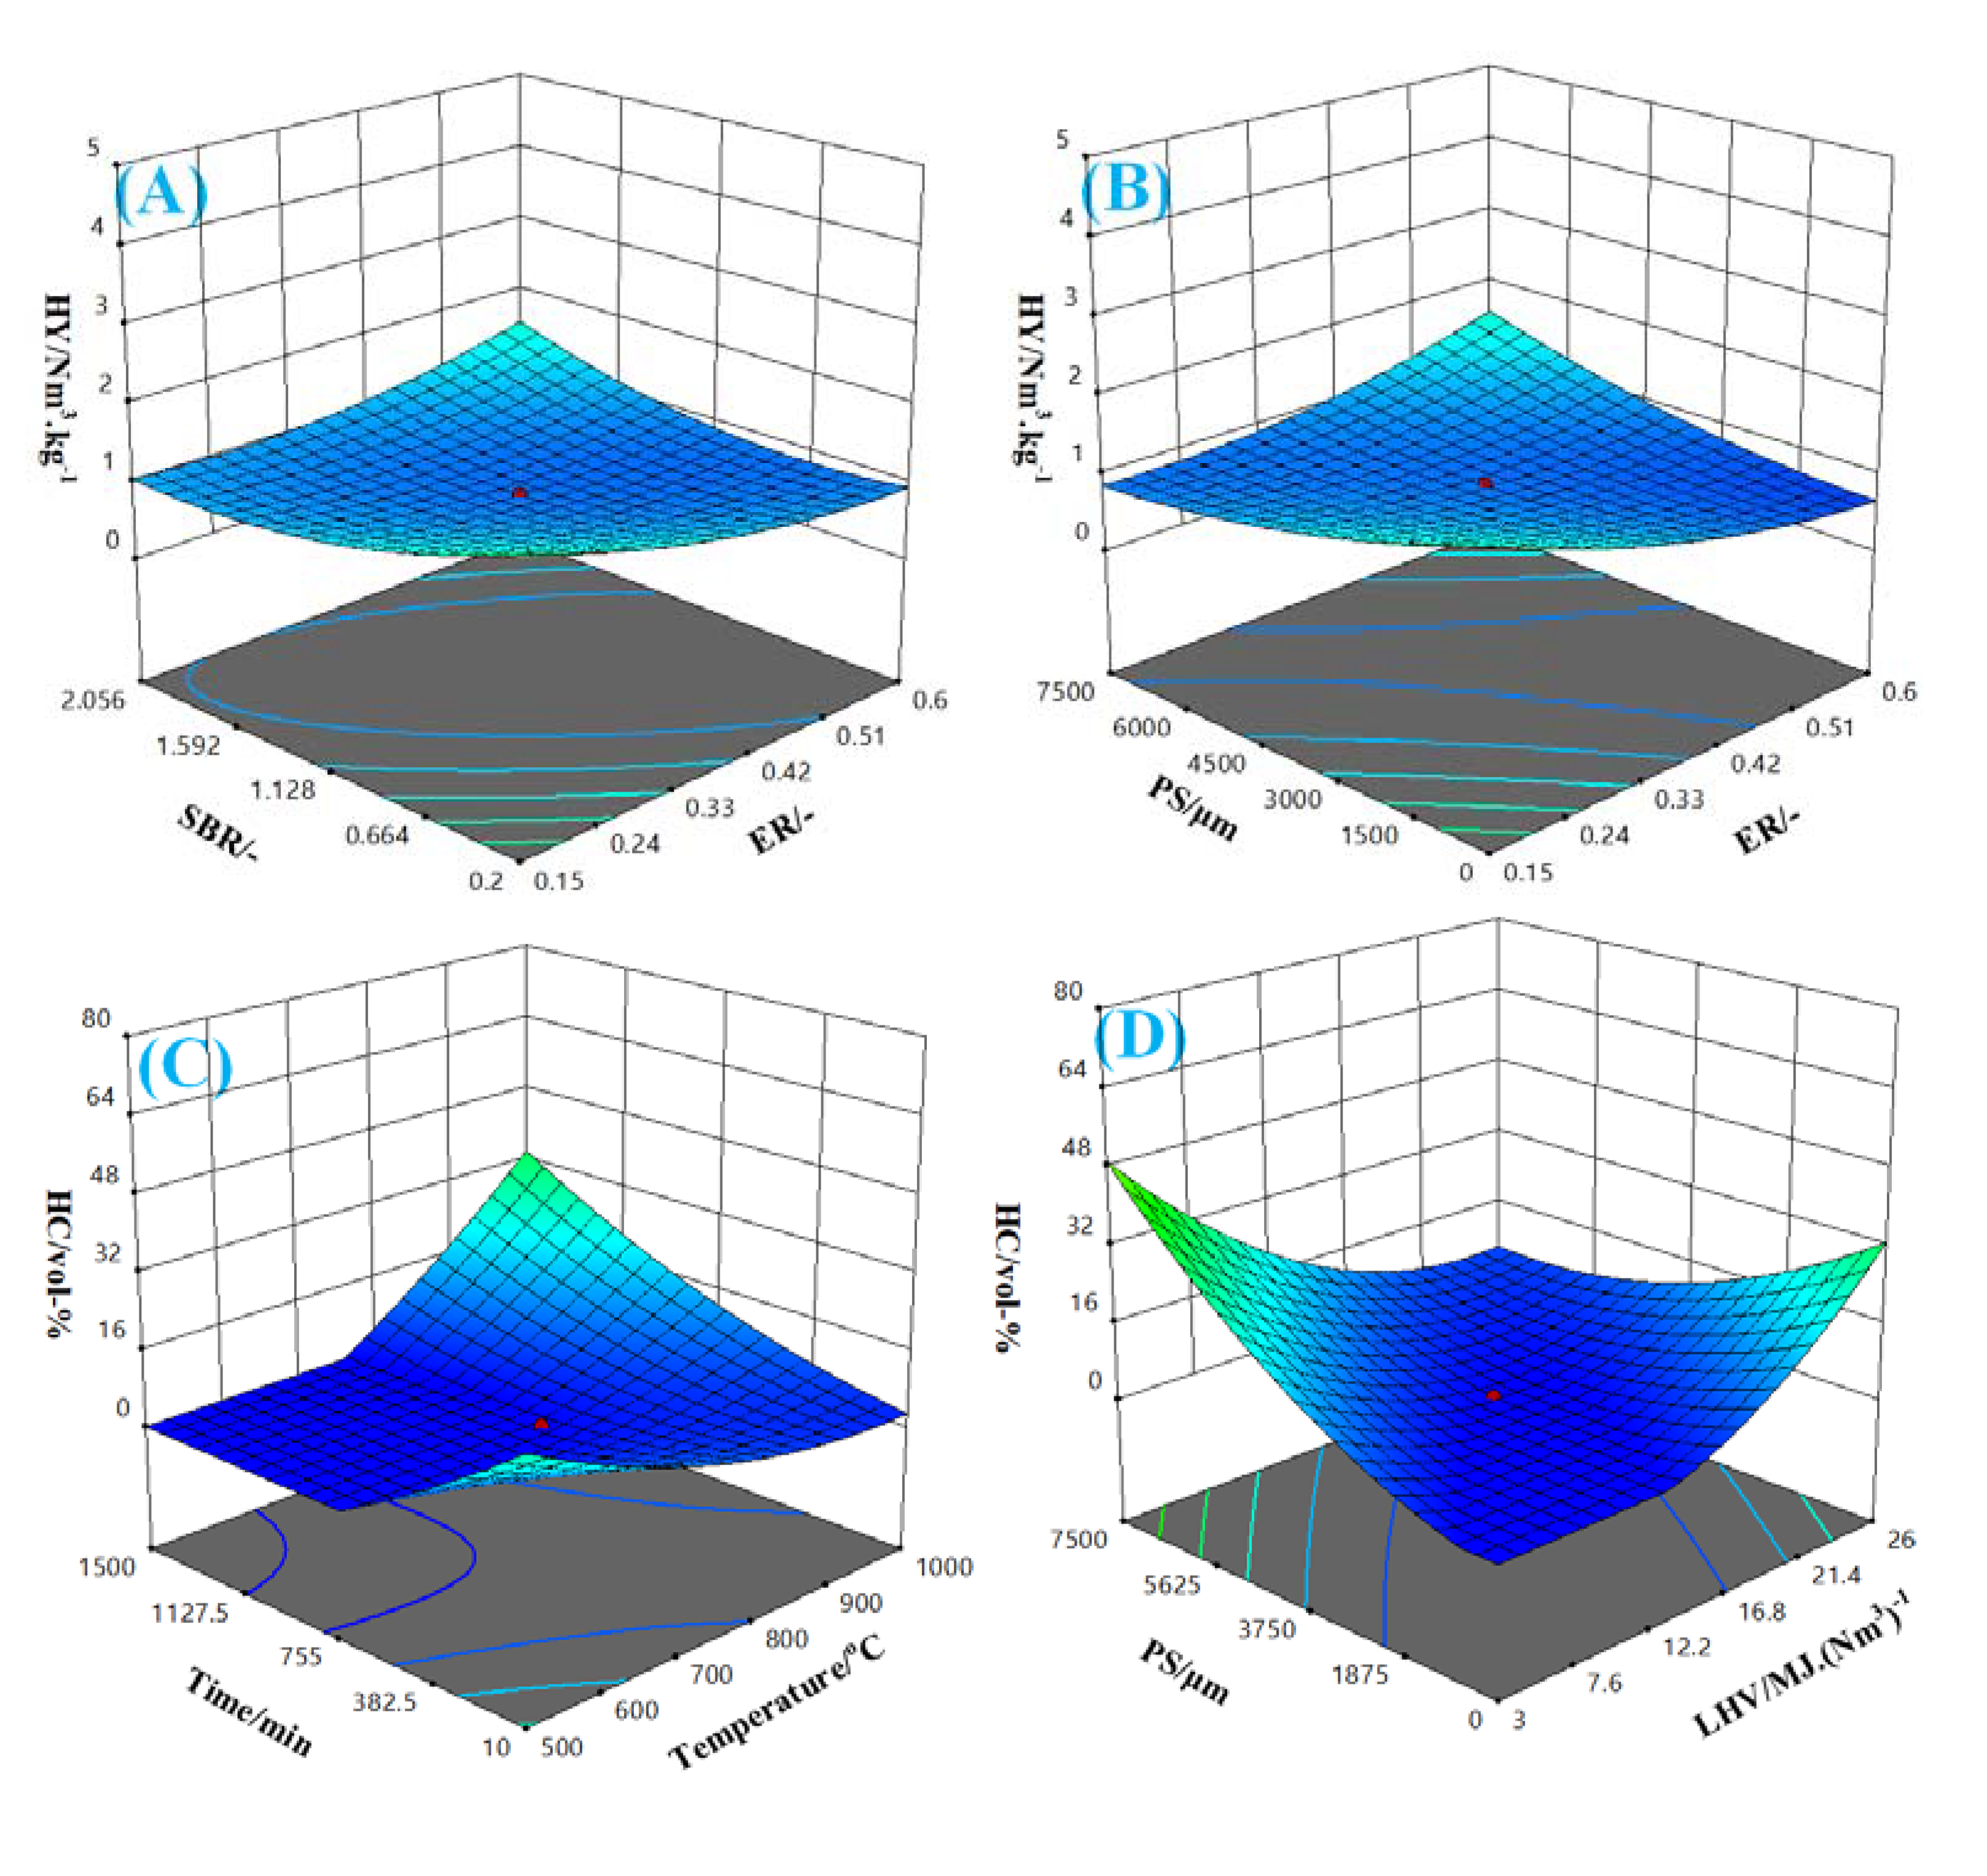
4. Statistical Analysis of Parameter upon Output
5. Conclusions
Author Contributions
Funding
Institutional Review Board Statement
Informed Consent Statement
Data Availability Statement
Acknowledgments
Conflicts of Interest
Abbreviations
| AAEM | Alkaline anion exchange membrane |
| ANNs | Artificial neural networks |
| ANNs-RSM | Artificial neural networks coupled with response surface methodology |
| ANOVA | Analysis of variation |
| BFB | Bubbling fluidized bed |
| CC | Carbon content |
| CCE | Carbon conversion efficiency |
| CE | Chemical engineering |
| CFB | Circulating fluidized bed |
| CH | Chemistry |
| DFB | Dual fluidized bed |
| En | Energy |
| ES | Environmental sciences |
| FBG | Fluidized bed gasifiers |
| FBR | Fluidized bed reactors |
| EFG | Entrained flow gasifiers |
| ER | Equivalence ratio |
| FXBG | Fixed bed gasifiers |
| GHG | Greenhouse gas |
| HC | Hydrogen content |
| HY | Hydrogen yield |
| Actual | |
| LHV | Lower heating value |
| MARR | Mean absolute relative residuals |
| MS | Material science |
| MSE | Mean square error |
| Nsam | Number of data set |
| PEM | Proton exchange membrane |
| PS | Particle size |
| Prediction | |
| RSM | Response surface methodology |
| SBR | Steam-to-biomass ratio |
| SMR | Steam methane reforming |
| SOWE | Solid oxide water electrolysis |
| Temp | Temperature |
| UN | United Nations |
| WGS | Water-gas shift |
References
- Sun, Y.; Lin, Z.; Peng, S.H.; Sage, V.; Sun, Z. A Critical Perspective on CO2 Conversions into Chemicals and Fuels. J. Nanosci. Nanotechnol. 2019, 19, 3097–3109. [Google Scholar] [CrossRef]
- Schlapbach, L.; Zuttel, A. Hydrogen-storage materials for mobile applications. Nature 2001, 414, 353–358. [Google Scholar] [CrossRef]
- Sun, Y.; Zhang, J.; Yang, G.; Li, Z. Analysis of trace elements in corncob by microwave Digestion-ICP-AES. Spectrosc. Spect. Anal. 2007, 27, 1424–1427. [Google Scholar]
- Sun, Y.; He, J.; Yang, G.; Sun, G.; Sage, V. A Review of the Enhancement of Bio-Hydrogen Generation by Chemicals Addition. Catalysts 2019, 9, 353. [Google Scholar] [CrossRef] [Green Version]
- Al-Juboori, O.; Sher, F.; Khalid, U.; Niazi, M.B.K.; Chen, G.Z. Electrochemical Production of Sustainable Hydrocarbon Fuels from CO2 Co-electrolysis in Eutectic Molten Melts. ACS Sustain. Chem. Eng. 2020, 8, 12877–12890. [Google Scholar] [CrossRef]
- Al-Juboori, O.; Sher, F.; Hazafa, A.; Khan, M.K.; Chen, G.Z. The effect of variable operating parameters for hydrocarbon fuel formation from CO2 by molten salts electrolysis. J. CO2 Util. 2020, 40, 101193. [Google Scholar] [CrossRef]
- Sun, Y.; Mang, J.P.; Yang, G.; Li, Z.H. Study on the spectra of spruce lignin with chlorine dioxide oxidation. Spectrosc. Spect. Anal. 2007, 27, 1551–1554. [Google Scholar]
- Mallapaty, S. How China Could Be Carbon Neutral by Mid-Century. Nature 2020, 586, 482–483. [Google Scholar] [CrossRef] [PubMed]
- YLiu, Y.; Min, J.L.; Feng, X.Y.; He, Y.; Liu, J.Z.; Wang, Y.X.; He, J.; Do, H.N.; Sage, V.; Yang, G.; et al. A Review of Biohydrogen Productions from Lignocellulosic Precursor via Dark Fermentation: Perspective on Hydrolysate Composition and Electron-Equivalent Balance. Energies 2020, 13, 1–27. [Google Scholar]
- Sun, Y.; Wang, Y.S.; Yang, G.; Sun, Z. Optimization of biohydrogen production using acid pretreated corn stover hydrolysate followed by nickel nanoparticle addition. Int. J. Energy Res. 2020, 44, 1843–1857. [Google Scholar] [CrossRef]
- Sun, Y.; Zhang, J.; Yang, G.; Li, Z. Analysis of trace elements in corn by inductively coupled plasma-atomic emission spectrometry. Food Sci. 2007, 28, 236–237. [Google Scholar]
- Al-Shara, N.K.; Sher, F.; Yaqoob, A.; Chen, G.Z. Electrochemical investigation of novel reference electrode Ni/Ni(OH)₂ in comparison with silver and platinum inert quasi-reference electrodes for electrolysis in eutectic molten hydroxide. Int. J. Hydrogen Energy 2019, 44, 27224–27236. [Google Scholar] [CrossRef]
- Al-Shara, N.K.; Sher, F.; Iqbal, S.Z.; Sajid, Z.; Chen, G.Z. Electrochemical study of different membrane materials for the fabrication of stable, reproducible and reusable reference electrode. J. Energy Chem. 2020, 49, 33–41. [Google Scholar] [CrossRef]
- Sun, Y.; Yang, G.; Zhang, J.P.; Wen, C.; Sun, Z. Optimization and kinetic modeling of an enhanced bio-hydrogen fermentation with the addition of synergistic biochar and nickel nanoparticle. Int. J. Energy Res. 2019, 43, 983–999. [Google Scholar] [CrossRef]
- Martínez, I.; Grasa, G.; Meyer, J.; Di Felice, L.; Kazi, S.; Sanz, C.; Maury, D.; Voisin, C. Performance and operating limits of a sorbent-catalyst system for sorption-enhanced reforming (SER) in a fluidized bed reactor. Chem. Eng. Sci. 2019, 205, 94–105. [Google Scholar] [CrossRef]
- Di Giuliano, A.; Giancaterino, F.; Courson, C.; Foscolo, P.U.; Gallucci, K. Development of a Ni-CaO-mayenite combined sorbent-catalyst material for multicycle sorption enhanced steam methane reforming. Fuel 2018, 234, 687–699. [Google Scholar] [CrossRef]
- Sun, Y.; Zhang, J.P.; Yang, G.; Li, Z.H. An improved process for preparing activated carbon with large specific surface area from corncob. Chem. Biochem. Eng. Q. 2007, 21, 169–174. [Google Scholar]
- Sun, Y.; Yang, G.; Xu, M.; Xu, J.; Sun, Z. A simple coupled ANNs-RSM approach in modeling product distribution of Fischer-Tropsch synthesis using a microchannel reactor with Ru-promoted Co/Al2O 3 catalyst. Int. J. Energy Res. 2019, 44, 1046–1061. [Google Scholar] [CrossRef]
- Wang, Y.S.; Yang, G.; Sage, V.; Xu, J.; Sun, G.Z.; He, J.; Sun, Y. Optimization of dark fermentation for biohydrogen production using a hybrid artificial neural network (ANN) and response surface methodology (RSM) approach. Environ. Prog. Sustain. Energy 2020. [Google Scholar] [CrossRef]
- Sun, Y.; Yang, G.; Wen, C.; Zhang, L.; Sun, Z. Artificial neural networks with response surface methodology for optimization of selective CO2 hydrogenation using K-promoted iron catalyst in a microchannel reactor. J. CO2 Util. 2018, 24, 10–21. [Google Scholar] [CrossRef]
- Wang, M.; Tan, X.; Motuzas, J.; Li, J.; Liu, S. Hydrogen production by methane steam reforming using metallic nickel hollow fiber membranes. J. Membr. Sci. 2021, 620, 118909. [Google Scholar] [CrossRef]
- Meloni, E.; Martino, M.; Ricca, A.; Palma, V. Ultracompact methane steam reforming reactor based on microwaves susceptible structured catalysts for distributed hydrogen production. Int. J. Hydrogen Energy 2021, 46, 13729–13747. [Google Scholar] [CrossRef]
- Zhu, X.; Liu, X.; Lian, H.-Y.; Liu, J.-L.; Li, X.-S. Plasma catalytic steam methane reforming for distributed hydrogen production. Catal. Today 2019, 337, 69–75. [Google Scholar] [CrossRef]
- Wu, H.-C.; Rui, Z.; Lin, J.Y.S. Hydrogen production with carbon dioxide capture by dual-phase ceramic-carbonate membrane reactor via steam reforming of methane. J. Membr. Sci. 2020, 598, 117780. [Google Scholar] [CrossRef]
- Noh, Y.S.; Lee, K.-Y.; Moon, D.J. Hydrogen production by steam reforming of methane over nickel based structured catalysts supported on calcium aluminate modified SiC. Int. J. Hydrogen Energy 2019, 44, 21010–21019. [Google Scholar] [CrossRef]
- Xu, F.; Wang, Y.-m.; Li, F.; Nie, X.-y.; Zhu, L.-H. Hydrogen production by the steam reforming and partial oxidation of methane under the dielectric barrierdischarge. J. Fuel Chem. Technol. 2021, 49, 367–373. [Google Scholar] [CrossRef]
- Araújo, P.M.; da Costa, K.M.; Passos, F.B. Hydrogen production from methane autothermal reforming over CaTiO3, BaTiO3 and SrTiO3 supported nickel catalysts. Int. J. Hydrogen Energy 2021, 46, 24107–24116. [Google Scholar] [CrossRef]
- Lian, H.-Y.; Liu, J.-L.; Li, X.-S.; Zhu, X.; Weber, A.Z.; Zhu, A.-M. Plasma chain catalytic reforming of methanol for on-board hydrogen production. Chem. Eng. J. 2019, 369, 245–252. [Google Scholar] [CrossRef]
- Nguyen, T.; Abdin, Z.; Holm, T.; Mérida, W. Grid-connected hydrogen production via large-scale water electrolysis. Energy Convers. Manag. 2019, 200, 112108. [Google Scholar] [CrossRef]
- Zhang, C.; Greenblatt, J.B.; Wei, M.; Eichman, J.; Saxena, S.; Muratori, M.; Guerra, O.J. Flexible grid-based electrolysis hydrogen production for fuel cell vehicles reduces costs and greenhouse gas emissions. Appl. Energy 2020, 278, 115651. [Google Scholar] [CrossRef]
- Purnami, N.; Hamidi, M.N.; Sasongko, D.; Widhiyanuriyawan, I.N.G. Wardana, Strengthening external magnetic fields with activated carbon graphene for increasing hydrogen production in water electrolysis. Int. J. Hydrogen Energy 2020, 45, 19370–19380. [Google Scholar] [CrossRef]
- Avci, A.C.; Toklu, E. A new analysis of two phase flow on hydrogen production from water electrolysis. Int. J. Hydrogen Energy 2021. [Google Scholar] [CrossRef]
- Al-Shara, N.K.; Sher, F.; Iqbal, S.Z.; Curnick, O.; Chen, G.Z. Design and optimization of electrochemical cell potential for hydrogen gas production. J. Energy Chem. 2021, 52, 421–427. [Google Scholar] [CrossRef]
- Sher, F.; Al-Shara, N.K.; Iqbal, S.Z.; Jahan, Z.; Chen, G.Z. Enhancing hydrogen production from steam electrolysis in molten hydroxides via selection of non-precious metal electrodes. Int. J. Hydrogen Energy 2020, 45, 28260–28271. [Google Scholar] [CrossRef]
- Ju, H.; Giddey, S.; Badwal, S.P.S. Role of iron species as mediator in a PEM based carbon-water co-electrolysis for cost-effective hydrogen production. Int. J. Hydrogen Energy 2018, 43, 9144–9152. [Google Scholar] [CrossRef]
- Kumar, S.S.; Ramakrishna, S.U.B.; Krishna, S.V.; Srilatha, K.; Devi, B.R.; Himabindu, V. Synthesis of titanium (IV) oxide composite membrane for hydrogen production through alkaline water electrolysis. S. Afr. J. Chem. Eng. 2018, 25, 54–61. [Google Scholar]
- Wang, L.; Chen, M.; Küngas, R.; Lin, T.-E.; Diethelm, S.; Maréchal, F.; Van Herle, J. Power-to-fuels via solid-oxide electrolyzer: Operating window and techno-economics. Renew. Sustain. Energy Rev. 2019, 110, 174–187. [Google Scholar] [CrossRef]
- Faid, A.Y.; Barnett, A.O.; Seland, F.; Sunde, S. NiCu mixed metal oxide catalyst for alkaline hydrogen evolution in anion exchange membrane water electrolysis. Electrochim. Acta 2021, 371, 137837. [Google Scholar] [CrossRef]
- Bhavanari, M.; Lee, K.-R.; Tseng, C.-J.; Tang, I.H.; Chen, H.-H. CuFe electrocatalyst for hydrogen evolution reaction in alkaline electrolysis. Int. J. Hydrogen Energy 2021. [Google Scholar] [CrossRef]
- Gutiérrez-Martín, F.; Amodio, L.; Pagano, M. Hydrogen production by water electrolysis and off-grid solar PV. Int. J. Hydrogen Energy 2020. [Google Scholar] [CrossRef]
- Kakoulaki, G.; Kougias, I.; Taylor, N.; Dolci, F.; Moya, J.; Jäger-Waldau, A. Green hydrogen in Europe—A regional assessment: Substituting existing production with electrolysis powered by renewables. Energy Convers. Manag. 2020, 228, 113649. [Google Scholar] [CrossRef]
- Holm, T.; Borsboom-Hanson, T.; Herrera, O.E.; Mérida, W. Hydrogen costs from water electrolysis at high temperature and pressure. Energy Convers. Manag. 2021, 237, 114106. [Google Scholar] [CrossRef]
- Aydin, E.S.; Yucel, O.; Sadikoglu, H. Experimental study on hydrogen-rich syngas production via gasification of pine cone particles and wood pellets in a fixed bed downdraft gasifier. Int. J. Hydrogen Energy 2019, 44, 17389–17396. [Google Scholar] [CrossRef]
- Chianese, S.; Fail, S.; Binder, M.; Rauch, R.; Hofbauer, H.; Molino, A.; Blasi, A.; Musmarra, D. Experimental investigations of hydrogen production from CO catalytic conversion of tar rich syngas by biomass gasification. Catal. Today 2016, 277, 182–191. [Google Scholar] [CrossRef]
- Jahromi, R.; Rezaei, M.; Samadi, S.H.; Jahromi, H. Biomass gasification in a downdraft fixed-bed gasifier: Optimization of operating conditions. Chem. Eng. Sci. 2021, 231, 116249. [Google Scholar] [CrossRef]
- Peng, W.-X.; Ge, S.-B.; Ebadi, A.G.; Hisoriev, H.; Esfahani, M.J. Syngas production by catalytic co-gasification of coal-biomass blends in a circulating fluidized bed gasifier. J. Clean. Prod. 2017, 168, 1513–1517. [Google Scholar] [CrossRef]
- Xiao, Y.; Xu, S.; Song, Y.; Shan, Y.; Wang, C.; Wang, G. Biomass steam gasification for hydrogen-rich gas production in a decoupled dual loop gasification system. Fuel Process. Technol. 2017, 165, 54–61. [Google Scholar] [CrossRef]
- Anniwaer, A.; Chaihad, N.; Zhang, M.; Wang, C.; Yu, T.; Kasai, Y.; Abudula, A.; Guan, G. Hydrogen-rich gas production from steam co-gasification of banana peel with agricultural residues and woody biomass. Waste Manag. 2021, 125, 204–214. [Google Scholar] [CrossRef]
- Li, C.; Liu, R.; Zheng, J.; Wang, Z.; Zhang, Y. Production of hydrogen-rich syngas from absorption-enhanced steam gasification of biomass with conch shell-based absorbents. Int. J. Hydrogen Energy 2021. [Google Scholar] [CrossRef]
- Posso, F.; Siguencia, J.; Narváez, R. Residual biomass-based hydrogen production: Potential and possible uses in Ecuador. Int. J. Hydrogen Energy 2020, 45, 13717–13725. [Google Scholar] [CrossRef]
- Li, S.; Zheng, H.; Zheng, Y.; Tian, J.; Jing, T.; Chang, J.-S.; Ho, S.-H. Recent advances in hydrogen production by thermo-catalytic conversion of biomass. Int. J. Hydrogen Energy 2019, 44, 14266–14278. [Google Scholar] [CrossRef]
- Yang, S.; Chen, L.; Sun, L.; Xie, X.; Zhao, B.; Si, H.; Zhang, X.; Hua, D. Novel Ni–Al nanosheet catalyst with homogeneously embedded nickel nanoparticles for hydrogen-rich syngas production from biomass pyrolysis. Int. J. Hydrogen Energy 2021, 46, 1762–1776. [Google Scholar] [CrossRef]
- Tomasek, S.; Lónyi, F.; Valyon, J.; Hancsók, J. Fuel purpose hydrocracking of biomass based Fischer-Tropsch paraffin mixtures on bifunctional catalysts. Energy Convers. Manag. 2020, 213, 112775. [Google Scholar] [CrossRef]
- Sun, Y.; Wang, Y.X.; He, J.; Yusuf, A.; Wang, Y.X.; Yang, G.; Xiao, X. Comprehensive kinetic model for acetylene pretreated mesoporous silica supported bimetallic Co-Ni catalyst during Fischer-Tropsch synthesis. Chem. Eng. Sci. 2021. [Google Scholar] [CrossRef]
- Sun, Y.; Jia, Z.; Yang, G.; Zhang, L.; Sun, Z. Fischer-Tropsch synthesis using iron based catalyst in a microchannel reactor: Performance evaluation and kinetic modeling. Int. J. Hydrogen Energy 2017, 42, 29222–29235. [Google Scholar] [CrossRef]
- Sun, Y.; Yang, G.; Zhang, L.; Sun, Z. Fischer-Tropsch synthesis in a microchannel reactor using mesoporous silica supported bimetallic Co-Ni catalyst: Process optimization and kinetic modeling. Chem. Eng. Process. 2017, 119, 44–61. [Google Scholar] [CrossRef]
- Batista, A.P.; Gouveia, L.; Marques, P.A.S.S. Fermentative hydrogen production from microalgal biomass by a single strain of bacterium Enterobacter aerogenes—Effect of operational conditions and fermentation kinetics. Renew. Energy 2018, 119, 203–209. [Google Scholar] [CrossRef] [Green Version]
- Sugiarto, Y.; Sunyoto, N.M.S.; Zhu, M.; Jones, I.; Zhang, D. Effect of biochar in enhancing hydrogen production by mesophilic anaerobic digestion of food wastes: The role of minerals. Int. J. Hydrogen Energy 2021, 46, 3695–3703. [Google Scholar] [CrossRef]
- Khan, I. Waste to biogas through anaerobic digestion: Hydrogen production potential in the developing world—A case of Bangladesh. Int. J. Hydrogen Energy 2020, 45, 15951–15962. [Google Scholar] [CrossRef]
- Yang, C.; Wang, C.; Zhou, L.; Duan, W.; Song, Y.; Zhang, F.; Zhen, Y.; Zhang, J.; Bao, W.; Lu, Y.; et al. Refining d-band center in Ni0.85Se by Mo doping: A strategy for boosting hydrogen generation via coupling electrocatalytic oxidation 5-hydroxymethylfurfural. Chem. Eng. J. 2021, 422, 130125. [Google Scholar] [CrossRef]
- Situmorang, Y.A.; Zhao, Z.; An, P.; Yu, T.; Rizkiana, J.; Abudula, A.; Guan, G. A novel system of biomass-based hydrogen production by combining steam bio-oil reforming and chemical looping process. Appl. Energy 2020, 268, 115122. [Google Scholar] [CrossRef]
- Moneti, M.; Di Carlo, A.; Bocci, E.; Foscolo, P.U.; Villarini, M.; Carlini, M. Influence of the main gasifier parameters on a real system for hydrogen production from biomass. Int. J. Hydrogen Energy 2016, 41, 11965–11973. [Google Scholar] [CrossRef]
- Dhanavath, K.N.; Shah, K.; Islam, M.S.; Ronte, A.; Parthasarathy, R.; Bhargava, S.K.; Bankupalli, S. Experimental investigations on entrained flow gasification of Torrefied Karanja Press Seed Cake. J. Environ. Chem. Eng. 2018, 6, 1242–1249. [Google Scholar] [CrossRef]
- Schneider, J.; Grube, C.; Herrmann, A.; Rönsch, S. Atmospheric entrained-flow gasification of biomass and lignite for decentralized applications. Fuel Process. Technol. 2016, 152, 72–82. [Google Scholar] [CrossRef]
- Yao, X.; Zhao, Z.; Chen, S.; Zhou, H.; Xu, K. Migration and transformation behaviours of ash residues from a typical fixed-bed gasification station for biomass syngas production in China. Energy 2020, 201, 117646. [Google Scholar] [CrossRef]
- Marcantonio, V.; De Falco, M.; Capocelli, M.; Bocci, E.; Colantoni, A.; Villarini, M. Process analysis of hydrogen production from biomass gasification in fluidized bed reactor with different separation systems. Int. J. Hydrogen Energy 2019, 44, 10350–10360. [Google Scholar] [CrossRef]
- Chen, Y.-H.; Ngo, T.N.L.T.; Chiang, K.-Y. Enhanced hydrogen production in co-gasification of sewage sludge and industrial wastewater sludge by a pilot-scale fluidized bed gasifier. Int. J. Hydrogen Energy 2021, 46, 14083–14095. [Google Scholar] [CrossRef]
- Butera, G.; Gadsbøll, R.Ø.; Ravenni, G.; Ahrenfeldt, J.; Henriksen, U.B.; Clausen, L.R. Thermodynamic analysis of methanol synthesis combining straw gasification and electrolysis via the low temperature circulating fluid bed gasifier and a char bed gas cleaning unit. Energy 2020, 199, 117405. [Google Scholar] [CrossRef]
- Cao, Y.; Fu, L.; Mofrad, A. Combined-gasification of biomass and municipal solid waste in a fluidized bed gasifier. J. Energy Inst. 2019, 92, 1683–1688. [Google Scholar] [CrossRef]
- Nam, H.; Wang, S.; Sanjeev, K.C.; Seo, M.W.; Adhikari, S.; Shakya, R.; Lee, D.; Shanmugam, S.R. Enriched hydrogen production over air and air-steam fluidized bed gasification in a bubbling fluidized bed reactor with CaO: Effects of biomass and bed material catalyst. Energy Convers. Manag. 2020, 225, 113408. [Google Scholar] [CrossRef]
- González-Vázquez, M.P.; García, R.; Gil, M.V.; Pevida, C.; Rubiera, F. Comparison of the gasification performance of multiple biomass types in a bubbling fluidized bed. Energy Convers. Manag. 2018, 176, 309–323. [Google Scholar] [CrossRef]
- Yaghoubi, E.; Xiong, Q.; Doranehgard, M.H.; Yeganeh, M.M.; Shahriari, G.; Bidabadi, M. The effect of different operational parameters on hydrogen rich syngas production from biomass gasification in a dual fluidized bed gasifier. Chem. Eng. Processing-Process Intensif. 2018, 126, 210–221. [Google Scholar] [CrossRef]
- Jeong, Y.-S.; Choi, Y.-K.; Kang, B.-S.; Ryu, J.-H.; Kim, H.-S.; Kang, M.-S.; Ryu, L.-H.; Kim, J.-S. Lab-scale and pilot-scale two-stage gasification of biomass using active carbon for production of hydrogen-rich and low-tar producer gas. Fuel Process. Technol. 2020, 198, 106240. [Google Scholar] [CrossRef]
- Hanchate, N.; Malhotra, R.; Mathpati, C.S. Design of experiments and analysis of dual fluidized bed gasifier for syngas production: Cold flow studies. Int. J. Hydrogen Energy 2021, 46, 4776–4787. [Google Scholar] [CrossRef]
- Kulkarni, A.; Baker, R.; Abdoulmomine, N.; Adhikari, S.; Bhavnani, S. Experimental study of torrefied pine as a gasification fuel using a bubbling fluidized bed gasifier. Renew. Energy 2016, 93, 460–468. [Google Scholar] [CrossRef] [Green Version]
- Valin, S.; Bedel, L.; Guillaudeau, J.; Thiery, S.; Ravel, S. CO2 as a substitute of steam or inert transport gas in a fluidised bed for biomass gasification. Fuel 2016, 177, 288–295. [Google Scholar] [CrossRef]
- Kook, J.W.; Choi, H.M.; Kim, B.H.; Ra, H.W.; Yoon, S.J.; Mun, T.Y.; Kim, J.H.; Kim, Y.K.; Lee, J.G.; Seo, M.W. Gasification and tar removal characteristics of rice husk in a bubbling fluidized bed reactor. Fuel 2016, 181, 942–950. [Google Scholar] [CrossRef]
- Bharath, M.; Raghavan, V.; Prasad, B.V.S.S.S.; Chakravarthy, S.R. Co-gasification of Indian rice husk and Indian coal with high-ash in bubbling fluidized bed gasification reactor. Appl. Therm. Eng. 2018, 137, 608–615. [Google Scholar] [CrossRef]
- Ma, X.; Zhao, X.; Gu, J.; Shi, J. Co-gasification of coal and biomass blends using dolomite and olivine as catalysts. Renew. Energy 2019, 132, 509–514. [Google Scholar] [CrossRef]
- Mallick, D.; Mahanta, P.; Moholkar, V.S. Co–gasification of coal/biomass blends in 50 kWe circulating fluidized bed gasifier. J. Energy Inst. 2020, 93, 99–111. [Google Scholar] [CrossRef]
- Nakyai, T.; Authayanun, S.; Patcharavorachot, Y.; Arpornwichanop, A.; Assabumrungrat, S.; Saebea, D. Exergoeconomics of hydrogen production from biomass air-steam gasification with methane co-feeding. Energy Convers. Manag. 2017, 140, 228–239. [Google Scholar] [CrossRef]
- Wan, Z.; Hu, J.; Qi, X. Numerical analysis of hydrodynamics and thermochemical property of biomass gasification in a pilot-scale circulating fluidized bed. Energy 2021, 225, 120254. [Google Scholar] [CrossRef]
- Di Marcello, M.; Tsalidis, G.A.; Spinelli, G.; de Jong, W.; Kiel, J.H.A. Pilot scale steam-oxygen CFB gasification of commercial torrefied wood pellets. The effect of torrefaction on the gasification performance. Biomass Bioenergy 2017, 105, 411–420. [Google Scholar] [CrossRef]
- Cao, Y.; Bai, Y.; Du, J. Air-steam gasification of biomass based on a multi-composition multi-step kinetic model: A clean strategy for hydrogen-enriched syngas production. Sci. Total Environ. 2021, 753, 141690. [Google Scholar] [CrossRef]
- Liu, Z.-S.; Lin, C.-L.; Chang, T.-J.; Weng, W.-C. Waste-gasification efficiency of a two-stage fluidized-bed gasification system. Waste Manag. 2016, 48, 250–256. [Google Scholar] [CrossRef]
- Liu, L.; Huang, Y.; Cao, J.; Liu, C.; Dong, L.; Xu, L.; Zha, J. Experimental study of biomass gasification with oxygen-enriched air in fluidized bed gasifier. Sci. Total. Environ. 2018, 626, 423–433. [Google Scholar] [CrossRef]
- Lin, C.-L.; Wu, M.-H.; Weng, W.-C. Effect of the type of bed material in two-stage fluidized bed gasification reactors on hydrogen gas synthesis and heavy metal distribution. Int. J. Hydrogen Energy 2019, 44, 5633–5639. [Google Scholar] [CrossRef]
- Kuo, J.-H.; Lin, C.-L.; Ho, C.-Y. Effect of fluidization/gasification parameters on hydrogen generation in syngas during fluidized-bed gasification process. Int. J. Hydrogen Energy 2021. [Google Scholar] [CrossRef]
- Wang, G.; Xu, S.; Wang, C.; Zhang, J. Biomass Gasification and Hot Gas Upgrading in a Decoupled Dual-Loop Gasifier. Energy Fuels 2017, 31, 8181–8192. [Google Scholar] [CrossRef]
- Robinson, T.; Bronson, B.; Gogolek, P.; Mehrani, P. Comparison of the air-blown bubbling fluidized bed gasification of wood and wood–PET pellets. Fuel 2016, 178, 263–271. [Google Scholar] [CrossRef]
- Manatura, K.; Lu, J.-H.; Wu, K.-T.; Hsu, H.-T. Exergy analysis on torrefied rice husk pellet in fluidized bed gasification. Appl. Therm. Eng. 2017, 111, 1016–1024. [Google Scholar] [CrossRef]
- Couto, N.; Silva, V.; Cardoso, J.; Rouboa, A. 2nd law analysis of Portuguese municipal solid waste gasification using CO2/air mixtures. J. CO2 Util. 2017, 20, 347–356. [Google Scholar] [CrossRef]
- Zhang, J.; Wang, M.; Xu, S.; Feng, Y. Hydrogen and methane mixture from biomass gasification coupled with catalytic tar reforming, methanation and adsorption enhanced reforming. Fuel Process. Technol. 2019, 192, 147–153. [Google Scholar] [CrossRef]
- Hervy, M.; Remy, D.; Dufour, A.; Mauviel, G. Air-blown gasification of Solid Recovered Fuels (SRFs) in lab-scale bubbling fluidized-bed: Influence of the operating conditions and of the SRF composition. Energy Convers. Manag. 2019, 181, 584–592. [Google Scholar] [CrossRef]
- Nguyen, N.M.; Alobaid, F.; May, J.; Peters, J.; Epple, B. Experimental study on steam gasification of torrefied woodchips in a bubbling fluidized bed reactor. Energy 2020, 202, 117744. [Google Scholar] [CrossRef]
- Pio, D.T.; Tarelho, L.A.C.; Tavares, A.M.A.; Matos, M.A.A.; Silva, V. Co-gasification of refused derived fuel and biomass in a pilot-scale bubbling fluidized bed reactor. Energy Convers. Manag. 2020, 206, 112476. [Google Scholar] [CrossRef]
- Gupta, S.; Choudhary, S.; Kumar, S.; De, S. Large eddy simulation of biomass gasification in a bubbling fluidized bed based on the multiphase particle-in-cell method. Renew. Energy 2021, 163, 1455–1466. [Google Scholar] [CrossRef]
- Kartal, F.; Özveren, U. A comparative study for biomass gasification in bubbling bed gasifier using Aspen HYSYS. Bioresour. Technol. Rep. 2021, 13, 100615. [Google Scholar] [CrossRef]
- Porcu, A.; Xu, Y.; Mureddu, M.; Dessì, F.; Shahnam, M.; Rogers, W.A.; Sastri, B.S.; Pettinau, A. Experimental validation of a multiphase flow model of a lab-scale fluidized-bed gasification unit. Appl. Energy 2021, 293, 116933. [Google Scholar] [CrossRef]
- Nguyen, N.M.; Alobaid, F.; Epple, B. Chemical looping gasification of torrefied woodchips in a bubbling fluidized bed test rig using iron-based oxygen carriers. Renew. Energy 2021, 172, 34–45. [Google Scholar] [CrossRef]
- Pandey, D.S.; Kwapinska, M.; Gómez-Barea, A.; Horvat, A.; Fryda, L.E.; Rabou, L.P.L.M.; Leahy, J.J.; Kwapinski, W. Poultry Litter Gasification in a Fluidized Bed Reactor: Effects of Gasifying Agent and Limestone Addition. Energy Fuels 2016, 30, 3085–3096. [Google Scholar] [CrossRef] [Green Version]
- Agu, C.E.; Moldestad, B.M.E.; Pfeifer, C. Assessment of Combustion and Gasification Behavior in a Bubbling Fluidized Bed Reactor: A Comparison between Biomass with and without Chemical Additives. Energy Fuels 2020, 34, 9654–9663. [Google Scholar] [CrossRef]
- Kang, P.; Hu, X.E.; Lu, Y.; Wang, K.; Zhang, R.; Han, L.; Yuan, H.; Chen, H.; Luo, X.; Zhou, Y.J. Modeling and Optimization for Gas Distribution Patterns on Biomass Gasification Performance of a Bubbling Spout Fluidized Bed. Energy Fuels 2020, 34, 1750–1763. [Google Scholar] [CrossRef]
- Lardier, G.; Kaknics, J.; Dufour, A.; Michel, R.; Cluet, B.; Authier, O.; Poirier, J.; Mauviel, G. Gas and Bed Axial Composition in a Bubbling Fluidized Bed Gasifier: Results with Miscanthus and Olivine. Energy Fuels 2016, 30, 8316–8326. [Google Scholar] [CrossRef]
- Niu, M.; Huang, Y.; Jin, B.; Liang, S.; Dong, Q.; Gu, H.; Sun, R. A novel two-stage enriched air biomass gasification for producing low-tar high heating value fuel gas: Pilot verification and performance analysis. Energy 2019, 173, 511–522. [Google Scholar] [CrossRef]
- Lin, C.-L.; Chou, J.-D.; Iu, C.-H. Effects of second-stage bed materials on hydrogen production in the syngas of a two-stage gasification process. Renew. Energy 2020, 154, 903–912. [Google Scholar] [CrossRef]
- Zhu, H.L.; Zhang, Y.S.; Materazzi, M.; Aranda, G.; Brett, D.J.L.; Shearing, P.R.; Manos, G. Co-gasification of beech-wood and polyethylene in a fluidized-bed reactor. Fuel Process. Technol. 2019, 190, 29–37. [Google Scholar] [CrossRef]
- Valdés, C.F.; Chejne, F.; Marrugo, G.; Macias, R.J.; Gómez, C.A.; Montoya, J.I.; Londoño, C.A.; De la Cruz, J.; Arenas, E. Co-gasification of sub-bituminous coal with palm kernel shell in fluidized bed coupled to a ceramic industry process. Appl. Therm. Eng. 2016, 107, 1201–1209. [Google Scholar] [CrossRef]
- Couto, N.; Monteiro, E.; Silva, V.; Rouboa, A. Hydrogen-rich gas from gasification of Portuguese municipal solid wastes. Int. J. Hydrogen Energy 2016, 41, 10619–10630. [Google Scholar] [CrossRef]
- Kaushal, P.; Tyagi, R. Advanced simulation of biomass gasification in a fluidized bed reactor using ASPEN PLUS. Renew. Energy 2017, 101, 629–636. [Google Scholar] [CrossRef]
- Prestipino, M.; Chiodo, V.; Maisano, S.; Zafarana, G.; Urbani, F.; Galvagno, A. Hydrogen rich syngas production by air-steam gasification of citrus peel residues from citrus juice manufacturing: Experimental and simulation activities. Int. J. Hydrogen Energy 2017, 42, 26816–26827. [Google Scholar] [CrossRef]
- Peng, W.X.; Wang, L.S.; Mirzaee, M.; Ahmadi, H.; Esfahani, M.J.; Fremaux, S. Hydrogen and syngas production by catalytic biomass gasification. Energy Convers. Manag. 2017, 135, 270–273. [Google Scholar] [CrossRef]
- Liu, C.; Huang, Y.; Niu, M.; Pei, H.; Liu, L.; Wang, Y.; Dong, L.; Xu, L. Influences of equivalence ratio, oxygen concentration and fluidization velocity on the characteristics of oxygen-enriched gasification products from biomass in a pilot-scale fluidized bed. Int. J. Hydrogen Energy 2018, 43, 14214–14225. [Google Scholar] [CrossRef]
- Savuto, E.; Di Carlo, A.; Steele, A.; Heidenreich, S.; Gallucci, K.; Rapagnà, S. Syngas conditioning by ceramic filter candles filled with catalyst pellets and placed inside the freeboard of a fluidized bed steam gasifier. Fuel Process. Technol. 2019, 191, 44–53. [Google Scholar] [CrossRef]
- Jin, K.; Ji, D.; Xie, Q.; Nie, Y.; Yu, F.; Ji, J. Hydrogen production from steam gasification of tableted biomass in molten eutectic carbonates. Int. J. Hydrogen Energy 2019, 44, 22919–22925. [Google Scholar] [CrossRef]
- Ismail, T.M.; Ramos, A.; Monteiro, E.; El-Salam, M.A.; Rouboa, A. Parametric studies in the gasification agent and fluidization velocity during oxygen-enriched gasification of biomass in a pilot-scale fluidized bed: Experimental and numerical assessment. Renew. Energy 2020, 147, 2429–2439. [Google Scholar] [CrossRef]
- Mallick, D.; Mahanta, P.; Moholkar, V.S. Co-gasification of biomass blends: Performance evaluation in circulating fluidized bed gasifier. Energy 2020, 192, 116682. [Google Scholar] [CrossRef]
- Inayat, A.; Khan, Z.; Aslam, M.; Shahbaz, M.; Ahmad, M.M.; Mutalib, M.I.A.; Yusup, S. Integrated adsorption steam gasification for enhanced hydrogen production from palm waste at bench scale plant. Int. J. Hydrogen Energy 2020. [Google Scholar] [CrossRef]
- Kibret, H.A.; Kuo, Y.-L.; Ke, T.-Y.; Tseng, Y.-H. Gasification of spent coffee grounds in a semi-fluidized bed reactor using steam and CO2 gasification medium. J. Taiwan Inst. Chem. Eng. 2021, 119, 115–127. [Google Scholar] [CrossRef]
- Shahbaz, M.; Yusup, S.; Inayat, A.; Patrick, D.O.; Ammar, M.; Pratama, A. Cleaner Production of Hydrogen and Syngas from Catalytic Steam Palm Kernel Shell Gasification Using CaO Sorbent and Coal Bottom Ash as a Catalyst. Energy Fuels 2017, 31, 13824–13833. [Google Scholar] [CrossRef]
- Tian, Y.; Zhou, X.; Lin, S.; Ji, X.; Bai, J.; Xu, M. Syngas production from air-steam gasification of biomass with natural catalysts. Sci. Total Environ. 2018, 645, 518–523. [Google Scholar] [CrossRef] [PubMed]
- Kumar, A.; Guangul, F.M.; Inayat, M.; Sulaiman, S. Effect of fuel particle size and blending ratio on syngas production and performance of co-gasification. J. Mech. Eng. Sci. 2016, 10, 2188. [Google Scholar]
- Madadian, E.; Orsat, V.; Lefsrud, M. Comparative Study of Temperature Impact on Air Gasification of Various Types of Biomass in a Research-Scale Down-draft Reactor. Energy Fuels 2017, 31, 4045–4053. [Google Scholar] [CrossRef]
- Abdoulmoumine, N.; Kulkarni, A.; Adhikari, S. Effects of temperature and equivalence ratio on mass balance and energy analysis in loblolly pine oxygen gasification. Energy Sci. Eng. 2016, 4, 256–268. [Google Scholar] [CrossRef] [Green Version]


| Production Technology | Feedstock | Processes Involved | Overall Reactions | Efficiency | Advantages | Limitations | References |
|---|---|---|---|---|---|---|---|
| Steam Methane Reforming | Methane and steam |
| CH4 + 2H2O ↔ CO2 + 4H2 | 70–85% |
|
| [21,22,23,24,25] |
| Electrolysis | Water and electricity |
| 2H2O → 2H2 + O2; 2H2O → 4H+ + O2 + 4e−; 2H+ + 2e− → H2 * | 50–70% |
|
| [29,30,31,32,35] |
| Biomass gasification | Biomass |
| Biomass + Air/oxygen/steam → H2 + CO + CO2 + (N2) + CH4 + Tar + Char + Hydrocarbons | 35–55% |
|
| [43,44,45,46,47] |
| Gasifier Types | Design Configurations | Descriptions | T (°C) | P (bar) | Advantages | Limitations | References |
|---|---|---|---|---|---|---|---|
| Entrained flow | Upflow system |
| 1000–1400 | 25–30 |
|
| [63,64] |
| Downflow system |
| 1200–2000 | 20–70 | ||||
| Fixed bed | Updraft |
| 300–1000 | Atmospheric pressure |
|
| [45,65] |
| Downdraft |
| 300–1000 | Atmospheric pressure |
|
| [43,45] | |
| Fluidized bed | Bubbling |
| 700–1000 | 1–35 |
|
| [75,76,77,78,79] |
| Circulating |
| 700–1000 | 1–20 |
|
| [46,80,81,82,83] | |
| Dual |
| 700–1000 | 1–35 |
|
| [84,85,86,87,88,89] |
| Bed Type | Feedstock | Feedstock Particle Size (µm) | Carbon Content (wt.%) | LHV (MJ/Nm3) | T/°C | Process Time/min | ER | SBR | Yield (Nm3/kg) | Yield H2 Content/vol% | (CCE) % | Reference |
|---|---|---|---|---|---|---|---|---|---|---|---|---|
| Bubbling | Torrefied and raw pine | 468 | 13.80 | - | 800 | 45 | 0.28 | - | 80.56 | 15.13 | - | [75] |
| Wood sawdust | 1500 | - | - | 850 | 300 | - | - | 1.15 | 42.00 | 85.00 | [76] | |
| Rice husk | 7500 | 11.69 | 3.84 | 600 | - | 0.20 | - | 0.50 | 2.70 | 95.00 | [77] | |
| Wood-PET pellets | 6000 | 12.16 | 19.19 | 800 | 90 | 0.28 | - | - | 8.10 | 98.60 | [90] | |
| Rice husk | - | 36.00 | 9.30 | 800 | 60 | 0.30 | - | - | 12.50 | - | [91] | |
| MSW | - | 8.46 | 14.40 | 900 | - | 0.25 | 1.00 | - | - | - | [92] | |
| Cocoa shells | 461 | 21.70 | - | 900 | 60 | 0.23 | 1.20 | 1.49 | 49.10 | 50.00 | [71] | |
| Rice husk and coal | 1575 | 22.37 | - | 850 | 210 | 0.26 | 1.21 | - | 8.64 | 89.00 | [78] | |
| Pine sawdust | - | 12.60 | - | 600 | 120 | - | 0.20 | 1.03 | 38.60 | 71.20 | [93] | |
| - | - | - | 14.30 | 800 | 42 | 0.30 | - | - | 4.00 | 76.00 | [94] | |
| Pine sawdust and brown coal | 4000 | 13.20 | - | 900 | - | 0.20 | 0.50 | - | 50.60 | 84.20 | [79] | |
| Torrefied woodchips | 240 | 22.82 | 19.26 | 850 | 30 | 0.22 | 1.20 | 1.12 | 28.66 | 89.20 | [95] | |
| Carbonaceous feedstock | 15,000 | 11.50 | 20.53 | 785 | 30 | 0.21 | - | 2.10 | 7.10 | 84.10 | [96] | |
| Rice husk | - | 14.99 | - | 850 | - | 0.30 | 0.80 | - | 11.00 | 76.00 | [97] | |
| Cypress wood chips | - | 20.64 | 15.80 | 700 | - | 0.30 | 1.20 | - | 0.59 | - | [98] | |
| Torrefied woodchips | - | 20.18 | 3.00 | 800 | 30 | 0.24 | - | 1.77 | 14.31 | 78.00 | [99] | |
| Poultry litter | 525 | 22.82 | 19.26 | 850 | 90 | - | 1.40 | 1.41 | 43.00 | 87.52 | [100] | |
| - | 310 | 8.81 | 5.36 | 700 | 30 | 0.30 | 0.24 | 1.36 | 17.58 | 88.00 | [101] | |
| Spruce slice | 615 | - | 20.05 | 809 | 60 | 0.20 | - | - | 9.69 | 50.00 | [102] | |
| Miscanthus | 300 | 14.99 | 4.25 | 850 | - | 0.35 | 0.50 | - | 12.30 | - | [103] | |
| Torrefied and raw pine | 630 | - | 5.55 | 915 | 60 | 0.32 | - | - | 10.80 | 91.00 | [104] | |
| Circulating | Torrefied wood residues and mixed wood | 5000 | 24.65 | 11.70 | 850 | 180 | 0.22 | 1.26 | 1.60 | 53.00 | 82.40 | [83] |
| Wood residue and Tabas coal | 175 | 18.20 | - | 850 | 55 | 0.40 | - | - | 52.70 | - | [46] | |
| Methane and biomass | - | - | - | 1000 | - | 0.21 | 1.00 | - | 28.00 | - | [81] | |
| Sub-bituminous coal and sawdust | 3675 | 35.93 | 22.39 | 800 | - | 0.29 | - | 2.11 | 12.63 | 84.00 | [80] | |
| - | 1890 | - | 3.96 | 800 | - | 0.41 | 0.60 | - | 4.00 | - | [82] | |
| Dual | PP plastic pellets, wood chips and plant capsules | 660 | 8.01 | 26.00 | 900 | 10.67 | 0.30 | - | 2.53 | 29.70 | 82.00 | [85] |
| Rice straw | 1250 | 18.74 | - | 800 | 120 | 0.24 | - | 1.20 | 5.38 | 84.77 | [86] | |
| PE plastic bags, sawdust and PP plastic particles | 780 | 5.00 | - | 900 | - | 0.30 | 0.50 | - | 53.10 | - | [87] | |
| PE plastic bags, sawdust and PP plastic particles | 780 | 5.00 | - | 700 | 35 | 0.30 | 0.60 | - | 39.38 | - | [88] | |
| Volatile, fixed carbon and ash | - | 17.16 | 9.90 | 800 | - | 0.19 | 1.56 | 1.72 | 32.34 | 91.50 | [84] | |
| Pine sawdust | 200 | 12.73 | 11.40 | 850 | 120 | - | 0.30 | 10.51 | 47.30 | 64.00 | [89] | |
| Biomass briquette | - | 18.71 | 11.00 | 670 | 300 | 0.19 | - | 1.20 | 24.00 | 98.82 | [105] | |
| PE plastic bags, wood chips and PP particles | 660 | - | - | 900 | 35 | 0.30 | 0.60 | - | 50.96 | 92.59 | [106] |
| Catalyst | Feedstock | Feedstock Particle Size (µm) | Carbon Content (wt.%) | LHV (MJ/Nm3) | T/°C | Process Time/min | ER | SBR | Yield (Nm3/kg) | Yield H2 Content/vol% | CCE % | References |
|---|---|---|---|---|---|---|---|---|---|---|---|---|
| ZSM-5 zeolite | Beech-wood and poly | - | - | - | 854 | 90 | 0.30 | 0.63 | - | - | 98.20 | [107] |
| - | Palm kernel shell and sub-bituminous coal | 160 | 40.00 | 21.13 | 800 | 1440 | 0.60 | 0.20 | - | 12.00 | 82.80 | [108] |
| NiO/modified dolomite | Coffee husk | - | - | - | 900 | - | 0.15 | 1.50 | 1.75 | 27.00 | - | [109] |
| - | Carbonaceous feedstock | 275 | 0.80 | - | 820 | - | 0.19 | 1.00 | 2.00 | 40.00 | - | [110] |
| - | Citrus peel | 500 | 40.31 | 4.65 | 750 | 20 | 0.30 | 1.25 | 0.69 | 26.00 | 87.00 | [111] |
| Ni/CeO2/Al2CO3 | Wood residue | - | 49.18 | - | 823 | 44 | 0.17 | 0.71 | 1.66 | 42.52 | 93.56 | [112] |
| - | Straw | 7500 | 17.15 | 14.96 | 850 | 60 | 0.16 | - | 0.90 | 17.00 | 75.00 | [113] |
| Commercial Ni-catalyst *1 | Almond shells | - | 11.00 | - | 815 | 60 | - | 0.49 | 1.70 | 55.30 | - | [114] |
| Ternary molten carbonates | Forestry biomass waste | - | 3.89 | - | 750 | 60 | - | 1.00 | - | 55.00 | - | [115] |
| - | Pine sawdust and MSW | 2000 | 18.82 | - | 850 | - | 0.21 | - | 13.40 | 9.80 | - | [69] |
| High-alumina bauxite | Straw | 7500 | 17.50 | 9.35 | 726 | 60 | 0.16 | - | - | 14.90 | 70.99 | [116] |
| Calcium (Ca) | Rice husk and bamboo dust | 670 | - | 5.05 | 800 | 30 | 0.35 | 0.41 | 1.72 | - | 98.00 | [117] |
| Commercial Zeolite *2 | Empty fruit bunch | 3000 | 8.60 | - | 973 | 30 | - | 2.00 | - | 75.00 | - | [118] |
| Industrial sludge derived catalysts | - | 320 | 10.35 | 4.84 | 800 | 50 | 0.30 | 1.00 | - | 12.46 | 100.00 | [67] |
| SCG ash | - | 1400 | 20.00 | 12.20 | 900 | 30 | - | 0.53 | - | 6.00 | - | [119] |
| Coal bottom ash | Palm kernel shell | 750 | 14.25 | 12.50 | 692 | 60 | - | 1.50 | - | 79.77 | 59.90 | [120] |
| Calcined dolomite | - | 5000 | 35.20 | - | 1000 | 50 | 0.14 | 1.00 | - | 49.10 | 60.80 | [121] |
Publisher’s Note: MDPI stays neutral with regard to jurisdictional claims in published maps and institutional affiliations. |
© 2021 by the authors. Licensee MDPI, Basel, Switzerland. This article is an open access article distributed under the terms and conditions of the Creative Commons Attribution (CC BY) license (https://creativecommons.org/licenses/by/4.0/).
Share and Cite
Lian, Z.; Wang, Y.; Zhang, X.; Yusuf, A.; Famiyeh, L.; Murindababisha, D.; Jin, H.; Liu, Y.; He, J.; Wang, Y.; et al. Hydrogen Production by Fluidized Bed Reactors: A Quantitative Perspective Using the Supervised Machine Learning Approach. J 2021, 4, 266-287. https://0-doi-org.brum.beds.ac.uk/10.3390/j4030022
Lian Z, Wang Y, Zhang X, Yusuf A, Famiyeh L, Murindababisha D, Jin H, Liu Y, He J, Wang Y, et al. Hydrogen Production by Fluidized Bed Reactors: A Quantitative Perspective Using the Supervised Machine Learning Approach. J. 2021; 4(3):266-287. https://0-doi-org.brum.beds.ac.uk/10.3390/j4030022
Chicago/Turabian StyleLian, Zheng, Yixiao Wang, Xiyue Zhang, Abubakar Yusuf, Lord Famiyeh, David Murindababisha, Huan Jin, Yiyang Liu, Jun He, Yunshan Wang, and et al. 2021. "Hydrogen Production by Fluidized Bed Reactors: A Quantitative Perspective Using the Supervised Machine Learning Approach" J 4, no. 3: 266-287. https://0-doi-org.brum.beds.ac.uk/10.3390/j4030022