1. Introduction
The conservation of a painting requires the knowledge of the materials (pigments and binders) and techniques used by artists. The characterization of binding media and pigments in ancient, as well as in modern art, is important for designing safe conservation treatments and choosing the adapted environmental conditions for display, transport and storage of an artwork [
1,
2]. Moreover, the procedures of dating, restoration and origin discovering base on the information obtained by characterizing the constituent elements of the artwork [
3]. Discriminating a pigment from another one or recognizing a specific organic/inorganic binder in a multi-component system, as represented by the artwork itself, is the initial and fundament step in order to obtain a complete and fully reliable analysis of the artistic material, which remains a challenge.
Among the different non-invasive techniques, reflectance spectroscopy has been demonstrated to be a powerful tool in archaeometric studies to identify and characterize modern pigments, with a specific interest for the UV-Vis and infrared (IR) ranges [
4,
5,
6,
7,
8]. Analog investigations can be performed in the NIR range, where, however, relating the reflectance spectrum of a multi-component artwork to each one of its elements (i.e., support, specific pigment and binder) is not straightforward. Indeed, most of the functional groups with typical vibrational transitions in the NIR range, like -OH and -CH, are common in many pigments, in components of the binder matrix, and in the thin film of atmospheric water covering any material. For this reason, it is necessary to start from investigating a “model” multi-component sample reproducing the artwork, in which it is possible to separate each component from the other and analyze the related optical response. This strategy could help to go back from the complex overall optical spectrum to the single elements constituting the artwork.
The methodological and experimental approach we propose is part of the work carried out within a multidisciplinary project (MOBARTECH: a mobile, interactive and participatory platform for the study, conservation and promotion of Cultural Heritage) financially supported by Regione Lombardia (Italy). One of the project goals is the comparison between our data and those acquired with an innovative in-situ portable spectrometer, purposely designed to perform fast and non-invasive combined elemental and molecular maps of artworks by using the complementary EDXRF and UV-Vis-NIR reflectance.
To this aim we investigate the UV-Vis-NIR diffuse reflectance spectra of modern model samples, represented by ligneous supports painted with different commercial acrylic colors, and we compare them with the spectra obtained from the bare support, from the pure bulk color, and from the pure bulk binder. In this way, it is possible to highlight the specific UV-Vis-NIR response of each component in the spectrum, isolating the fingerprints of pigments and dyes from the ones of binder and support. In particular, we focus our attention on blue colors (ultramarine, phtalocyanine and cobalt), because they show a peculiar, particularly meaningful NIR response.
2. Materials and Methods
Model multi-component samples, simulating artworks, were prepared in laboratory by applying commercially available cobalt blue (CB), phtalocyanine blue (PhB), and ultramarine blue (UB) acrylic colors in tubes (MAIMERI, 375, 378 and 390 respectively) on (3 × 3) cm
2 ligneous supports (
Figure 1a).
As the website of producer Maimeri (
www.maimeri.it) reports, the CB is a mixture of a polysulfide of sodium alumino silicate (PB29), titanium dioxide white (PW6) and phthalocyanine (PB 15:3 β form); the PhB is a mixture of titanium dioxide white (PW6) and phthalocyanine PB 15:1 (α form) and UB is specified as a polysulfide of sodium alumino silicate (PB29).
Bulk samples were realized by making dry the pure binder, the tube color (PhB), or ad hoc prepared pigment-binder mixtures (CB and UB) in a cylinder stencil (6 cm in diameter, 5 mm in thickness) and then removing it. In
Figure 1b the reference samples, i.e., a ligneous support (A) and the bulk binder sample (B), are shown, together with the set of bulk color samples (CB, PhB, UB).
Diffuse reflectance spectra were collected in the UV-Vis-NIR range (300–2500 nm) with 1 nm step by using a Lambda 900 (Perkin-Elmer) spectrophotometer, equipped with a 15-cm integrating sphere.
3. Results
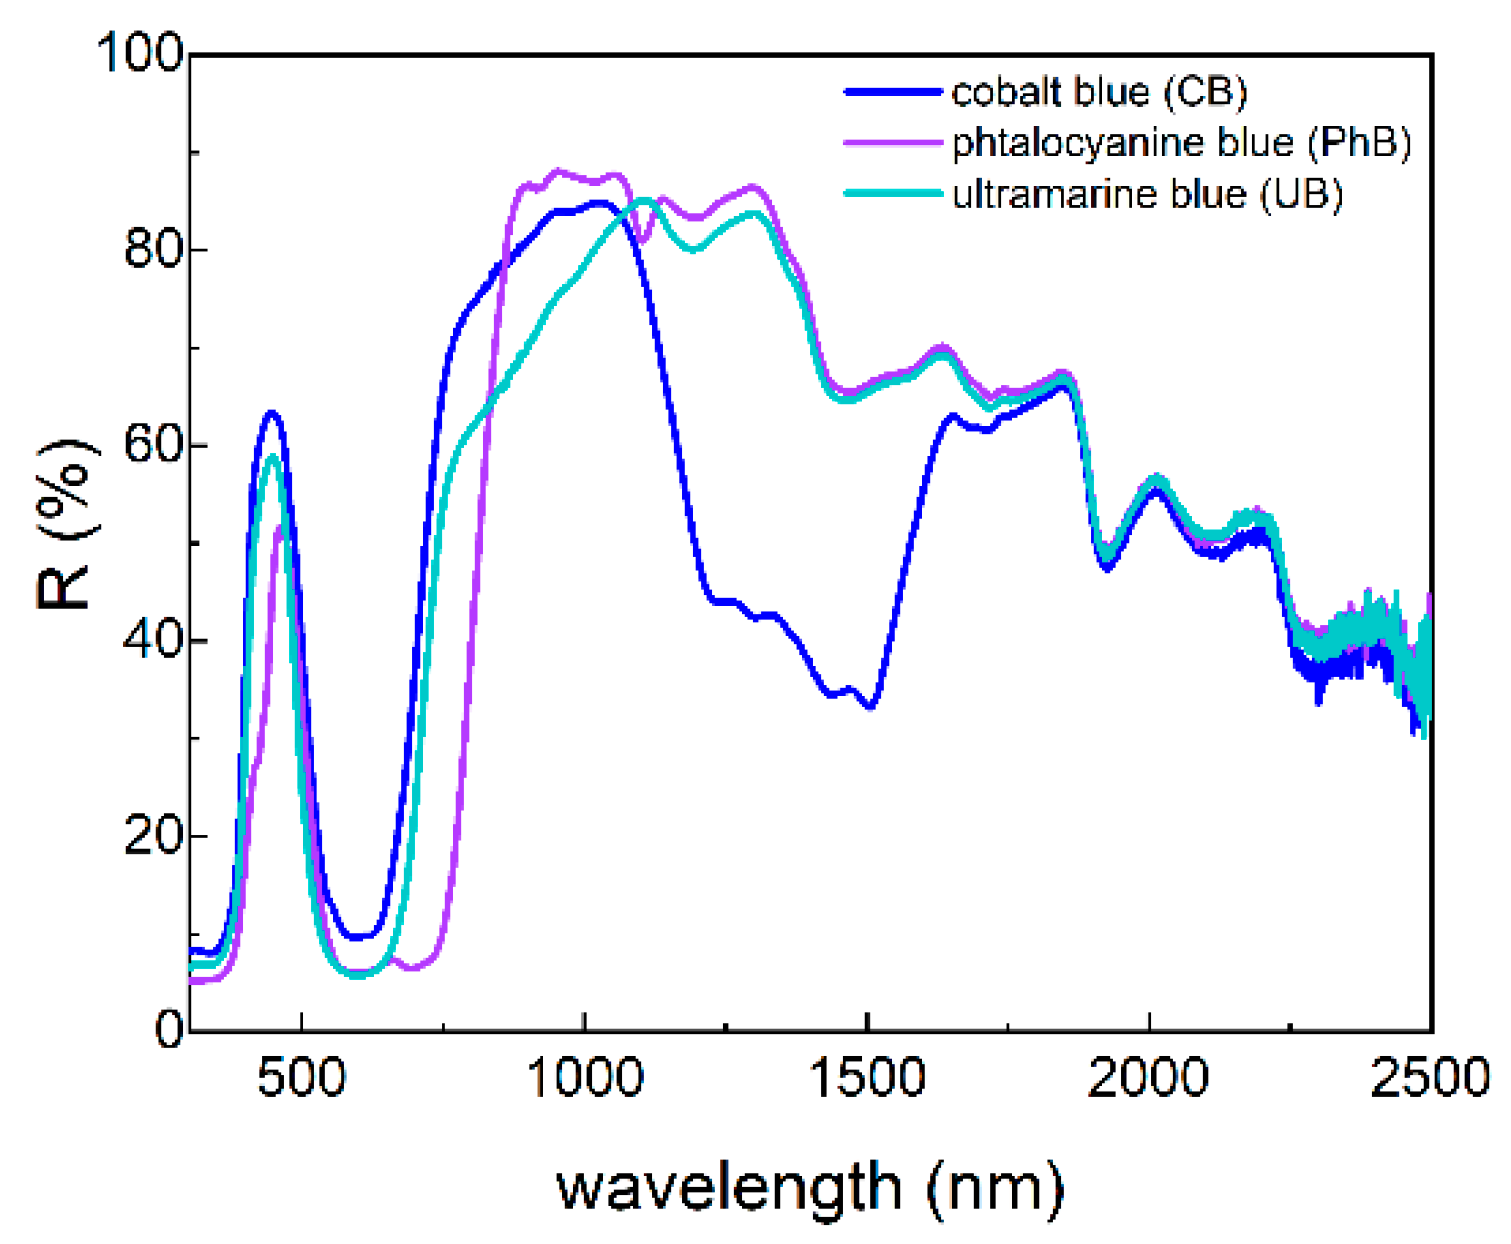
In
Figure 2 the diffuse reflectance spectra acquired on the three blue model samples of
Figure 1a are shown. The spectra are rather complex, with clear similarities in the whole spectral range considered. In the UV-Vis range, the typical response of blue colors are observed, with deep and wide minima from about 500 nm up to about 700 ÷ 800 nm; PhB is slightly different, showing a double minimum. Between 800 nm and 1100 nm CB and UB spectra show a monotonic rise, while the PhB spectrum displays a higher almost flat reflectance. A composite minimum characterizes the CB response from about 1050 nm to 1650 nm. Finally, from 1650 nm to 2500 nm, the long wavelength limit of the range explored, all the spectra are superimposed, suggesting a possible common origin of the response to be investigated.
In view of extracting the blue color response, we try to separate the different contributions. Since acrylic colors in tubes contain both the pigment or dye and the acrylic binder, we analyze the spectrum of the commercial acrylic binder; as a further reference, we also measured the bare ligneous support. In
Figure 3 the UV-Vis-NIR spectra of the pure binder bulk sample (full line), of the binder applied on the ligneous support (dash-dotted line), and of a bare ligneous support (dotted line) are reported. Their close similarity is impressive and suggests the need for a more detailed analysis; in addition,
Figure 3 makes it evident how the binder and support are strongly affecting the spectra in
Figure 2, in particular, in the NIR range above about 1200 nm. The overall reduced intensity of the bulk spectrum is a consequence of the semi-transparency of the sample. Indeed, when using an integrating sphere, the part of the light beam eventually passing through the sample is trapped and does not contribute to the signal collected by the detector.
In
Figure 4 we report the diffuse reflectance spectra of the pure color bulk samples, realized with the acrylic blue colors; for each one, the spectrum of the same color on support is also reported for direct comparison (same spectra as in
Figure 2). For all samples, these are the most relevant results, because the support contribution is absent. The UV-Vis response is more clearly detected, while the binder response is observed to completely dominate the NIR range. For PhB and UB this occurs above 1200 nm, for CB it happens above 1650 nm. In any case, only the very first NIR region can be considered meaningful in view of identifying some intrinsic response of the different colors. Finally, for UB and CB the semi-transparency of the samples reduces the intensity of the spectra, as observed above for the bulk binder spectrum.
4. Discussion
To be able to interpret optical spectra, a model of the light-sample interaction occurring during the measurements should in principle be drawn. When diffuse reflectance is concerned, in particular with complex samples such as ours, the light beam impinging on the sample may interact in different ways with the sample surface, so that interpreting the physical origin of the response is not always easy. With the aim of distinguishing the different sample components and extracting some information on the specific blue color response, we analyze here the most relevant spectral features, proposing their possible use.
The spectra of all colors applied on the ligneous support shown in
Figure 2 present a very close resemblance, especially in the NIR range from 1650 nm up to 2500 nm, where they are superimposed. UB and CB samples are also comparable in the Vis range, due to the similar composition (as declared on the tubes); however, here PhB shows a wider minimum reaching about 800 nm, where a sharp rise is observed. A marked difference in the NIR from about 1050 nm to 1650 nm appears, where the CB spectrum shows a composite wide minimum, while the spectra of the other two samples are very close to each other. Further differences cannot be observed in detail because the spectra are very similar. They are possibly affected by the common response of the binder and ligneous support.
The spectrum of the bare ligneous support in
Figure 3 stands out from the others in the Vis range (as predictable), but above 1100 nm it is very similar to those of the blue samples in
Figure 2. All the observed bands can be attributed to vibrational transitions (i.e., overtones) of -OH and -CH functional groups present in molecules like water, lignin, cellulose, and in most acrylic binders [
4,
9,
10,
11,
12,
13]. Finding such bands in the spectra of all the model samples in
Figure 2 is therefore not surprising and supports the need for a deeper analysis of the different contributions. Most of these NIR bands are detectable in the pure binder bulk sample in
Figure 3, as well. Since, in this case, lignin and cellulose can be excluded, the bands are likely related to the mentioned groups in the polymers composing the binder and to the unavoidable presence of water. This latter could justify also the slight differences in shape and relative intensity of the NIR bands, with respect to the ones detected in the spectrum of the binder applied on ligneous support [
10]. In the Vis range, the spectrum of the pure binder shows the expected behavior of a white material [
4], with no relevant features possibly affecting the spectra of color bulk samples.
In
Figure 4 the bulk color spectra are reported, so that the spectral features can be considered as fingerprints of the commercial colors. In
Figure 4a, the PhB spectrum shows a reflectance maximum in the UV-vis range at 460 nm, verifiable in reflectance spectra of different classes of phtalocyanine blue [
8], and a weak peak at 660 nm [
8]. The weak shoulder centered at about 420 nm can be identified in the reflectance spectrum of the titanium dioxide white [
4], indeed present in the composition of the commercial PhB color.
The small bands composing the wide minimum in the UV-Vis range are in correspondence of the B and Q absorbance bands of the copper phtalocyanine molecule (Cu-Pc), in solution and in vacuum-deposited films, used as dye [
14,
15,
16,
17]. The spectrum of PhB differs in shape from the other ones between 730 and 1100 nm, where it is almost flat and shows a higher reflectance. This spectral range is not commonly reported in the literature; however, it is possible to find a correspondence to a weak shoulder at about 1100 nm in the absorption spectra of Cu-Pc thin films [
17]. The characteristic sharp minimum at 1100 nm, present but much less intense in the spectrum of PhB applied on the support, is completely absent in the spectra of the other two blue samples, even if the presence of Cu-phthalocyanine molecules is expected also in the CB composition. This peak can be considered, therefore, a signature of PhB.
For UB and CB, the spectra of bulk colors in
Figure 4b,c permit reading with greater details the maxima of reflectance, typical of the blue response, at 440 nm [
8]; between 520 and 680 nm the wide minima, very similar, can be related to the characteristic response of aluminum silicate and cobalt aluminate elements [
18] present in the composition of these two commercial blue colors; in addition, both the spectra show a shoulder centered at 770 nm.
In the NIR range, the CB sample shows a fundamental difference with respect to the others (PhB and UB), whose spectra are almost superimposed (at least from 1130 to 2500 nm). Indeed, the CB spectrum presents the characteristic wide and complex band from about 1050 to 1650 nm, with four sub-bands typical of cobalt-based pigments, attributed to a spin-split of the d-d electronic transitions in Co(II) ions [
19]; such a composite band can therefore be considered the signature of CB. It is interesting to note that the color producer does not specify the presence of cobalt in the pigment composition [
20].
The remaining NIR bands detected above 1100 nm in all the spectra of bulk colors are related to the -OH and -CH overtones coming from the polymers composing the binder used as a matrix for the dye (even if, for UB and CB the pigments and the binder used for sample preparation may be different from those in the commercial color tubes, unknown) and from a surface layer of atmospheric water on the sample.
5. Conclusions
Diffuse reflectance spectroscopy is applied here to study model samples simulating artworks, i.e., acrylic colors hand applied on ligneous supports, and a method is pointed out for distinguishing the different contributions coming from the components, i.e., the support, the acrylic binder, and the pure color. The comparison between the spectra of the composite samples and those of the bare support, bulk binder samples, and bulk color samples is demonstrated to permit the successful identification of the specific spectral features of ultramarine, phtalocyanine, and cobalt commercial blue pigments and their main differences. Focusing on the NIR range, the reflectance spectra of cobalt blue show a characteristic complex band from about 1050 nm to 1650 nm and those of phtalocyanine blue a sharp peak at 1100 nm, both features making the two colors easily identified and therefore suitable for artwork analysis.
The experimentally obtained data will be used as a reference for the calibration of the new spectrometer purposely designed and developed within Mobartech project to perform maps by EDXRF and UV-Vis-NIR reflectance spectroscopies. In perspective, based on the discussion in this work, and thanks to the possibility of using a portable instrument working in the same UV-Vis-NIR spectral range, the next step is the comparison with the in-situ analysis of the same colors present in real paintings.


