Fast and In-Situ Identification of Archaeometallurgical Collections in the Museum of Malaga Using Laser-Induced Breakdown Spectroscopy and a New Mathematical Algorithm


Abstract
:
1. Introduction
2. Materials and Methods
2.1. Experimental Set-Up
2.2. Samples
2.3. Method
3. Results and Discussion
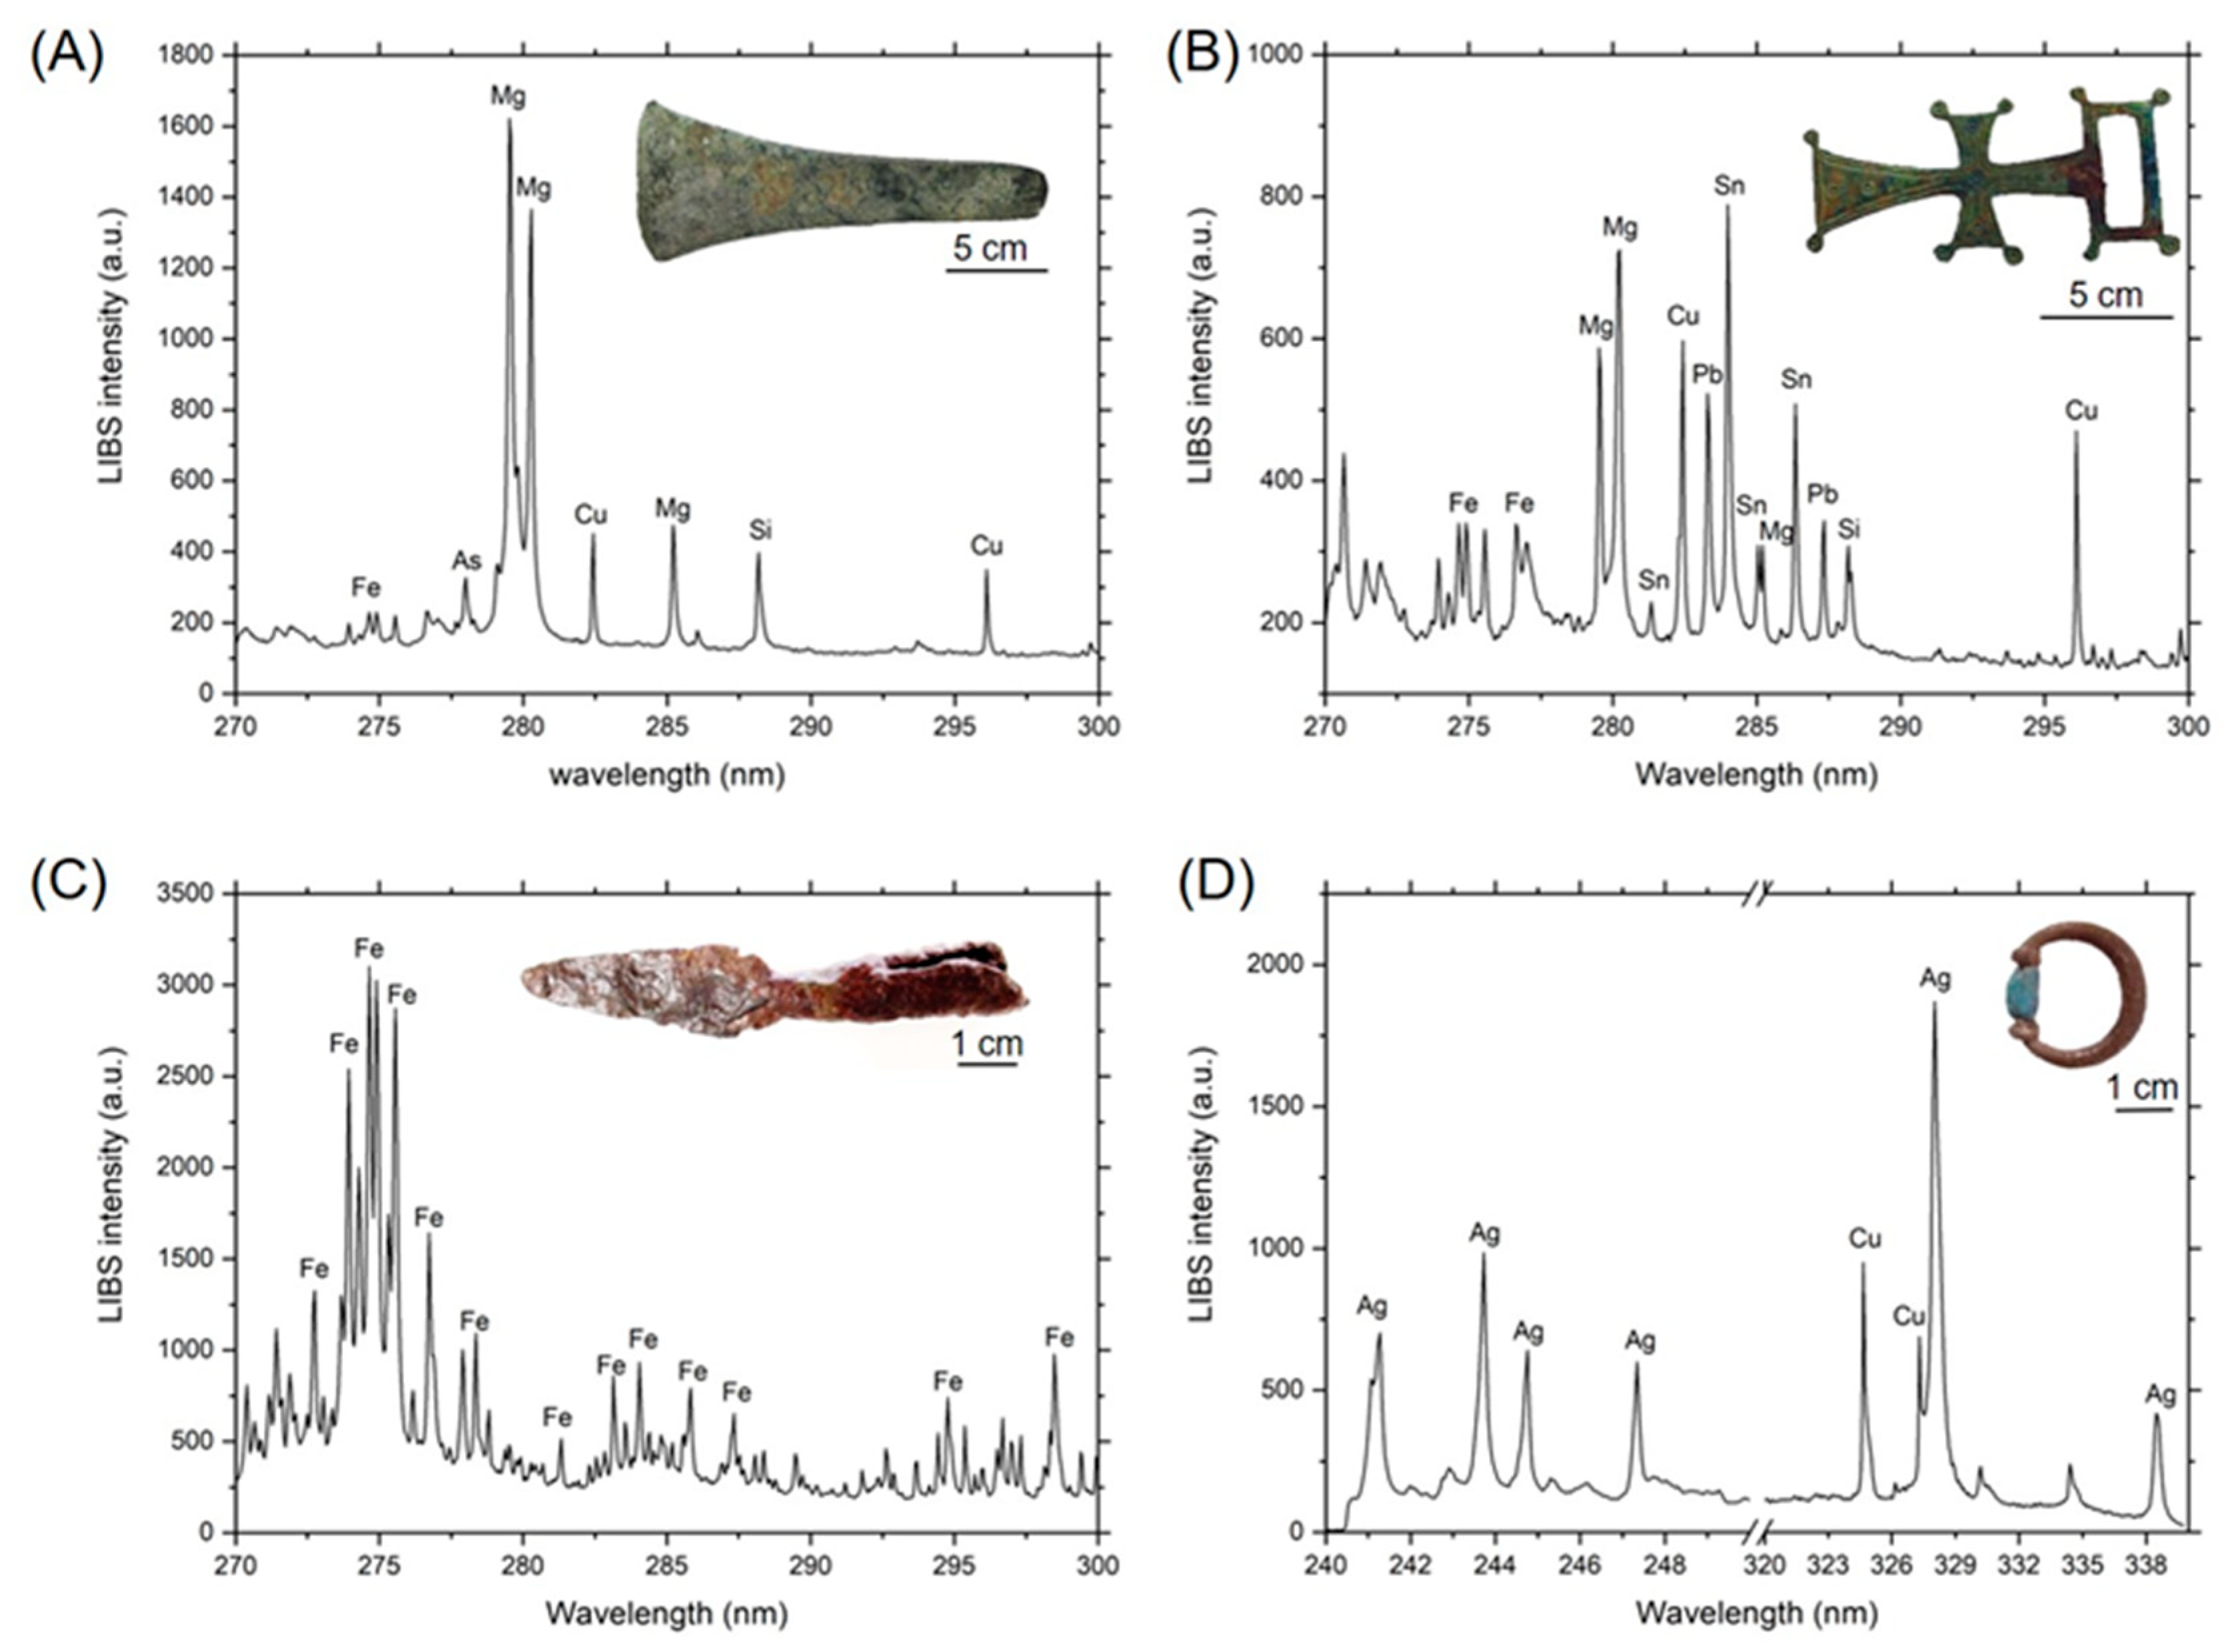
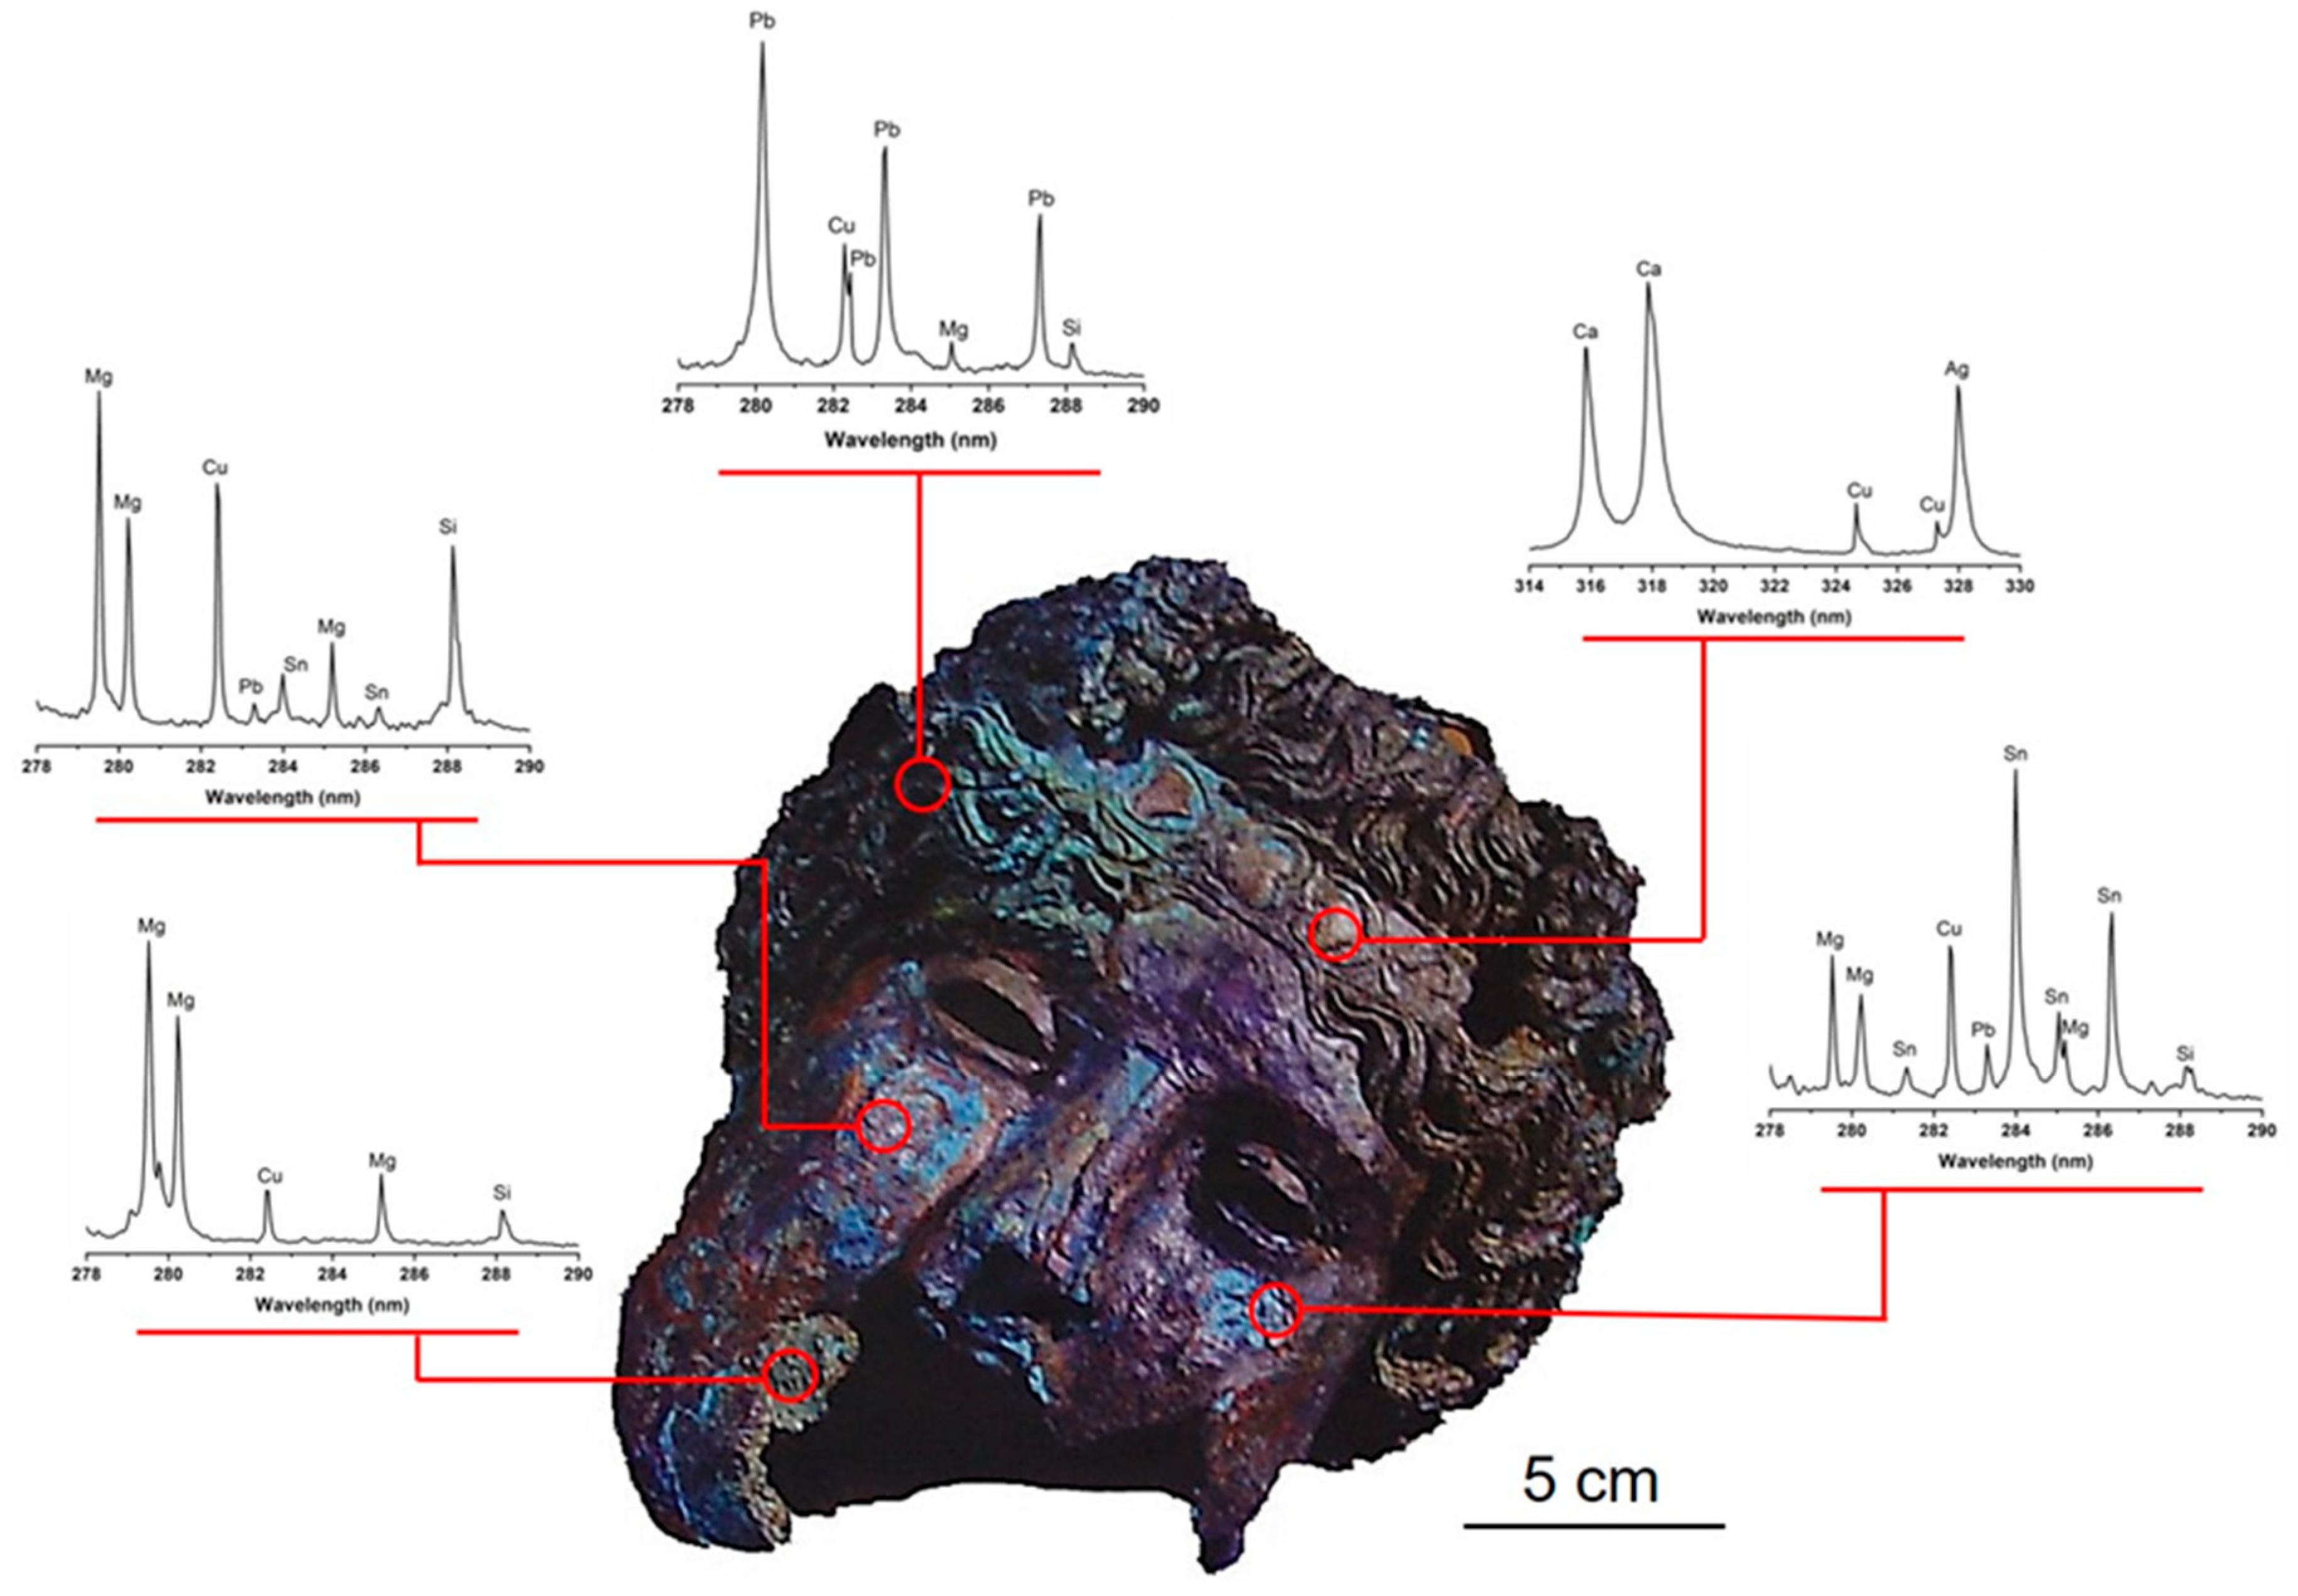
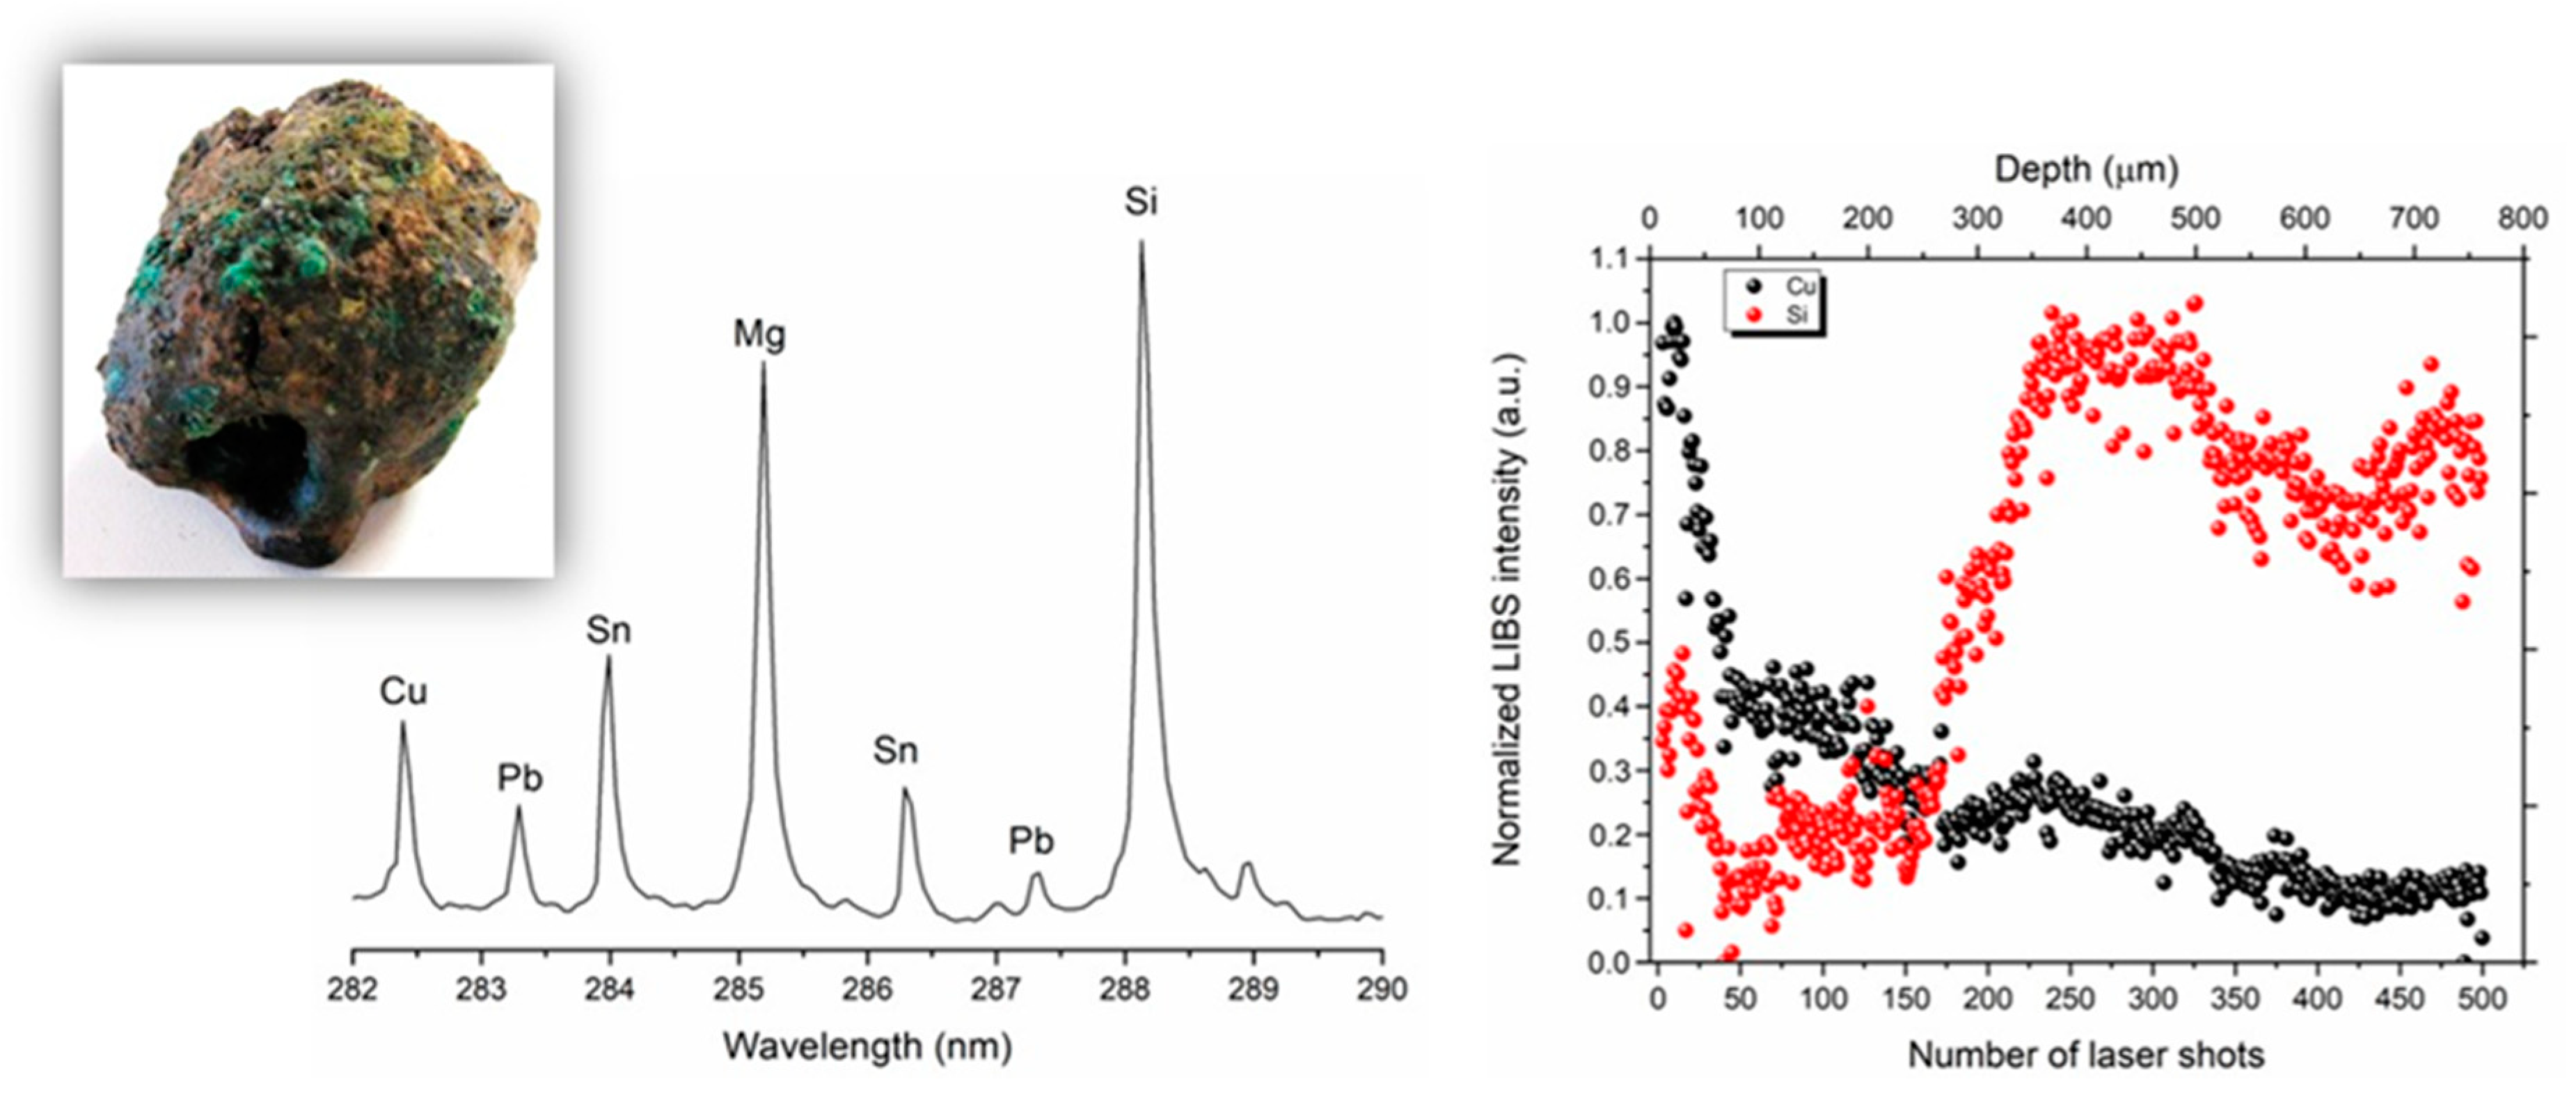
3.1. In-Situ Chemical Characterization in the Museum of Malaga
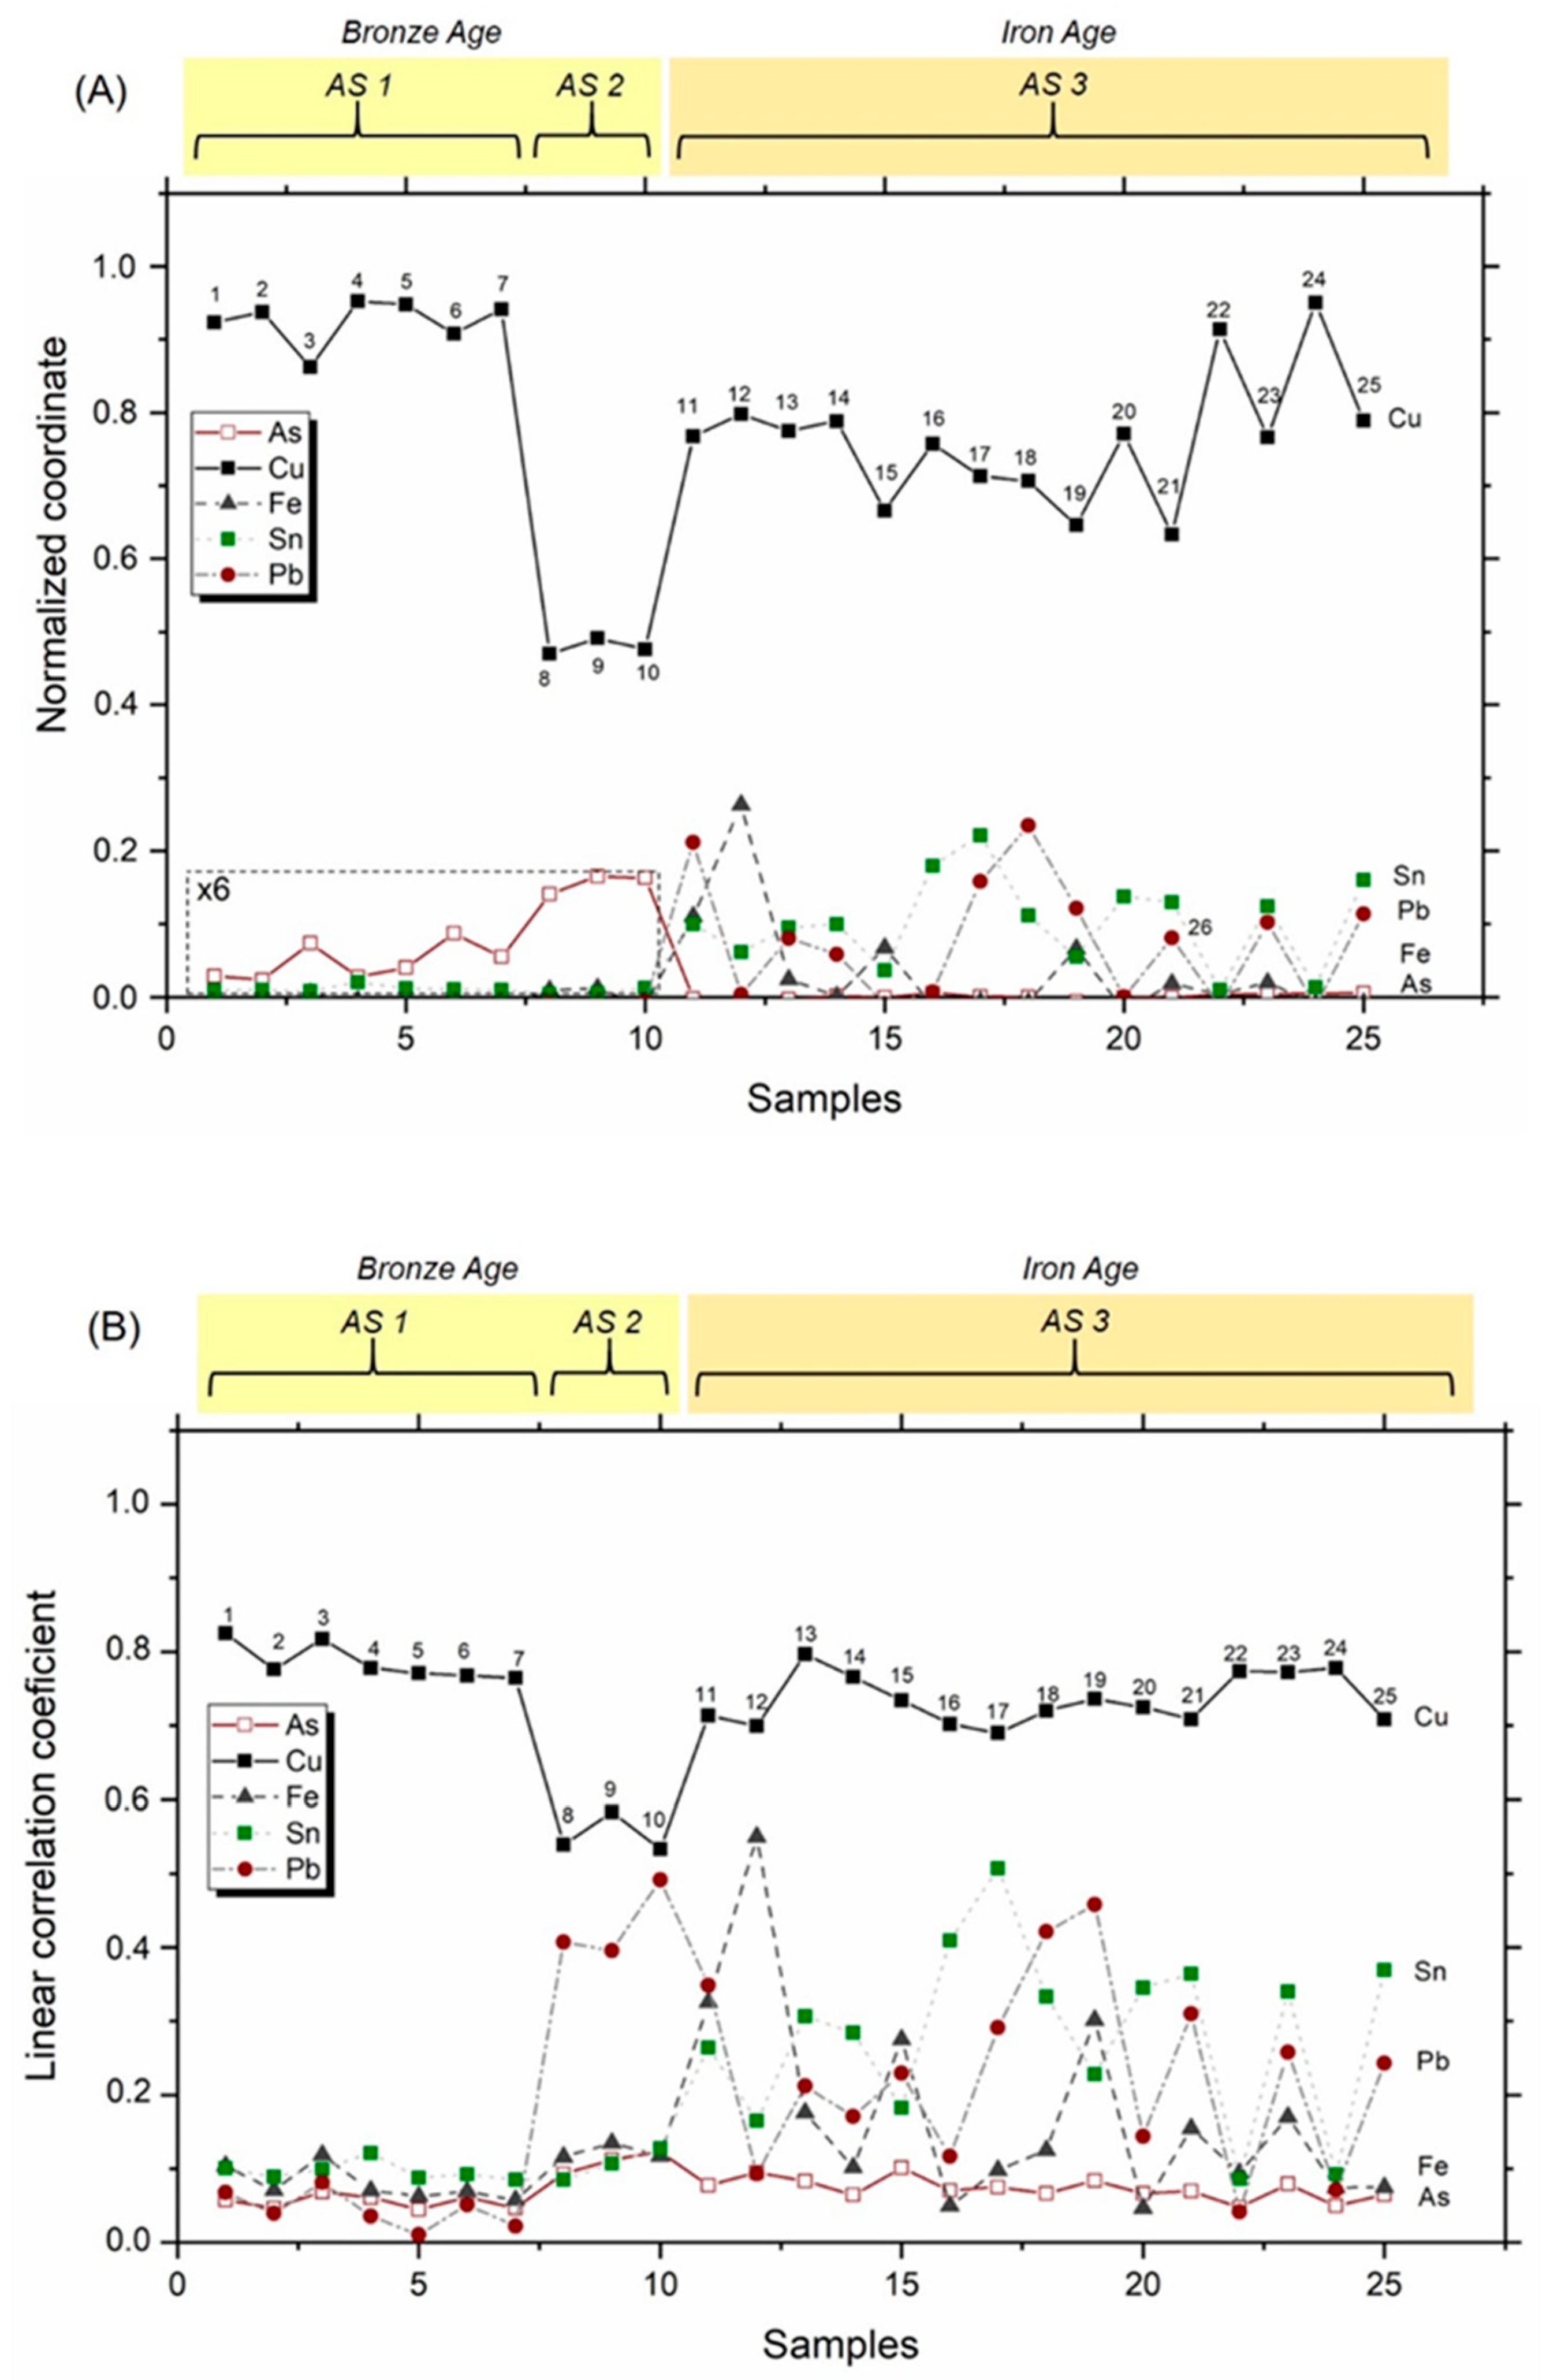
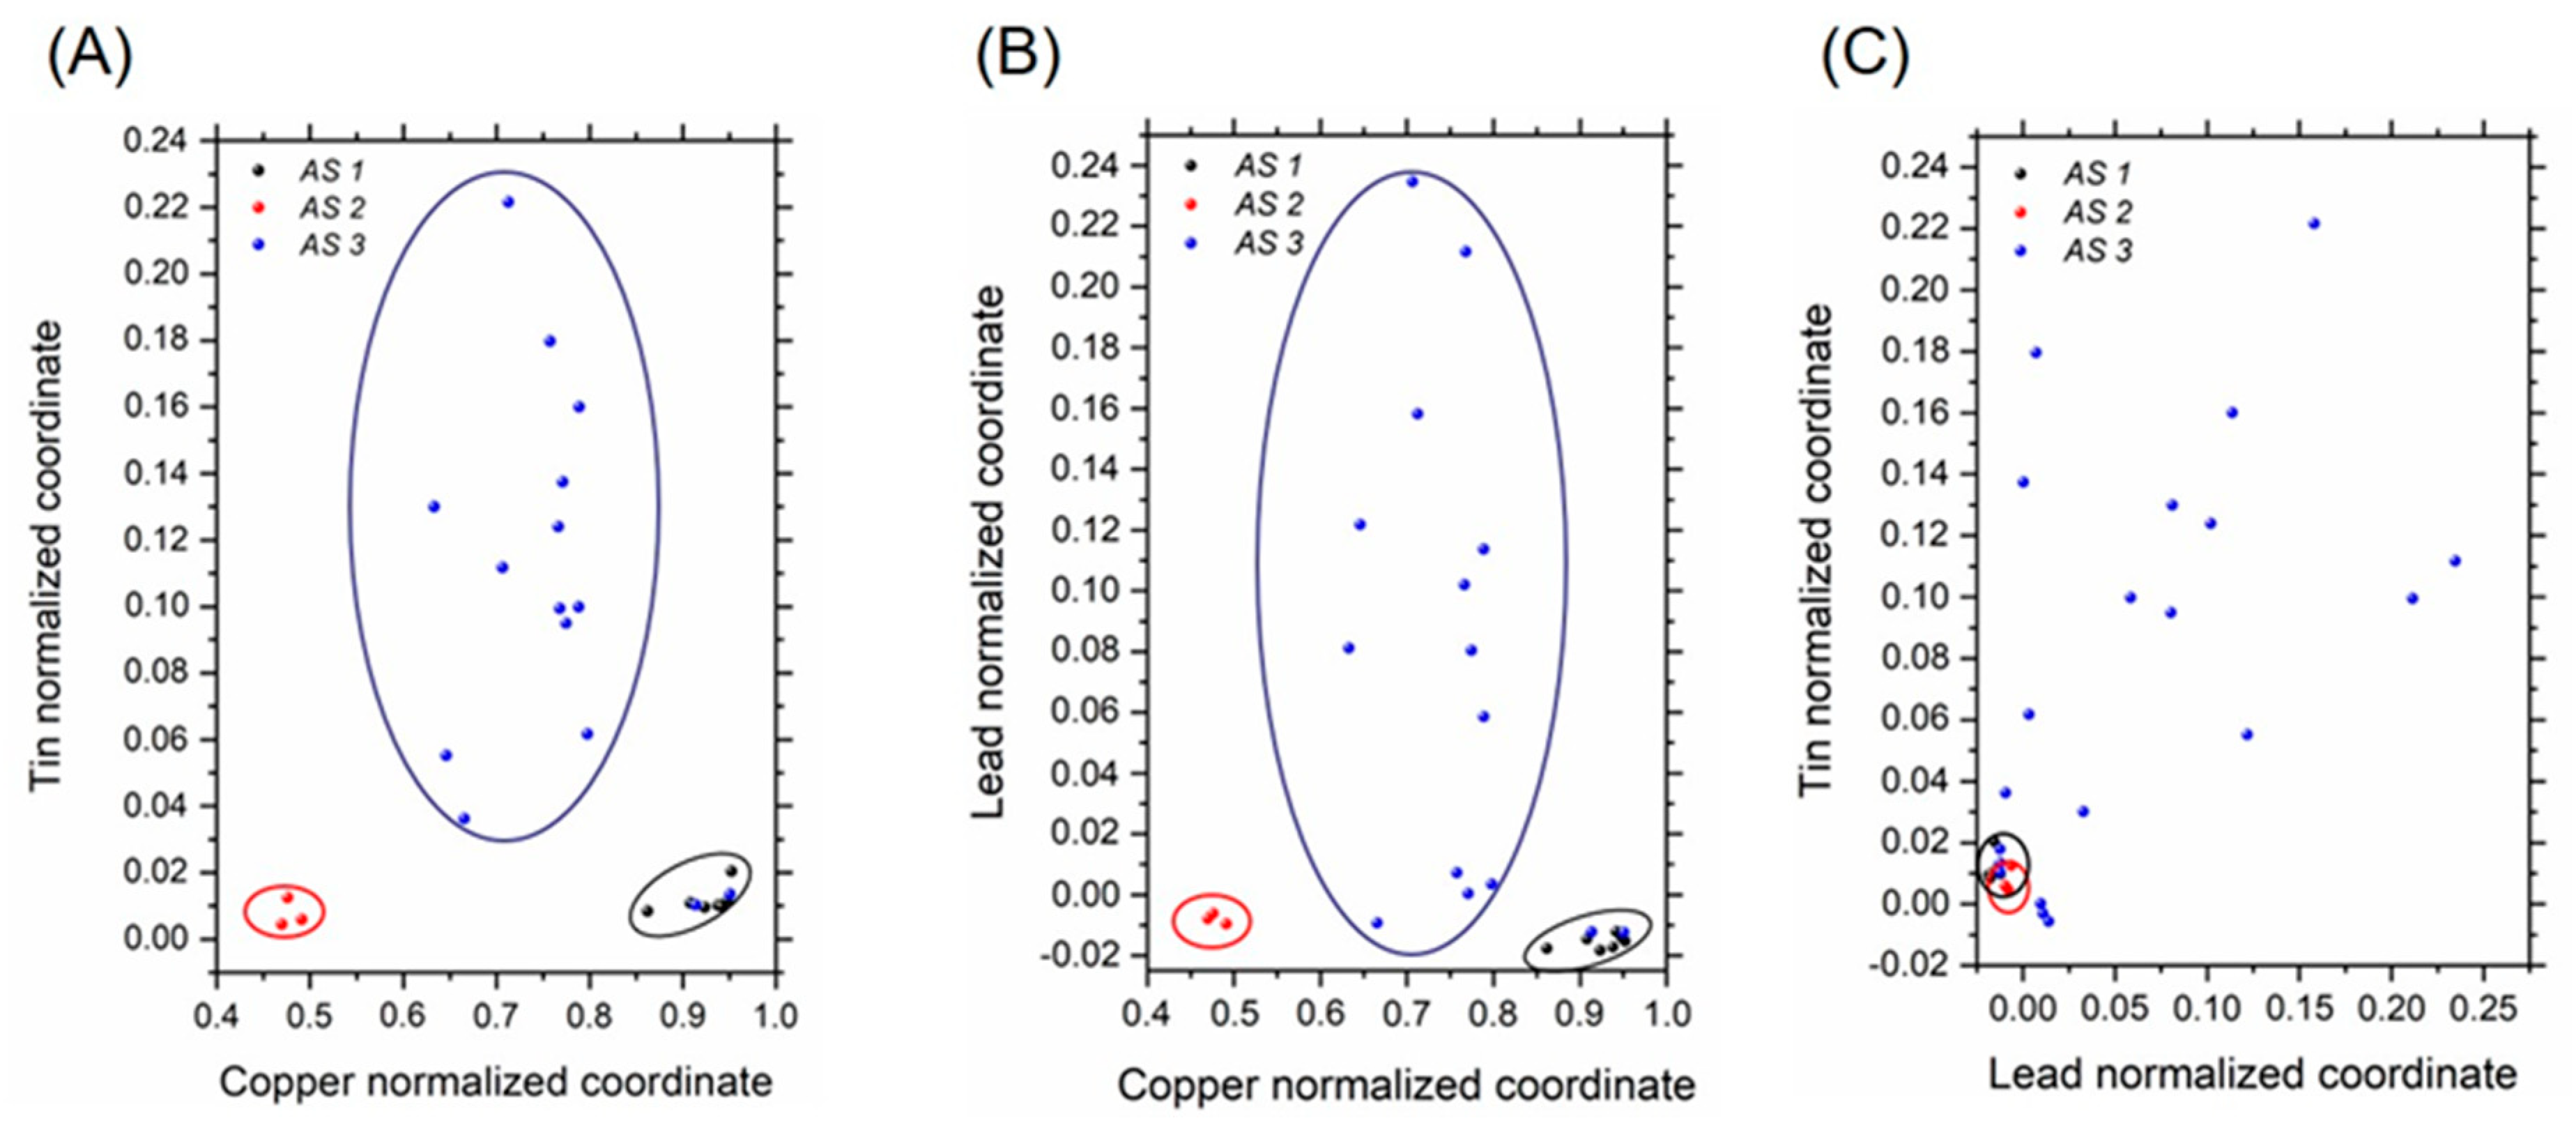
3.2. Libraries for Spectrum Identification: Method of Normalized Coordinates
4. Conclusions
Author Contributions
Funding
Acknowledgments
Conflicts of Interest
References
- Adriaens, A. Non-destructive analysis and testing of museum objects: An overview of 5 years of research. Spectrochim. Acta Part B 2005, 60, 1503–1516. [Google Scholar] [CrossRef] [Green Version]
- Ciliberto, E.; Spoto, G. (Eds.) Modern Analytical Methods in Art and Archaeology; Wiley Interscience: New York, NY, USA, 2000. [Google Scholar]
- Adams, A.; Adriaens, A.; Aerts, A.; De Raedt, I.; Janssens, K.; Schalm, O. Micro and surface analysis in art and archaeology. J. Anal. At. Spectrom. 1997, 12, 257–265. [Google Scholar] [CrossRef]
- De Benedetto, G.E.; Laviano, R.; Sabbatini, L.; Zambonin, P. Infrared spectroscopy in the mineralogical characterization of ancient pottery. J. Cult. Herit. 2002, 3, 177–186. [Google Scholar] [CrossRef]
- Caneve, L.; Guarneri, M.; Lai, A.; Spizzichino, V.; Ceccarelli, S.; Mazzei, B. Nondestructive laser based techniques for biodegradation analysis in cultural heritage. Ndt E Int. 2019, 108–113. [Google Scholar] [CrossRef]
- Paparazzo, E. Scanning auger microscopy studies of an ancient bronze. J. Vac. Sci. Technol. 2001, 19, 1126. [Google Scholar] [CrossRef]
- Mantler, M.; Schreiner, M. X-ray fluorescence spectrometry in art and archaeology. X-ray Spectrom. 2000, 29, 3–17. [Google Scholar] [CrossRef]
- Medina-Alcaide, M.A.; Cabalin, L.M.; Laserna, J.J.; Sanchidrián, J.L.; Torres, A.J.; Intxaurbe, I.; Cosano, S.; Romero, A. Multianalytical and multiproxy approach to the characterization of a Paleolithic lamp. An example from Nerja cave (Malaga, Spain). J. Archaeol. Sci. Rep. 2019, 28, 102021. [Google Scholar] [CrossRef]
- Bourgarit, D.; Mille, B. The elemental analysis of ancient copper-based artifacts by inductively-coupled-plasma atomic-emission spectrometry: An optimized methodology reveals some secrets of the Vix crater. Meas. Sci. Technol. 2003, 14, 1538. [Google Scholar] [CrossRef]
- Ghisalberti, E.L.; Godfrey, I.M. Application of nuclear magnetic resonance spectroscopy to the analysis of organic archaeological materials. Stud. Conserv. 1998, 43, 215–230. [Google Scholar]
- Stamatakis, G.; Knuutinen, U.; Laitinen, K.; Spyros, A. Analysis and aging of unsaturated polyester resins in contemporary art installations by NMR spectroscopy. Anal. Bioanal. Chem. 2010, 398, 3203–3214. [Google Scholar] [CrossRef]
- Bernardini, F.; Leghissa, E.; Prokop, D.; Velušček, A.; De Min, A.; Dreossi, D.; Donato, S.; Tuniz, C.; Princivalle, F.; Montagnari Kokelj, M. X-ray computed microtomography of Late Copper Age decorated bowls with cross-shaped foots from central Slovenia and the Trieste Karst (North-Eastern Italy): Technology and paste characterization. Archaeol. Anthropol. Sci. 2019, 11, 4711–4728. [Google Scholar] [CrossRef]
- Bernardini, F.; Vinci, G.; Prokop, D.; Barro Savonuzzi, L.; De Min, A.; Lenaz, D.; Pincivalle, F.; Cocca, E.; Kasztovszky, Z.; Harsányi, I.; et al. A multi-analytical study of Bronze Age pottery from the UNESCO site of Al-Khutm (Bat, Oman). Archaeol. Anthropol. Sci. 2020, 12, 163. [Google Scholar] [CrossRef]
- Prochazka, D.; Zikmund, T.; Pořízka, P.; Břínek, A.; Klus, J.; Šalplachta, J.; Kynický, J.; Novotný, J.; Kaiser, J. Joint utilization of double-pulse laser-induced breakdown spectroscopy and X-ray computed tomography for volumetric information of geological samples. J. Anal. At. Spectrom. 2018, 33, 1993–1999. [Google Scholar] [CrossRef]
- Botto, A.; Campanella, B.; Legnaioli, S.; Lezzerini, M.; Lorenzetti, G.; Pagnotta, S.; Poggialini, F.; Palleschi, V. Applications of laser-induced breakdown spectroscopy in cultural heritage and archaeology: A critical review. J. Anal. At. Spectrom. 2019, 34, 81–103. [Google Scholar] [CrossRef]
- Anglos, D.; Detalle, V. Laser-Induced Breakdown Spectroscopy. In Cultural Heritage Applications of LIBS; Springer: Berlin/Heidelberg, Germany, 2014; pp. 531–554. [Google Scholar]
- Fortes, F.J.; Moros, J.; Lucena, P.; Cabalín, L.M.; Laserna, J.J. Laser-induced breakdown spectroscopy. Anal. Chem. Rev. 2013, 85, 640–669. [Google Scholar] [CrossRef]
- Melessanaki, K.; Mateo, M.P.; Ferrence, S.C.; Betancourt, P.P.; Anglos, D. The application of LIBS for the analysis of archaeological ceramic and metal artifacts. Appl. Surf. Sci. 2002, 197–198, 156–163. [Google Scholar] [CrossRef]
- Anglos, D. Laser-induced breakdown spectroscopy in heritage science. Phys. Sci. Rev. 2019, 4. [Google Scholar] [CrossRef]
- Giakoumaki, A.; Melessanaki, K.; Anglos, D. Laser-induced breakdown spectroscopy (LIBS) in archaeological science-application and prospects. Anal. Bioanal. Chem. 2006, 387, 749. [Google Scholar] [CrossRef]
- Fortes, F.J.; Laserna, J.J. The development of fieldable laser-induced breakdown spectrometer: No limits on the horizon. Spectrochim. Acta Part B 2010, 65, 975–990. [Google Scholar] [CrossRef]
- Fortes, F.J.; Cuñat, J.; Cabalín, L.M.; Laserna, J.J. In-situ analytical assessment of historical buildings using a man portable laser system. Appl. Spectrosc. 2007, 61, 558–564. [Google Scholar] [CrossRef]
- Cuñat, J.; Palanco, S.; Carrasco, F.; Simón, M.D.; Laserna, J.J. Portable instrument and analytical method using laser-induced breakdown spectrometry for in situ characterization of speleothems in karstic caves. J. Anal. At. Spectrom. 2005, 20, 295–300. [Google Scholar] [CrossRef]
- López-Claros, M.; Fortes, F.J.; Laserna, J.J. Subsea spectral identification of shipwreck objects using laser-induced breakdown spectroscopy and linear discriminant analysis. J. Cult. Herit. 2018, 29, 75–81. [Google Scholar] [CrossRef]
- Guirado, S.; Fortes, F.J.; Laserna, J.J. Multi-pulse excitation for underwater analysis of copper-based alloys using a novel remote laser-induced breakdown spectroscopy system. Appl. Spectrosc. 2016, 70, 618–626. [Google Scholar] [CrossRef] [PubMed]
- Fortes, F.J.; Guirado, S.; Metzinger, A.; Laserna, J.J. A study of underwater stand-off laser-induced breakdown spectroscopy for chemical analysis of objects in the deep ocean. J. Anal. At. Spectrom. 2015, 30, 1050–1056. [Google Scholar] [CrossRef]
- Guirado, S.; Fortes, F.J.; Laserna, J.J. Elemental analysis of materials in an underwater archaeological shipwreck using a novel remote laser-induced breakdown spectroscopy system. Talanta 2015, 137, 182–188. [Google Scholar] [CrossRef] [PubMed]
- Lazic, V.; Colao, F.; Fantoni, R.; Spizzicchino, V. Recognition of archeological materials underwater by laser induced breakdown spectroscopy. Spectrochim. Acta Part B 2005, 60, 1014–1024. [Google Scholar] [CrossRef]
- Corsi, M.; Cristoforetti, G.; Giuffrida, M.; Hidalgo, M.; Legnaioli, S.; Masotti, L.; Palleschi, V.; Salvetti, A.; Tognoni, E.; Vallebona, C.; et al. Archaeometric analysis of ancient copper artefacts by laser-induced breakdown spectroscopy technique. Microchim. Acta 2005, 152, 105. [Google Scholar] [CrossRef]
- Colao, F.; Fantoni, R.; Lazic, V.; Spizzichino, V. Laser-induced breakdown spectroscopy for semi-quantitative and quantitative analysis of artworks-application on multi-layered ceramics and copper based alloys. Spectrochim. Acta Part B 2002, 57, 1219. [Google Scholar] [CrossRef]
- Fortes, F.J.; Cortes, M.; Simon, M.D.; Cabalin, L.M.; Laserna, J.J. Chronocultural sorting of archaeological bronze objects using Laser-Induced Breakdown Spectrometry. Anal. Chim. Acta 2006, 554, 136–143. [Google Scholar] [CrossRef]
- Duchêne, S.; Detalle, V.; Bruder, R.; Sirven, J. Chemometrics and Laser induced breakdown spectroscopy (LIBS) analyses for identication of wall paintings pigments. Curr. Anal. Chem. 2010, 6, 60–65. [Google Scholar] [CrossRef] [Green Version]
- Oztoprak, B.G.; Sinmaz, M.A.; Tülek, F. Composition analysis of medieval ceramics by laser-induced breakdown spectroscopy (LIBS). Appl. Phys. A Mater. Sci. Process 2016, 122, 5–10. [Google Scholar] [CrossRef]
- López, A.J.; Nicolás, G.; Mateo, M.P.; Ramil, A.; Piñón, V.; Yáñez, A. LIPS and linear correlation analysis applied to the classification of Roman pottery Terra Sigilata. Appl. Phys. A 2006, 83, 695. [Google Scholar] [CrossRef]
- Anzano, J.M.; Villoria, M.A.; Gornushkin, I.; Smith, B.; Winefordner, J.D. Laser-induced plasma spectroscopy for characterization of archaeological material. Can. J. Anal. Sci. Spectrosc. 2002, 47, 134–140. [Google Scholar]
- Ferrero, A.; Lucena, P.; Herrera, R.G.; Doña, A.; Fernández-Reyes, R.; Laserna, J.J. Libraries for spectrum identification: Method of normalized coordinates versus linear correlation. Spectrochim. Acta Part B 2008, 63, 383–388. [Google Scholar] [CrossRef]


| Item | Reference Code | Dating | Typology |
|---|---|---|---|
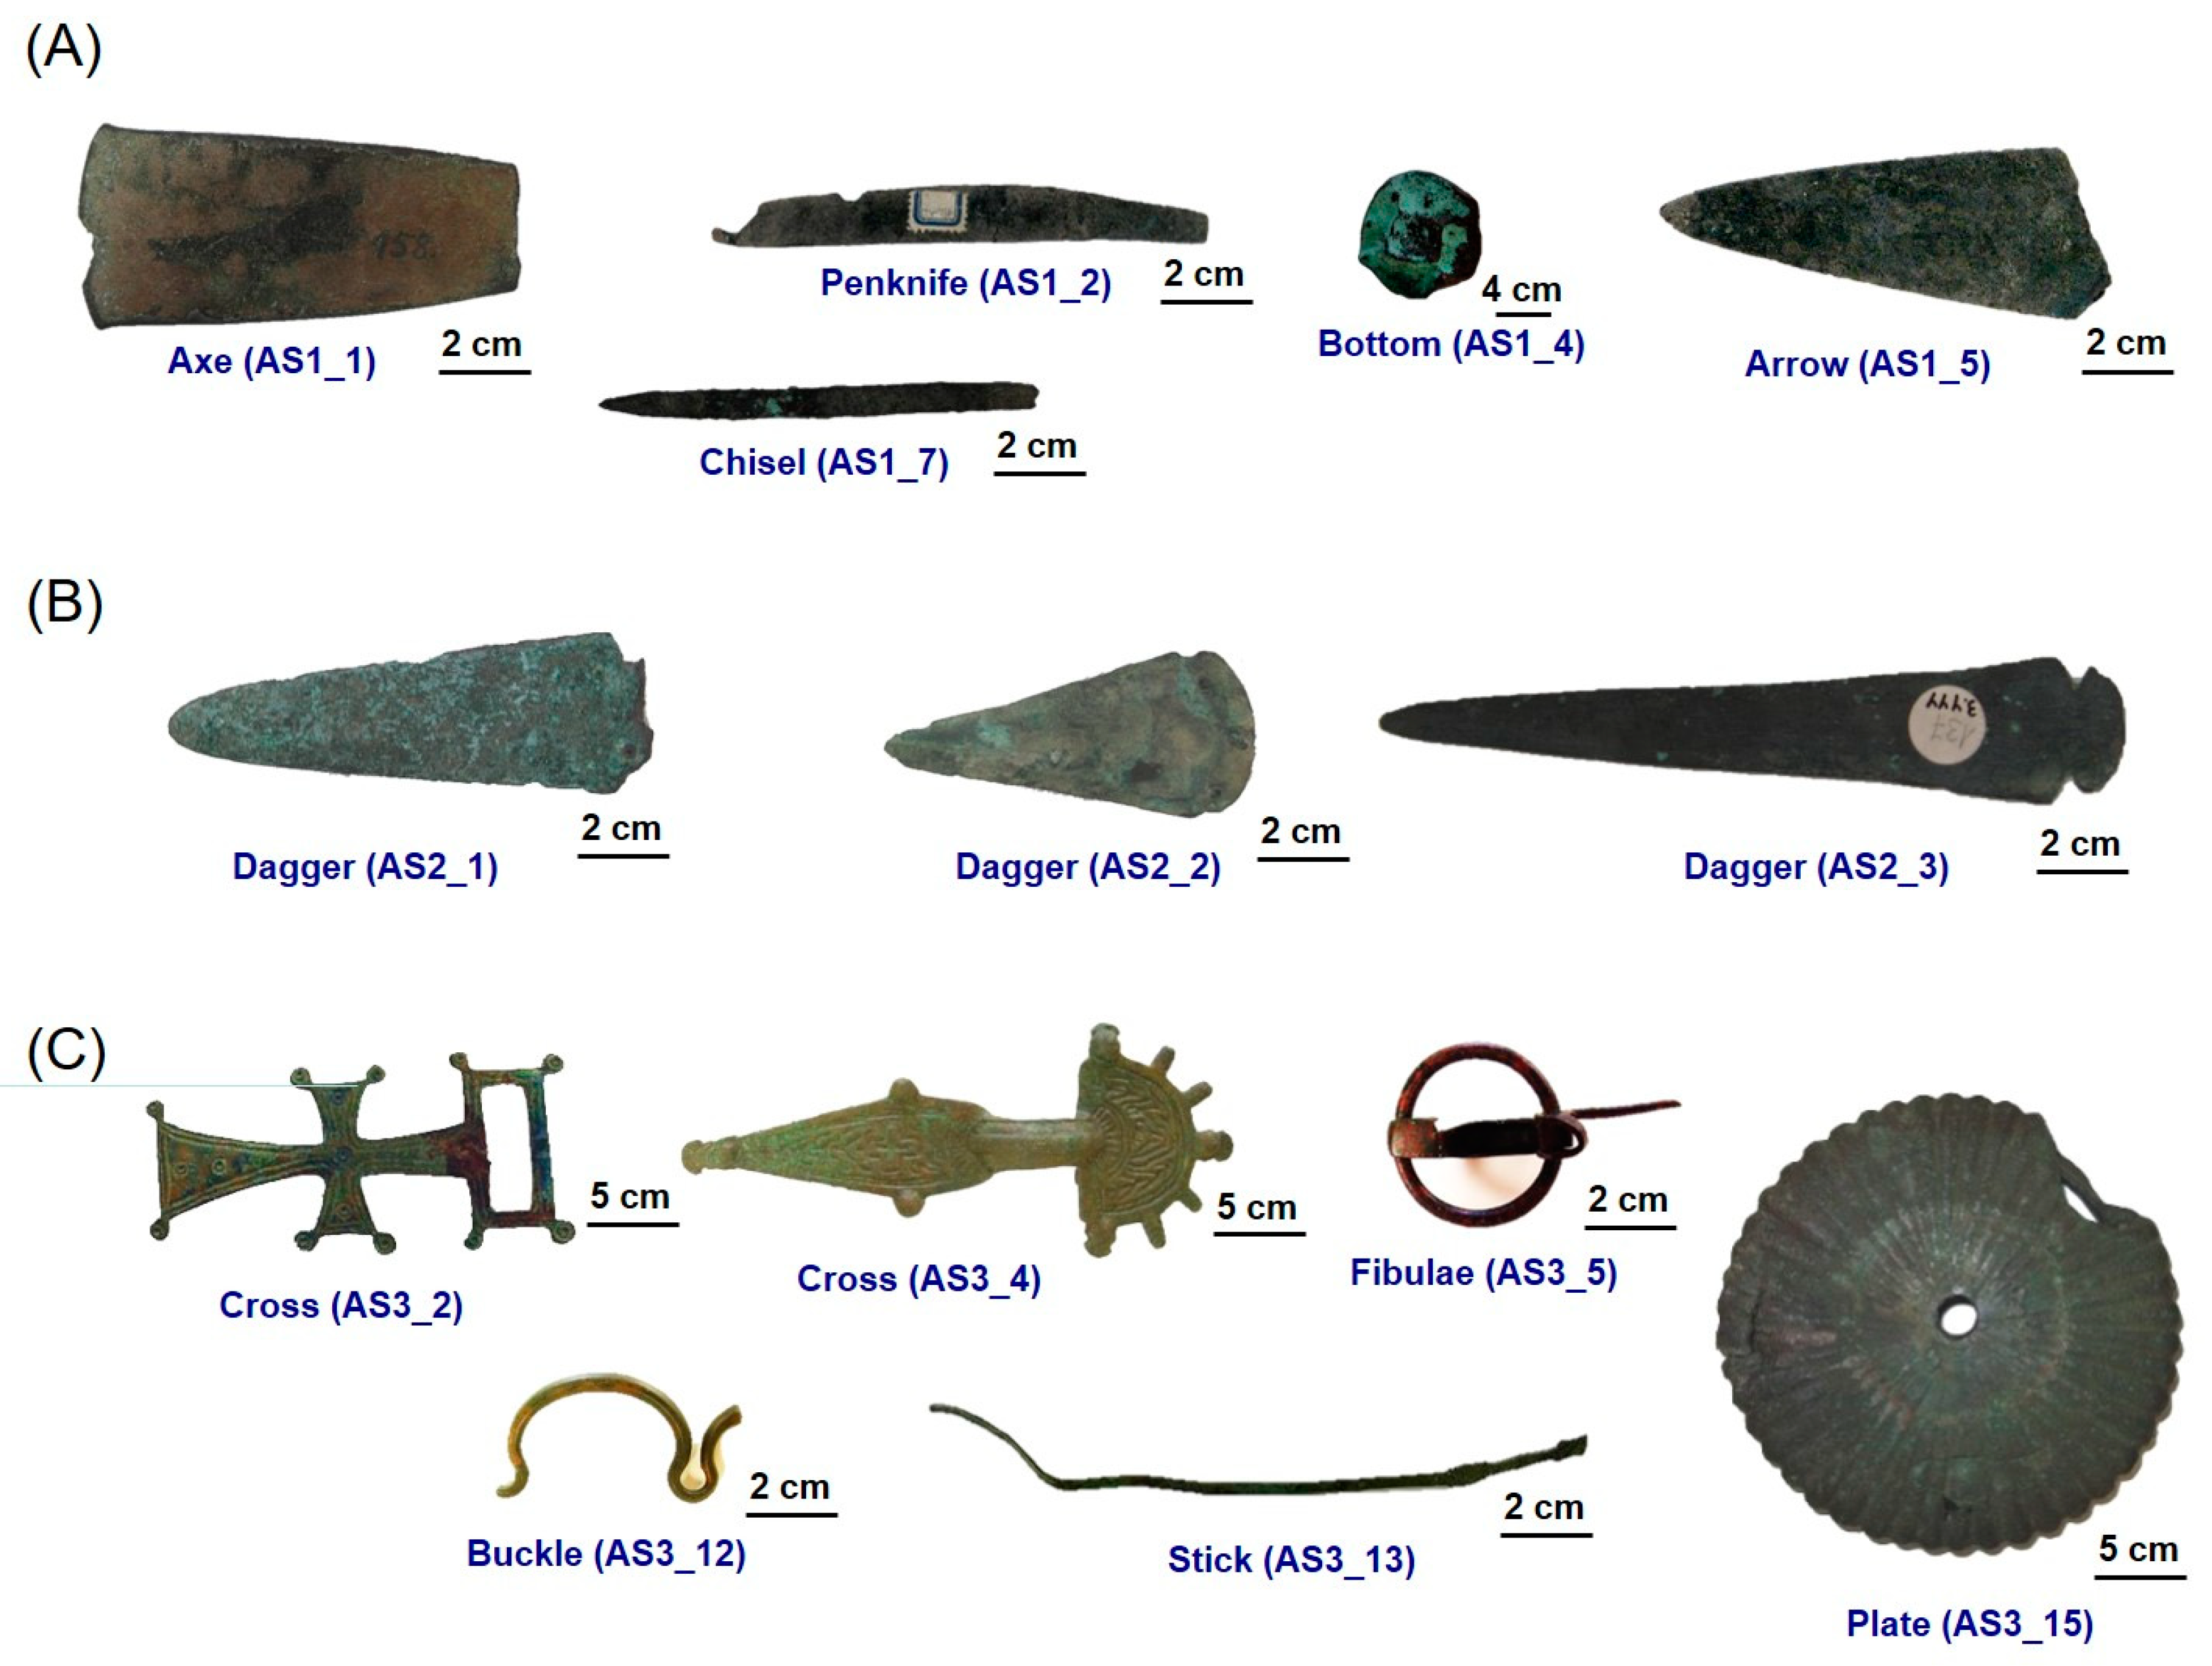
| 1 | AS1_1 | Early Bronze Age | Axe |
| 2 | AS1_2 | Early Bronze Age | Penknife |
| 3 | AS1_3 | Early Bronze Age | Axe |
| 4 | AS1_4 | Early Bronze Age | Bottom |
| 5 | AS1_5 | Early Bronze Age | Chisel |
| 6 | AS1_6 | Early Bronze Age | Chisel |
| 7 | AS1_7 | Early Bronze Age | Arrow |
| 8 | AS2_1 | Final Bronze Age | Axe |
| 9 | AS2_2 | Final Bronze Age | Axe |
| 10 | AS2_3 | Final Bronze Age | Axe |
| 11 | AS3_1 | Iron Age | Buckle |
| 12 | AS3_2 | Iron Age | Cross |
| 13 | AS3_3 | Iron Age | Cross |
| 14 | AS3_4 | Iron Age | Cross |
| 15 | AS3_5 | Iron Age | Fibulae |
| 16 | AS3_6 | Iron Age | Fibulae |
| 17 | AS3_7 | Iron Age | Fibulae |
| 18 | AS3_8 | Iron Age | Coin |
| 19 | AS3_9 | Iron Age | Votive Cup |
| 20 | AS3_10 | Iron Age | Bronze head |
| 21 | AS3_11 | Iron Age | Nail |
| 22 | AS3_12 | Iron Age | Buckle |
| 23 | AS3_13 | Iron Age | Stick |
| 24 | AS3_14 | Iron Age | Buckle |
| 25 | AS3_15 | Iron Age | Plate |
| 26 | AS3_16 | Iron Age | Earring |
| 27 | AS3_17 | Iron Age | Spearhead |
| 28 | AS3_18 | Iron Age | Scissors |
| 29 | AS3_19 | Iron Age | Ring |
| 30 | AS3_20 | Iron Age | Ring |
| Element | Wavelength a,b (nm) |
|---|---|
| Ag | 240.24 (II) (31000), 241.13 (II) (180000), 242.95 (II) (190000), 243.78 (II) (450000), 247.37 (II) (140000), 328.07 (I) (55000r), 338.29 nm (I) (28000r) |
| Al | 257.58 (I) (480), 281.70 (II) (650), 308.30 (I) (4500), 309.36 (I) (7200) |
| As | 278.02 (I) (170r) |
| Ca | 299.73 (I) (8), 300.68 (I) (10), 315.88 (I) (170), 317.93 (I) (180) |
| Cu | 261.84 (I) (2500r), 282.44 (I) (1250r), 296.11 (I) (2500r), 324.75 (I) (10000r), 327.40 (I) (10000r) |
| Fe | 259.94 (II) (23000), 274.04 (II) (250), 274.35 (I) (2750), 274.71 (II) (29000), 275.09 (I) (830), 275.57 (II) (110000) |
| Mg | 280.27 (II) (12), 285.21 (I) (50) |
| Si | 288.16 (I) (1000) |
| Sn | 281.35 (I) (3800), 283.99 (I) (13000r), 285.06 (I) (7500), 286.33 (I) (10000), 326.23 (I) (15000r) |
| Pb | 280.20 (I) (25000r), 282.32 (I) (14000r), 283.30 (I) (35000), 287.33 (I) (14000) |
Publisher’s Note: MDPI stays neutral with regard to jurisdictional claims in published maps and institutional affiliations. |
© 2020 by the authors. Licensee MDPI, Basel, Switzerland. This article is an open access article distributed under the terms and conditions of the Creative Commons Attribution (CC BY) license (http://creativecommons.org/licenses/by/4.0/).
Share and Cite
Fortes, F.J.; Cabalín, L.M.; Laserna, J.J. Fast and In-Situ Identification of Archaeometallurgical Collections in the Museum of Malaga Using Laser-Induced Breakdown Spectroscopy and a New Mathematical Algorithm. Heritage 2020, 3, 1330-1343. https://0-doi-org.brum.beds.ac.uk/10.3390/heritage3040073
Fortes FJ, Cabalín LM, Laserna JJ. Fast and In-Situ Identification of Archaeometallurgical Collections in the Museum of Malaga Using Laser-Induced Breakdown Spectroscopy and a New Mathematical Algorithm. Heritage. 2020; 3(4):1330-1343. https://0-doi-org.brum.beds.ac.uk/10.3390/heritage3040073
Chicago/Turabian StyleFortes, Francisco J., Luisa M. Cabalín, and Javier J. Laserna. 2020. "Fast and In-Situ Identification of Archaeometallurgical Collections in the Museum of Malaga Using Laser-Induced Breakdown Spectroscopy and a New Mathematical Algorithm" Heritage 3, no. 4: 1330-1343. https://0-doi-org.brum.beds.ac.uk/10.3390/heritage3040073