1. Introduction
Various NDT methods are used to examine cultural objects, such as X-ray [
1] and ultrasound [
2] technologies, infrared thermography [
3], terahertz spectroscopy [
4], as well as subsurface radars of both impulse [
5] and holographic [
6] types. The last devices have been used in recent years to obtain images of the internal structure of objects and detect hidden defects, such as delamination, chipping, surface and subsurface cracks, reinforcement corrosion, the presence of small air voids, and moisture distribution [
7,
8]. All these listed methods are characterized by different spatial resolution and penetration depth, as well as different sensitivity to changes in the physical properties of materials. Note that the abbreviation GPR, derived from the English term Ground Penetrating Radar, is often used in the scientific literature to designate a class of devices called by the more appropriate term of subsurface radars.
Subsurface radars together with differential GPS have already revolutionized and become standard methods in archeology, so that it is currently impossible to imagine the preliminary exploration of new sites without their use [
9,
10,
11,
12,
13]. The main advantage of subsurface radars is the ability to survey objects with a one-sided surface such as the Earth or objects with one-sided access like many architectural structures.
Of the known types of radiation and particles, the Earth can potentially be illuminated with the help of neutrino detectors [
14]. However, the spatial resolution and sensitivity of these devices are so low that one can hardly speak seriously about their use for archeology or other applied purposes, even in the long term. Electromagnetic waves of any frequency range have a significant level of attenuation in the earth’s rocks [
15]. Therefore, the assumption that the surface of the Earth is one-sided for electromagnetic emission is currently quite justified. Subsurface radar along with seismic exploration [
16] and gravimetry [
17] have been used for many years to survey near-surface layers of our planet, but, as a rule, the areas of application of these methods are different. Seismic and gravimetry are used to detect mineral deposits at sufficiently large depths up to a few kilometers, and subsurface radars are applied on small ones, starting practically from zero [
15]. The last property of GPR is especially important, for example, for the task of land mines detection including military and humanitarian applications [
18,
19].
In recent years, subsurface radars have also become widely used in the examination of cultural and historical significance objects, for example, in the study of architectural monuments [
5,
20,
21] and even in paleontology [
22]. This is explained not only by GPR ability to examine objects with one-sided access but also by the using of higher operating frequencies, which leads to increasing in spatial resolution, although it usually causes a decrease in the sounding depth [
23]. This was especially evident with the introduction of holographic subsurface radars in the gigahertz range into practice. Holographic subsurface radar recorded MW holograms is a special type of GPR. It emits multi-frequency continuous wave signal and is distinguished by its relative simplicity of design and the ability to adjust the operating frequency range in accordance with the requirements of the task being solved [
7].
The paper considers an example of using MW holographic sensors for examining an old Orthodox Russian Icon dated to the end of 19th century. It describes the technology of microwave holography, which has recently been applied to the examination of art works. Unlike the well-studied X-ray method, MW holography radar as other types of GPR makes it possible to examine objects with one-sided access. Its other advantages are the relative cheapness of the equipment and the safety of use due to the low level of radiation—less than that of a mobile phone by more than an order of magnitude. The article describes a MW holograms reconstruction algorithm, as well as a method for improving the quality of obtained MW images. The data collected at MW research of the Icon are compared with the results of X-ray examination and confirmed by subsequent opening and visual examination performed by professional restorers.
It should be emphasized that Russian Orthodox icons are a special kind of painting with its own canons and technique. Many of the icons are of great importance for Russian culture and history, as they are associated with important events in the history of the country and its traditions.
2. Experimental Installation
To examine cultural objects, an experimental setup was designed on the basis of a vector network analyzer (VNA) Rohde & Schwarz ZVA24, which operates in a frequency range of 10 MHz through 24 GHz,
Figure 1. For outputting power that is less than 10 mW, a transmitting-receiving antenna with rectangular waveguide, which has opening dimensions of 10.7 × 9.7 mm, was used,
Figure 2. The antenna was fixed and connected to the VNA by a flexible cable, and the electromechanical scanner moved the examined object under it. Thus, we used the principle of inverse synthetic aperture. This avoids the influence of cable bending on the phase advance in it, which would be almost inevitable when the antenna moves.
When an object is scanned in a rectangular area with specified dimensions, a multifrequency microwave hologram was automatically recorded with a spatial step of 3 mm in the frequency range of 15 to 24 GHz with step of Δf = 250 MHz.
3. Reconstruction Algorithm for MW Holograms
The experimental setup has such an important property as multifrequency. The multifrequency measurements give the best results in any cases and allow to obtain three-dimensional images of objects. If an object is characterized by its reflection function (the ratio of the reflected and incident waves), then the response recorded by the receiver can be represented as the sum of the products of the signals reflected from each point of the object and a factor describing the delay of the reflected wave compared to the reference one. For the scanning plane with coordinates of (
x′,
y′,
z =
z0), the signal in the receiver can be written as [
24,
25]
where (
x,
y,
z) are coordinates of object surface,
ω is the angular frequency of the probing signal;
is the wave number;
ε is the permittivity of the medium; the factor two in the exponent is due to the double way of the wave: from the antenna to the object and back. This expression does not take into account the influence of the antenna pattern and the attenuation of the signal in the medium, because in comparison with the phase dependences, the amplitude weakly depends on the coordinates and has little effect on the quality of reconstructed images. The exponential expression in (1) is a spherical wave emanating from the point (
x′,
y′,
z = z0), which can be represented by a superposition of plane waves [
25]
where
,
,
are the wave numbers corresponding to the coordinates
,
,
.
Substituting (2) into (1) and redistributing the variables, we obtain
where the triple integral is the 3D Fourier transform of the reflection function
RSubstituting (4) into (3) and using the properties of the Fourier transform, we get
Taking the two-dimensional Fourier transform of both sides of Equation (5) and omitting the difference between primed and unprimed coordinate systems, we have
Given the relation between the wave vector and its projections
and taking the inverse three-dimensional Fourier transform of both parts of (6), we obtain the final expression for the reconstruction of multifrequency MW holograms
The use of expression (8) for reconstructing MW holograms involves the application of Fast Fourier transform (FFT). Usually, a hologram is recorded on a discrete uniform coordinate grid (x, y, ω), so a two-dimensional FFT can be used to obtain its spectrum. It follows from (7) that the expression S in (8) is unevenly distributed along the kz coordinate. Its data are uniformly distributed over kx and ky and lie on concentric spheres of radius 2k. Therefore, it is impossible to use the FFT directly for the calculation of .
There are two approaches to solve this problem. At the first, we can recalculate S to a uniform grid in all coordinates. However, since S changes rapidly depending on kz, it is permissible to use only linear interpolation without going beyond the boundaries of kz for each pair (kx, ky). As a result of such a procedure, partial data loss occurs and because of this, the range resolution deteriorates along the z-coordinate.
The second approach is to apply special algorithms for the Fast Fourier Transform on a nonuniform grid [
26]. The results of the computer simulation show that this method gives the significantly better results in the reconstruction of MW holograms. Therefore, despite the complexity of implementation, it is expedient to use it.
4. External Description of the Icon
An old Orthodox Russian Icon from a private collection was chosen for examination at the experimental setup. Experts of the Grabar Art Conservation Center [
27] according to the results of an external examination established that the Icon was presumably made at the end of the 19th or possibly at the very beginning of the 20th century. Russian Orthodox iconography is a special kind of painting with its own traditions and canons. The study, preservation and restoration of icons are of great importance for Russian culture and history because many icons are associated with important events in the history of the country. The experts found that the designation of the Icon is “Our Lady of Kazan” after the name of the ancient Russian city.
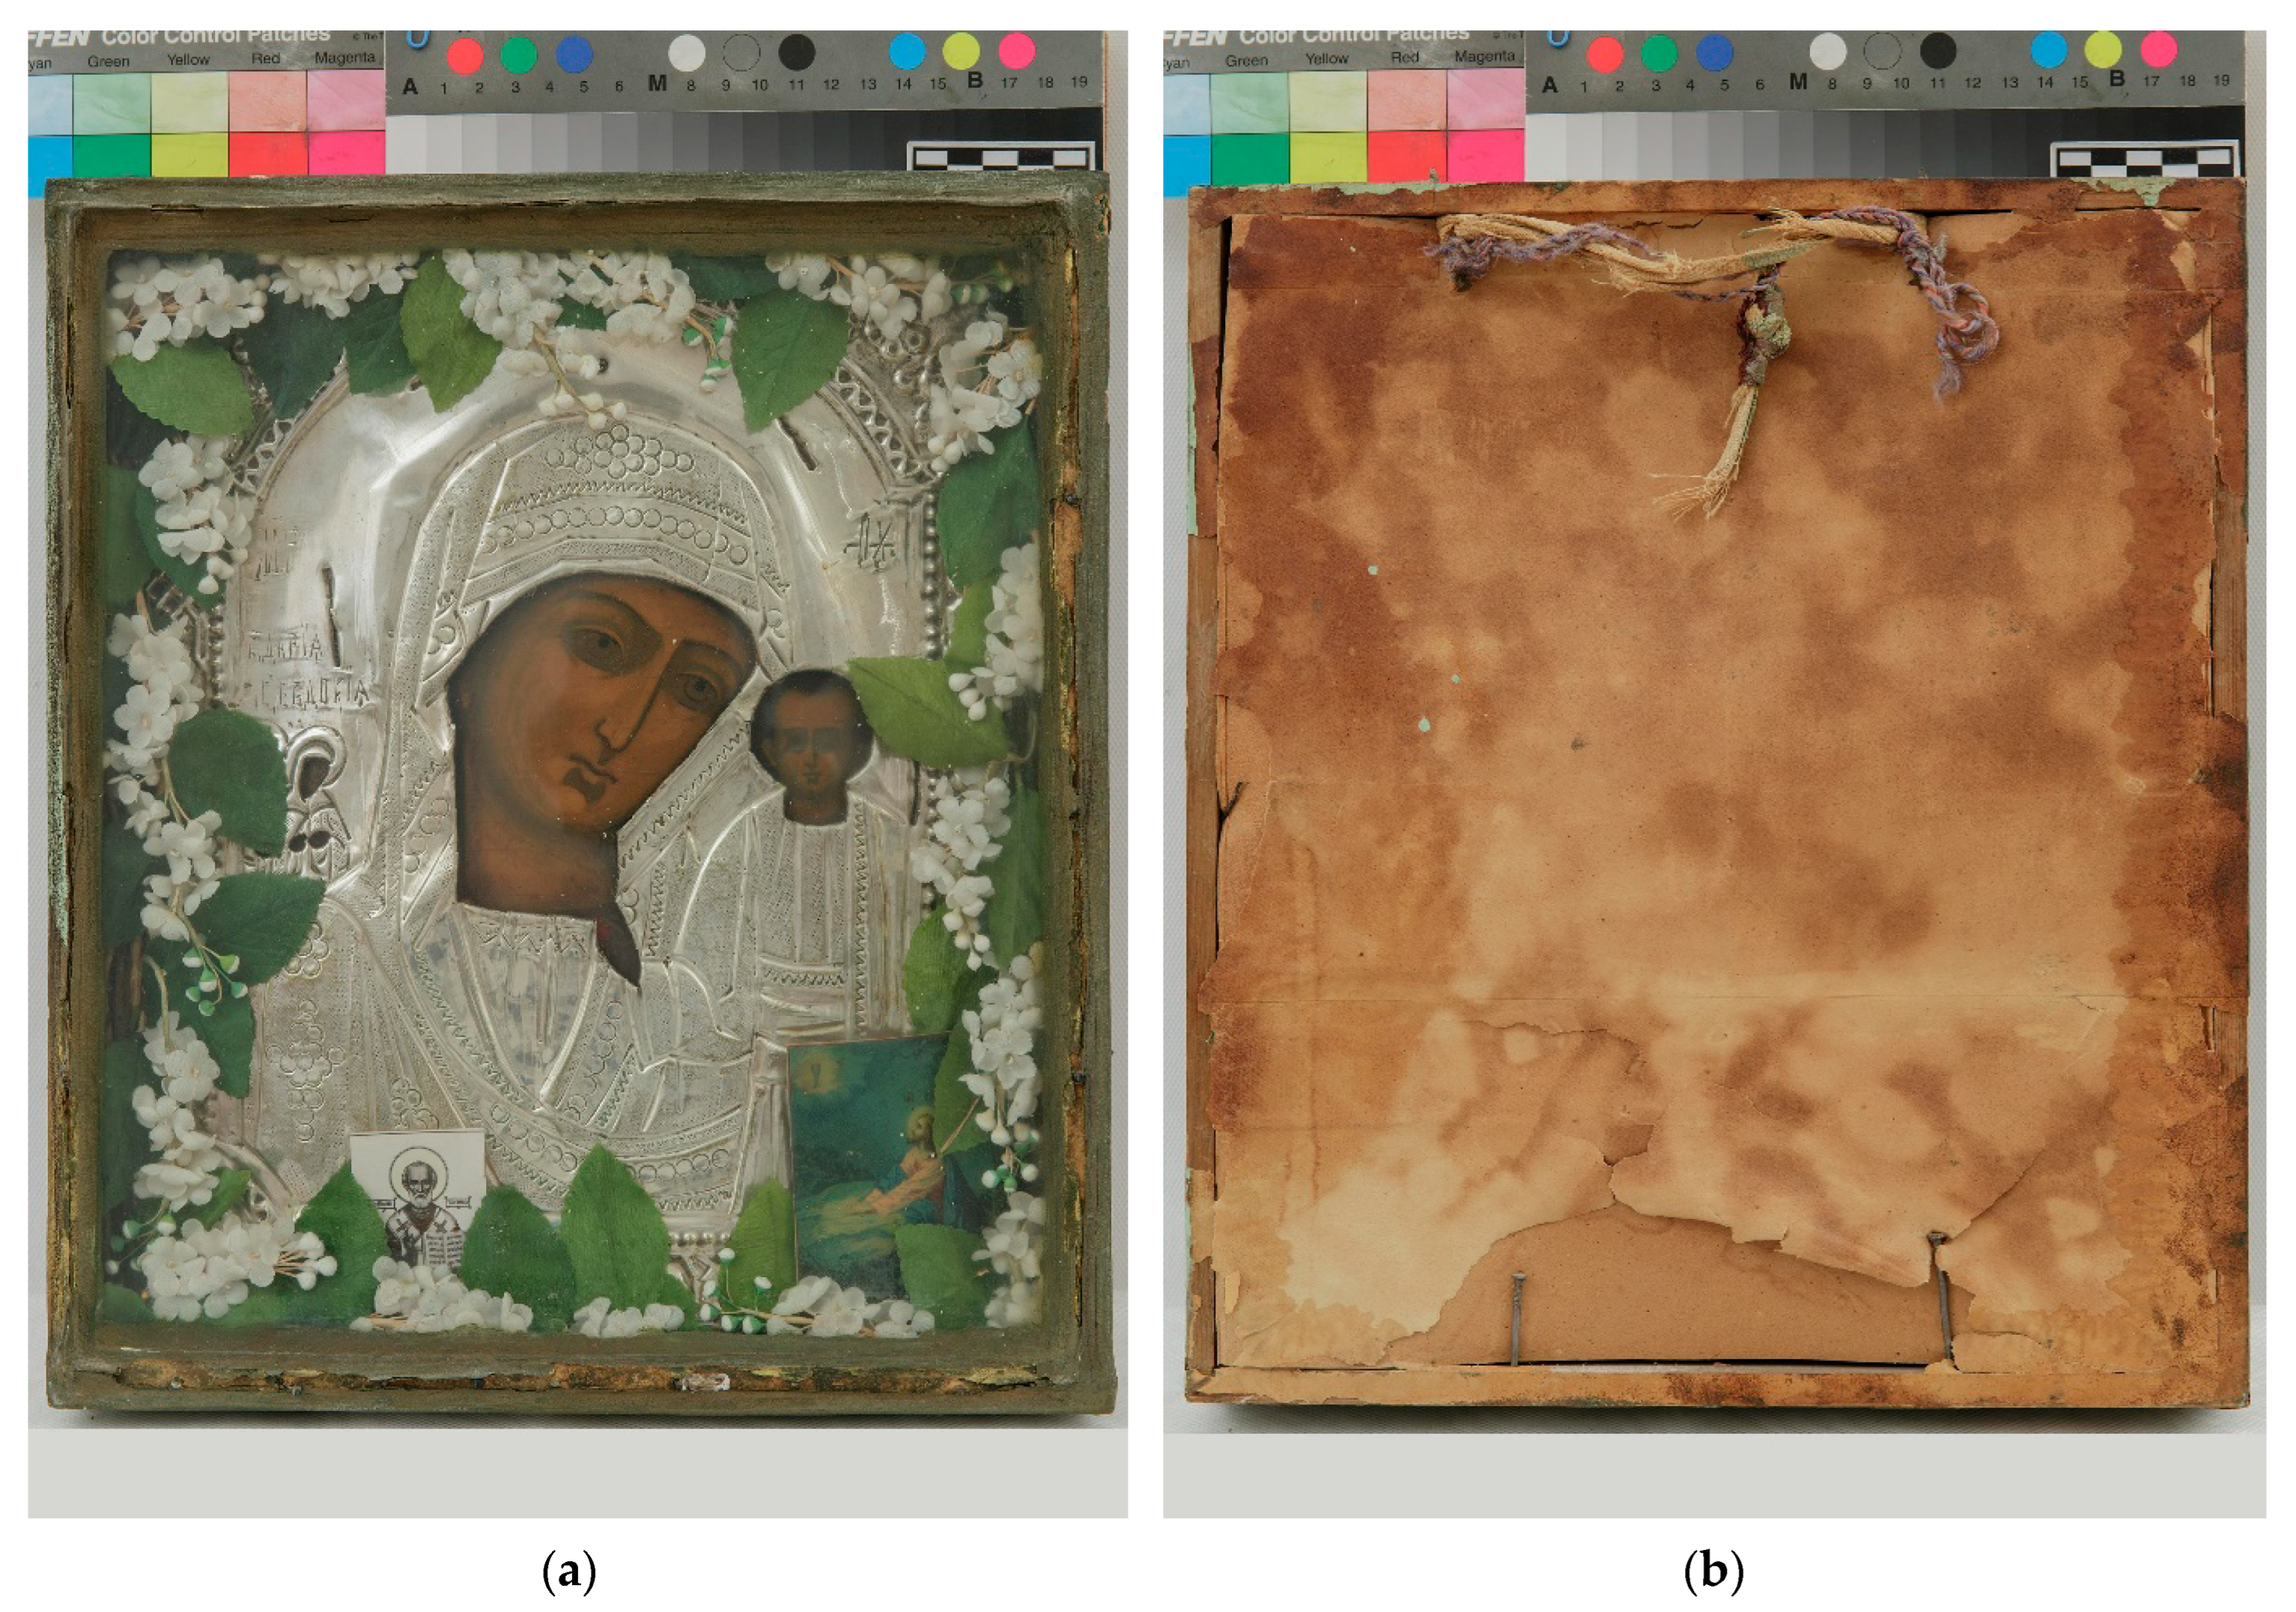
The Icon depicts the Madonna with the Christ Child. The face Icon side is covered with transparent glass, under which the Icon itself and its silver-plated brass setting, named oklad and produced as a rule from valuable metals—gold and silver—are visible. The setting almost completely covers the Icon, with the exception of the faces of the Saints,
Figure 3a. The Icon is placed in a wooden kiot, which is a special decorated and glazed locker.
The dimensions of the Icon itself are 31 × 25 cm, while the size of the kiot is 43.7 × 29.2 cm. The height of the kiot to the level of the glass is about 5 cm. The materials used in making the Icon are wood, gesso, tempera and brass. The technique of manufacturing a brass setting was typical for that time and included chasing, engraving and silvering.
Figure 3 shows the face and back sides of the Icon. These photos were kindly provided by the Grabar Center.
5. Registration and Reconstruction of Icon’s Microwave Holograms
MW data were recorded from both sides of the Icon in the frequency range of 15 through 24 GHz (wavelength
λ = 0.9 ÷ 2.0 cm) with a step of 250 MHz.
Figure 4 presents a complex microwave hologram registered from the Icon face side at a frequency of 24 GHz. Scan height, i.e., the distance from the antenna opening to the level of the glass covering the Icon was 18 mm. Due to the small distance to the Icon, the registered microwave hologram quite well resembled the visible image of the Icon itself. The difference between microwave holograms and holograms recorded in the visible range was discussed in detail in [
23].
Figure 5 demonstrates MW images (the reconstruction results of multifrequency MW hologram) at different depths when the icon was scanned from the face side. The reconstruction distance of 18 mm corresponds to the distance to the glass covering the icon, and 30 mm corresponds to the distance to the surface of the icon itself.
As can be seen, the MW images of the face side of the Icon do not provide any significant additional information, since about 90% of the icon’s surface was covered with its silver-plated brass setting, which completely reflects electromagnetic radiation in MW range.
The Icon back side was covered with MW semitransparent cardboard,
Figure 3b. In this case, the presence of a reflective layer in the form of the brass setting does not affect the MW images calculated for distances smaller than the distance from the antenna opening to the surface of the metal substrate [
28].
Figure 6 shows a complex MW hologram recorded from the Icon back side at a distance of 12 mm from its surface.
In this case reconstruction of the recorded MW holograms gives possibility to explore the inner space of the icon between the brass setting and cardboard without opening the Icon.
Figure 7 presents the results of reconstruction of multifrequency MW holograms for different distances: 12 mm is the cardboard surface distance, and 88 mm corresponds to the Icon painting range. Distances of 32 mm and 62 mm are interjacent ones.
At focusing distance of 12 mm, the nails are clearly visible, which are driven into the wooden frame of the Icon kiot and hold the cardboard cover in place. The distance of 88 mm corresponds to the face side of the Icon and is uninformative. Of greatest interest is the 62-milimeter focusing distance. At this distance, two bright transverse spots are clearly visible, which, presumably, could corresponds to embedded parts (dowels) that prevent warping of the wooden board on which the image of the icon is applied. This assumption is justified by the fact that using of such dowels is traditional for the technique of making Icons of that time.
In the MW image, as shown in
Figure 7c, in addition to two bright spots, there are less visible contrasts observed in the signals reflected from the irregularities of the chasing brass setting. These background reflections can be suppressed using the defogging algorithm [
29].
In the processing procedure, the bright cyan regions are treated as the signals of interest, while the dark blue as the background. The defogging algorithm is described in the following steps:
- -
Input the image I
- -
Invert it according to Rc(x) = 255 – Ic(x), where c is the color channel (RGB). Ic(x) is the intensity of a color channel of pixel x of I. Rc(x) is the same intensity of inverted image R
- -
Select n (for example n = 100) pixels whose minimum intensities in all color (RGB) channels are highest in the image, and then among the pixels choose the single pixel whose sum of RGB values is the highest. The RGB values of this pixel are used for determining the parameter A that represents the pixel value among the pixel with the largest RGB value sum, which contains the pixel values of the three color channels.
- -
Estimate t(x) using , where Ω(x) is a local block centered at x, and the weight factor θ equals 0.8.
- -
Compute J(x) using .
- -
Invert J to obtain the enhanced image E.
Figure 8 shows the result of applying this algorithm to the MW image in
Figure 7c. The introduction of the defogging algorithm made it possible to greatly eliminate the background reflections and to highlight the areas of interest.
Taking into account the novelty of the microwave holography, it was of undoubted interest to compare its results with methods that have been widely and for a long time used in the restoration of art works for example fluoroscopy, i.e.,
X-ray technology. To verify the assumption about the presence of embedded parts at a depth of 62 mm, the Icon was shined through in the Tretyakov Independent Art Research & Expertise [
30] on the X-ray machine RAP-50 developed by the company ELTECH-Med [
31]. The results are shown in
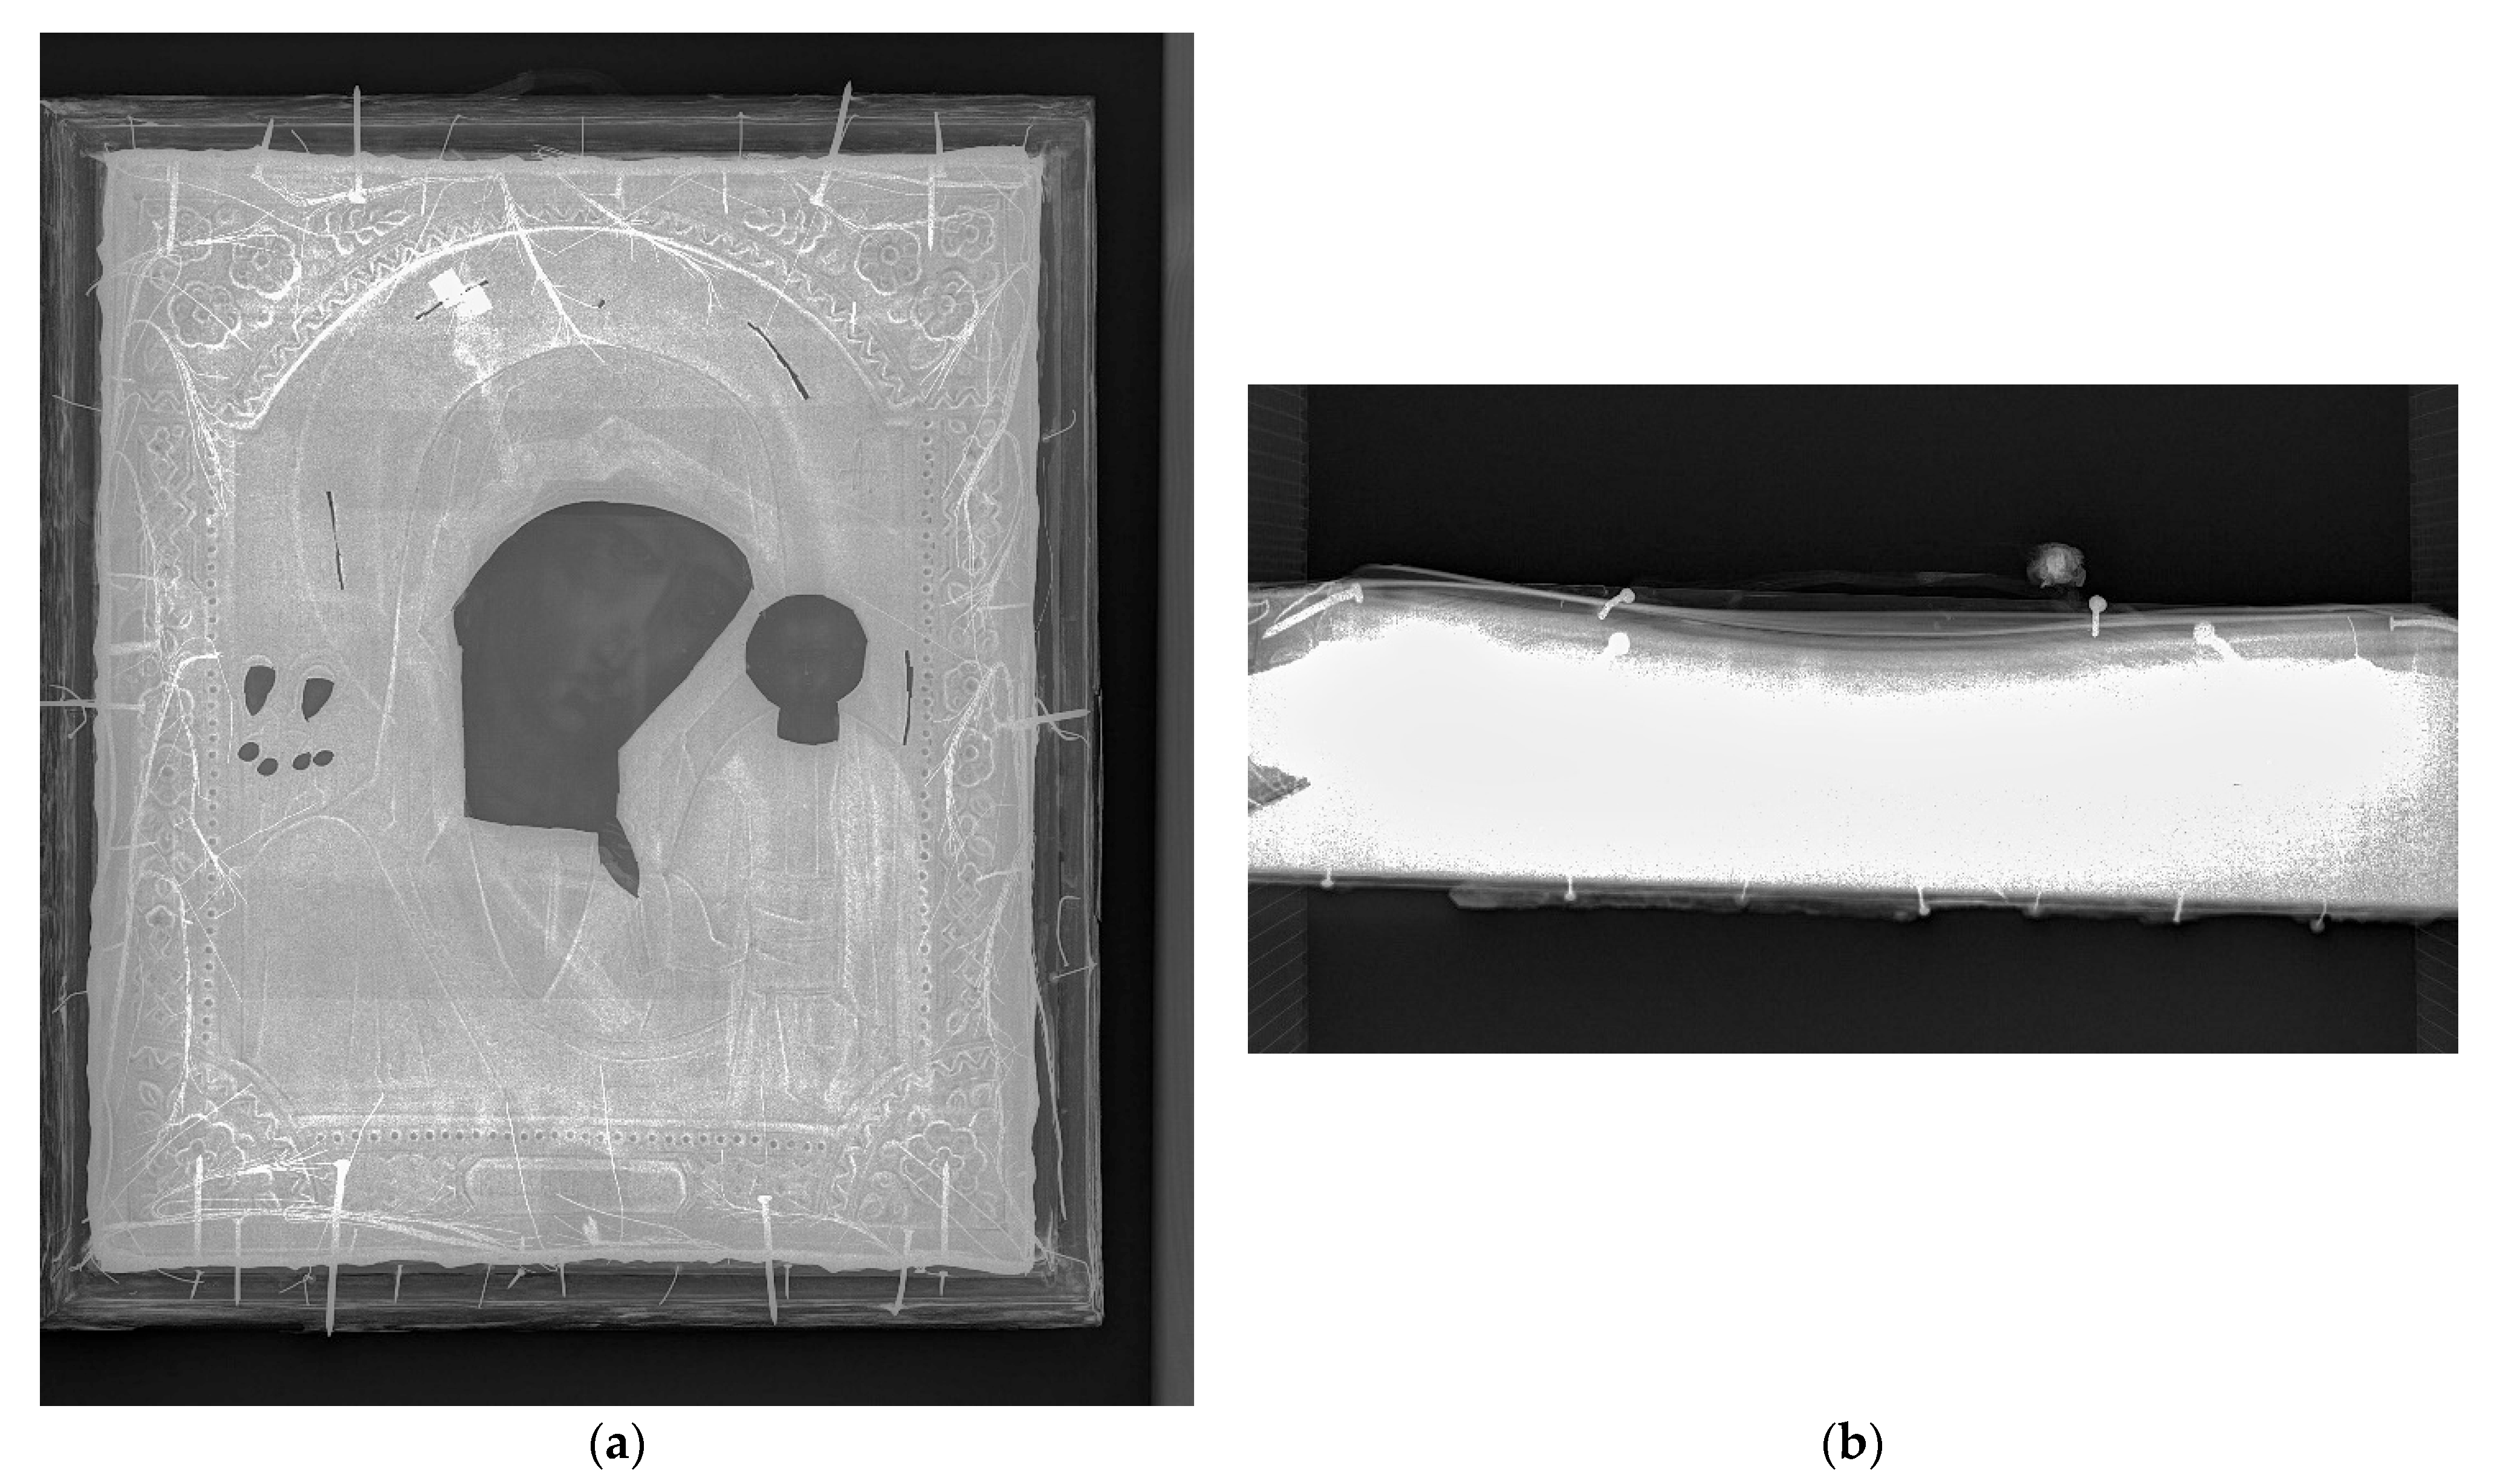
Figure 9.
X-ray image in
Figure 9a confirmed the possible presence of embedded details, which are visible in the form of darker rectangular stripes above and below the image of the Mother of God face. The edges of these two strips are also visible in the MW image,
Figure 7c. The butt image of the Icon did not provide any new information. Only the nails hammered into the wooden frame of the Icon are clearly visible.
Grabar Center restorers, based on their previous experience with Russian icons, have suggested that this is a reflection from embedded parts—two wooden dowels that prevent warping of the board with the painting applied to it. Warping can be caused by the wooden board drying out over time. The dowels are usually inserted into a groove cuts on the back of the icon board. This technique of making Russian icons has been traditional for several centuries.
6. Results of the Icon Opening
Further research of the Icon was carried out by professional restorers at the Grabar Art Conservation Center [
27]. Taking into account its dilapidated state, it was decided to open the Icon and renew its cardboard back, which began to collapse. The stages of Icon opening were recorded, and their sequence is shown in
Figure 10.
Based on the results of the opening, the restorers provided the following description of the Icon.
The Icon is made on a wooden base, which consists of one board. Both countercut dowels are missing, and the grooves made under them are empty. Levkas (iconic primer) is chalky, the paint layer is in good condition. The composition is traditional for this kind of Russian icon painting. The Mother of God is depicted up to her shoulders with the Christ Child near her left arm. Behind the right shoulder of the Virgin, the figures of Saints Daria and Eudoxia are painted. The surface of the icon is covered with a silver-plated brass oklad, except for a personal letter, for which gaps are made in the oklad. The painting is covered with a thin layer of darkened drying oil.
The icon is a classic example of Russian provincial icon painting of the late 19th or possibly early 20th century. According to the technological and stylistic features, the Icon and the silver-plated brass oklad were made at the same time at a good professional level. The Icon with oklad has an antiquarian value, as a work of Russian icon painting of the end of the 19th century.
The most unexpected result of the opening was the absence of early supposed dowels, which apparently were once lost or absent initially.
Figure 10b,c demonstrates only empty the groove cuts. Observed in
Figure 7c, reflections in the microwave range and dark strips in the X-ray image,
Figure 9a, actually represent the recorded signal from the grooves on the Icon board back into which the dowels were supposed to be placed. According to the Grabar experts, it is currently impossible to establish whether the dowels were missing initially or were subsequently lost.
7. Conclusions
The performed studies made it possible to compare the effectiveness of the developed method of holographic subsurface radar operating in the microwave range and X-ray technology, which became the standard method of non-destructive testing in the 20th century in many areas, including the examination of cultural objects. This comparison became possible because the examined object such as the old Orthodox Russian Icon, gives two-sided access, which is necessary for examination in the X-ray machine. Undoubtedly, the X-ray range has a significantly higher spatial resolution due to the shorter wavelength that differs by about ten orders of magnitude from the wavelength characteristic of the microwave range. However, with one-sided access to the object, microwave holography has an undoubted advantage. Such objects are for example building structures (walls, ceilings and floors of buildings), which by themselves or with frescoes and mosaics applied to them cannot be examined in the X-ray range. Besides, it is necessary to take into account the features of the object under study and the problems that arise in this case. For example, MW holography has an increased sensitivity to variations of humidity [
32], which can be useful when examining parts of buildings that are in contact with the ground or objects exposed to moisture. This technology can also help to determine the depth of the subsurface object of interest, which was demonstrated in this article by measuring the range to the grooves.
Another advantage of holographic subsurface radars is their complete safety for operating personnel, since the power of the emitted signal used in them is two orders of magnitude less than the power of a mobile phone and the devices themselves can be made compact and easy to use [
7].
In conclusion, we note that in our opinion microwave holography does not claim to replace existing technologies for diagnosing cultural heritage objects. It can only complement traditional technologies, providing additional opportunities for restorers and researchers. Since MW holography is relatively new technology, further research is needed to determine the areas of application of MW holography in the examination of cultural objects.

 ,
, 


