Article

Integration of Laser Scanner, Ground-Penetrating Radar, 3D Models and Mixed Reality for Artistic, Archaeological and Cultural Heritage Dissemination

Department of Civil Energetic Environmental Engineering, Mediterranea University, 89124 Reggio Calabria, Italy
*
Author to whom correspondence should be addressed.
Submission received: 17 April 2022 / Revised: 21 May 2022 / Accepted: 23 June 2022 / Published: 4 July 2022
(This article belongs to the Special Issue Mixed Reality in Culture and Heritage)

Abstract

:
Three-dimensional digital acquisition techniques can be useful in archaeology because they make a further technological contribution to the visualization of finds and structures. The possibility of integrating three-dimensional models from different acquisition systems (laser scanner, UAV, reflex and Georadar) is even more exciting. One of the peculiarities of these integration techniques is the possibility of promoting the dissemination of knowledge through virtual reality, augmented reality and mixed reality, given the widespread use of mobile devices. This does not mean, of course, that with the mere creation of a 3D model (and allowing it to be viewed in 3D), the public automatically obtains more information about heritage. In fact, visiting a cultural heritage site in person allows one to receive much more information on finds and structures. However, if this is not possible, technologies that use 3D Virtual Reality help to provide a small knowledge base to those who cannot use the museum. We underline the importance of an integrated visualization from an archaeological and architectural perspective to obtain understanding of the structure with the integration of the two models with different data. The work that we present is part of a multidisciplinary project to recover and disseminate information about the Reggio Calabria’s (southern Italy) artistic, archaeological and cultural heritage. This work’s goal is the realization of a unique 3D model of the church “Madonna dei Poveri” (3D model of a buried part with 3D model of visible parts) by combining different geomatics techniques to show and investigate the interior and exterior parts (3D model obtained by laser scanner and photogrammetry), and the underground crypts (3D model obtained by Georadar), which are lying below the present surface and are no longer accessible due to coverage by post-depositional processes (Georadar). Finally, an app (using augmented reality and virtual reality) and a first experimentation of Mixed Reality is developed for the dissemination of the archaeological and cultural heritage information on the area of interest.

1. Introduction

The technological developments of recent decades allow us to enjoy cultural heritage in a completely different way than was possible in the past. This is true both from the perspective of the typical visitor, who can enjoy the heritage in an interactive way, and from the perspective of an expert or an enthusiast. It is possible to quickly and functionally access a much greater amount of information than was possible in the past [1,2,3,4,5]. In fact, the use of advanced techniques allows us to obtain digital models of structures of historical and artistic interest that are scattered throughout the country [6,7,8,9,10,11,12,13]. The models [14,15,16,17,18,19,20] can be implemented within augmented or virtual reality apps so that users can enjoy these works in a much more immersive way [21,22,23,24,25,26,27,28,29]. The use of mixed reality in the field of cultural heritage is now widespread.
In addition, the use of tools that are suitable for investigating the underground, such as Ground-Penetrating Radar (GPR) [30,31,32,33], can reveal and allow users to enjoy what lies below the works and is no longer accessible due to burial by debris and soil as a result of calamitous events. These techniques allow us to study our historical heritage in depth and allow for a more immersive and complete enjoyment of it. The following work presents a survey carried out on the church of the “Madonna dei Poveri” (church “Pepe”), commonly known as “Krèsi-Pipi”. This represents the oldest Christian building in the city of Reggio Calabria (Figure 1). It is a Byzantine-style building that was built around the 10th century. Two different technologies were used to investigate the exterior and interior of the building: the exterior of the building was investigated using photogrammetric techniques using a drone Mavic 2 Pro and a Reflex Canon EOS 6D; and a Faro Focus 3D laser scanner was used for the interior. The identification of archaeological finds, structures or sites of interest buried within the area investigated was carried out through the use of a GPR IDS RIS k2000 at different frequencies of investigation. GPR was used to identify any archaeological structures buried in the area investigated, performing scans at different frequencies. This survey was mainly carried out to understand if any crypts were present under the floor.
Once the 3D models were obtained using these different techniques, the same models were merged through conversion into a single common format. It was necessary to convert the three-dimensional model obtained from GPR data (a MatLab environment) into a model that could function in 3D modeling software. Moreover, the fusion of the models was directly realized in a more expeditious way in virtual reality, since the different types of 3D models from Georadar did not offer a metric precision comparable to that obtained from the 3D models made by laser scanner and photogrammetry technology. In this regard, the proposed app allows for the management of the created 3D models and can be used by the tourist/operator who wants to enjoy the asset.
From a technical application perspective, therefore, the purposes of the proposed application (the integration of various models in a single system and the creation of a virtual reality app) are as follows:
  • To create a three-dimensional digital model with a high level of structural detail that can be implemented in a BIM or CAD environment to design any future restoration of the structure.
  • To enable the integrated management of the digital model of the survey area, which allows for a dynamic exploration of the study area and allows for access to and analysis of the information based on geospatial attributes, maintaining a high level of detail.
The result is, therefore, an integrated management of the digital model of the area, which ensures a real working environment that can be explored dynamically, and, where possible, to store, manage and analyze different types of information on the basis of their geospatial attributes.
Then, an app (that uses augmented, virtual and mixed reality) was developed for the dissemination of the archaeological and cultural heritage of the area of interest; in our opinion, this synthesis tool can be used to disseminate information to the community.
Mixed reality allows for tourists, and also restorers and scholars, to experiment with new ways of interacting with cultural heritage, guaranteeing a completely new level of experience. In particular, scholars and institutions that deal with building maintenance, thanks to the construction of a virtual world that starts from a BIM reconstruction that is faithful to the original and contains an enormous amount of data, can interact with the structure and simulate quite invasive restoration interventions in ways that the current reality would not allow.

2. Materials and Methods

2.1. Data Acquisition

The survey activities presented in this note were carried out by laser scanner, photogrammetry and GPR. In particular, the exterior was surveyed with photogrammetric techniques, the interior with the laser scanner, and the crypts or the possible presence of archaeological finds with GPR. Once the different 3D models were obtained using these various techniques, the best approach for surveying was found to be a combination of different tools and modelling techniques. In fact, the use of a single 3D surveying technology does not produce a satisfactory result in all working conditions in terms of geometric accuracy, portability, automation, photorealism, low costs, equal efficiency and flexibility [11,14].
For this reason, as mentioned above, we used laser scanners and photogrammetry to survey that which is physically accessible in the church, and the GPR to survey the crypt, which is not physically reachable at present.
Figure 2 shows a flowchart of the survey operating procedures:
The exterior of the church was surveyed through the use of photogrammetric techniques on images acquired by Unmanned Aerial Vehicles (UAV) and a reflex camera.
A DJI Mavic Pro drone, equipped with a stabilized 4k camera with a 12 Mpx sensor, was used to capture the photos needed for 3D reconstruction. Flight plans were created at 10, 15, and 20 m, with a 70° incline and orthogonal camera, to automate the surveys (Figure 3). The ability to control the UAV in real-time from a ground station allowed for detailed footage to be obtained of the surveyed works while monitoring the device’s position, altitude and state.
Given the particular location of the church within the urban context (two of the three sides are almost adjacent to buildings), the parts not visible or acquired by drone were integrated using manually operated cameras on the ground. The survey campaign was designed to enable the tool to achieve the maximum amount and highest quality of data with the minimum possible number of station points.
We used a Canon EOS 6D camera, that is, a full-frame, 35-mm, Digital Single-Lens Reflex (DSLR).
The camera has a 20.2-megapixel full-frame CMOS sensor and an ISO range of 100–25,600, expandable to L: 50, H1: 51,200 and H2: 102,400 for better image quality, even in low light.
If we had access to equipment with a higher megapixel count, the results would have been more accurate, but 20.2 megapixels is more than enough for a high-resolution, three-dimensional model.
For the survey, we designed the photo campaign so that the photos overlapped by at least 80%.
We used a set number of shots for the model, combining UAV shots with ground shots as needed.
For the 3D reconstruction of the church using photogrammetry surveys (Figure 4), Agisoft Metashape software was used. The workflow was completely automatic for both the orientation of the images and the generation and reconstruction of the model. This condition led to an optimization of processing times, ensuring a good performance from the machine/software complex.
The spatial resolution of an aerophotogrammetric survey is determined by the ground sampling distance (GSD).
The GSD is the distance between two adjacent pixels in an image. In practice, the GSD is the field pixel size.
The GSD defines the pixel field measurement. The finer the GSD, the finer the photograph.
The GSD is dependent on the drone’s camera resolution, optics focal length and flight height.
Photographs taken at 20, 25 and 30 m above the ground yield pixels that correspond to 0.73, 0.91 and 1.5 cm, respectively, on the field. Therefore, planning flight missions for an aerophotogrammetric survey does not guarantee the survey’s accuracy.
The drones have GPS, but do not have enough precision to place the model exactly where it needs to be.
Ground control points (GCP) are used to reconstruct a robust 3D model with precise accuracy in centimeters. GCP must be natural points that are visible on the ground, with the precise coordinates calculated by professional tools, such as GSP RTK receivers, which are uniformly distributed throughout the territory and sufficient in number (16 total points) to reconstruct a robust 3D model with centimeter precision. Our results suggest that 16 GCPs are required to obtain accurate measurements. GPC is not required in surveys where errors of less than 10% are acceptable.
In relation to the survey of the exterior using photogrammetric techniques from UAV and camera, as in Figure 4, we report the results of the 3D model obtained through Metashape software.
Internal survey building was acquired by 3D Faro Focus laser scanner. This allowed us to obtain a three-dimensional model of the external structure in a relatively short time, and with a high-definition, three-dimensional model output. We created seven station points around the structure.
We calculated the number of stations to allow for processing steps between contiguous scans.
An internal electronic bubble confirmed the compensator’s limits for perfect horizontality once the desired scan parameters were set [1]. A one-point, 4-mm resolution was used in both directions, in less than a quarter of the survey (12 scans).
After data collection, data processing was required. We processed the laser scanner’s raw data using FaroScene rel. 4.1 software, and divided the registration phase into two parts. First, all point clouds were checked for high alignment errors after removing unnecessary or erratic points (Figure 5). We then repeated the process to check for errors. We aligned the clouds to ascertain the geometric information from each scan. The software identified alignment errors ranging in height from 3 to 7 mm. As a result, an editing process (manual) was used to remove all inappropriate points. Collimation and registration were performed using the detected structure’s characteristic points (edges and vertices). After re-registering, the software found new alignment errors ranging from 1 to 3 mm. The classic procedure of identifying homologous points resulted in a cloud of homologous points with a pitch of around 1 mm in the lower region and around 3 mm in the upper region.
Each scan turned the point cloud into a mesh, allowing for a more intuitive interpretation. Lastly, the RGB images were projected onto the mesh to create a 3D model. To create an interactive model, where the user can view the ruins in 3D, the point clouds were processed by the software (JRC Reconstructor 3.3.2 and Image 5.01).
In relation to the survey of the interior with laser-scanning techniques, Figure 5 shows the 3D results obtained using Faro Scene software.
Table 1 compares the precision of the photogrammetric and laser scanner methods of producing 3D models (in terms of both tools and the algorithms and software used for restitution and processing).
Each instrument’s raw and clean clouds were identified by identifying 12 characteristic points, and the difference (raw–clean) and precision (Δ raw–clean) were calculated and compared to real measurements.
In relation to the survey activities regarding the presence of crypts or objects of archaeological interest, the “buried” GPR survey technique was used.
Therefore, the crypt survey was carried out by GPR IDS RIS k2000 and a 200 MHz central frequency antenna in monostatic mode.
The profiles were performed using the RSAD sampling technique, which requires data sampling to be carried out by sliding the antenna over the surface of investigation.
On the examined area (9.09. m × 6.79 m) we recorded 22 GPR profiles acquired in two directions with a distance of 0.5 m between the two profiles for about 380 m (Figure 6).
Therefore, we divided the entire survey area into a square mesh grid that we will also use as a common reference system, between what we detected below the structure, with the GPR, and the structure itself.
The extrapolation of thousands of 2D images from a large GPR survey requires time and expertise to read the single radargrams, as is well known. In this way, even inexperienced eyes can interpret GPR data. Migration algorithms were included to pinpoint the exact location of buried objects, as well as to outline their shape.
These methods process and display object forms that are closer to their physical dimensions, improving spatial placement.
Diffraction summation was used to obtain a target focus tracking.
FK migration was used to better identify the point position and allow for a phase shift plus interpolation.
In relation to the survey of the buried part with GPR techniques, reported in Figure 7, the results of the campaign of one-dimensional restitution through MATLAB were found according to the following operations:
(1)
Uploading data within the MatLab environment;
(2)
Signal plot;
(3)
Signal normalization;
(4)
Background noise reduction;
(5)
Filtering;
(6)
Downstream graphical representation of the process.
The investigations conducted to date reinforce the hypothesis of the presence of a crypt, which provides further information on the organization of the structure, allowing for more in-depth study of the typology of this place of worship.
In medieval ecclesiastical buildings, the crypt (from the Greek κρύπτη, kryptē; hence, the Latin crypta, meaning “hidden”) is a room made with stone. Usually, it was placed under the floor of the church and was used as a chapel, or often contained the tombs of important personalities, such as saints (or their relics) or high offices of the clergy.
Initially, the crypts were made under the apse or the choir, but later they were also made under the transept, the side chapels of the church, or its naves.
To achieve the 3D crypt model (identified with the one-dimensional Georadar data elaboration methodology reported in Figure 8), and integrate it with the 3D church models obtained from drones and laser scanners, we proceeded to the realization of the 3D model from Georadar surveys using two different procedures in the MatLab environment. The first procedure involved an interpolation of the various vectorizations of the one-dimensional results in order to obtain a single surface and assign this surface a thickness. The second procedure foresaw the use of back scattering to change the spatiotemporal domains, allowing for 3D model reconstruction by retrieving information.
In relation to the first methodology, the data were loaded into the workspace as matrix elements with a variable number of columns based on the depth of the scan itself.
Next, we processed the raw signal, and retrieved the radargram images (with a variable name), allowing for their visualization, to evaluate the type of processing that would be performed on the dataset.
The transition from these data to a three-dimensional model in the MatLab environment was made possible by interpolating the data obtained in the two-dimensional models through a triangular mesh; from the latter, it was possible to obtain the three-dimensional model.
To obtain this three-dimensional model from the two-dimensional data provided by the GPR, we performed two-dimensional data processing in the three main directions: X, Y and Z. From this processing, once signal threshold values were defined to consider only the object of interest, we created the three-dimensional mesh and 3D rendering of the object.
In detail, the “plotting” of the 3D models from the MatLab tool that allowed us to create the 3D model from radargrams was carried out according to the following steps:
  • Single radargram processing along x and representative curve extraction of the identified object;
  • Single radargram processing along y and representative curve extraction of the identified object;
  • Insertion of curves in 3D space;
  • Creation of an interpolation surface of the different curves;
  • Creation of an STL file.
Table 2 shows the commented code string used to create the STL file:
The results obtained from the above methodology are shown in Figure 8.
The type of reconstructed surface recalls that of a straight semi-cylinder, without any imperfections, which casts doubt on the accuracy of the result, and, therefore, on the presence of some objects.
In relation to the second methodology, the output radargrams of the migration process were used as input to back-scattering (BS) codes, produced in a MatLab environment that allows for a raw reconstruction of the buried object with a different dielectric constant to subsoil. The BS codes change the domain from time to frequency, which allowed for the retrieval of the necessary information to reconstruct the 3D model to be obtained, which the radargram does not permit at present. In general, the study of the signal, or processing, on MatLab, can be developed through a series of operations, as shown in Figure 9 with the following flowchart.
In our case, we created a cell-type element, a structure that allowed for data grouping, combining all scans into a single variable. Each scan was saved as a matrix with a predetermined number of lines and columns based on the scan’s length. Initially, 1D and 2D techniques were used to process the radar data. The time-band maps were created using the average (or square) amplitude of the radar signal over 6 t (theoretical time for electromagnetic wave reflection at a given depth) time windows. The previous spatial average helped reduce small-scale heterogeneity noise. Finally, the data were interpolated and cross-linked on a regular mesh. The parameters involved, particularly the bandwidth of 6 t, were carefully chosen. Although a dominant period width is required, different widths can be used to improve specific traits. The usual practice uses non-overlapping time windows. A higher resolution was obtained using continuous time windows. This resulted in radar traces, which were represented as continuous lines with stacked horizontal waves. These files were created by stacking two-dimensional (2D) horizontal search windows around a volume cell. After processing all data files, the final volume cell value was calculated as the average of all input values. More traces represent the first feedback of the result and form the basis for subsequent modelling. The plot 3 statement does not allow for a surface graph of the real functions of two real variables, because plot 3 only draws lines.
To sketch surfaces, create 3D perspectives, view these from different positions and rotate them, we carried out the process described in Table 3.
Therefore, the approach used to display 3D radar data can be summarized as follows:
  • Extraction of the most important complex signal attributes;
  • Two-dimensional elaboration in the different directions of the areas of interest;
  • Choice of threshold value;
  • Three-dimensional rendering of the alleged target.
Figure 10 shows the result of 3D processing, in relation to the study case, according to the previous methodology. The result shown is the best among all those elaborated at present; this emphasizes that the 3D reconstruction from Georadar does not provide well-defined 3D edges, but only raw reconstructions of the dimensions of the identified buried object, due to the heightened variability of the dielectric constant as a humidity function. In fact, to obtain this reconstruction, we employed the εr contrast, the one known to be situated in the ground, and the other buried objects, which are unknown.
The results obtained by applying the methodology described above are shown in the figure.
Differing from that obtained by Methodology 1, as shown in Figure 8, the surface is not perfectly homogeneous, and even though it suggests the actual presence of a crypt, it does not allow for a good metric quality.

2.2. 3D Merge

To allow for an understanding of the cultural heritage structure (visible and buried part) and its function as a whole (which is important from an archaeological perspective), the 3D information from laser scanner/photogrammetry and GPR information were integrated.
In this regard, it was necessary to ascertain how to merge the three 3D models. Different from the 3D models obtained from laser scanner and photogrammetry derived from a point cloud, the 3D obtained from GPR does not directly derive from a point cloud because it was built using a MatLab environment.
There were no problems in merging the files (point clouds) obtained from photogrammetry and laser scanning, because they use common formats and similar survey logics (Figure 11).
The problems arose when we wanted to merge the 3D model that we obtained from the GPR on MatLab, because the point clouds (obtained from photogrammetry and laser scanning) could not be directly integrated with the 3D GPR model and, moreover, there are no coordinates on the model built in MATLAB that allow for the correct positioning in the space compared to that detected using other methodologies.
To solve this problem, we exported the GPR model built in MATLAB, assigned a fictitious thickness and then generated a real fictitious 3D surface that was exportable as an .stl file for use on other software, although without reference coordinates. This residual problem was resolved through the realization of a gridded mesh that could easily identify the points in common between the position of the two models.
This reference system allowed us, when we overlapped the two 3D models, to be sure that the virtual overlap that we created within the software could be considered to correspond to the overlap in the survey site, that is, the real one.
We were, therefore, able to make a three-dimensional rendering that corresponded to reality not only in visual terms (we could observe exactly what was above and what was under the ground level), but also in physical terms. In fact, the distance measured between two points within the digital model exactly corresponds, allowing for errors due to the instrumentation and technology used, to the distance measured on-site.
We underline the importance of the integrated visualization from an archaeological and architectural perspective to obtain an understanding of the structure.
In Figure 12 and Figure 13, we can see the external 3D integration from UAV with 3D GPR built using methodology 1 and methodology 2.
The 3D model in Figure 12, made with integration methodology 1, is smooth but not extremely representative of the real state.
The 3D model in Figure 13, realized using methodology 2, has too much “noise” and is not extremely representative of the real state. Therefore, it appears to be convenient and preferable to realize the integration in virtual reality (VR), which ensures a more expedited reconstruction with the same level of precision.
Since this integration is not easy to directly obtain and, in any case, is not accurate, we proceeded to the direct integration of models (3D laser scanner/UAV and 3D GPR) in VR, using, in the visualization phase, an app designed for tourism purposes for the use of archaeological heritage, as properly developed and described in the following paragraph.
Figure 14 shows the integration of the internal 3D model, built by laser scanner with 3D Georadar using methodology 2, into virtual technology.
This does not demonstrate a considerable change, but the described procedure is quick and graphically improved.

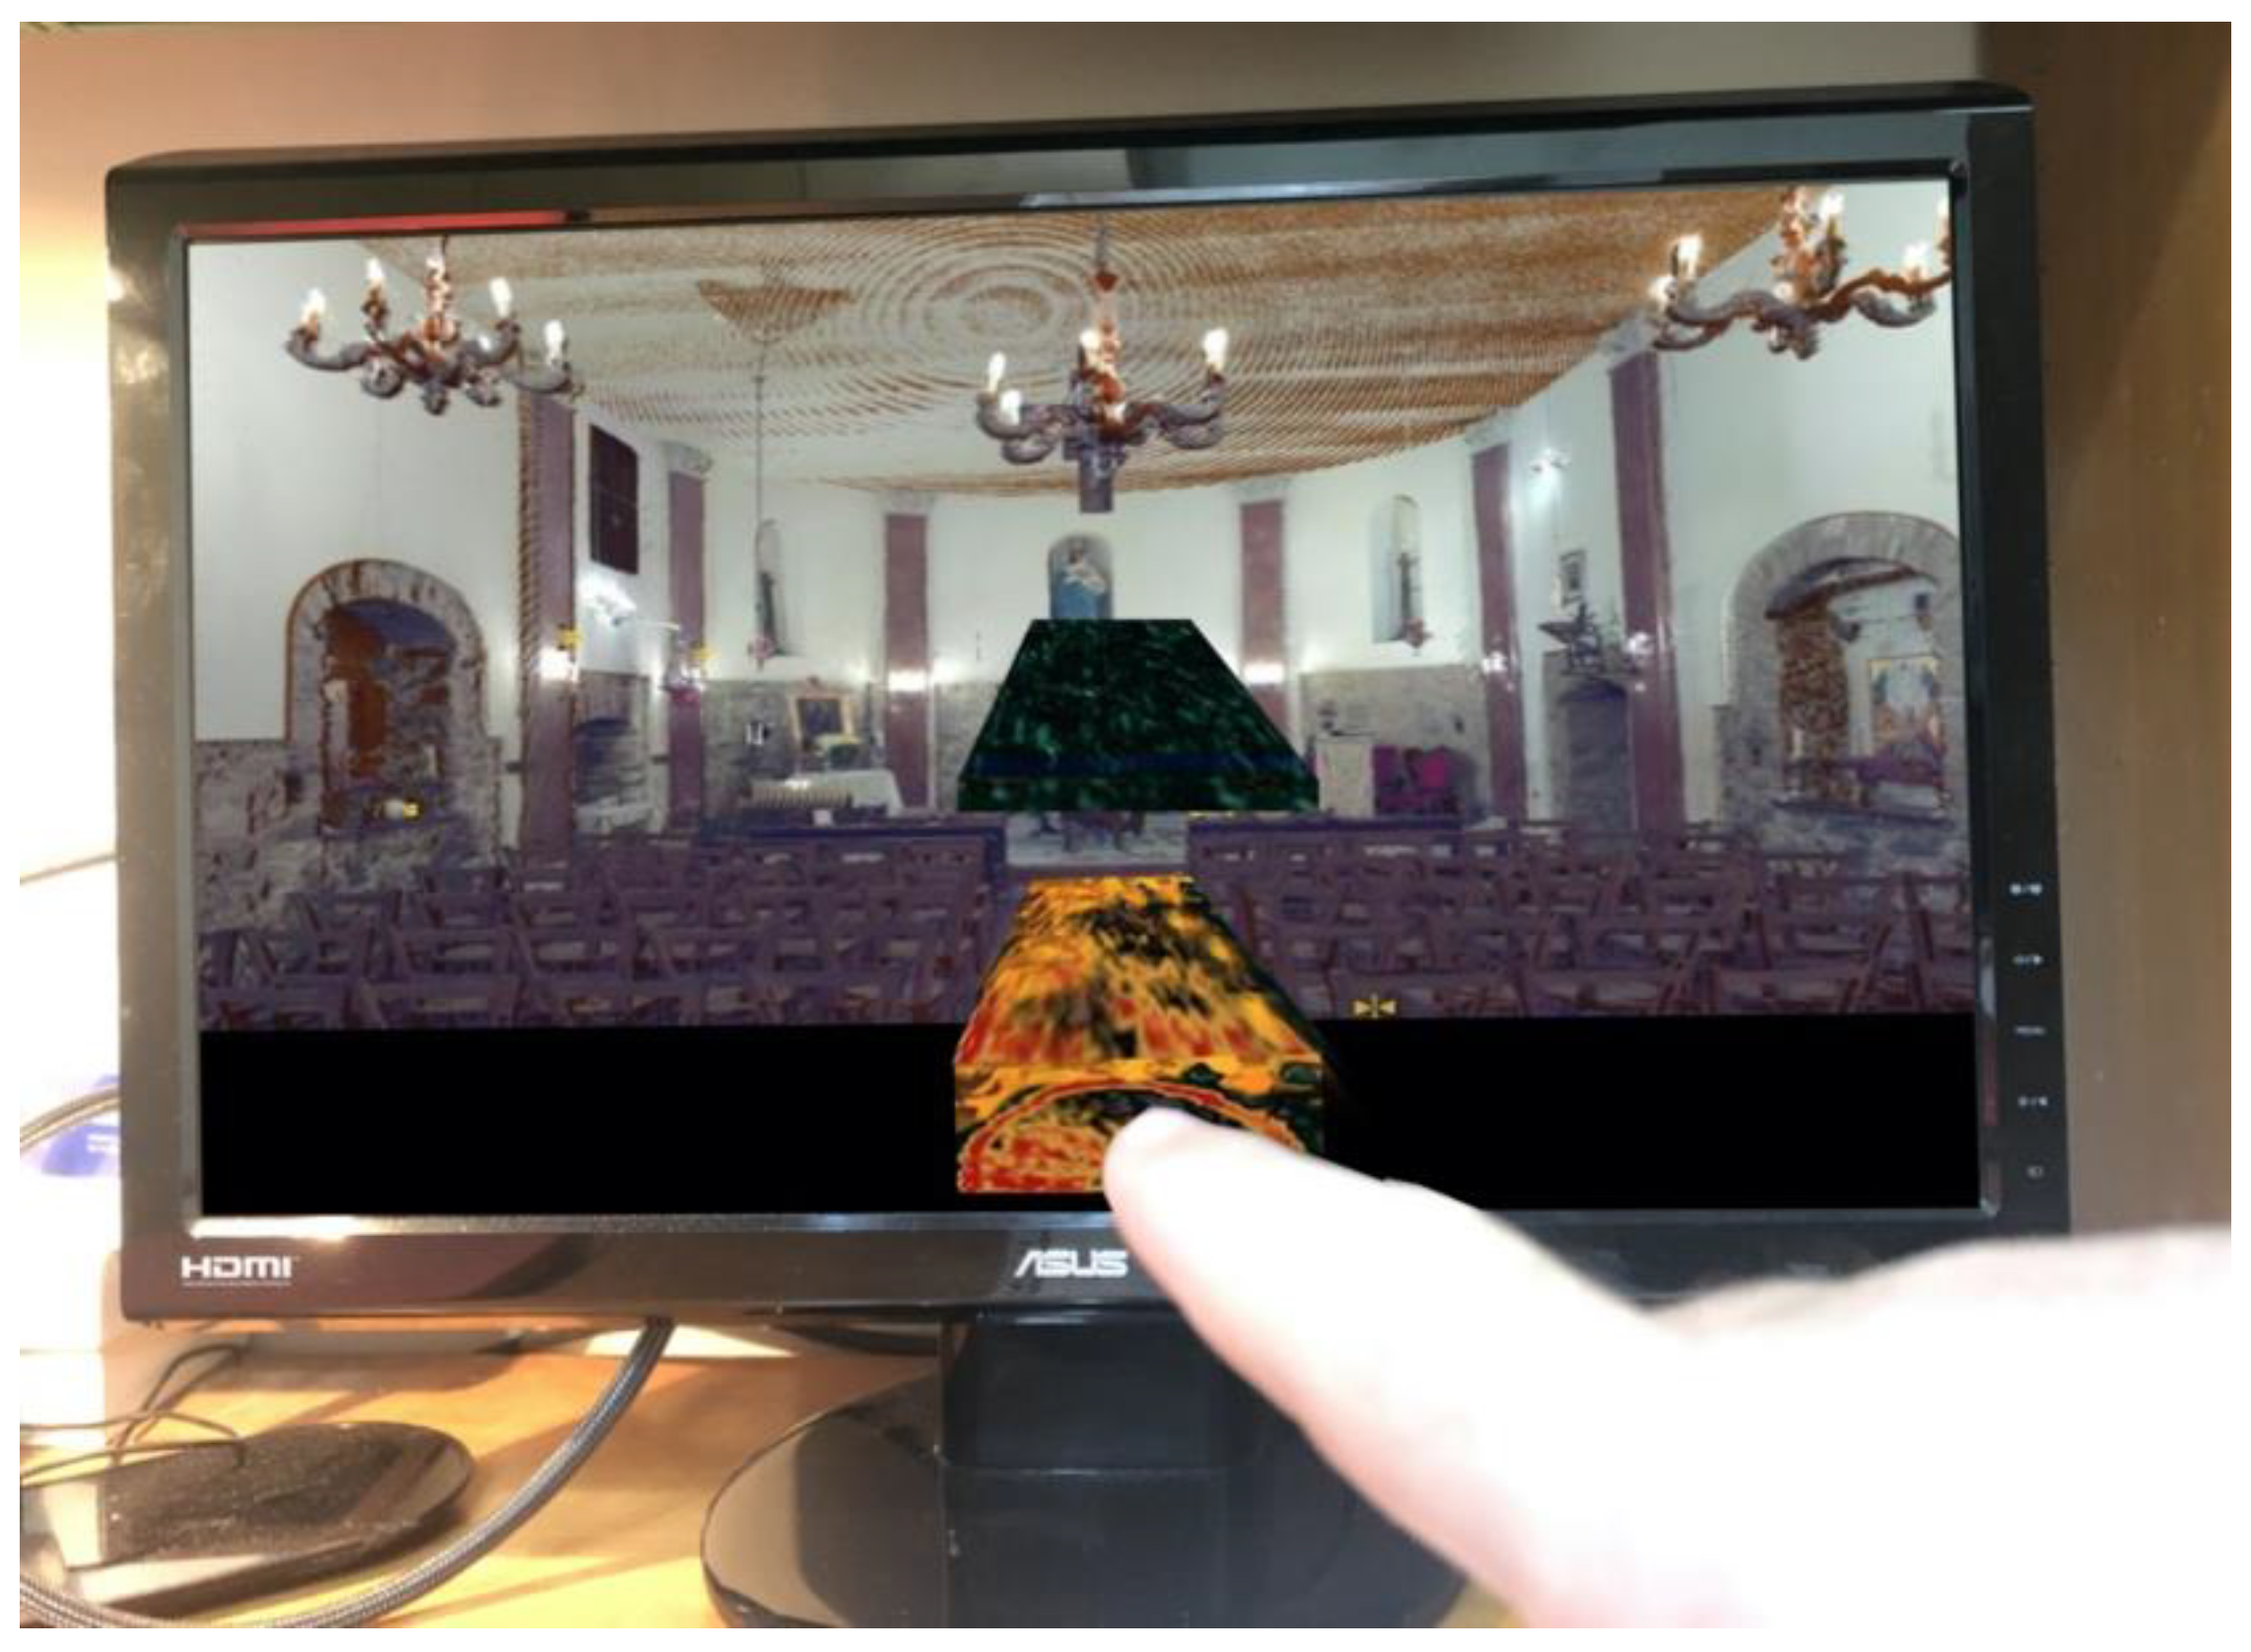
3. The Developed App

We used the realistic and metrically accurate three-dimensional model obtained from laser scanning and photogrammetry, integrated with the model obtained from GPR, to create an app that allows for the end user to obtain an overview of the church and the crypt for any maintenance and restoration interventions, as well as for purely recreational purposes.
This last aspect, thanks to the integration with virtual reality and mixed reality, allows for new and more modern methods of interaction with the building and, therefore, a better and broader understanding of its historical heritage.
By using AR, we can observe the structural details, such as a column or sculpture, and a series of information can be displayed on the screen of the device. With this information, an understanding of the building’s history can be obtained through texts, videos or any other digital element useful for this purpose.
VR is generally used for museum tours. However, the app also has potential for use outside of museum tours, because the integration of ‘real’ 3D with the presence of a 3D underground is easier to see in AR. Moreover, the app also allows for tours of the church.
This app was developed in the Unity 3D environment, which is a cross-platform tool used to create interactive 3D content, such as architectural views, real-time 3D animations, videos and other multimedia content.
The programming work in Unity is based on the use of “objects”: the so-called “GameObjects”. These elements, which may or may not have a graphical representation, can be associated with a script, which allows for their event functions to be defined.
Operationally, the app is structured through a succession of scenes managed by the SceneManager and SceneLoader. Within each scene, there are elements that, in this development environment, are called GameObjects.
At present the app uses AR to a level that we could call “Basic”, as it allows for access to information using GPS coordinates and QR codes.
Virtual information and real images are key components of any augmented reality system. This artificial vision-based process aims to unify the two considered reference systems: the virtual and the real.
Certain content is then offered based on the user’s location in space, in this case, leveraging GPS coordinates to display some visual information on the screen, such as texts, images, etc.
This can also be performed by scanning the QR code, which is a link to a digital asset, to access video tracks or other metadata to deepen the history of the work.
Using markerless tracking in the study area (interaction between the device’s GPS coordinates and the study area’s actual coordinates), the app can simulate GPR surveys using GPS and the device’s camera. A notification is displayed on the screen when the device’s GPS coordinates are within the study area, while the cameras simulate the geo-radar scan, showing the results and starting a scene that allows for the user to virtually visit the inaccessible “crypt”.
In addition, using GPS coordinates when the user is in a specific location in space offers him the opportunity, using motion tracking, to start a scene that allows him to virtually visit the part of the structure that was detected by the GPR, which is inaccessible at present.
Although this app is still in the development phase, its features can be described by the following flowchart (Figure 15).
To create the app, the use of Vuforia, which is a library of Qualcomm’s AR SDK software for game/app development and is perfectly integrated into the Unity environment, can be made. This library provides a quick and accurate image tracking that allows one to overlay virtual content with images of the surrounding world in a simple and realistic way.
In practice, through the use of these tools (Unity 3D and Vuforia), it was possible to create an app in AR that meets the needs of a large and diverse audience, such as the one that is potentially interested in visiting the Church of Pepe using AR (Figure 16).
Finally, starting from the methodology used for the construction of 3D elements and virtual reality, we carried out a first experimentation of mixed reality using Microsoft HoloLens for the interaction between the real world and virtual reality.
This allows one immerse oneself in the virtual world and interact with it.
Therefore, MR is used for many applications. Here, we built it to allow for the integration of, and interaction between, the two 3D models.
There are many standalone Head-Mounted Displays (HMDs). HoloLens, Magic Leap and Meta 2 are just a few popular MxR displays. Other (less expensive) options include Mira and Holoboard, which process and display data on a phone (and are still in development).
Microsoft HoloLens (in Figure 17) is a transparent Head-Mounted Display (HMD) designed for MR/AR experiences. This device can be controlled by voice, gestures and gaze. Head-tracking and other gaze commands allow for the user to focus the application on their perception.
Multiple interactions with the interface or virtual object can be supported using “pinch”, “air tap” and “bloom”. Touching the air selects any virtual object or button, just like clicking a mouse. “Touch” and “pinch” can also be used to drag and move all the virtual objects. A “bloom” gesture opens the interface/shell. Actions can be triggered by voice commands.
HoloLens are used for different application areas. However, they are rarely used in the field of cultural heritage.
Below, we outline the main steps for their deployment in HoloLens 3D models to experience mixed reality.
The open-source game engine Unity 3D (or Unity) is very popular. Due to Unity’s popularity, most AR/VR headsets use it as a development platform. Therefore, HoloLens uses Unity to create AR/MR experiences.
Setting up the Unity development platform is the first step in converting 3D models to HoloLens. This can be conducted in two ways. The first is to use Unity’s standard configuration.
The second way (used in this article) is by using the Mixed Reality Toolkit, a Unity package containing a collection of custom tools developed by the Microsoft HoloLens team to help develop and deploy MxR/AR experiences on a HoloLens device. The Mixed Reality Toolkit was used.
We downloaded the Mixed Reality Toolkit from the Microsoft HoloLens GitHub repository, importing it within a Unity project as a resource pack. After importing this Toolkit, the project environment was configured twice. First, the “Project Settings” was changed using the “Apply Mixed Reality Project Settings” command from the menu bar in the Mixed Reality Toolkit. This option configures Unity project-wide. One needs to be sure that the “Universal Windows Platform Settings” are checked and that the “Virtual Reality Supported” box from the XR settings list is verified. This configuration contains the script backend, rendering quality, and player options. Every setting in this Unity project was applied to the current “created scene”.
The second configuration level affects a scene created “as part of a project”. This was carried out using the Mixed Reality Toolkit’s “Apply Mixed Reality Scene Settings” option.
The toolkit was used to configure the scene-level camera position, add the custom HoloLens camera, and render the settings. The generated 3D model was then imported into the Unity project using the platform asset import option. Finally, the 3D model was enhanced with gesture interactivity, allowing for users to interact and manipulate it using HoloLens-recognized gestures. The Mixed Reality Toolkit includes scripts and tools to enhance the MxR experience. The toolkit enabled gesture- and gaze-based interaction.
Unity can make projects for various platforms. In this case, the project was created for a Universal Windows Platform (UWP). UWP is a Microsoft open-source API introduced in Windows 10. This platform helps developers create universal apps that work on Windows 10, Windows 10 Mobile, Xbox One and HoloLens without having to code for each device. Therefore, a single build can target multiple devices. Before starting the UWP project, a scene should be added to the “Integrated Settings”, C# debugging should be enabled, and HoloLens selected as the target device.
Figure 16 depicts the built environment and construction phases for UW. First, “Build Settings” should be selected from the menu; then, “Add Open Scenes” and the scenes that are to be distributed should be selected. “Universal Windows Platform” should be selected as the Platform, then “Target Device” as the HoloLens. Next, “Unity C # Projects” should be selected to enable C # debugging and “Build” clicked. At this stage, all files (including *.sln) required for HoloLens deployment are created and stored in the user-specified location.
The previous “Building with UWP” step’s *.sln file is imported for debugging into Visual Studio and use in HoloLens. The deployment process can be started using the Debug menu on the HoloLens.
To open the *.sln file, the HoloLens must be connected via USB. Under the “Debug”, “Start without debugging” should be selected. Input and output details will follow. A 1 distribution and 0 failure should be achieved. Once uploaded, HoloLens will run the app.
After streaming an app on HoloLens, a user can connect the device to a larger screen via Wi-Fi to share the experience with others. We used mixed-reality capture to stream the HoloLens user experience (shown in Figure 16). The actual experience and the content streaming to the other person’s screen differ slightly. Specifically, in our application case, as in Figure 18, we can see how the sensors contained within Microsoft Hololens recognized hands movements and allowed for the user to interact with the virtual world that had been created. The user could then remove elements of the building, such as the floor, with his fingers, and examine rooms or hidden elements that he cannot personally visit, such as the crypt. In addition, people who are not wearing the headset can share the user experience thanks to the ability to view their experience on a monitor connected to the same Wifi network.
In this other image, we can see the user interacting with and exploring the various architectural parts of the BIM model with his fingers, and sharing his experience with other viewers through an external monitor (Figure 19).

4. Conclusions

Thanks to the use of the described tools, the study of architectural and cultural assets can be approached in an incredibly precise, rapid way, without the risk of damaging the asset.
In addition, with the use of laser scanning and photogrammetry, we can obtain a realistic and metrically accurate three-dimensional model, which can be integrated with models from other methodologies, such as GPR. The set of models allows for the end user to obtain a comprehensive view of the asset to be explored, for purely recreational purposes and for any maintenance and restoration operations.
In fact, the possibility of obtaining a single 3D model that can be transferred within BIM environments and used in anticipation of future restorations or interventions on the structure ensures that it will always, thanks to the monitoring activity that was previously conducted, be faithful to the original work.
From a tourist’s point of view, it will be possible to keep the whole community informed of the cultural and historical value of a work that is present in the territory, enhancing it through applications that make use of AR or allow for a three-dimensional model to be viewed and studied through smartphone apps.
Mixed Reality (MR) combines the real with the virtual world. It offers an immersive and interactive experience when interacting with the real/virtual world. Thanks to this new methodology, the user will be able to make gestures by imitating the click of a mouse and interact with the real and virtual world, opening new ways of experiencing cultural heritage.
The use of GPR can reveal light structures, works or parts that have been buried by time. The appropriate processing of data can also be used to create three-dimensional models, such as those obtained with laser scanning and photogrammetry, which can be presented to a wider audience through use of apps and other software.
The work presented here receives its scientific utility by providing a method for integrating the 3D model obtained above with different technologies using the 3D model shown below, obtained by GPR. From a practical point of view, the use of VR and MR facilitates visitor enjoyment.
In conclusion, the integration of all these techniques, which is achievable, as shown, with different methodologies that each have their advantages and disadvantages, allows for a better and broader understanding of historical heritage, not only by scholars but also by citizens or tourists who want to become familiar with the various features.

Author Contributions

Conceptualization, V.B., E.B. and G.B.; methodology, V.B. and E.B.; software, V.B., A.F. and G.B.; validation, V.B. and G.B.; formal analysis, E.B. and G.B.; investigation, E.B. and G.B.; resources, V.B., A.F., E.B. and G.B.; data curation, E.B. and G.B.; writing—original draft preparation, V.B. and E.B.; writing—review and editing, E.B. and G.B.; visualization, E.B. and G.B.; supervision, V.B. and G.B.; project administration, V.B., E.B. and G.B.; funding acquisition, V.B., A.F., E.B. and G.B. All authors have read and agreed to the published version of the manuscript.

Funding

This research received no external funding.

Institutional Review Board Statement

Not applicable.

Informed Consent Statement

Not applicable.

Data Availability Statement

Not applicable.

Conflicts of Interest

The authors declare no conflict of interest.

References

  1. Akca, D.; Gruen, A. Generalized Least Squares Multiple 3D Surface Matching; ISPRS WS Laser Scanning [cd rom]; Part 3/W52; IAPRS: Espoo, Finland, 2007; Volume 36, pp. 1–7. [Google Scholar]
  2. Ahmadabadian, A.H.; Robson, S.; Boehm, J.; Shortis, M.; Wenzel, K.; Fritsch, D. A comparison of dense matching algorithms for scaled surface reconstruction using stereo camera rigs. ISPRS J. Photogramm. Remote Sens. 2013, 78, 157–167. [Google Scholar] [CrossRef]
  3. Baltsavias, E.; Gruen, A.; Zhang, L.; Waser, L.T. High-quality image matching and automated generation of 3D tree models. Int. J. Remote Sens. 2008, 29, 1243–1259. [Google Scholar] [CrossRef]
  4. Barazzetti, L.; Remondino, F.; Scaioni, M. Orientation and 3D modelling from markerless terrestrial images: Combining accuracy with automation. Photogramm. Rec. 2010, 25, 356–381. [Google Scholar] [CrossRef]
  5. Bolognesi, M.; Furini, A.; Russo, V.; Pellegrinelli, A.; Russo, P. Accuracy of cultural heritage 3D models by RPAS and terrestrial photogrammetry, The International Archives of the Photogrammetry. Remote Sens. Spat. Inf. Sci. 2014, 5, 113–119. [Google Scholar]
  6. Büyüksalih, G.; Li, Z. Practical experiences with automatic aerial triangulation using different software packages. Photogramm. Rec. 2005, 18, 131–155. [Google Scholar] [CrossRef]
  7. Costa, E.; Balletti, C.; Beltrame, C.; Guerra, F.; Vernier, P. Digital Survey Techniques for the Documentation of Wooden Shipwrecks. ISPRS Annals of the Photogrammetry. Remote Sens. Spat. Inf. Sci. 2016, 41, 237–242. [Google Scholar] [CrossRef] [Green Version]
  8. Cuca, B.; Brumana, R.; Scaioni, M.; Oreni, D. Spatial data management of temporal map series for cultural and environmental heritage. Int. J. Spat. Data Infrastruct. Res. 2011, 6, 97–125. [Google Scholar]
  9. Ali, S.; Scovanner, P.; Shah, M. A 3-Dimensional SIFT descriptor and its application to action recognition. In Proceedings of the 15th International Conference on Multimedia, Augsburg, Germany, 25–29 September 2007; pp. 357–360. [Google Scholar] [CrossRef]
  10. Eltner, A.; Schneider, D. Analysis of Different Methods for 3D Reconstruction of Natural Surfaces from Parallel—Axes UAV Images. Photogramm. Rec. 2015, 30, 279–299. [Google Scholar] [CrossRef]
  11. Fonstad, M.A.; Dietrich, J.F.; Courville, B.C.; Jensen, J.L.; Carbonneau, P.E. Topographic structure from motion: A new development in Photogrammetric measurement. Eart. Surf. Process. Landf. 2013, 38, 421–430. [Google Scholar] [CrossRef] [Green Version]
  12. Grinzato, E.; Bressan, C.; Marinetti, S.; Bison, P.G.; Bonacina, C. Monitoring of the Scrovegni Chapel by IR thermography: Giotto at infrared. Elsevier Sci. Infrared Phys. Technol. 2002, 43, 165–169. [Google Scholar] [CrossRef]
  13. Haala, N.; Hastedt, H.; Wolf, K.; Ressl, C.; Baltrusch, S. Digital photogrammetric camera evaluation, generation of digital elevation models. Photogramm. Fernerkund. Geoinf. 2010, 2, 99–115. [Google Scholar] [CrossRef] [Green Version]
  14. Heipke, C. Automation of interior, relative, and absolute orientation. ISPRS J. Photogramm. Remote Sens. 1997, 52, 1–19. [Google Scholar] [CrossRef]
  15. Kalantari, M.; Kassera, M. Implementation of a low-cost photogrammetric methodology for 3D modelling of ceramic fragments. In Proceedings of the XXI International CIPA Symposium, Athens, Greece, 1–6 October 2004. ISSN 16821750. [Google Scholar]
  16. Kraus, K. Photogrammetry–Geometry from Images and Laser Scans; Walter de Gruyter: Berlin, Germany, 2007. [Google Scholar]
  17. Naranjo, J.A.B.; Torres da Motta, J.M.S. Registro e alinhamento de imagens de profundidade obtidas com digitalizador para o modelamento de objetos com análise experimental do algoritmo ICP. ABCM Symp. Ser. Mechatron. 2014, 6, 1355–1364. [Google Scholar]
  18. Khalloufi, H.; Azough, A.; Ennahnahi, N.; Kaghat, F.Z. Low-cost terrestrial photogrammetry for 3d modeling of historic sites: A case study of the marinids’ royal necropolis city of fez, Morocco. Mediterr. Archaeol. Archaeom. 2020, 20, 257–272. [Google Scholar] [CrossRef]
  19. Hatzopoulos, J.N.; Stefanakis, D.; Georgopoulos, A.; Tapinaki, S.; Pantelis, V.; Liritzis, I. Use of various surveying technologies to 3d digital mapping and modelling of cultural heritage structures for maintenance and restoration purposes: The tholos in delphi, Greece. Mediterr. Archaeol. Archaeom. 2017, 17, 311–336. [Google Scholar] [CrossRef]
  20. Pollefeys, M.; Van Gool, L.; Vergauwen, M.; Cornelis, K.; Verbiest, F.; Tops, J. Image-based 3D acquisition of archaeological heritage and applications. In Proceedings of the 2001 Conference on Virtual Reality, Archeology, and Cultural Heritage, Glyfada, Greece, 28–30 November 2001; pp. 255–262, ISBN 1581134479. [Google Scholar]
  21. Pozzoli, A.; Mussio, L. Quickly solutions particularly in close range photogrammetry. Int. Arch. Photogramm. Remote Sens. 2003, 34, 273–278. [Google Scholar]
  22. Remondino, F.; Menna, F. Image-based surface measurement for close-range heritage documentation. Int. Arch. Photogramm. Remote Sens. Spat. Inf. Sci. 2008, 37, 199–206. [Google Scholar]
  23. Rinaudo, F.; Bornaz, L.; Ardissone, P. 3D high accuracy survey and modelling for Cultural Heritage Documentation and Restoration. In Proceedings of the Vast 2007–Future Technologies to Empower Heritage Professionals, Brighton, UK, 26–29 November 2007; Archaeolingua: Budapest, Hungary, 2007; pp. 19–23. [Google Scholar]
  24. Rusinkiewicz, S.; Levoy, M. Efficient Variants of the ICP Algorithm. In Proceedings of the Third International Conference on 3D Digital Imaging and Modeling, Quebec City, QU, Canada, 28 May–1 June 2001; pp. 145–152. [Google Scholar]
  25. Barrile, V.; Fotia, A.; Candela, G.; Bernardo, E. Geomatics techniques for cultural heritage dissemination in augmented reality: Bronzi di riace case study. Heritage 2019, 2, 2243–2254. [Google Scholar] [CrossRef] [Green Version]
  26. Barrile, V.; Bernardo, E.; Bilotta, G. An experimental HBIM processing: Innovative tool for 3D model reconstruction of morpho-typological phases for the cultural heritage. Remote Sens. 2022, 14, 1288. [Google Scholar] [CrossRef]
  27. Barrile, V.; Fotia, A.; Bernardo, E.; Candela, G. Geomatics techniques for submerged heritage: A mobile app for tourism. WSEAS Trans. Environ. Dev. 2020, 16, 586–597. [Google Scholar] [CrossRef]
  28. Barrile, V.; Fotia, A.; Ponterio, R.; Mollica Nardo, V.; Giuffrida, D.; Mastelloni, M.A. A combined study of art works preserved in the archaeological museums: 3D survey, spectroscopic approach and augmented reality. Int. Arch. Photogramm. Remote Sens. Spat. Inf. Sci. 2019, 42, 201–207. [Google Scholar] [CrossRef] [Green Version]
  29. Barrile, V.; Bernardo, E.; Bilotta, G.; Fotia, A. Bronzi di Riace Geomatics Techniques in Augmented Reality for Cultural Heritage Dissemination. In Geomatics and Geospatial Technologies; ASITA 2021, Communications in Computer and Information Science; Borgogno-Mondino, E., Zamperlin, P., Eds.; Springer International Publishing: Cham, Switzerland, 2021; Volume 1507, pp. 195–215. [Google Scholar] [CrossRef]
  30. Barrile, V.; Fotia, A. A proposal of a 3D segmentation tool for HBIM management. Appl. Geomat. 2022, 14, 197–209. [Google Scholar] [CrossRef]
  31. Psarros, D.; Stamatopoulos, M.I.; Anagnostopoulos, C.N. Information technology and archaeological excavations: A brief overview. Sci. Cult. 2022, 8, 147–167. [Google Scholar] [CrossRef]
  32. Alexakis, E.; Lampropoulos, K.; Doulamis, N.; Doulamis, A.; Moropoulou, A. Deep Learning approach for the identification of structural layers in historic monuments from ground penetrating radar images. Sci. Cult. 2022, 8, 95–107. [Google Scholar] [CrossRef]
  33. Liritzis, I.; Laskaris, N.; Vafiadou, A.; Karapanagiotis, I.; Volonakis, P.; Papageorgopoulou, C.; Bratitsi, M. Archaeometry: An overview. Sci. Cult. 2020, 6, 49–98. [Google Scholar] [CrossRef]
Figure 1. Photo of the study area: church of the Madonna dei Poveri (chiesa Pepe)-RC.
Heritage 05 00080 g001
Figure 2. Acquisition system used.
Heritage 05 00080 g002
Figure 3. Flight plan.
Heritage 05 00080 g003
Figure 4. 3D Model by UAV.
Heritage 05 00080 g004
Figure 5. 3D model by laser scanner.
Heritage 05 00080 g005
Figure 6. GPR survey area shows a time slice, referring to an investigation depth of about 75 cm; the anomalies (that identify the underground structures) are represented in yellow.
Heritage 05 00080 g006
Figure 7. B-scan raw profile (GPR) and B-scan, focused using the Diffraction Summation algorithm.
Heritage 05 00080 g007
Figure 8. View of a crypt surface generated by MatLab and its model in STL from Georadar survey (methodology 1).
Heritage 05 00080 g008
Figure 9. Flowchart of the operations.
Heritage 05 00080 g009
Figure 10. View of a crypt surface generated by MatLab and its model in STL from Georadar survey (methodology 2).
Heritage 05 00080 g010
Figure 11. A screenshot of the “tour” between the two-point clouds in Autodesk recap.
Heritage 05 00080 g011
Figure 12. External 3D integration from UAV with 3D GPR built with methodology 1: (a) frontal view; (b) axonometric view.
Heritage 05 00080 g012
Figure 13. External 3D integration from UAV with 3D GPR built with methodology 2: (a) frontal view; (b) axonometric view.
Heritage 05 00080 g013
Figure 14. Integration of the internal 3D model, built by laser scanner with 3D Georadar with methodology 2, into virtual technology.
Heritage 05 00080 g014
Figure 15. Flow chart touristic app.
Heritage 05 00080 g015
Figure 16. View of the app.
Heritage 05 00080 g016
Figure 17. Microsoft HoloLens.
Heritage 05 00080 g017
Figure 18. HoloLens user experience.
Heritage 05 00080 g018
Figure 19. HoloLens user experience.
Heritage 05 00080 g019
Table 1. Comparison of accuracy between photogrammetric and laser scanner methods of producing 3D models.
ElementReal MeasurementPhotogrammetry 3D Model MeasurementTLS 3D Model Measurement
External door 1 width8485.284
External door 1 height (z)240240.9240.5
Window6060.460
Window height606162
Table 2. Codes used to create the STL file.
Stlwrite (FILE, FACES, VERTICES)Takes Faces and Vertices Separately, Rather Than in an FV Structure
stlwrite (FILE, X, Y, Z)Creates an STL file from surface data in X, Y and Z
stlwriteTriangulates these gridded data into a triangulated surface using triangulation options, as specified below. X, Y and Z can be two-dimensional arrays with the same size. If X and Y are vectors with a length equal to SIZE(Z,2) and SIZE(Z,1), respectively, they are passed through MESHGRID to create gridded data. If X or Y are scalar values, they are used to specify the X and Y spacing between grid points.
Stlwrite (..., ’PropertyName’, VALUE, ’PropetyName’, VALUE,...)Writes an STL file using the following property values:
  • MODE: file is written using ‘binary’ (default) or ‘ascii’;
  • TITLE: header text (max 80 chars) written to the STL file;
  • TRIANGULATION: When used with gridded data, TRIANGULATION is either:
‘delaunay’: (default) Delaunay triangulation of X, Y;
‘f’: forward-slash division of grid quads;
‘b’: back-slash division of quadrilaterals;
‘x’: cross-division of quadrilaterals;
Note that ‘f’, ‘b’ or ‘t’ triangulations now use an inbuilt version of FEX entry 28327, “mesh2tri”;
FACECOLOR: Single colour (1-by-3) or one-colour-per-face (N-by-3);
Vector of RGB colours, for face/vertex input. RGB range is 5 bits (0:31), stored in VisCAM/SolidView format.
Table 3. Operational steps.
- To draw the surface, we used “mesh” and “surf” instructions.
- By first constructing matrices for node coordinates on which to evaluate the function z = f(x,y) on the rectangle [a,b] × [c,d], we obtained:
>> [x,y] = meshgrid(a:stepx:b,c:stepy:d) (it builds the matrices x and y, where x is equal to [a:stepx:b] and y is equal to [c:stepy:d]).
- Then, the heights matrix z_ij = f(x_i,y_j) was calculated.
>> z = f(x,y);
- For the 3D-perspective plot of the Z values, we used the mesh command.
>> mesh (x,y,z)
- To see the surface from another angle, we used the function
>> view (angle, elevation), where angle represents the angle between the y-axis and the point of view measured on the x–y coordinate plane, and elevation is the angle between the x–y coordinate plane and the point of view).
- To interactively rotate the surface on the current window using the mouse, we used
“rotate3d on” command (Sigurdsson and Overgaard, 1998).
Publisher’s Note: MDPI stays neutral with regard to jurisdictional claims in published maps and institutional affiliations.

