Exposure to High-Frequency Sound and Ultrasound in Public Places: Examples from Zurich, Switzerland

Scholkmann Data Analysis Services, Scientific Consulting and Physical Engineering, Stapferstrasse 8, 8006 Zurich, Switzerland
Acoustics 2019, 1(4), 816-824; https://0-doi-org.brum.beds.ac.uk/10.3390/acoustics1040048
Submission received: 5 August 2019
/
Revised: 9 October 2019
/
Accepted: 16 October 2019
/
Published: 18 October 2019
(This article belongs to the Special Issue Room Acoustics)
Abstract
:The public is unknowingly exposed to very high-frequency sound (VHFS; 11.2–17.8 kHz) and ultrasound (US; >17.8 kHz) signals in air in public places, as evidenced by previously published reports. The present report provides evidence for the presence of VHFS/US signals in the air at public places in Zurich, Switzerland. The analysis of the signals measured revealed that they: (i) contain one, two or multiple frequencies; (ii) comprise frequencies ranged from 15.5 kHz to 36.0 kHz; (iii) were either quasi constant in their amplitude or exhibit a clear amplitude modulation; and (iv) were in their characteristics (frequencies, modulation, intensity) specific for each place. Based on the signal characteristic it is likely that the signals are generated by public-address voice-alarm (PAVA) systems. The work presented: (i) documents the presence of VHFS/US signals at public places in Zurich, possibly caused by PAVA systems; and should (ii) show that is easily possibly to measure the signals with an affordable measurement equipment as a “citizen scientist”, and stimulate others also to measure and analyse VHFS/US signals with this citizen scientist approach in other cities worldwide. Due to the possible negative health-related effects of a human exposure to VHFS/US signals, further research is needed to document VHFS/US signals at public places and to evaluate biological effects of this exposure with laboratory studies.
1. Introduction
Several reports published in the last couple of years provided evidence that the public is unknowingly exposed to very high-frequency sound (VHFS; 11.2–17.8 kHz) and ultrasound (US; >17.8 kHz) signals in air in public places [1,2] (the lower limit for the ultrasonic bands being 17.8 kHz because, as Leighton [3,4] points out, guidelines set for decades at 20 kHz actually apply throughout the third octave bands that is centered on 17.8 kHz). Sources of these VHFS/US signals are mainly public-address voice-alarm (PAVA) systems and pest deterrent devices [1]. Many PAVA systems emit US (normally 31 around 20 kHz) as they monitor their operational integrity [1,5]. Since the EU in 2008 made it mandatory that PAVA systems implement a technology to ensure and monitor operational integrity [6].
VHFS/US signals in air at public places have been documented by reports published in academic journals as well as internet reports from citizen scientists. Detections were documented mainly in the United Kingdom (UK; involving the cities of Southampton, London, Cambridge, Bristol, Inverness, Manchester) [1,2,7,8,9], Germany (Berlin, Hanover, Cologne) [2], France (Paris) [2], Italy (Rome, Milan) [7] and Japan (Tokyo) [10]. It is highly likely that VHFS/US in air is present in all public places in cities worldwide. However, a systematic investigation about this has not been conducted so far.
VHFS/US in air can affect humans when people are able to hear it or possibly also even when the sound it not heard. Reports about the occurrences of specific symptoms (e.g., discomfort, restlessness, headache, nausea, fatigue, asthenia, tinnitus, dizziness, stomach pain) as a consequence of a VHFS/US exposure have been published [11,12,13,14,15,16,17] and laboratory studies conducted investigating symptoms caused by VHFS/US exposure [18,19]. The study of fletcher et al. [19] considered VHFS and US that all of the human subjected tested could hear. The researchers proved discomfort, and proved statistically significant triggering, regardless of whether the human subject described themselves as in the past being sensitive to adverse effects from these frequencies. Only the group who described themselves in this way showed statistically significant triggering of annoyance and difficulty concentrating. When the team tested VHFS and US that none of the subjects could hear [18], no one showed a statistically significant triggering effect. However, as the authors point out, it is very important to note that both studies [18,19] were legally limited to lower sound pressure levels (SPLs), and shorter duration exposures, than could occur in many public settings, and therefore the results of these two studies should not be interpreted as implying that only small effects could ever be produced by longer or more intense exposures: they were not allowed to test those regimes.
If an exposure to VHFS/US signals is able to trigger activation of the auditory cortex in humans was investigated by Kühler et al. [20]. Although at first reading this study might be taken as suggesting that an activation of the auditory cortex could be also not detected in a study investigating neural effects correlated to a VHFS/US signals exposure, the study did not compare like with like: to quote the authors ”stimuli at frequencies of 16.9 kHz, 19.1 kHz, 20.7 kHz and 24.2 kHz, being identical to the stimuli used in the hearing threshold experiments, were presented at two different SPLs: namely, at 2 dB below the individual hearing threshold of the subject (−2 dB SL) and at 5 dB above this hearing threshold (5 dB SL). A reference stimulus with a frequency of 14 kHz at 20 dB above the individual hearing threshold (20 dB SL) was used to compare the brain responses evoked by the ultrasound with a well-known brain response in the audible frequency range” [20]. Therefore, the 14 kHz control signal was had a considerably higher sensation level than the VHFS/US test signal, which might explain why the response from a VHFS/US did not elicit a comparable response in the auditory cortex. The authors report that “almost all of the test subjects described the hearing sensation as displeasing” and credited Leighton [1] as correctly predicting the observation they confirmed, that close to the high frequency limit of an individual’s hearing, the dynamic range between being able to hear a sound and finding it unpleasant is very small.
While VHFS/US is normally not heard due to the hearing threshold in this frequency range, some individuals with the ability to hear it exist because high-frequency hearing threshold varies individually [21]. Since the biological effects of VHFS/US sound exposure is not completely understood and the exposure limits are questionable [1,12], a detailed assessment of the public exposure to VHFS/US is warranted. To this end, this project from a “citizen scientist” aimed to measure VHFS/US sounds in public places in Zurich, Switzerland – a country from which such measurements have not yet been reported. The idea of this project was triggered by the seminal paper of Leighton published in 2016 [1] discussing new measurements about an “increasing mass exposure to ultrasound in air” and where citizen scientists are called upon to measure and document VHFS/US emission in air at public places by themselves in order to further identify and investigate public mass exposure to VHFS/US.
2. Materials and Methods
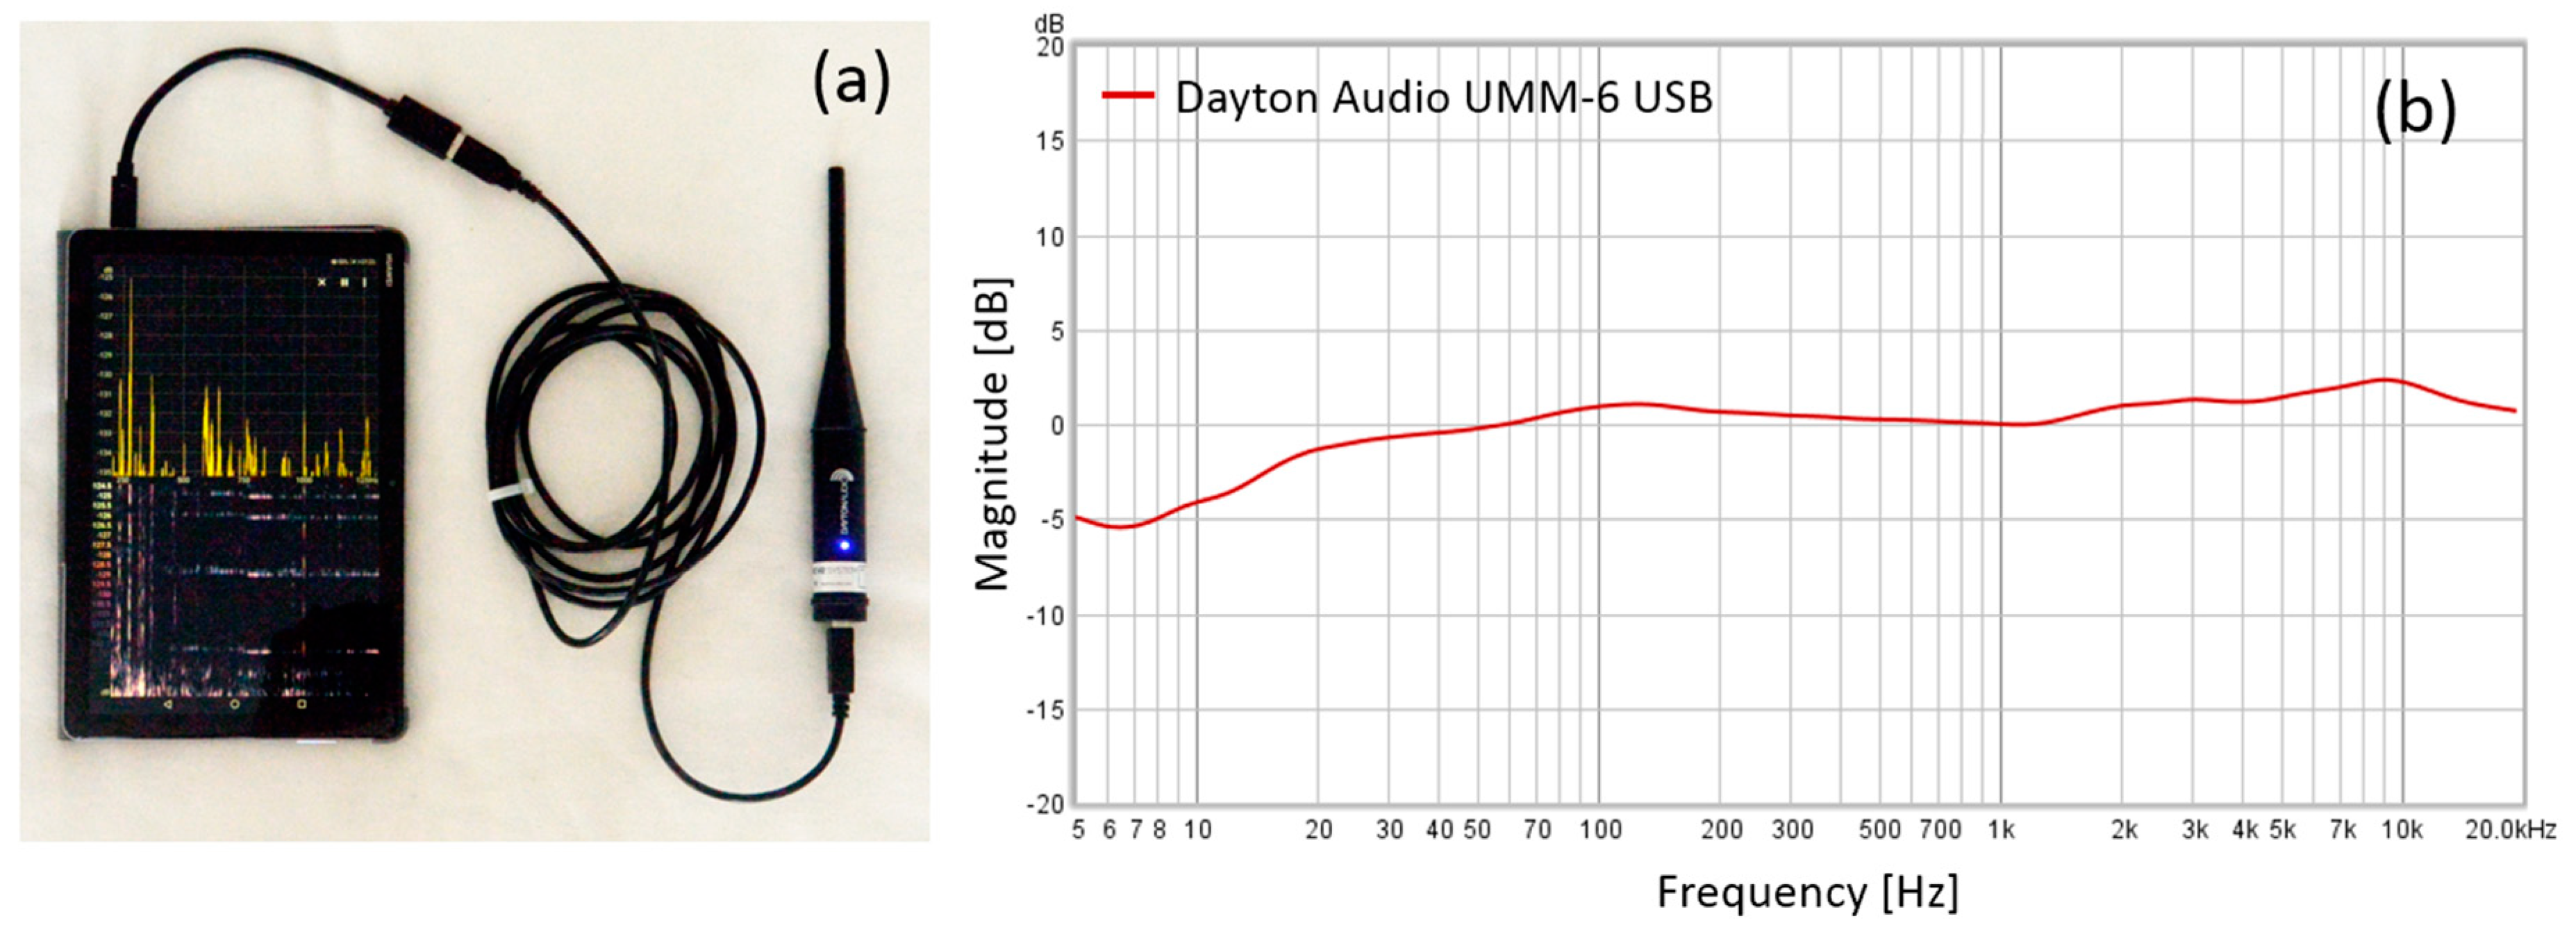
Measurements of VHFS/US sound were made with a portable measurement setup involving a tablet computer (Huawei MediaPad M5 lite 10, Huawei Technologies Co. Ltd., Shenzhen, China), a precision condenser measurement microphone (Dayton Audio UMM-6 USB; Dayton Audio, Springboro, OH, USA; polar response: true omnidirectional, frequency response: 18–20.000 Hz (calibrated), sensitivity at 1 kHz into 1 kΩ: 10 mV/Pa (−40 dBV, re. 0 dB = 1V/Pa), maximum SPL for 1% total harmonic distortion at 1 kHz: 127 dB) and an audio analysis software (Spectroid, version 1.1.1, Carl Reinke, Albuquerque, NM, USA). Figure 1a depicts the measurement equipment used. The frequency-response of the condenser microphone was measured by the manufacturer for the specific microphone use in this investigation and it showed a good linear frequency-response over the whole frequency range (see Figure 1b). Audio recordings were made with a sampling frequency of 96 kHz. Audio signal processing involved frequency and time-frequency analysis (Spectroid software settings: fast Fourier transform (FFT) window size: 8192 bins (12 Hz/bin), decimation: 5 (0.37 Hz/bin at direct current), window function: Blackman-Harris, exponential smoothing factor: 0.90, desired transform interval: 100 ms (10 Hz), DC signal subtraction via moving average). The magnitude of the signals is shown in Spectroid in the decibel (dB) “Full Scale” unit (dB FS) where 0 dB FS corresponds to the maximum power the microphone is able to measure. A negative dB FS values thus indicates that the measured magnitude is less than the maximum possible. The condenser measurement microphone was calibrated with a sound level meter (732 A, BK Precision) and with the REW room acoustics software (v.5.19) (using the frequency-response measured for the microphone) to obtain also the magnitude as sound pressure levels (SPL) in the dB scale (unweighted, i.e., with a linear frequency-response). Both, the dB FS scale (for the whole frequency range) as well as the dB scale (for all frequencies in the range 5 Hz–20 kHz) were determined when analysing the recorded signals.
Measurements were made with the portable systems on two days in Zurich, Switzerland, while walking through the city and visiting public places (total duration of the excursion: 4 h). If a signal was detected, it was tried to identify the source by moving into the direction of maximum VHFS/US signal emission. When a VHFS/US signal was detected, measurements were conducted for about 2–5 min ensuring a stable and undisturbed signal recording. A screen-short was made capturing the frequency spectrum and the time-frequency spectrogram. The location, time and comment about the signal were written down in a notebook. After the measurements in the city, the screen-shorts were analysed and the characteristics of the VHFS/US signals detected were determined (peak frequencies, modulations).
3. Results
At 10 public places, distinct VHFS/US signals could be detected a University in Zurich, shops and places at the main rail station (see Table 1). The signals were detected by positioning the microphone at different, random, directions at various places. If a signal was seen in the spectrogram, the positioning of the microphone and the location of measurement were changed until the signal were detected with the highest intensity. In total, at 50% of the measured locations (10 of 20), a VHFS/US signal was present. Figure 2, Figure 3, Figure 4 and Figure 5 show the annotated screenshots of the signals recorded. In several cases, VHFS/US signals above the microphone calibration (>20 kHz) were detected since the microphone is able (but with a reduced sensitivity) to detect signals up to about 40 kHz.
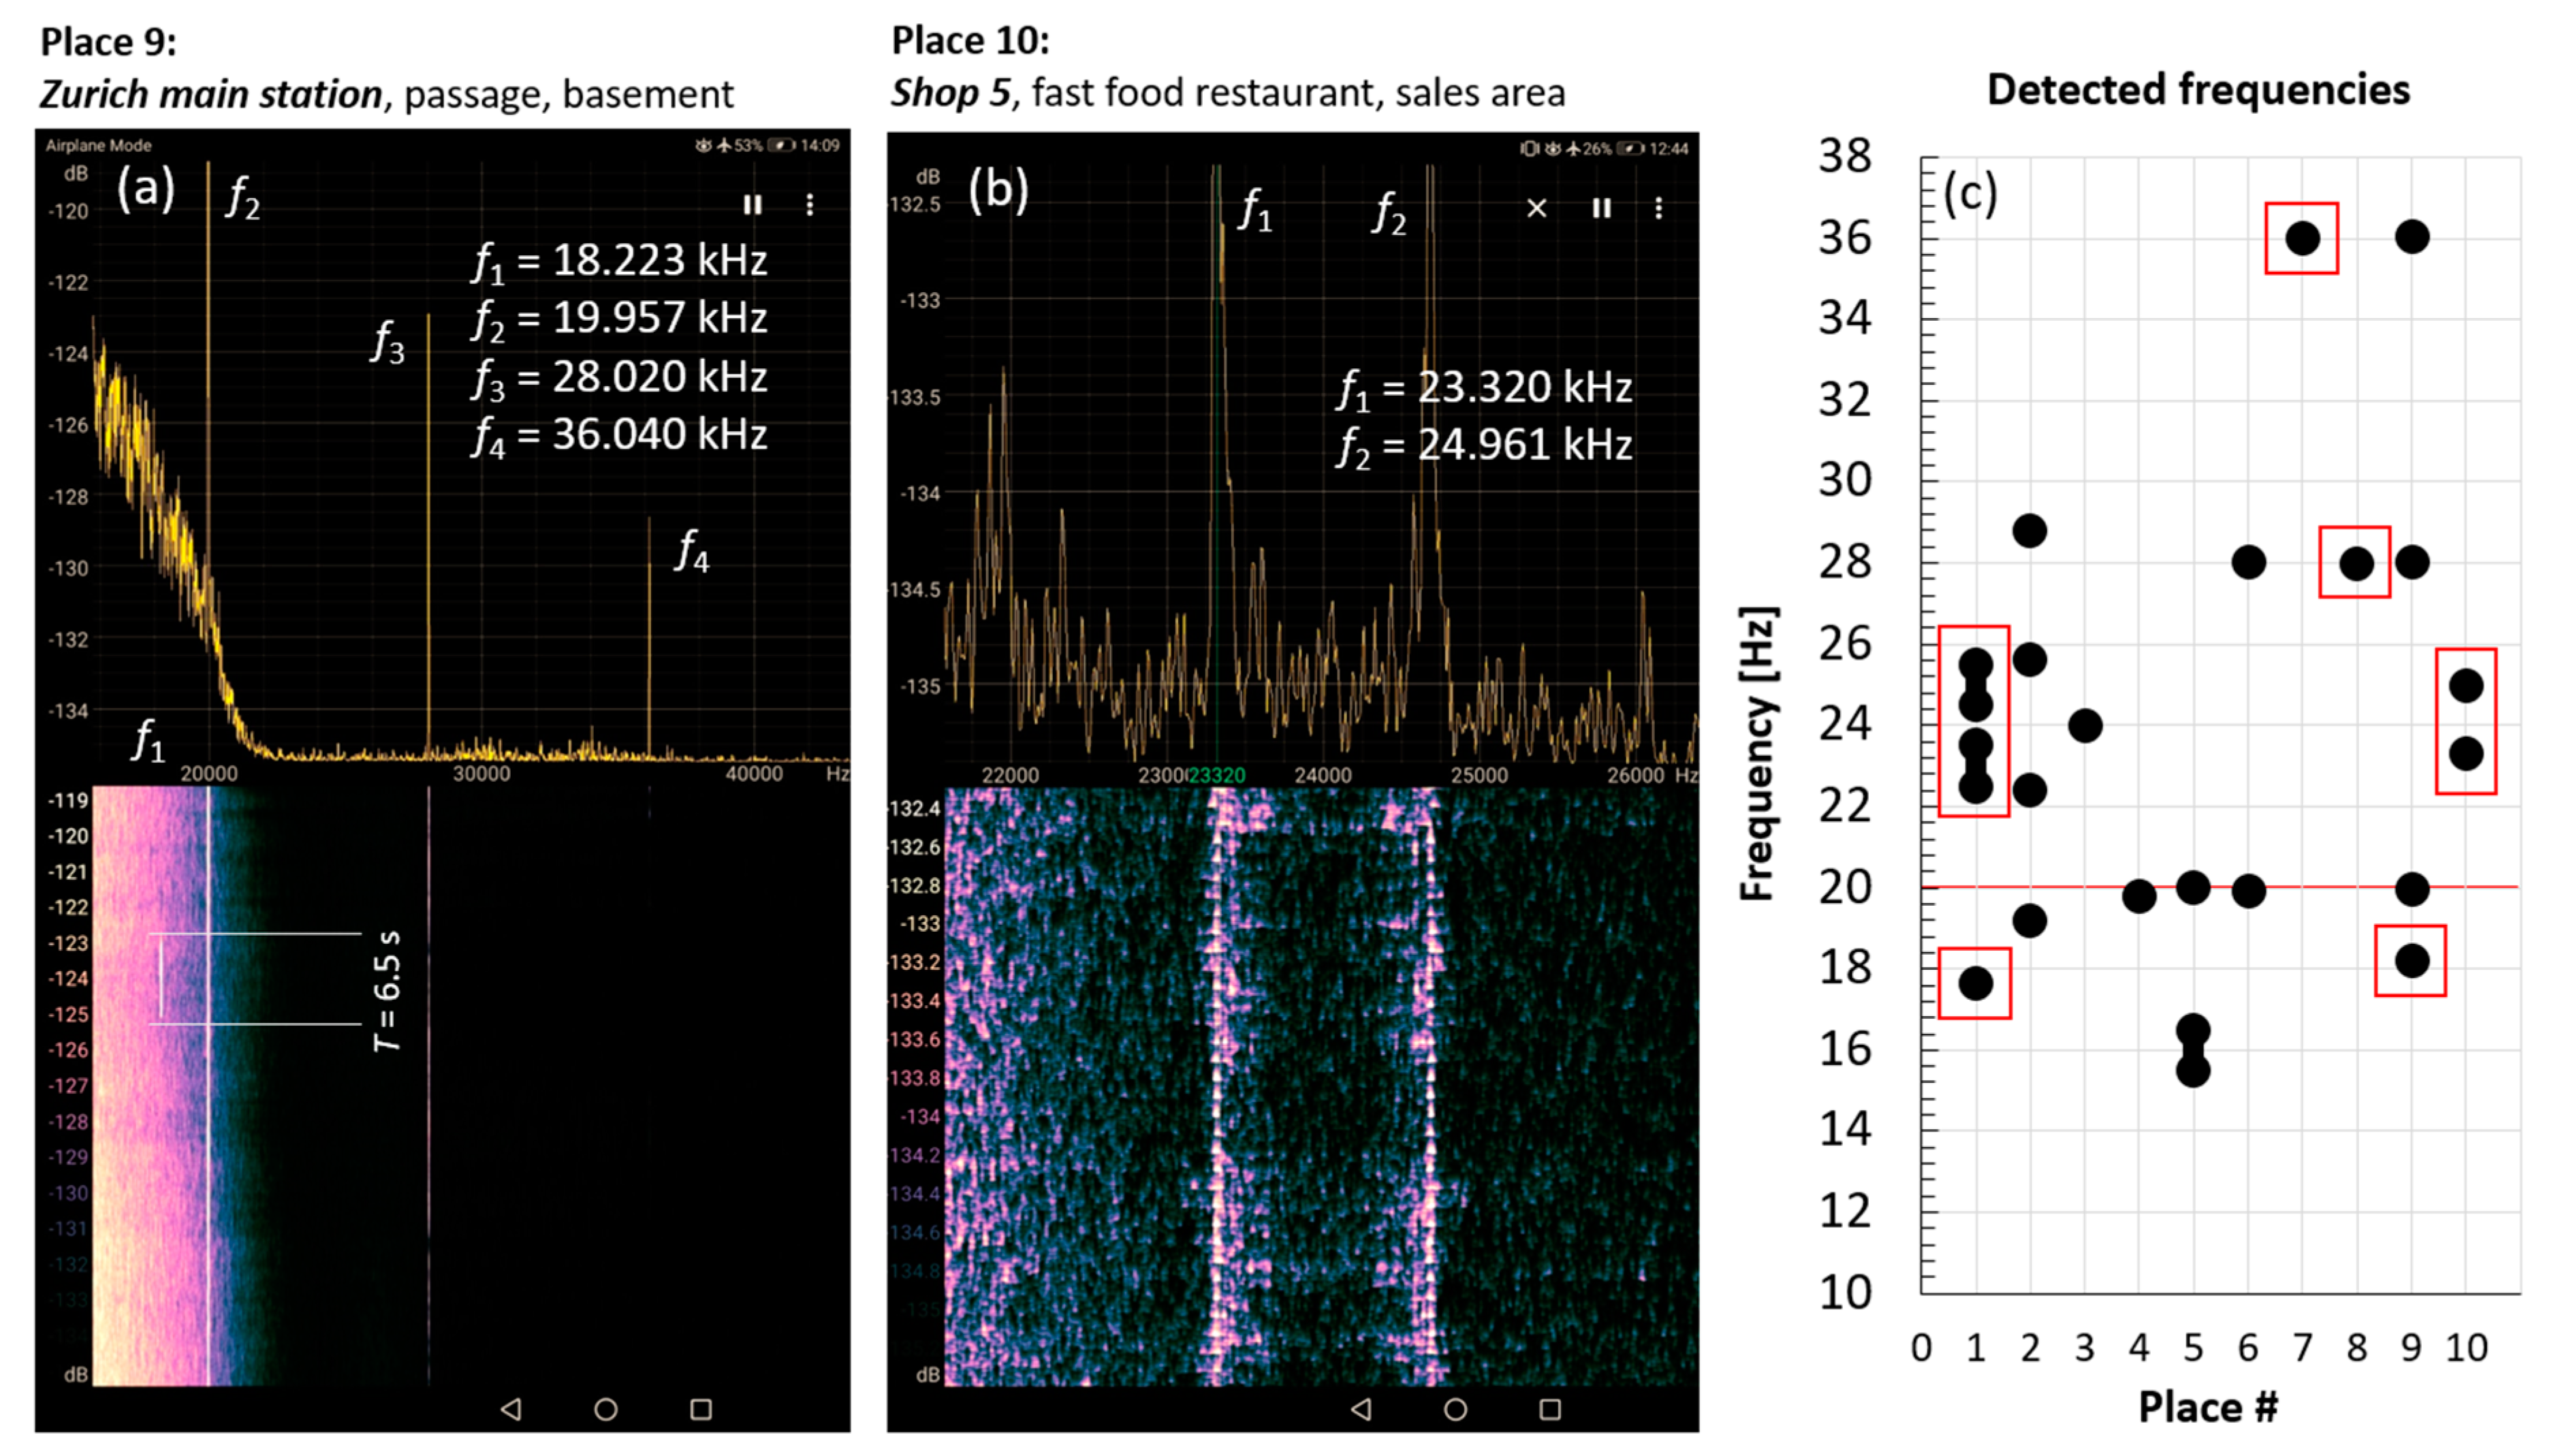
The VHFS/US signals registered had different characteristic depending on the location. At some places, a single signal was present (#3, #4, #7, #8), whereas at others, two (#5, #6, #10) or more (#1, #2, #9) could be registered. Some of the signals were clearly visibly amplitude modulated or showed irregular variations of the amplitude (#1, #2, #5, #6, #7, #8, #9, #10), whereas others had an approximate constant amplitude, i.e., were tonal sound emissions (#3, #4, #5, #6, #9). The peak frequencies ranged from 15.5 kHz (#5) to 36.0 kHz (#9). Figure 5c summarized the detected frequencies from all locations). Some of the sound emissions were broad band with several frequencies near each other (#1) or an almost constant emission over a specific frequency interval (#5). The maxima of the signal intensities in dB FS ranged from −139.5 dB FS (#1) to −155.5 dB FS (#2), i.e., the most intense VHFS/US signals, according to the dB FS scale, were detected in the shop #2. SPL measurements in dB could be given for the signals at #1 (28.3 dB (f1)), #2 (39.4 dB (f1)), #4 (39.0 dB), #5 (30.1 dB), #6 (41.7 dB (f1))), #9 (35.9 dB (f1)); 36.7 dB (f2)); the values represent the maximum value of the spectral peak). The SPL of the signal peaks with respect to the background noise (in dB) ranged from 2.5 dB (#1, f1) to 16.3 dB (#6, f1), i.e., the most intense VHFS/US signal in the range up to 20 kHz was measured at a passage in the basement of the Zurich main station. As expected for VHFS/US signals in air, the amplitude of the signals detected were direction dependent. However, at all 10 locations where a signal was registered, the signal was clearly detected even when positioning the microphone in the direction where the signal was weakest. In some places, the directional dependence was strong (#1, #6, #7, #8) where in the remaining places the signal varied only moderately when measuring in different directions.
4. Discussions, Conclusions and Outlook
The present report provides evidence for the presence of VHFS/US signals in the air at public places in Zurich, Switzerland. The analysis of the 10 signals measured revealed that they: (i) contain one, two or multiple frequencies; (ii) comprise frequencies ranged from 15.5 kHz to 36.0 kHz; (iii) were either quasi constant in their amplitude or exhibit an AM; and (iv) were in their characteristics (frequencies, modulation, intensity) specific for each place.
The findings agree with published reports about VHFS/US detections in other cities worldwide [1,2,7,9,10]. The sources of the VHFS/US signal recorded in present investigation are most probably PAVA systems installed in the places visited. PAVA systems create US signals with main frequencies of about 20 kHz [5], i.e., the same frequency also detected in the signals presented in this report.
The SPL values detected VHFS/US signals, when analysing the signals in dB and up to 20 kHz, ranged from 28.3 dB (f1, #1) to 41.7 dB (f1, #6), indicating that the intensities were weak. When looking at the SPL amplitudes for the peak signals, some reached 16.3 dB (#6, f1), i.e., demonstrating a relatively strong amplitude with respect to the background SPL around this signal.
The work presented should: (i) document the presence of VHFS/US signals at another city in Europe; and (ii) stimulate others to also measure and analyse VHFS/US signals with the citizen scientist approach in other cities worldwide. Both, the documentation and the further large-scale measurements are necessary to help understanding the significance of VHFS/US signals as a possible source of public health related impacts. Although the exposure to VHFS/US signals is regulated, the regulatory guidelines have been criticized as being insufficient and incorrect [1,3,4], and there is in general no regulatory agency making measurement at public places to ensure that the guidelines are met. It is therefore likely that the public is exposed to intense VHFS/US signals at some public places with the consequence of negative impact on the health where the persons exposed are not aware of their exposure nor of the health-related significance of such. The use of PAVA systems producing VHFS/US signals in air needs to be more regulated and controlled, and the public should be informed to a greater extent about the possible negative effects of a VHFS/US exposure, especially when persons are exposed for many hours a day such as employees in shops with PAVA systems installed.
The study has the following limitations: (i) detected VHFS/US signals with frequencies above 20 kHz (and thus above the calibration and linearity of the microphone) could not be given in absolute dB units since a calibration of the microphone was not available in this frequency range; (ii) it was not investigated how the signals detected depend on time-of-day, exact measurement location or other factors. Furthermore, the investigation did not provide information about the exact source of the VHFS/US signals detected. Planned follow-up investigations will take these limitations into account.
The investigation of biological chronic and long-term effects of exposing humans to airborn VHFS/US signals need to be intensified since it is foreseeable that the public is going to be exposed to VHFS/US signals in an increasing manner by PAVA systems [1]. This is in addition to new technology such as wireless power transfer to mm-sized nodes enabling long-range wireless charging or signal transmission as part in the next-generation of the Internet of Things infrastructure [22,23].
Since the negative impact of a VHFS/US sound exposure on human health is only superficially investigated and understood at the moment, the application of the precautionary principle [24] is warranted, making it necessary to regulate the use of VHFS/US sound in public places (including workplaces) more strictly to minimise potential effects on sufferers. This precaution would especially protect people that are sensitive to VHFS/US sound exposures like those with the ability to hear VHFS/US sound [21] (children being especially relevant with this respect) as well as those Highly Sensitive People (HSP) who have a lower threshold for the detection of sensory signals and have a different processing of them [25,26,27,28].
Funding
This research received no external funding.
Acknowledgments
The author is grateful to John Folkes for proofreading the manuscript.
Conflicts of Interest
The author declares no conflict of interest.
References
- Leighton, T.G. Are some people suffering as a result of increasing mass exposure of the public to ultrasound in air? Proc. R. Soc. A 2016, 472, 20150624. [Google Scholar] [CrossRef] [PubMed]
- Fletcher, M.D.; Jones, S.L.; White, R.R.; Dolder, C.N.; Lineton, B.; Leighton, T.G. Public exposure to ultrasound and very high-frequency sound in air. J. Acoust. Soc. Am. 2018, 144, 2554–2564. [Google Scholar] [CrossRef] [PubMed]
- Leighton, T.G. Comment on ‘are some people suffering as a result of increasing mass exposure of the public to ultrasound in air?’. Proc. R. Soc. A 2017, 473, 20160828. [Google Scholar] [CrossRef] [PubMed]
- Leighton, T.G. Ultrasound in air-guidelines, applications, public exposures, and claims of attacks in cuba and china. J. Acoust. Soc. Am. 2018, 144, 2473–2489. [Google Scholar] [CrossRef] [PubMed]
- Mapp, P. Potential audibility of ultrasonic signal monitoring of public address and life safety sound systems. J. Acoust. Soc. Am. 2018, 144, 2539–2547. [Google Scholar] [CrossRef]
- European Union, DS/ EN 54–16, 2008. Fire detection and fire alarm systems-part 16: Voice alarm control and indicating equipment. Available online: https://standards.globalspec.com/std/1109363/ds-en-54-16 (accessed on 28 May 2019).
- Leighton, T.G.; Dolder, C. Citizen scientist records of ultrasound in air. Instagram #ultrasoundinair. Available online: https://www.Instagram.Com/explore/tags/ultrasoundinair (accessed on 28 May 2019).
- Alvares-Sanches, T.; Osborne, P.E.; White, P.; Bahaj, A. Spatial variation in sound frequency components across an urban area derived from mobile surveys. Future Cities Environ. 2019, 5, 1–17. [Google Scholar] [CrossRef]
- Paxton, B.; Harvie-Clark, J.; Albert, M. Measurements of ultrasound from public address and voice alarm systems in public places. J. Acoust. Soc. Am. 2018, 144, 2548–2553. [Google Scholar] [CrossRef]
- Ueda, M.; Ota, A.; Takahashi, H. Investigation on high-frequency noise in public space. In Inter-Noise and Noise-Con Congress and Conference Proceedings; Institue of Noise Control Engineering: Reston, VA, USA, 16–19 November 2014; pp. 2692–2698. [Google Scholar]
- Acton, W.I.; Carson, M.B. Auditory and subjective effects of airborne noise from industrial ultrasonic sources. Occup. Environ. Med. 1967, 24, 297–304. [Google Scholar] [CrossRef]
- Ahmadi, F.; McLoughlin, I.V.; Chauhan, S.; ter-Haar, G. Bio-effects and safety of low-intensity, low-frequency ultrasonic exposure. Prog. Biophys. Mol. Biol. 2012, 108, 119–138. [Google Scholar] [CrossRef]
- Acton, W.I. The effects of industrial airborne ultrasound on humans. Ultrasonics 1974, 12, 124–128. [Google Scholar] [CrossRef]
- Maccà, I.; Scapellato, M.L.; Carrieri, M.; Maso, S.; Trevisan, A.; Bartolucci, G.B. High-frequency hearing thresholds: Effects of age, occupational ultrasound and noise exposure. Int. Arch. Occup. Environ. Health 2014, 88, 197–211. [Google Scholar] [CrossRef] [PubMed]
- Skillern, C.P. Human response to measured sound pressure levels from ultrasonic devices. Am. Ind. Hyg. Assoc. J. 2007, 26, 132–136. [Google Scholar] [CrossRef] [PubMed]
- Damongeot, A.; André, G. Noise from ultrasonic welding machines: Risks and prevention. Appl. Acoust. 1988, 25, 49–66. [Google Scholar] [CrossRef]
- Van Wieringen, A.; Glorieux, C. Assessment of short-term exposure to an ultrasonic rodent repellent device. J. Acoust. Soc. Am. 2018, 144, 2501–2510. [Google Scholar] [CrossRef]
- Fletcher, M.D.; Jones, S.L.; White, P.R.; Dolder, C.N.; Leighton, T.G.; Lineton, B. Effects of very high-frequency sound and ultrasound on humans. Part ii: A double-blind randomized provocation study of inaudible 20-khz ultrasound. J. Acoust. Soc. Am. 2018, 144, 2521–2531. [Google Scholar] [CrossRef]
- Fletcher, M.D.; Jones, S.L.; White, P.R.; Dolder, C.N.; Leighton, T.G.; Lineton, B. Effects of very high-frequency sound and ultrasound on humans. Part i: Adverse symptoms after exposure to audible very-high frequency sound. J. Acoust. Soc. Am. 2018, 144, 2511–2520. [Google Scholar] [CrossRef]
- Kühler, R.; Weichenberger, M.; Bauer, M.; Hensel, J.; Brühl, B.; Ihlenfeld, A.; Ittermann, B.; Sander, T.; Kühn, S.; Koch, C. Does airborne ultrasound lead to activation of the auditory cortex? Biomed. Eng.-Biomed. Tech. 2019, 64, 481–493. [Google Scholar] [CrossRef]
- Rodríguez Valiente, A.; Trinidad, A.; García Berrocal, J.R.; Górriz, C.; Ramírez Camacho, R. Extended high-frequency (9–20 khz) audiometry reference thresholds in 645 healthy subjects. Int. J. Audiology 2014, 53, 531–545. [Google Scholar] [CrossRef]
- Rekhi, A.S.; Khuri-Yakub, B.T.; Arbabian, A. Wireless power transfer to millimeter-sized nodes using airborne ultrasound. IEEE Trans. Ultrason. Ferroelectr. Freq. Control 2017, 64, 1526–1541. [Google Scholar] [CrossRef]
- Rekhi, A.S.; Arbabian, A. Ultrasonic wake-up with precharged transducers. IEEE J. Solid-State Circuits 2019, 54, 1475–1486. [Google Scholar] [CrossRef]
- Kriebel, D.; Tickner, J.; Epstein, P.; Lemons, J.; Levins, R.; Loechler, E.L.; Quinn, M.; Rudel, R.; Schettler, T.; Stoto, M. The precautionary principle in environmental science. Environ. Health Perspect. 2001, 109, 871–876. [Google Scholar] [CrossRef] [PubMed]
- Ryu, J.K.; Jeon, J.Y. Influence of noise sensitivity on annoyance of indoor and outdoor noises in residential buildings. Appl. Acoust. 2011, 72, 336–340. [Google Scholar] [CrossRef]
- Grimen, H.L.; Diseth, Å. Sensory processing sensitivity. Compre. Psychology 2016, 5, 1–10. [Google Scholar] [CrossRef]
- Bakker, K.; Moulding, R. Sensory-processing sensitivity, dispositional mindfulness and negative psychological symptoms. Personality and Individual Differences 2012, 53, 341–346. [Google Scholar] [CrossRef]
- Jawer, M. Environmental sensitivity: A neurobiological phenomenon? Semin. Integr. Med. 2005, 3, 104–109. [Google Scholar] [CrossRef]
Figure 1.
(a) Measurement equipment (tablet with precision condenser measurement microphone). (b) Measured frequency response of the microphone used.
Figure 1.
(a) Measurement equipment (tablet with precision condenser measurement microphone). (b) Measured frequency response of the microphone used.

Figure 2.
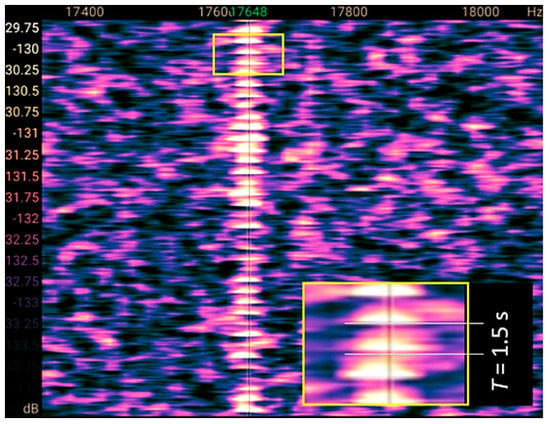
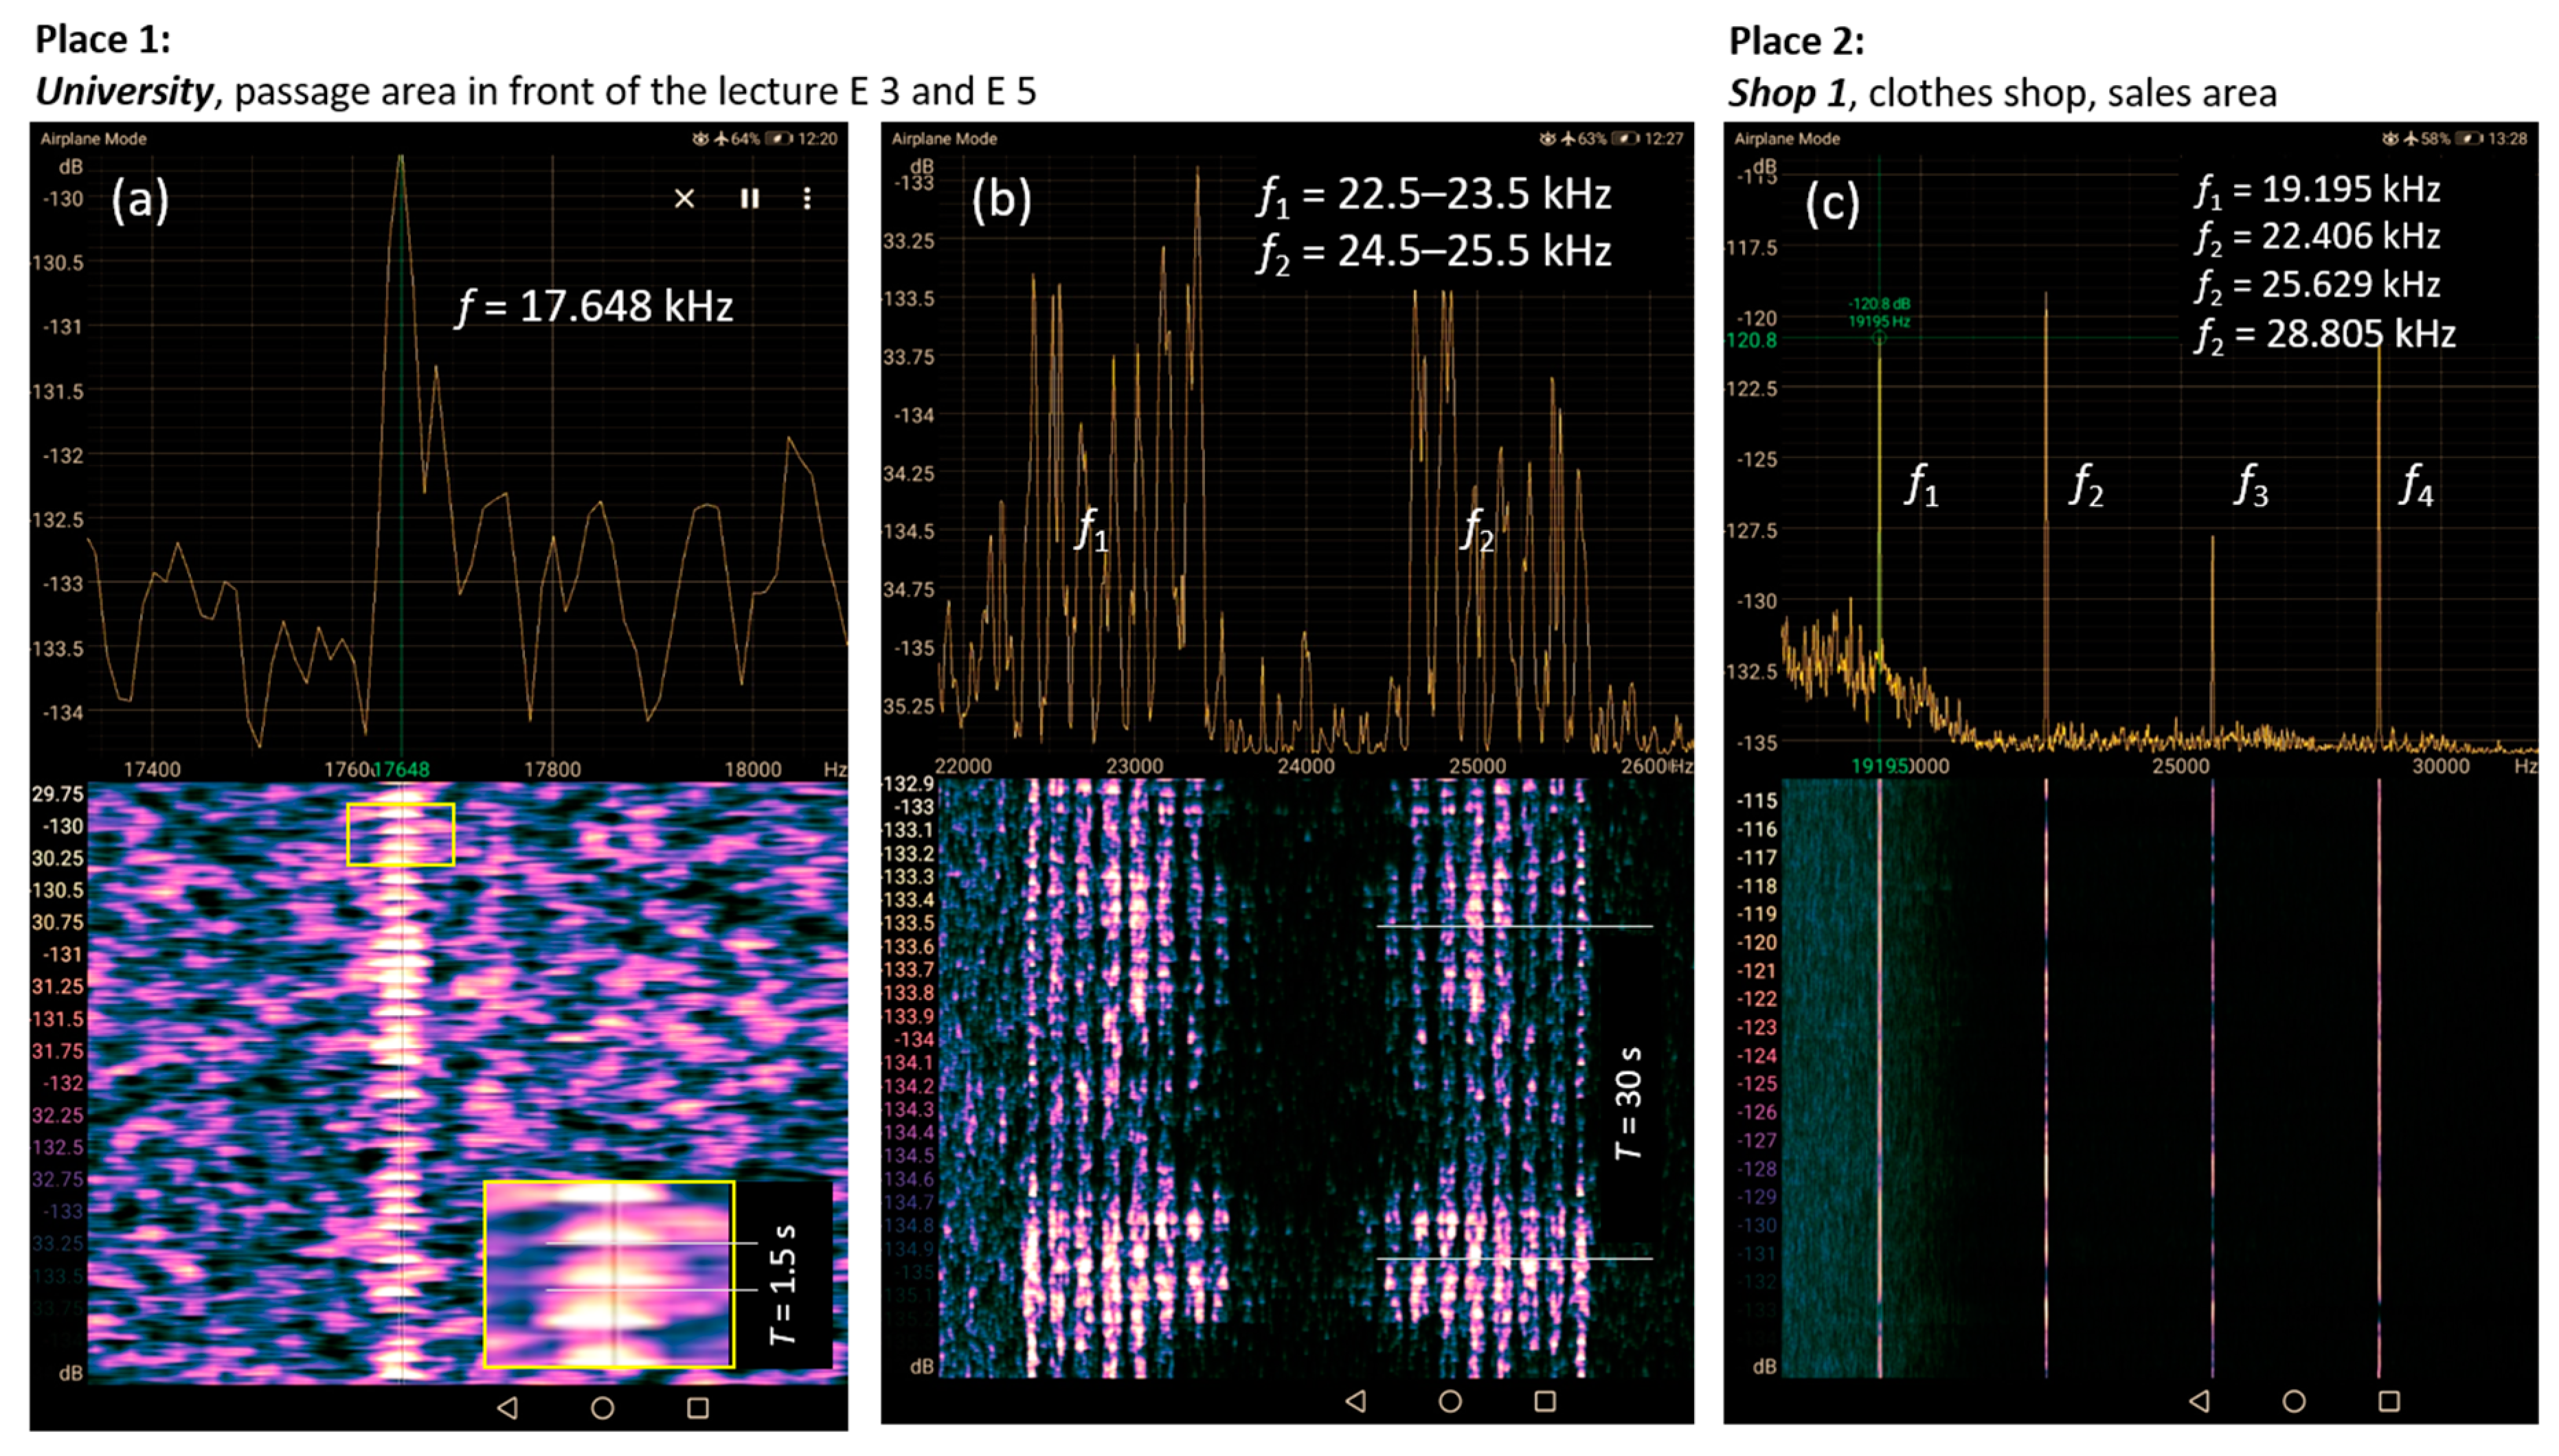
VHFS/US signals detected at places #1 (a,b) and #2 (c). In insert in (a) shows a zoomed-in part of the signal highlighting the AM with a period of about 1.5 s. The color scale represent the SPL values depending on the frequency (x axis) and the time (y axis).
Figure 2.
VHFS/US signals detected at places #1 (a,b) and #2 (c). In insert in (a) shows a zoomed-in part of the signal highlighting the AM with a period of about 1.5 s. The color scale represent the SPL values depending on the frequency (x axis) and the time (y axis).

Figure 3.
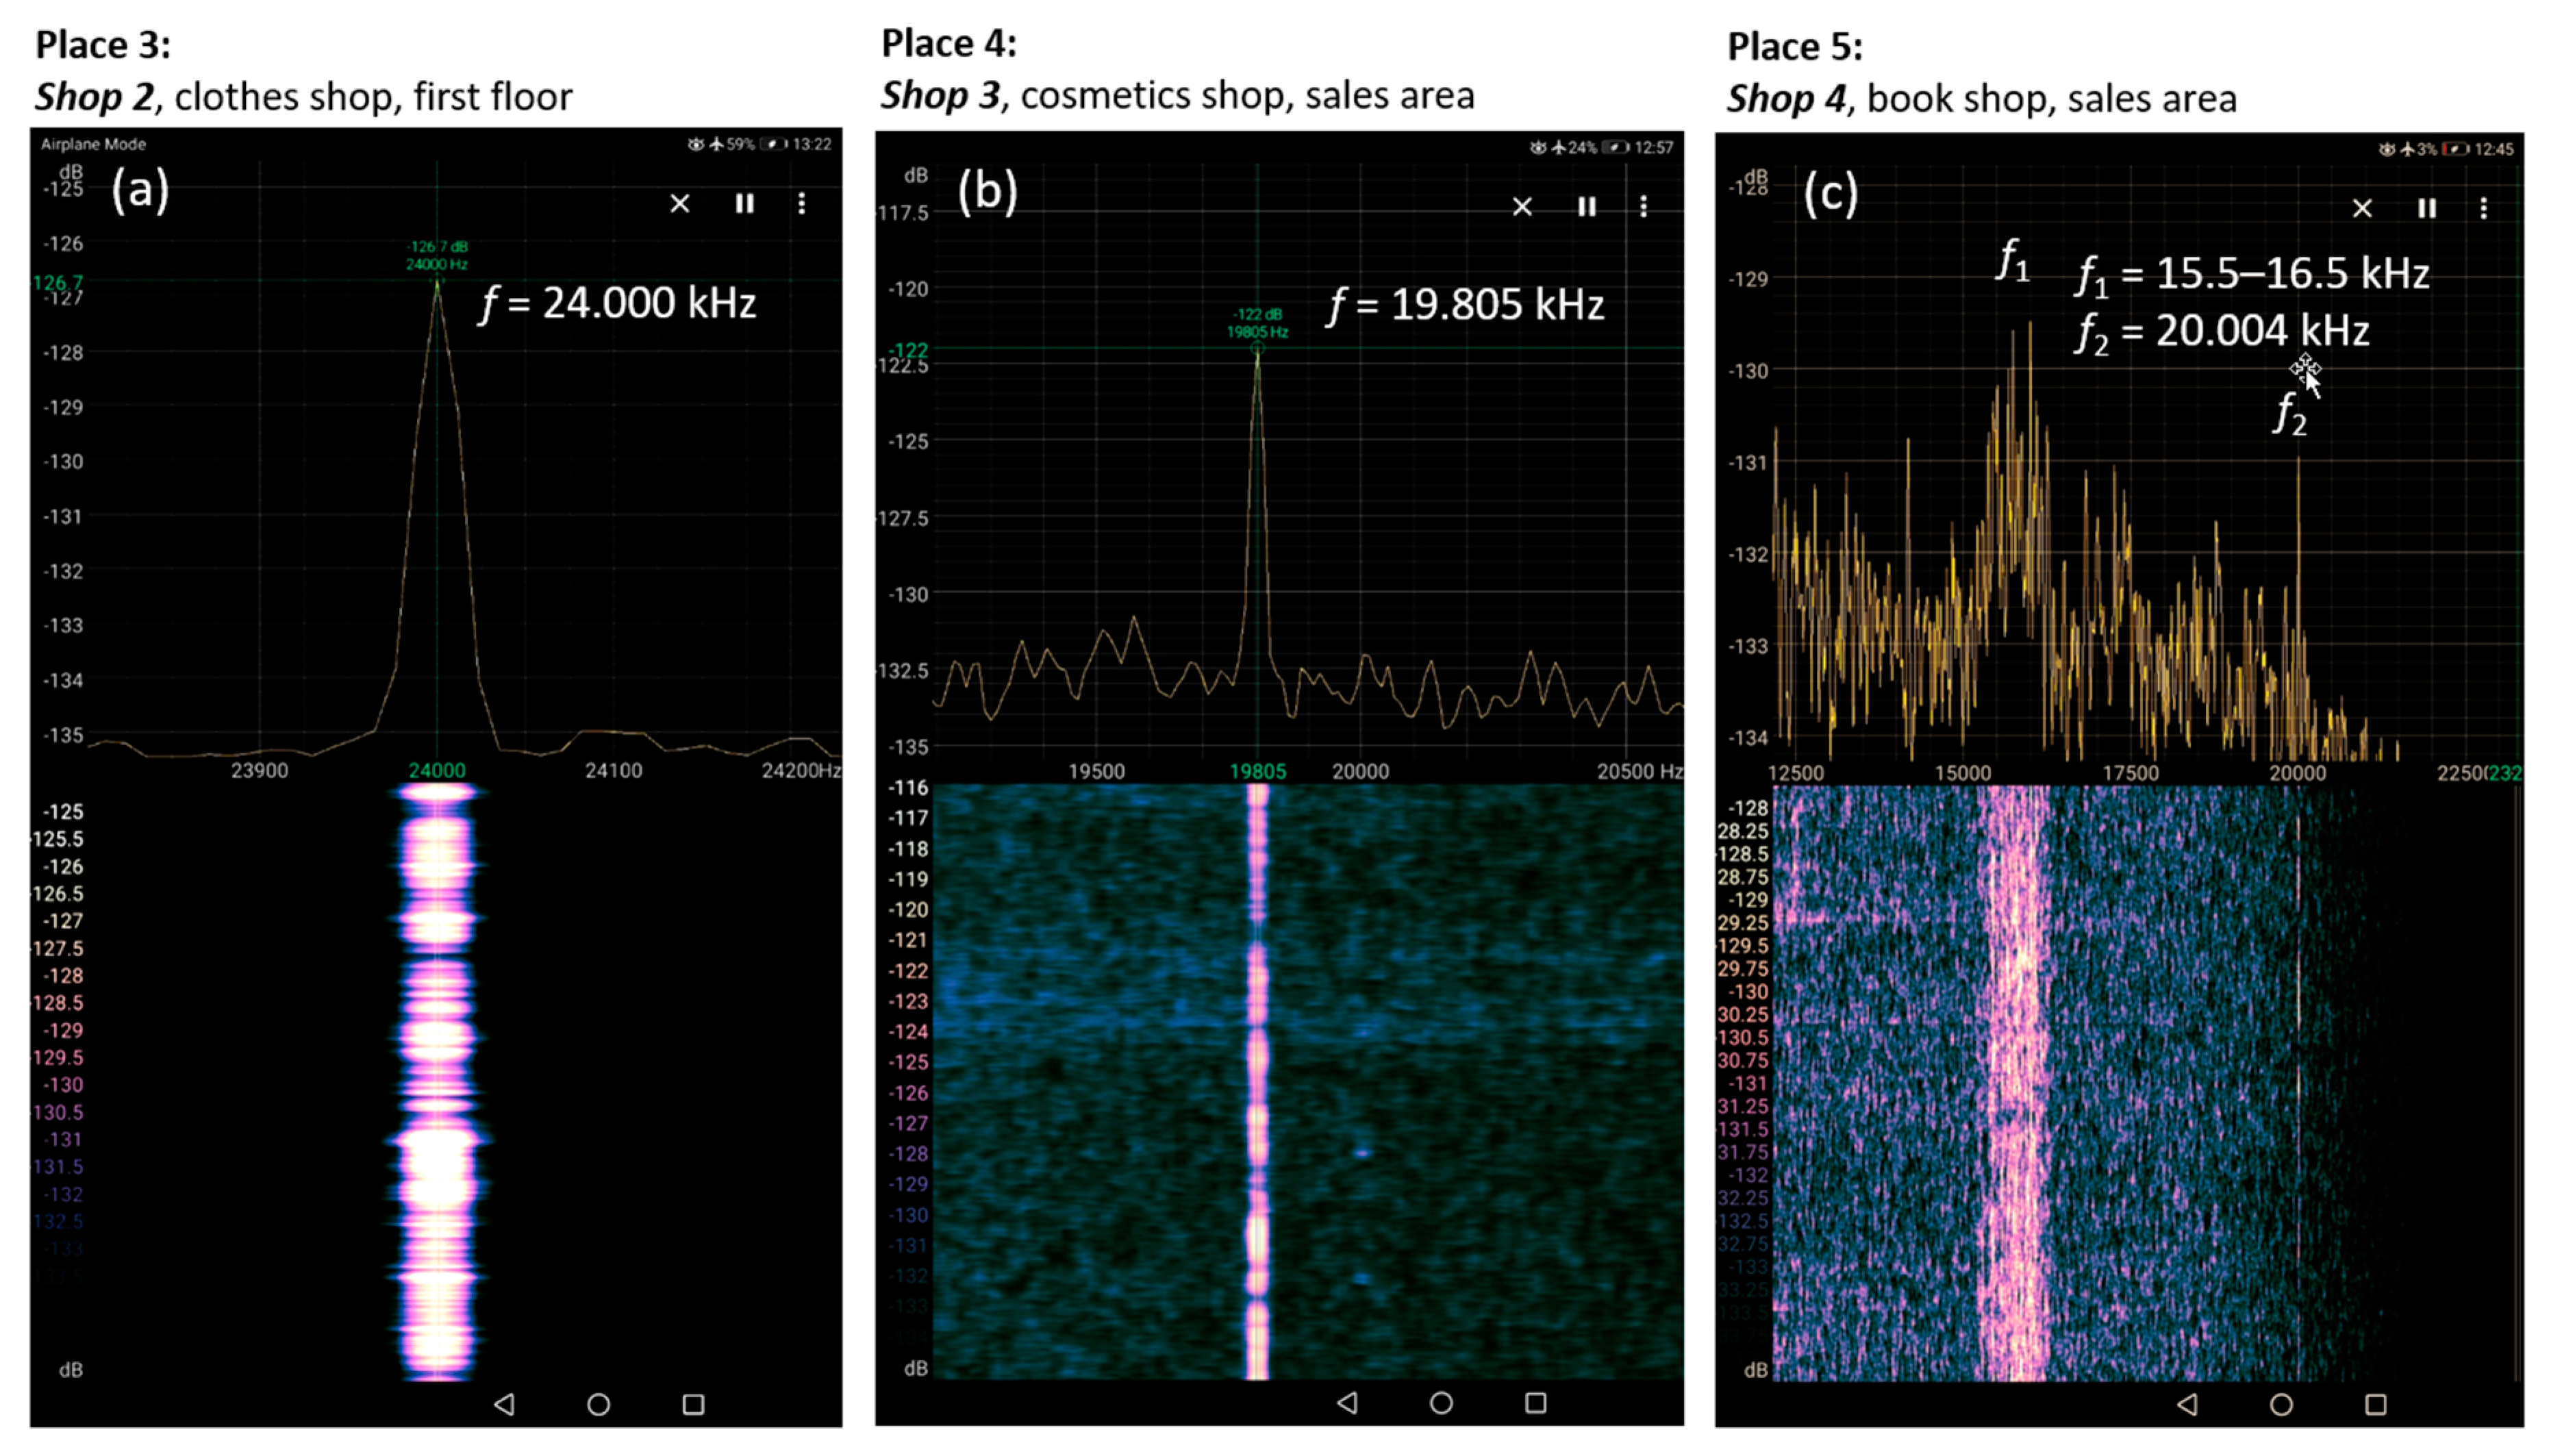
VHFS/US signals detected at places #3 (a), #(b) and #5 (c).

Figure 4.
VHFS/US signals detected at places #6 (a), #7 (b) and #8 (c).

Figure 5.
VHFS/US signals detected at places #9 (a) and #10 (b). (c) Figure showing the frequencies detected. Dots with red boxes indicate signals with amplitude modulation. Dots connected with a black bar indicate that these signals comprise of multiple single signals in a frequency band.
Figure 5.
VHFS/US signals detected at places #9 (a) and #10 (b). (c) Figure showing the frequencies detected. Dots with red boxes indicate signals with amplitude modulation. Dots connected with a black bar indicate that these signals comprise of multiple single signals in a frequency band.


Table 1.
Frequencies of very high-frequency sound (VHFS) and ultrasound (US) signals detected in public places in Zurich, Switzerland. AM: amplitude modulated. IA: irregular amplitude, ACA: approximate constant amplitude. T: duration between signal maxima or duration of the signal (amplitude modulation), HFBL: high-frequency background level (background sound level around the peak frequency; mean levels left and right the spectral peak). ∆SPL: difference of sound pressure level (SPL), peak SPL minus SPL background noise (i.e., sound intensity at the particular frequency with respect to the background noise). The background noise was estimated as the mean value from the adjacent values directly right and left the spectral peak. SPL values are given in dB “Full Scale” (FS) (for all signals) and in dB (for signals with a frequency up to 20 kHz since the microphone was calibrated to provide SPL values in dB for this range). If a frequency range is given for the VHFS/US detected, it means that the signal’s peak frequency was varying in this frequency range.
| Place No. | Measurement Location, Peak Frequencies and Levels of the Signals, and Signal Characteristics |
|---|---|
| 1 | University, passage area in front of lecture halls E3, E5 (47°22′35.2″ N, 8°32′51.2″ E) f1 = 17.7 kHz (28.3 dB, −129.8 dB FS), AM (T = 1.5 s), HFBL = 25.8 dB, −133 dB FS, ∆SPL = 2.5 dB f2 = 22.5–23.5 kHz (−133.8 dB FS), AM (T1 = 1.5 s and T2 = 30 s), HFBL = −135 dB FS f3 = 24.5–25.5 kHz (−133.8 dB FS), AM (T1 = 1.5 s and T2 = 30 s), HFBL = −135 dB FS |
| 2 | Shop 1, clothes shop, sales area (47°22′28.4″ N 8°32′16.7″ E) f1 = 19.2 kHz (39.4 dB, −115.5 dB FS), HFBL = 26.2 dB, −132.5 dB FS f2 = 22.4 kHz (−115.5 dB FS), IA, HFB L = −135 dB FS f3 = 25.6 kHz (−115.5 dB FS), IA, HFBL = −135 dB FS f4 = 28.8 kHz (−115.5 dB FS), IA, HFBL = −135 dB FS |
| 3 | Shop 2, clothes shop, first and second floor (47°22′29.4″ N, 8°32′17.4″ E) f = 24.0 kHz (−125 dB FS), ACA, HFBL = −135 dB FS |
| 4 | Shop 3, cosmetics shop, sales area (47°22′20.1″ N, 8°32′38.5″ E) f = 19.8 kHz (39.0 dB, −116 dB FS), ACA, HFBL = 26.2 dB, −132.5 dB FS |
| 5 | Shop 4, book shop, sales area (47°24′41.4″ N, 8°32′40.5″ E) f1 = 15.5-16-5 kHz (30.1 dB, −127.5 dB FS), ACA, HFBL = 25.8 dB, −133 dB FS f2 = 22.0 kHz (−130 dB), IA, HFBL = −134.5 dB FS |
| 6 | Zurich main station, passage, basement (47°22′39.0″ N, 8°32′20.6″ E) f1 = 19.9 kHz (41.7 dB, −112.5 dB FS), ACA, HFBL = 25.4 dB, −133.5 dB FS f2 = 28.0 kHz (−131 dB FS), IA, HFBL = −134.0 dB FS |
| 7 | Zurich main station, passage, basement (47°22′40.3″ N 8°32′21.7″ E) f = 36.0 kHz (−135.4 dB FS), IA, HFBL = −135.5 dB FS |
| 8 | Zurich main station, waiting area, railway (47°22′39.8″ N, 8°32′19.2″ E) f = 28.0 kHz (−134.9 dB FS), IA, HFBL = −135.5 dB FS |
| 9 | Zurich main station, passage, basement (47°22′38.2″ N, 8°32′24.2″ E) f1 = 18.2 kHz (35.9 dB, −120 dB FS), AM (T = 6.5 s), HFBL = 30.5 dB, −127 dB FS f2 = 20.0 kHz (36.7 dB, −119 dB FS), ACA, HFBL = 28.2 dB, −130 dB FS f3 = 28.0 kHz (−122 dB FS), ACA, HFBL = −135 dB FS f4 = 36.0 kHz (-129 dB FS), HFBL = −135 dB FS |
| 10 | Fast food restaurant, sales area (47°22′34.6″ N, 8°32′23.0″ E) f1 = 23.3 kHz (−132.3 dB FS), AM (T = 1.5 s), HFBL = −135 dB FS f2 = 25.0 kHz (−132.3 dB FS), AM (T = 1.5 s), HFBL = −135 dB FS |
© 2019 by the author. Licensee MDPI, Basel, Switzerland. This article is an open access article distributed under the terms and conditions of the Creative Commons Attribution (CC BY) license (http://creativecommons.org/licenses/by/4.0/).
Share and Cite
MDPI and ACS Style
Scholkmann, F. Exposure to High-Frequency Sound and Ultrasound in Public Places: Examples from Zurich, Switzerland. Acoustics 2019, 1, 816-824. https://0-doi-org.brum.beds.ac.uk/10.3390/acoustics1040048
AMA Style
Scholkmann F. Exposure to High-Frequency Sound and Ultrasound in Public Places: Examples from Zurich, Switzerland. Acoustics. 2019; 1(4):816-824. https://0-doi-org.brum.beds.ac.uk/10.3390/acoustics1040048
Chicago/Turabian StyleScholkmann, Felix. 2019. "Exposure to High-Frequency Sound and Ultrasound in Public Places: Examples from Zurich, Switzerland" Acoustics 1, no. 4: 816-824. https://0-doi-org.brum.beds.ac.uk/10.3390/acoustics1040048