Attenuation and Phase Velocity of Elastic Wave in Textured Polycrystals with Ellipsoidal Grains of Arbitrary Crystal Symmetry


Department of Mechanical and Aerospace Engineering, The Ohio State University, Columbus, OH 43210, USA
Acoustics 2020, 2(1), 51-72; https://0-doi-org.brum.beds.ac.uk/10.3390/acoustics2010005
Submission received: 19 December 2019
/
Revised: 6 February 2020
/
Accepted: 9 February 2020
/
Published: 11 February 2020
(This article belongs to the Special Issue Acoustical Materials)
Abstract
:This study extends the second-order attenuation (SOA) model for elastic waves in texture-free inhomogeneous cubic polycrystalline materials with equiaxed grains to textured polycrystals with ellipsoidal grains of arbitrary crystal symmetry. In term of this work, one can predict both the scattering-induced attenuation and phase velocity from Rayleigh region (wavelength >> scatter size) to geometric region (wavelength << scatter size) for an arbitrary incident wave mode (quasi-longitudinal, quasi-transverse fast or quasi-transverse slow mode) in a textured polycrystal and examine the impact of crystallographic texture on attenuation and phase velocity dispersion in the whole frequency range. The predicted attenuation results of this work also agree well with the literature on a textured stainless steel polycrystal. Furthermore, an analytical expression for quasi-static phase velocity at an arbitrary wave propagation direction in a textured polycrystal is derived from the SOA model, which can provide an alternative homogenization method for textured polycrystals based on scattering theory. Computational results using triclinic titanium polycrystals with Gaussian orientation distribution function (ODF) are also presented to demonstrate the texture effect on attenuation and phase velocity behaviors and evaluate the applicability and limitation of an existing analytical model based on the Born approximation for textured polycrystals. Finally, quasi-static phase velocities predicted by this work for a textured polycrystalline copper with generalized spherical harmonics form ODF are compared to available velocity bounds in the literature including Hashin–Shtrikman bounds, and a reasonable agreement is found between this work and the literature.
1. Introduction
Polycrystals or polycrystalline materials are solid aggregates of numerous individual crystallites (or grains) of varying morphology, size and crystallographic orientation, where the grains are bonded together by grain boundaries. Polycrystals thus are heterogeneous materials in grain scale. The majority of inorganic solids such as common metals, ceramics and rocks are polycrystals. Due to their significance in various industries, polycrystals are one of the major objects of study in non-destructive evaluation (NDE) and seismology. One significant but challenging topic related to polycrystals in NDE and seismology is the elastic wave scattering and the resulting attenuation in polycrystals. It has been studied for decades [1,2,3,4,5,6,7,8] but elastic wave scattering in complex polycrystals is still not well understood.
Elastic waves propagating in heterogeneous polycrystals are subject to scattering at the grain boundaries due to the misorientation between adjacent grains [9,10,11,12], and this further induces beam attenuation due to energy dissipation from the main ultrasonic beam. Although there are various wave attenuation mechanisms in polycrystalline materials such as viscosity [13] and relaxation [14], in many cases the main source of attenuation is wave scattering [5,11] and it has been experimentally proved by a study [15]. The scattering-induced attenuation in polycrystalline materials has an important implication of microstructure information [10,16,17] and thus has been extensively applied to the nondestructive characterization of grain microstructures [18,19]. It is worthy to mention that many studies [20,21,22,23] recently emerge on finite element modeling (FEM) of elastic wave attenuation in polycrystals. However, FEM is a numerical method and it has limited practical application to the ultrasonic characterization of grain microstructures. Due to the industrial needs of ultrasonic characterization of microstructure characteristics from ultrasound measurements, many studies [1,2,3,4,5,6,7,8,9,10,11,12,13,14,15,16,17,18,19,20,21,22,23] have strived to develop analytical attenuation models for polycrystalline materials with a variety of complexities such as the low symmetry constituents [7,24,25,26,27], the duplex microstructure [10] and the columnar grains [28].
Numerous attenuation models have been reported for statistically isotropic polycrystals and they fall into four different catalogues: the Karal and Keller model [29], perturbation theory [3,4,30], Weaver type model [5], and the spectral function method [31,32]. The Karal and Keller model [29] is limited to scalar wave attenuation while the Stanke and Kino model [3], a unified model based on perturbation theory and suitable for the whole frequency range, was constrained to macroscopically isotropic polycrystals with equiaxed cubic grains. It is worth mentioning that the Stanke and Kino model [3] has been extended to cubic polycrystals with ellipsoidal shape grains [28]. Weaver [5] systematically derived another attenuation model for elastic waves in texture-free polycrystals by Dyson equation. The Dyson equation in Ref. [5] is general for all polycrystals but the successive derivations were based on the Born approximation (applicable frequency is below the geometric region where wavelength << scatter size) and its explicit expressions were limited to cubic polycrystals without crystallographic texture. A recent study [33] also targeted on texture-free polycrystals has shown that Weaver’s model [5] can be converged to the Stanke and Kino model [3] using numerical iteration. Cavlet and Margerin [32] proposed a spectral function method to model the wave attenuation and phase velocity in texture-free polycrystalline materials at all frequency regions; their development [32] is limited to orthotropic symmetry crystallites [32]. Cavlet and Margerin [32] also drew a comparison to the Stanke and Kino model for cubic iron polycrystals, and it indicates that their model [32] is comparable to the Stanke and Kino model [3]. An intriguing finding in Ref. [32] is that two branches exist for attenuation and phase velocity while Stanke and Kino [3] only calculated one branch. Recently, Cavlet and Margerin [34] further investigated the grain shape effect on attenuation and phase velocity using the spectral function method for texture-free cubic polycrystals. All these studies [3,5,32,33,34] have developed second-order attenuation models, since they consider some multiple scattering events in the mean Green function [35]. Another second-order attenuation model, a far-field attenuation model [36], following Weaver’s approach [5], has been developed for macroscopically isotropic triclinic polycrystals of ellipsoidal grains [36] and it is reasonably close to the Stanke and Kino model [3] and spectral function method [32]. A recent study [23] has reported a full-wave second-order attenuation (SOA) model for texture-free cubic polycrystals by extending Weaver’s approach [5], and the SOA model has a reasonable agreement with Stanke and Kino model [3] and finite element modeling [23]. All these analytical models [3,5,23,29,32,34,36] above are only applicable for macroscopically isotropic polycrystalline materials; however, crystallographic texture generally exists in natural and man-made materials such as rocks and metals causing macroscopically anisotropic properties [37]. Thus, more general attenuation models are desired to take account of crystallographic texture.
Modeling of elastic wave attenuation in textured polycrystals has also attracted the attention of some researchers. For polycrystals with preferred crystallographic orientation, the Weaver model [5], Hireskorn model [4,30], and the Stanke and Kino model [3] have been extended to textured polycrystalline materials with crystallites of different symmetry classes and shapes by Refs. [6,38,39,40,41]. However, the models in Refs. [6,39,40,41] that presented explicit attenuation coefficients by the Born approximation break at high frequency, and the accuracy of the Born approximation has never been investigated for textured polycrystals. These models in Refs. [6,39,40] also fail to provide any information about the phase velocity in textured polycrystalline media that is of practical importance in ultrasonic nondestructive testing and seismology (analytical expressions for velocities in Ref. [41] are not applicable to high-frequency regions, e.g., stochastic regime). Note that the model developed in Ref. [38] based on the Stanke and Kino model [3] adopted the Green function for isotropic reference media instead of that for anisotropic reference media, making it an unrigorous model although it was a significant development in the 1990s. The latest development of attenuation modeling in Ref. [40] accounted for aggregates of triclinic grains in ellipsoidal shape with arbitrary texture symmetry and obtained explicit equations for attenuation coefficients; however, it was implemented under the frame of the Born approximation [40] and had no attempt to predict phase velocity behavior in textured polycrystal due to the complexity of mass operator (self-energy operator) [5] in anisotropic media. Therefore, the attenuation and phase velocity behaviors of elastic waves in the textured polycrystals have not been well understood.
This work aims to develop a second-order attenuation model for a textured polycrystalline aggregate of triclinic crystallites in ellipsoidal shape by extending an existing study [23] for texture-free polycrystals. It also investigates the accuracy and applicability of the Born approximation, which will define the boundary between single-scattering theory [12] and diffusion theory [12], and the behaviors of phase velocity in different frequency regimes. The work will degenerate to previous analytical models [5,23] when the crystallographic texture of a polycrystal is extremely weak. Although a recent paper has studied grain number impact on attenuation [42] by synthetic grain microstructures, this work still focuses on polycrystals composed of infinite grains or a sufficiently large number of grains (so that grain number impact is negligible), just as most of the previous studies. Several novelties exist in this work compared to previous studies [23,40]: it is the first time integrating the Green function for anisotropic reference media into an attenuation model, implementing numerical calculation of the full mass operator (including Cauchy Principal value in the real part) and solving the dispersion equation for a textured polycrystal of triclinic grains; the SOA model for textured polycrystals is further validated by comparing to available FEM results and experimental data on a textured stainless steel sample; to our best knowledge, it is also the first time to investigate the accuracy and limitation of the Born approximation on textured polycrystals and examine the texture impact both on attenuation and phase velocity at whole frequency range; as another original development of this work, an explicit expression for quasi-static velocities at an arbitrary wave propagation direction in textured polycrystals of triclinic elongated grains is derived in this paper and obtained quasi-static velocities from this work are compared to available bounds in the literature on a polycrystalline copper.
This paper is structured as follows. The relevant theoretical background is first reviewed in Section 2. It is followed by the SOA model for textured polycrystals and its asymptotes for attenuation and phase velocity at the Rayleigh region. In Section 4, comparisons are drawn between the SOA model developed in this work and other studies on textured polycrystals to justify the SOA model and examine the limitation of the Born approximation. The texture impacts on attenuation and phase velocity are also studied. The quasi-static velocities from the SOA model are further compared on a polycrystalline copper with available velocity bounds in the literature. Finally, conclusions are provided.
2. Theoretical Background about Attenuation Modelling in Textured Polycrystals
This section will introduce the theoretical background of attenuation modeling for textured polycrystalline materials. Firstly, a quantitative texture description, namely orientation distribution function (ODF), is introduced. Furthermore, based on the Weaver type model [5] some fundamentals of attenuation modeling for polycrystalline materials are reviewed. Finally, one key element of attenuation modeling, the two-point correlation function, is addressed.
2.1. Orientation Distribution Function (ODF)
Statistical isotropy is the ideal status of polycrystalline materials and crystallographic texture widely exists in man-made and natural polycrystalline materials such as metals and minerals [7,43,44]. In other words, the crystallographic orientations of crystallites in an actual polycrystals aggregate are not perfectly randomized; instead, grain orientations are aligned in certain directions and the whole aggregate thus presents anisotropic properties.
2.1.1. Generalized Spherical Harmonics ODF
To bridge the gap between the property of individual crystallites and that of the assembly, one needs to know the crystallographic orientation distribution of crystallites that presents the probability density of a given orientation direction in 3D space. Intensive studies were reported to quantify the orientation distribution of crystallites in the past [43,45,46,47]. Well-known terminologies of orientation distribution functions (ODF) for quantitative texture analysis are from Bunge [43] and Roe [46]. Both are in terms of generalized spherical harmonics, although different rotation angles are used.
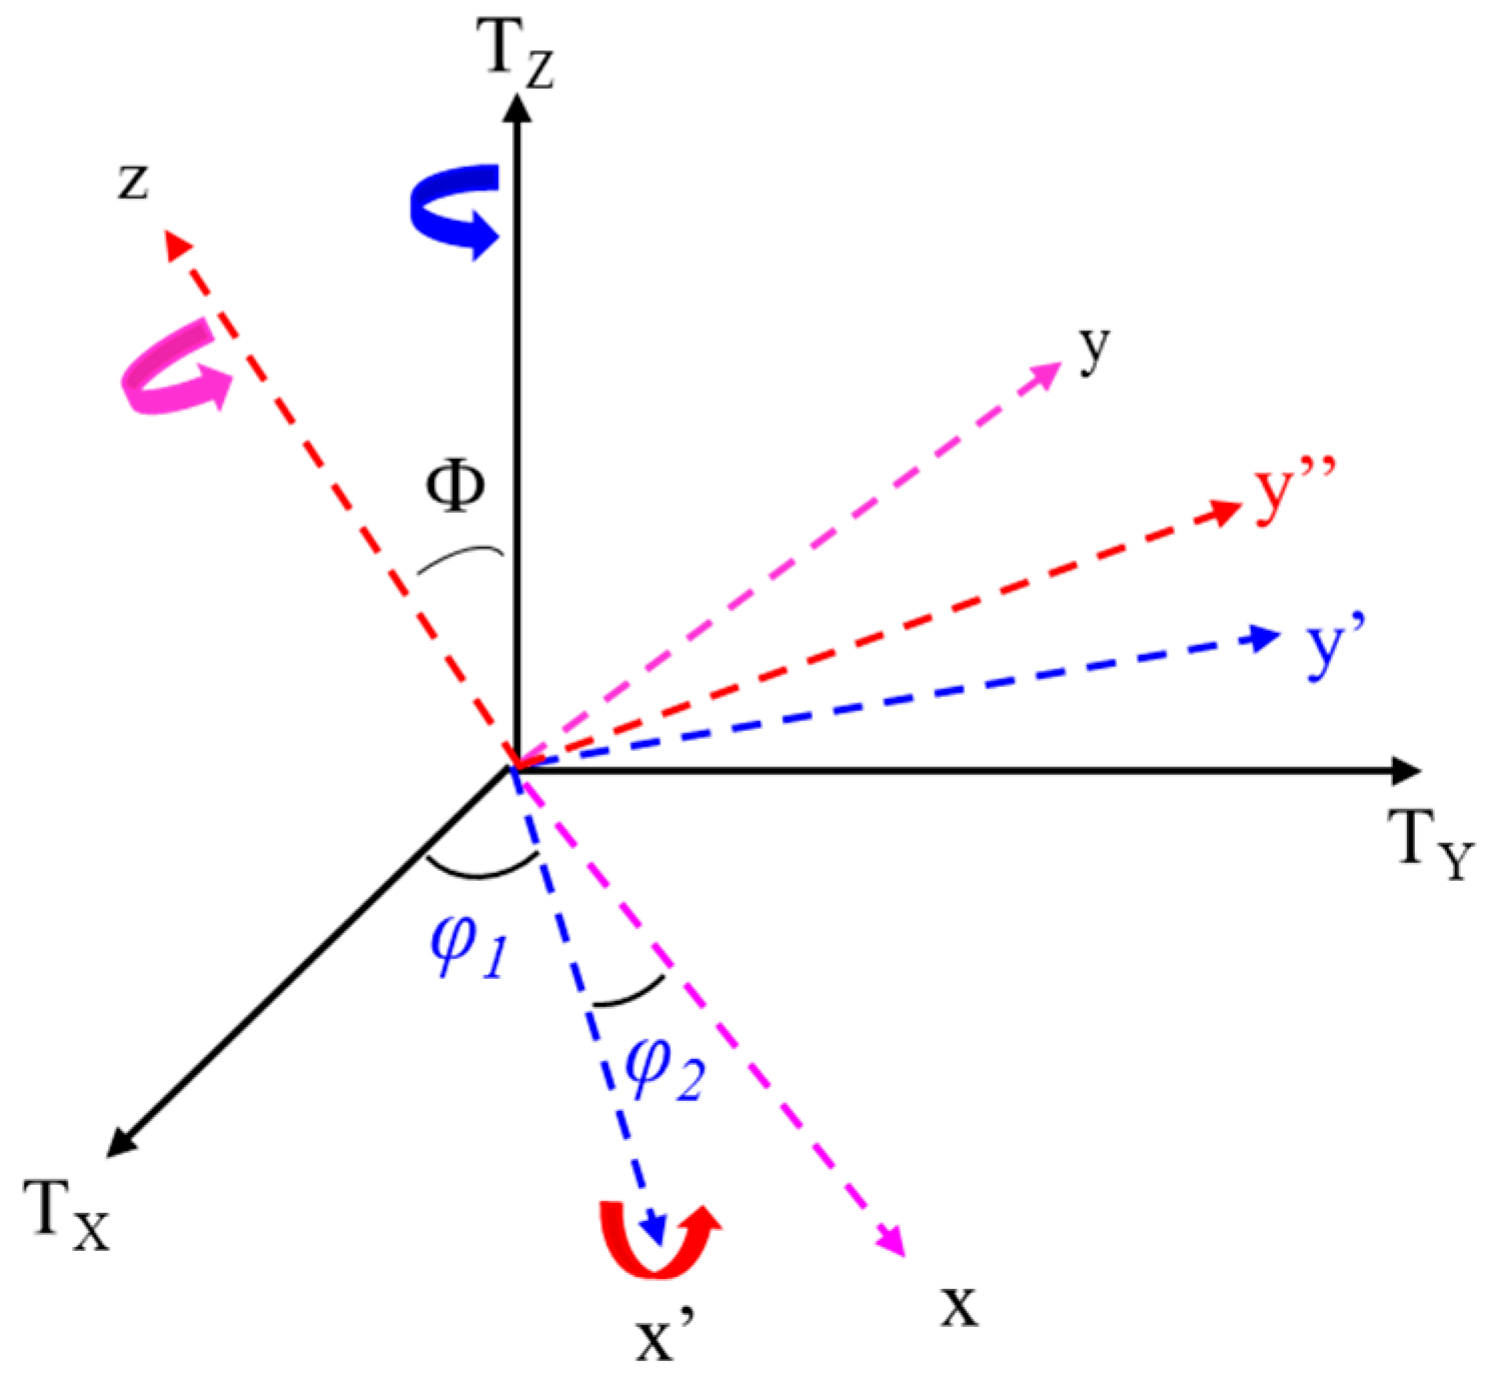
Here we follow the ODF in Bunge’s terminology [43]. To describe the three-dimensional ODF by generalized spherical harmonics, the representation of rotation from crystallite coordinate to global coordinate should be well defined. In Bunge’s notation [43], the three Eulerian angles describing 3D rotation are φ1, Φ, φ2, which are shown in Figure 1. To rotate the global texture coordinate to the crystallite coordinate, one has to follow such a procedure [43]: first, rotate about the TZ axis through the angle φ1; then rotate about x’ axis by the angle Φ and finally rotate about z-axis by the angel φ2. Therefore, the rotation matrix in Bunge’s Euler rotation angles is:
The ODF in Bunge’s notation expressed by generalized spherical harmonics from Ref. [43] is:
where are texture coefficients and polynomial function [43], and are integers (0 ≤ l ≤ ∞; however, l ≤ 32 in practical texture measurements). The polynomial function is defined in Ref. [43] as:
where x is defined as x=cosΦ for simplicity. It represents a series of mutually orthogonal bases since this relation holds [43]:
2.1.2. Gaussian form ODF
Although the generalized spherical harmonics form ODFs [43,46] are widely used in material science and engineering, one should note that there are other forms of ODF existing in the literature [47,48,49,50,51,52]. For example, Gaussian-shape ODF as reported by references [47,48,49,50] has been utilized as a simple tool to investigate the texture effect on piezoelectricity and elasticity. As described in Ref. [50], the 3D Gaussian shape ODF is:
where σφ1, σΦ, σφ2 are texture parameters and the factor F0=S1csch(S1)/[I(0,S2)I[0,S3]] satisfies this equality . Here, S1=1/(2σΦ), S2= 1/(2σφ1), S3=1/(2σφ2) and I(0,S2), I(0,S3) are modified Bessel functions of the first kind [50], and φ1, Φ, φ2 are three Euler angles defined by Bunge notation as shown in Figure 1. In this representation, the texture parameters σφ1, σΦ, σφ2 in the Gaussian ODF can be directly related to the full width at half maxima (FWHMs) of texture angles φ1, Φ, φ2 from experimental orientation imaging microscopy [39,47]. When all three parameters σφ1, σΦ, σφ2 approach infinity the ODF degenerates to the case of statistically isotropic polycrystals. When two of them go to infinity, the ODF would be equivalent to fiber (axisymmetric) texture like Refs. [39,53]. Note that ODFs in different notations are related to each other, for example, the relation between Bunge’s ODF and Roe’s ODF has been investigated in Ref. [54] and the conversion from 1D Gaussian ODF to Roe’s ODF has been proposed in Refs. [49,53].
2.2. Theoretical Background of Attenuation Modelling
Although there are three types of theories available for modeling elastic wave attenuation (perturbation method [3,4,30], spectral function method [32], and Dyson equation [5]), here we only focus on the theoretical background of Dyson equation method [5].
As stated in Refs. [5,6,40], the elastodynamic response at a location to a point load in inhomogeneous media at is (all the equations below in the paper are in tensor nation and follow the Einstein summation):
where , a fourth-order tensor, is the variation of normalized elastic constants from the reference medium, δjα means Kronecker delta (a second-order tensor) and stands for the homogenized elastic constants. ω is the angular frequency. The elastic constant at a given location X is equal to the elastic constants of its reference medium plus a spatial fluctuation term, namely:
where the ensemble average of elastic constants is and the symbol < > denotes ensemble average over all grains. Note that the reference media is anisotropic for textured polycrystals. It implies that the statistical average of the spatial fluctuation term is zero from Equation (7), as explained in Refs. [5,40].
As stated in Refs. [5,6], the solution of the elastodynamic equation at a certain location is unsolvable, but the mean Green function response in the heterogeneous polycrystals can be obtained by the Dyson equation:
where is the Green function of a homogenized medium or reference medium. is the mass operator or self-energy accounting for all possible scattering events [55] between location Y and location Z. The mass operator may be expressed in a diagrammatic form including infinite series [56]. However, the exact equation for the mass operator is difficult to obtain but finite order approximation is employed instead in references [35,56]. Under the weak scattering assumption , the mass operator after first order smoothing approximation (FOSA) is [6]:
where is the Green function for the homogenized medium and δcijql is the spatial variation of elastic constants. The mass operator in Equation (9) includes some second-order scattering events according to Refs. [35,56]. From Equation (9), the mass operator is relevant to the covariance of elastic constants fluctuation at two different points, namely the two-point correlation [5].
After spatial Fourier transform of the double convolution, the Dyson equation can be simplified as [5]:
Since the Green function in anisotropic reference media satisfies this equation [6,40]:
after spatial Fourier transform on both side of the equation above one obtains:
The tonsorial form (dyadic) Green function in Equation (12) of an anisotropic homogenized medium can be decomposed into three components according to the spectral method (matrix decomposition) [40,57]:
where are eigenvalues (M is a wave mode in anisotropic media, quasi-longitudinal, quasi-transverse fast or quasi-transverse slow mode), p is the unit wave normal vector, and denotes dyadic product. The phase velocity VM and polarization vector at a certain wave propagation direction are determined through Christoffel’s Equation [40]:
where pj is a component of wave normal vector p and ρ denotes the mass density of the medium. The phase velocity VM is the square root of the eigenvalue of the matrix for wave mode M and polarization vector u is the corresponding eigenvector. In a textured polycrystal, there are three wave modes: quasi-longitudinal (L) mode, quasi-transverse fast (T1) mode and quasi-transverse slow (T2) mode. Unlike the isotropic media, the polarization direction of a quasi-longitudinal wave generally deviates from its wave propagation direction while the polarization directions of a quasi-transverse wave are not perpendicular to its wave propagation direction. However, three polarization vectors are still mutually perpendicular to each other.
2.3. Two-point Statistics for Textured Polycrystals
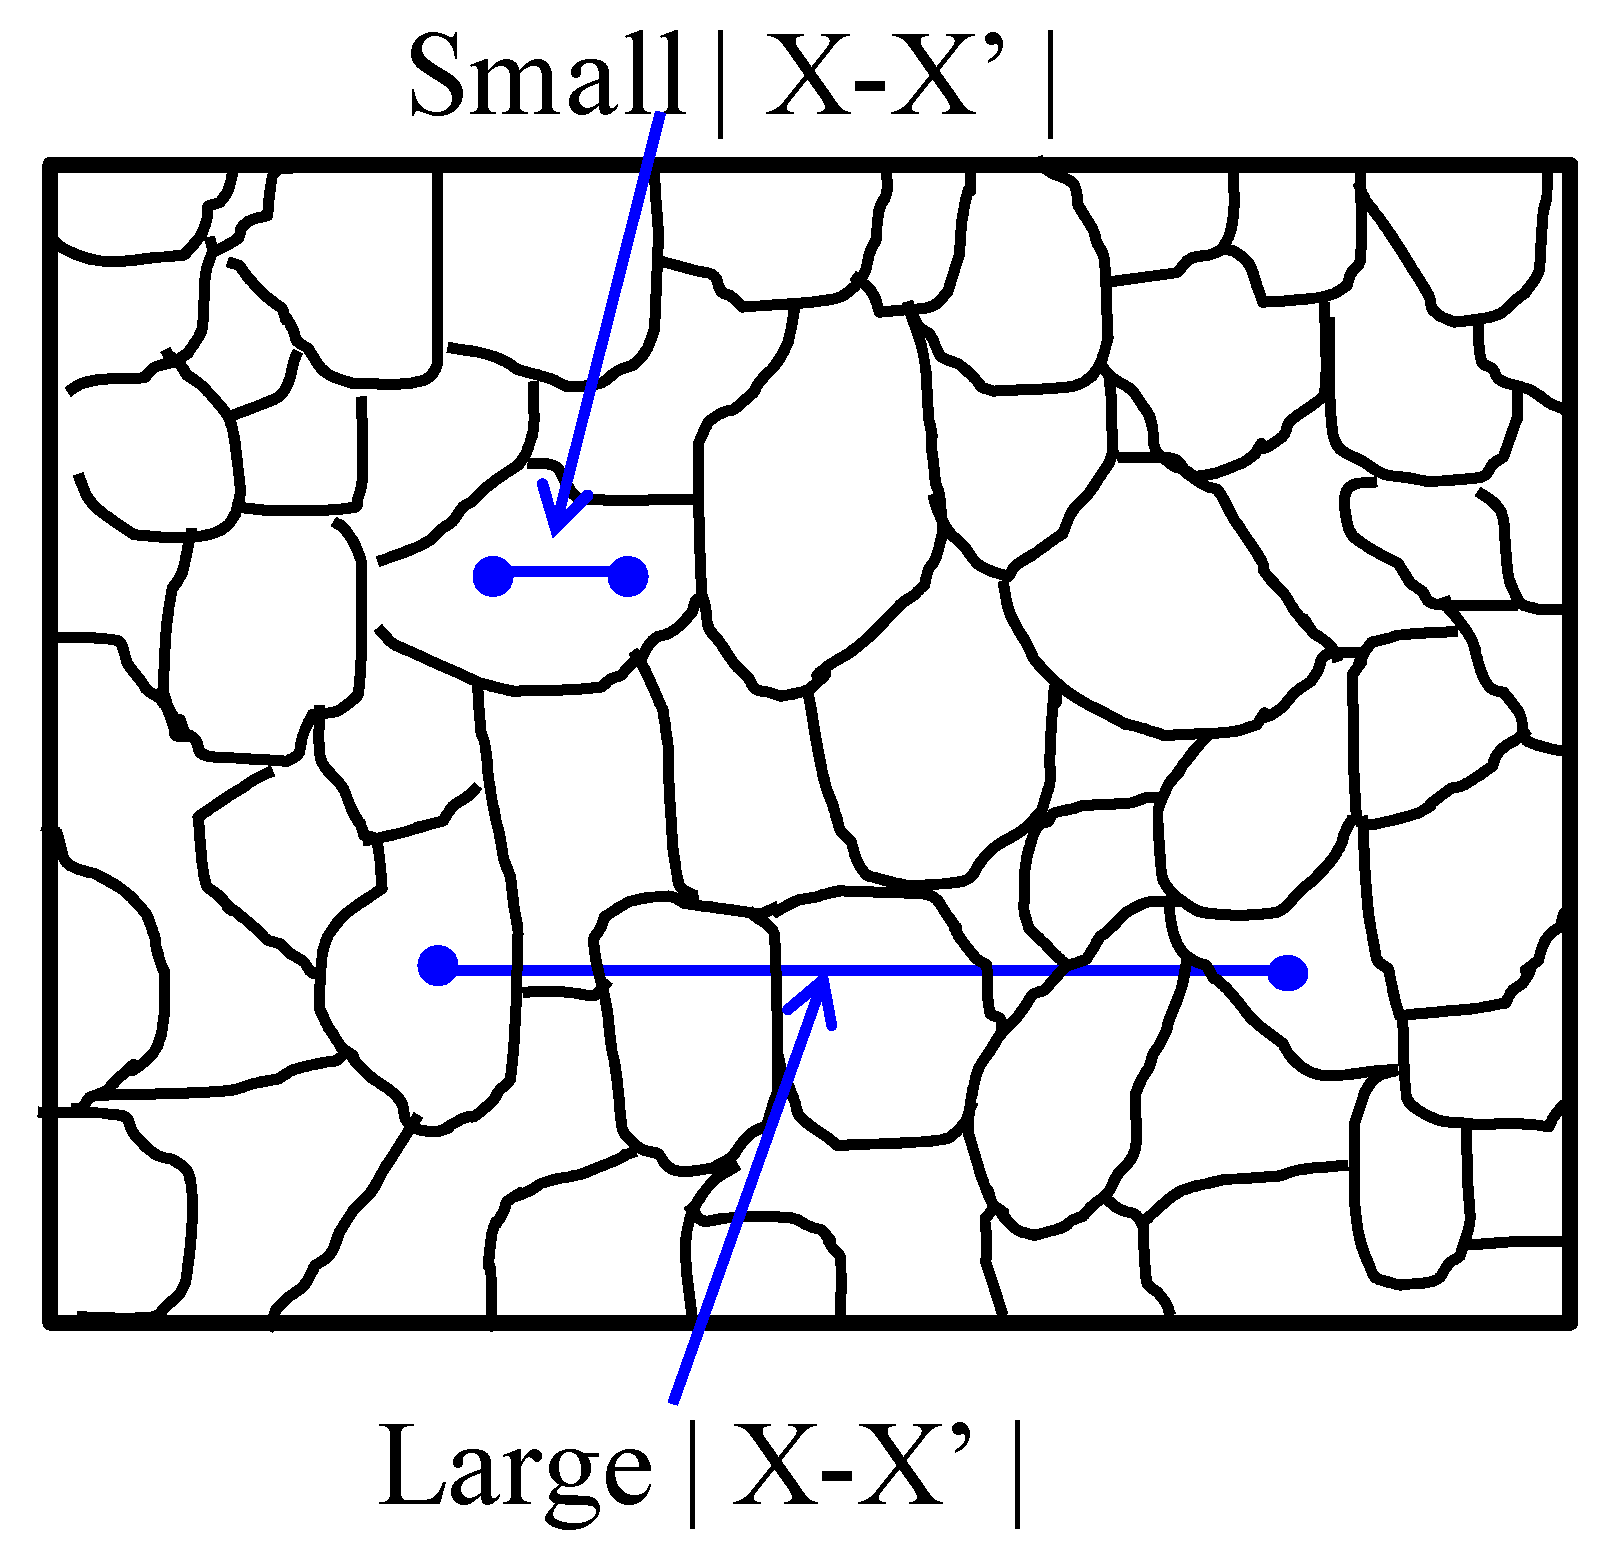
The mass operator aforementioned is related to the two-point correlation function that is expressed as δcijkl(X)δcαβγδ(X’), a covariance of elastic constants fluctuation from two points X and X’ (see the schematic of a polycrystal in Figure 2). Since we are solely interested in the mean wave response in heterogeneous polycrystals, the ensemble average of this covariance is critical. From statistics of numerous grains, the ensemble average of elastic covariance can be further decomposed into two parts: the volumetric average of elastic constants variation covariance and geometric two-point correlation (GTPC) function [6,40]. The mathematical expression is:
where <δcijkδcαβγδ> is the ensemble average of elastic constants variation covariance for textured polycrystals by Voigt averaging [58]. It can be numerically calculated through single-crystal elastic constants and ODF by the following equation [40,50,59]:
where the effective elastic constants by Voigt averaging and the elastic constants covariance for a polycrystals aggregate are [40,50,59]:
Here cijkl(φ1, Φ, φ2) and f(φ1, Φ, φ2) are the rotated single-crystal elastic tensor and ODF (either Gaussian ODF or generalized spherical harmonics ODF), respectively. The elastic constants rotation matrix and details about elastic constants covariance calculation can be found in Refs. [39,40,50,53,59]. It is worthy to mention that Voigt effective elastic constants (or called Voigt reference media) are used in this whole paper because it is more suitable for wave scattering modeling [23,60], although different homogenization methods like self-consistent reference medium are available for polycrystalline media [58,61]. Ref. [23] has compared the SOA models (for texture-free polycrystals) with Voigt reference medium and self-consistent reference medium to finite element modeling and found that the SOA model with Voigt reference medium agrees much better with FEM results.
The spatial two-point correlation function from Equation (16) only depends on the geometric characteristics of grain microstructure. Physically, it addresses the probability that two points and fall into the same grain. In a polycrystal aggregate shown in Figure 2, the probability of two points with a shorter distance falling into the same grain is always higher than that of two points departing by a larger distance. For a realistic polycrystalline material, its spatial two-point correlation function can be determined by the line intercept method from numerous microstructure cross-sections [62]. Under the assumption that line intercepts on a cross-section follow a Poisson distribution, an exponential form GTPC function was initially proposed by Stanke [62] and it has been adopted by many other publications [6,7,9,24,40,48,50,59,63]. The mere parameter governing the exponential GTPC is the mean line intercept (or called cord length) [62].
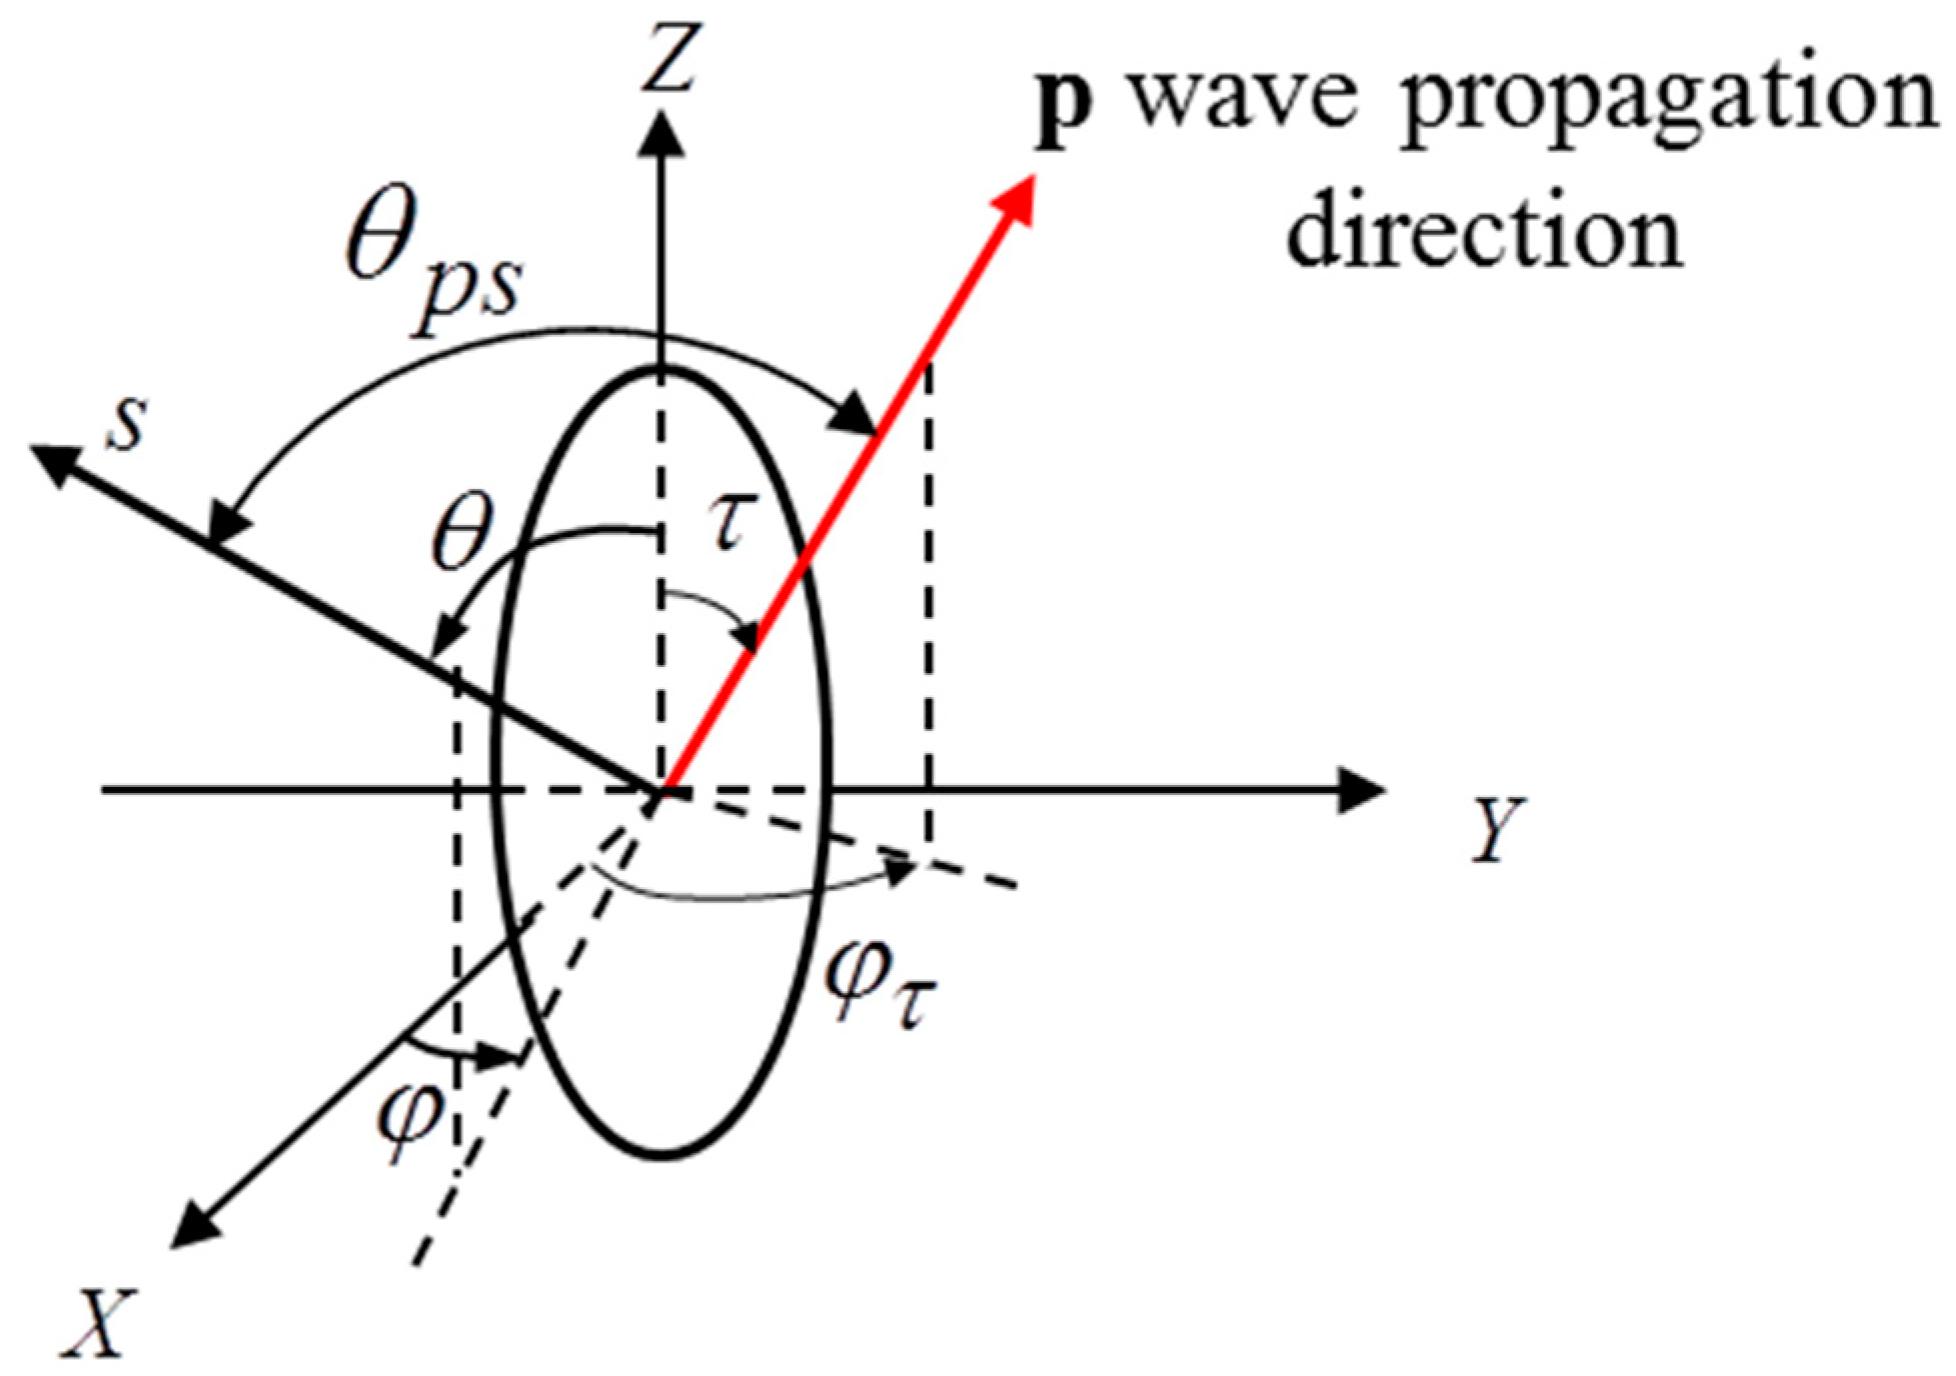
In this paper, it is still assumed that the geometric two-point correlation function is in exponential form but the polycrystals contain ellipsoidal shape grains with three (statistically mean) semi-principal axes and (see Figure 3). According to Refs. [9,24,40,50,59,64,65], the spatial two-point correlation function W(r) for general ellipsoidal grains is:
Considering an incident wave propagating in direction and a scattered wave in direction (shown in Figure 3), according to Refs. [9,24,40,50,59,64], the two-point correlation function in spatial Fourier domain W (q) is:
where related to the incident wavenumber k and the scattered wavenumber . Here N stands for a scattering wave mode in an anisotropic medium, namely a quasi-longitudinal mode, a quasi-transverse fast mode or a quasi-transverse slow mode.
3. Second-order Scattering Model for Textured Polycrystals with Ellipsoidal Triclinic Grains
This section will develop the SOA model for textured polycrystals with triclinic grains of ellipsoidal shape. The asymptotes at Rayleigh limit for attenuation and phase velocity will also be derived.
3.1. Dispersion Equation
As stated in Ref. [40], the mass operator after spatial Fourier transform is:
where means incident wavenumber and denotes scattered wavenumber. is the ensemble average of elastic constant covariance and stands for the GTPC function in the spatial Fourier domain. Similar to the Green function in a homogenized medium, the mass operator and the mean Green function can be rewritten into dyadic form via spectral method [36,40]:
where means the eigenvalue of at a wave mode M and the mean response of an incident wave mode M is [6,40]:
Since the denominator of the mean Green function should equal to zero, the dispersion equation is expressed as [6,40]:
where k=Re(k)+iα is a complex wavenumber in the perturbed medium. The real part provides frequency-dependent velocity while the imaginary part corresponds to the beam attenuation. One should note that are direction-dependent.
After substituting Equation (22) into Equation (21) and rewriting the tonsorial mass operator via Equation (22), one can obtain the expression for . For a certain incidence wave M, the mass operator is the sum of three scattering terms ( L-L scattering, L-T1 scattering and L-T2 scattering [40]):
where the inner product is expressed as [40,50]:
where u and v are the polarization vectors corresponding to the incident wave and scattered wave, respectively.
To calculate the integration in mass operator, an explicit branch (upper half-space or lower half-space) of the spectral Green function for anisotropic reference media should be chosen. Here we introduce an infinite small imaginary value ε in Green function to choose the upper half-space, and according to the Sokhotskyi–Plemelj theorem [32,36] the Green function is rewritten as:
where P.V. stands for Cauchy principal value.
After substituting Equation (27) into Equation (25), the components of the mass operator can be rewritten as:
where the GTPC function spatial Fourier domain is [40,50,59]:
where and .
Equation (28) is composed of nine scattering components, namely nine M-N scattering scenarios. For example, three scattering components of the mass operator corresponding to a quasi-longitudinal incidence wave are:
Similarly, one can find the mass operator components for a quasi-transverse fast (T1) or quasi-transverse slow (T2) incidence wave.
Since analytical solutions to complex wavenumber k are difficult to obtain, the mass operator including the inner product and the dispersion Equation (24) have to be solved numerically. In this study, all calculations are implemented by FORTRAN code since its IMSL numerical libraries provide subroutines that can compute the Cauchy principal values in the mass operator elegantly. FORTRAN also has relatively high computational efficiency. Compared with the SOA model in Ref. [23] for the texture-free polycrystals, computation of the Cauchy principal value and solving dispersion equation are much more time-consuming for textured polycrystal cases even on a workstation. Empirically, obtaining one data point of perturbed wavenumber may take tens of hours.
3.2. Analytical Equations for Attenuation Coefficient and Phase Velocity
3.2.1. Attenuation Coefficient and Phase Velocity by the Born Approximation
In practical applications such as nondestructive evaluation and seismology, the Born approximation is widely used since it simplifies the interpretation of the acoustic signals [9,10]. Physically, the Born approximation assumes very weak scattering, with a result that the perturbed wavenumber in grains is equal to the unperturbed wavenumber. After applying the Born approximation to the dispersion equation (24), the perturbed complex wavenumber can be explicitly expressed as:
where the mass operator after applying the Born approximation is:
Note that the difference between Equation (34) and Equation (28) is that the complex wavenumber in Equation (28) is replaced by the unperturbed wavenumber .
Based on the Born approximation, one can retrieve the attenuation coefficient from the imaginary part of the perturbed wavenumber by Equations (33) and (34), and the result is:
which has been reported in Ref. [40].
Now we examine the real part of the perturbed wavenumber that governs the phase velocity in textured polycrystalline materials, and it has never been studied in previous studies [6,39,40,59]. From Equations (33) and (34), the real part of the complex wavenumber is explicitly rewritten as:
From Equation (36), the frequency-dependent phase velocity can be finally obtained as:
Explicit expressions for the attenuation and phase velocity thus have been obtained in this section. However, due to the intrinsic limitation of the Born approximation [66], the explicit expressions, Equations (35) and (37) for attenuation and phase velocity solely validate for the frequency below the geometric region.
3.2.2. Attenuation at Rayleigh Limit
The attenuation and phase velocity obtained from the Born approximation also can predict the asymptotic behavior of the attenuation and phase velocity. At Rayleigh limit, the wavenumber kM approaches zero and , thus the attenuation coefficient at Rayleigh limit by Equation (35) becomes:
where is the effective grain volume. Thus, the attenuation is proportional to the grain volume and fourth power of frequency at the Rayleigh region, and Equation (38) is consistent with the Rayleigh limit derived in Ref. [40].
3.2.3. Quasi-Static Phase Velocity
One remarkable aspect of the asymptotic complex wavenumber at Rayleigh limit is that it can provide quasi-static velocity for textured polycrystalline materials at an arbitrary wave propagation direction, from which one can retrieve the effective elastic constants of textured polycrystals (this inverse problem will not be addressed here). Homogenization of polycrystals is of great importance for predicting the mechanical properties of polycrystals and has drawn the attention of many researchers [58,61,67,68,69]. For statistically isotropic polycrystals, different velocity bounds, including Voigt–Reuss and Hashin–Shtrikman bounds [67], and a rather accurate prediction named self-consistent approach [61] have been developed to predict the effective elastic constants of grains ensemble. For textured polycrystals, Voigt–Reuss bounds [70,71] Hashin–Shtrikman bounds [72,73,74] and self-consistent approach [73,75] have also been reported, from which one can calculate the phase velocity of an incident elastic wave. Although the self-consistent approach in Refs. [73,75] is still limited to high-symmetry crystallites and certain texture symmetry, a recent study [74] developed Hashin–Shtrikman bounds for polycrystals with arbitrary crystallographic texture and triclinic crystallites. The quasi-static velocities also can be obtained in this work for aggregates of triclinic grains with arbitrary texture symmetry and it counts grain shape impact as well. The detailed derivation is given below.
When kM reaches zero, the Cauchy principal value can be analytically obtained by contour integral. After much simplification, the real part of the perturbed wavenumber at Rayleigh limit is obtained as:
From the equation above, the quasi-static velocity at a certain wave propagation direction p also can be obtained as:
It indicates that the quasi-static velocity is determined collectively by grain shape (related to R0 and R1), texture (affecting wave velocity and inner product) and wave scattering. For a polycrystal with known texture coefficient, single-crystal elastic constants, and grain sizes, the quasi-static velocity of an incident wave (QL, QT1 or QT2) at a certain direction can be predicted by Equation (40) and the elastic constants of the homogenized polycrystal also can be obtained inversely if sufficient phase velocities at different angles are available. For textured polycrystals with equiaxed grains, the expression for the quasi-static velocity can be further simplified as:
From Equation (41), the effective phase velocity is governed by texture and wave scattering. A similar homogenization method based on scattering theory for texture-free polycrystalline materials has been reported in Ref. [76], however, this work not only accounts for crystallographic texture impact on phase velocity but also provides explicit expressions for phase velocities (limited to second-order scattering). Therefore, Equation (40) provides a general formula for quasi-static velocities in polycrystals, from which one can estimate the effective elastic constants of grains ensemble.
4. Computational Results and Discussion
The focus of this section is on the computational results from the SOA model and comparisons to other models and available experimental results in the literature. First, the SOA model is validated by comparison to reported experimental attenuation data and finite element modeling results for a 316L stainless steel sample in references [22,77]. Furthermore, the applicability and limitation of the Born approximation are investigated and the texture impacts on attenuation and velocity are studied. Finally, the quasi-static phase velocities obtained in this work by Equation (40) are compared with available bounds on a textured polycrystalline copper.
4.1. Comparison of the SOA Model to Available FEM and Experimental Results
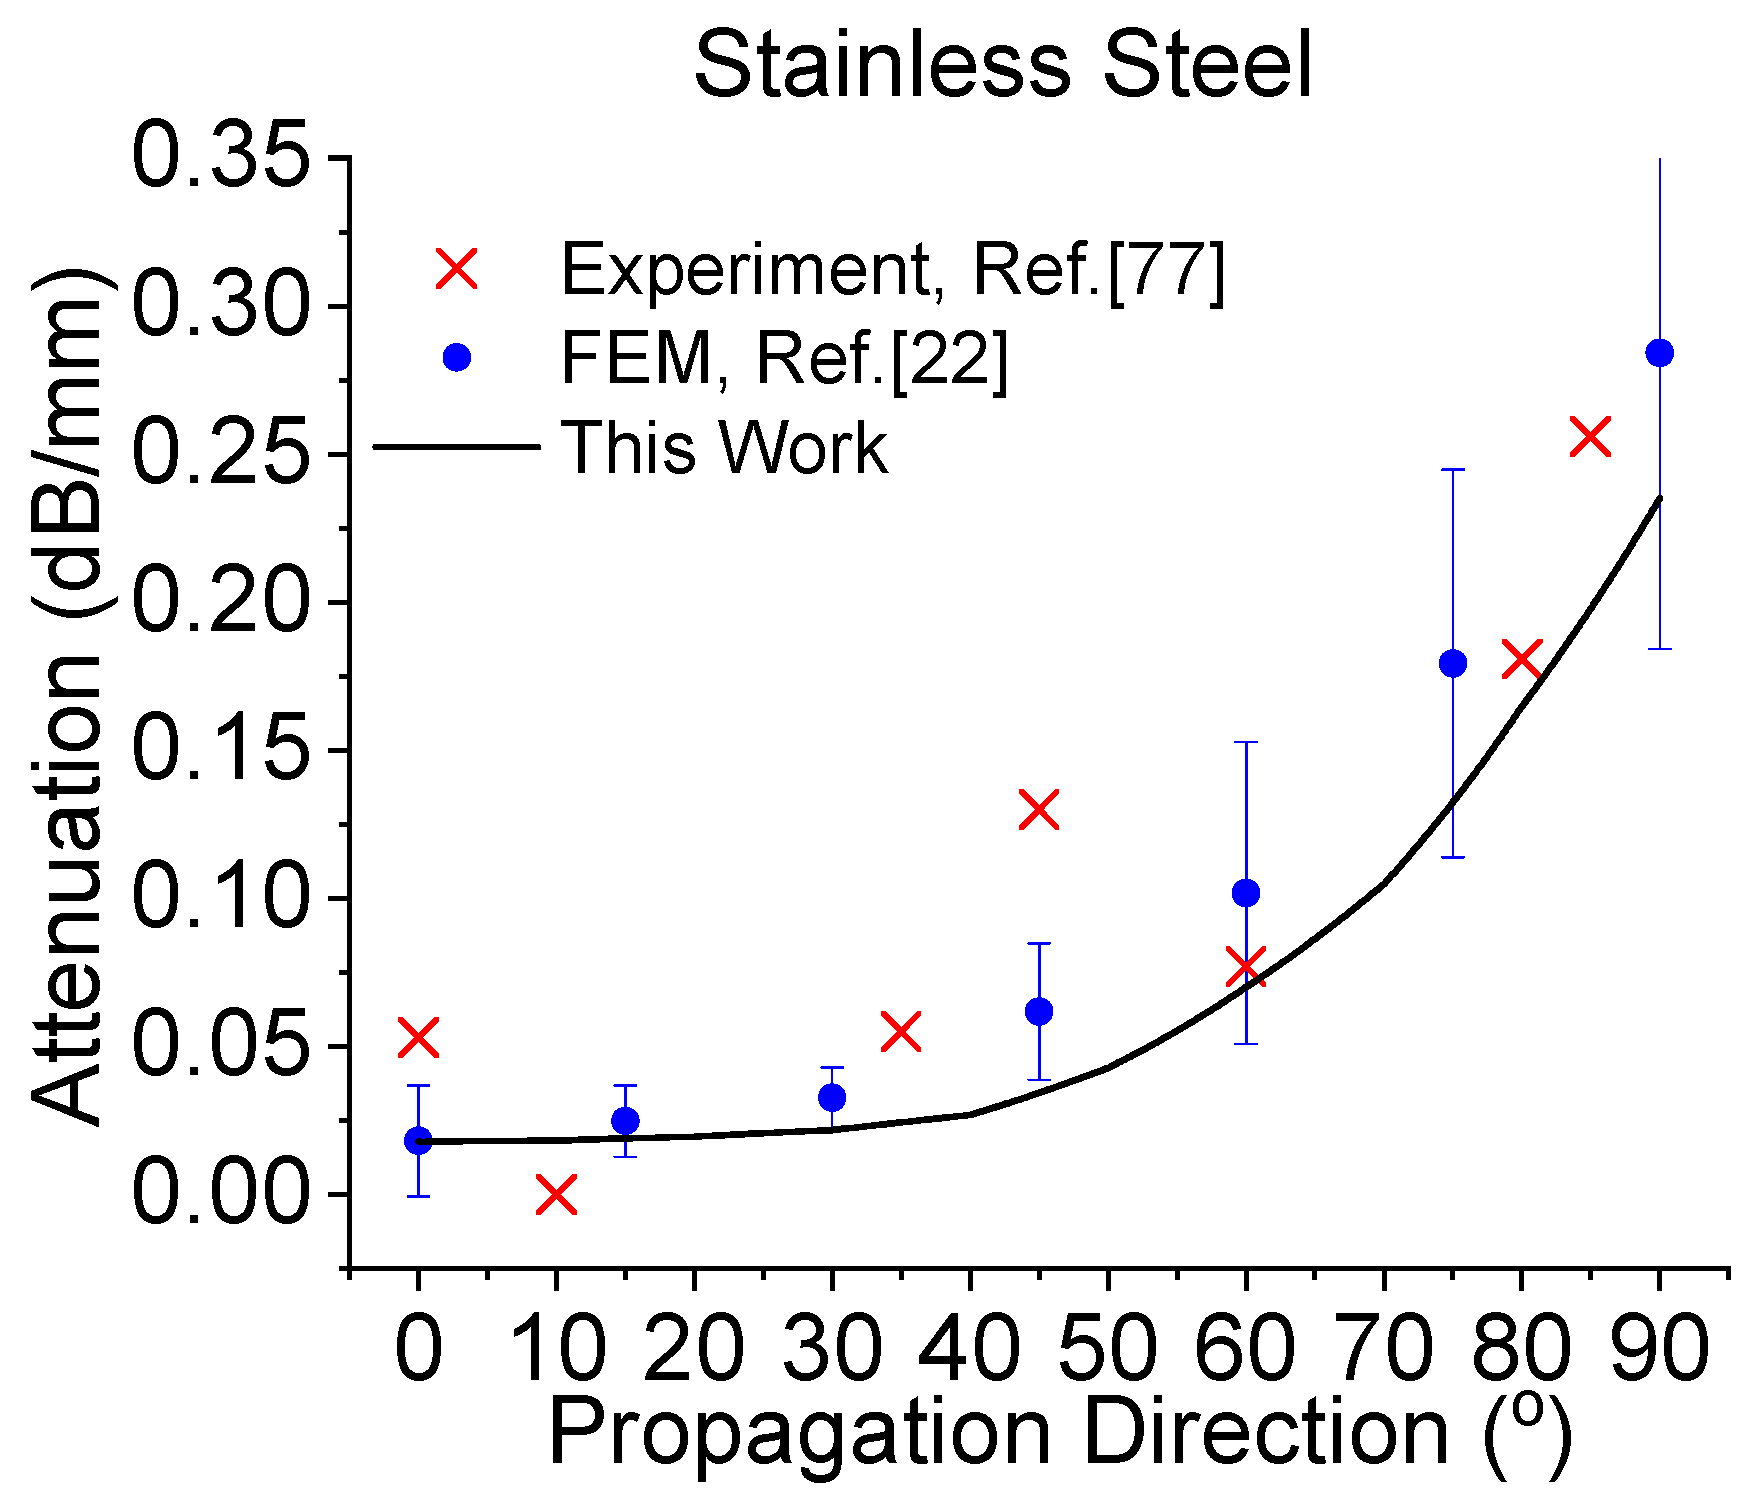
Since two recent studies [22,77] reported experimental attenuation results and FEM results on textured stainless steel and nickel alloy, it will be interesting to see the comparison between the SOA model in this work and references [22,77] considering these three are independent approaches. Here a textured stainless steel polycrystal with perfect transverse isotropy texture, mean grain diameter 0.25 mm and mean grain length 5 mm is chosen because its attenuation was experimental measured in Ref. [77] and numerically modeled by FEM in Ref. [22]. The single-crystal elastic constants, texture coefficients, and material density are also given in references [22,77]. Thus, attenuation coefficients can be calculated using the FORTRAN code by the SOA model for a quantitative comparison with references [22,77].
The comparison of quasi-longitudinal attenuation coefficients between the SOA model in this work and Refs. [22,77] for stainless steel is shown in Figure 4, where the data points for experiment and FEM are directly from Ref. [22,77] by an image digitizer. Unlike Refs. [22,77], where wave propagation direction is fixed while the grain orientation is treated as a variable, this work assumes that grain elongation direction is fixed (namely aligned with Z-direction) but the wave propagation direction τ changes from 0° to 90°. Obviously, these two computation methods are equivalent. From Figure 4, one can see that attenuation results from this work have a reasonable agreement with FEM [22] since the attenuation coefficients from this work fall within the error bar ranges of FEM. However, the SOA model somehow underestimates the attenuation coefficient (the predicted attenuation form the SOA model is lower than the corresponding mean attenuation of FEM at different angles). Besides, the SOA model agrees well with experiment measurements [77] except for angles 0°, 10° and 45°. Accurate attenuation measurement is difficult when the attenuation is too small (at angles 0 and 10 degrees) because the real attenuation is comparable to the measurement system error [78]. Normally, the experiment may deviate from the models by a fact of two [79] even when the attenuation is reasonably high. Therefore, a good agreement between the SOA model and the experiment is justified. Compared with experimental results, the SOA model also underestimates the attenuation. Such a systematic discrepancy may be caused by a finite number of grains in the stainless steel samples, since a recent study [42] reveals that grain number can impose an obvious impact on attenuation coefficient and attenuation shows more fluctuation on a finite number of grains. In other words, the FEM modeling [22] and experiment measurements [77] include grain number effect on attenuation coefficients while the SOA model in this work excludes this effect by assuming infinite grains. Another reason may be the assumption using perfect ellipsoidal grains in the SOA model to represent columnar 316L grains in Refs. [22,77]. Further investigation would require additional modeling and it is out of the scope of this work.
4.2. Applicability and Limitation of the Born Approximation on Textured Polycrystals
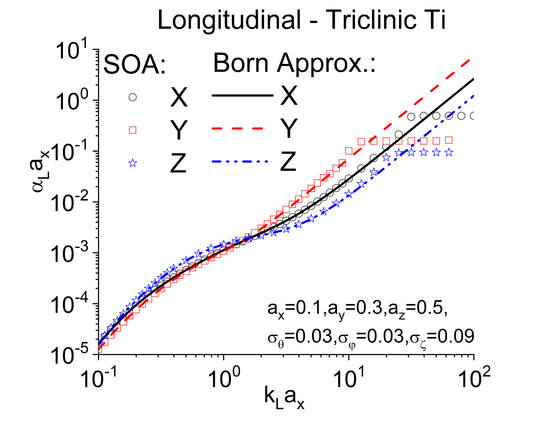
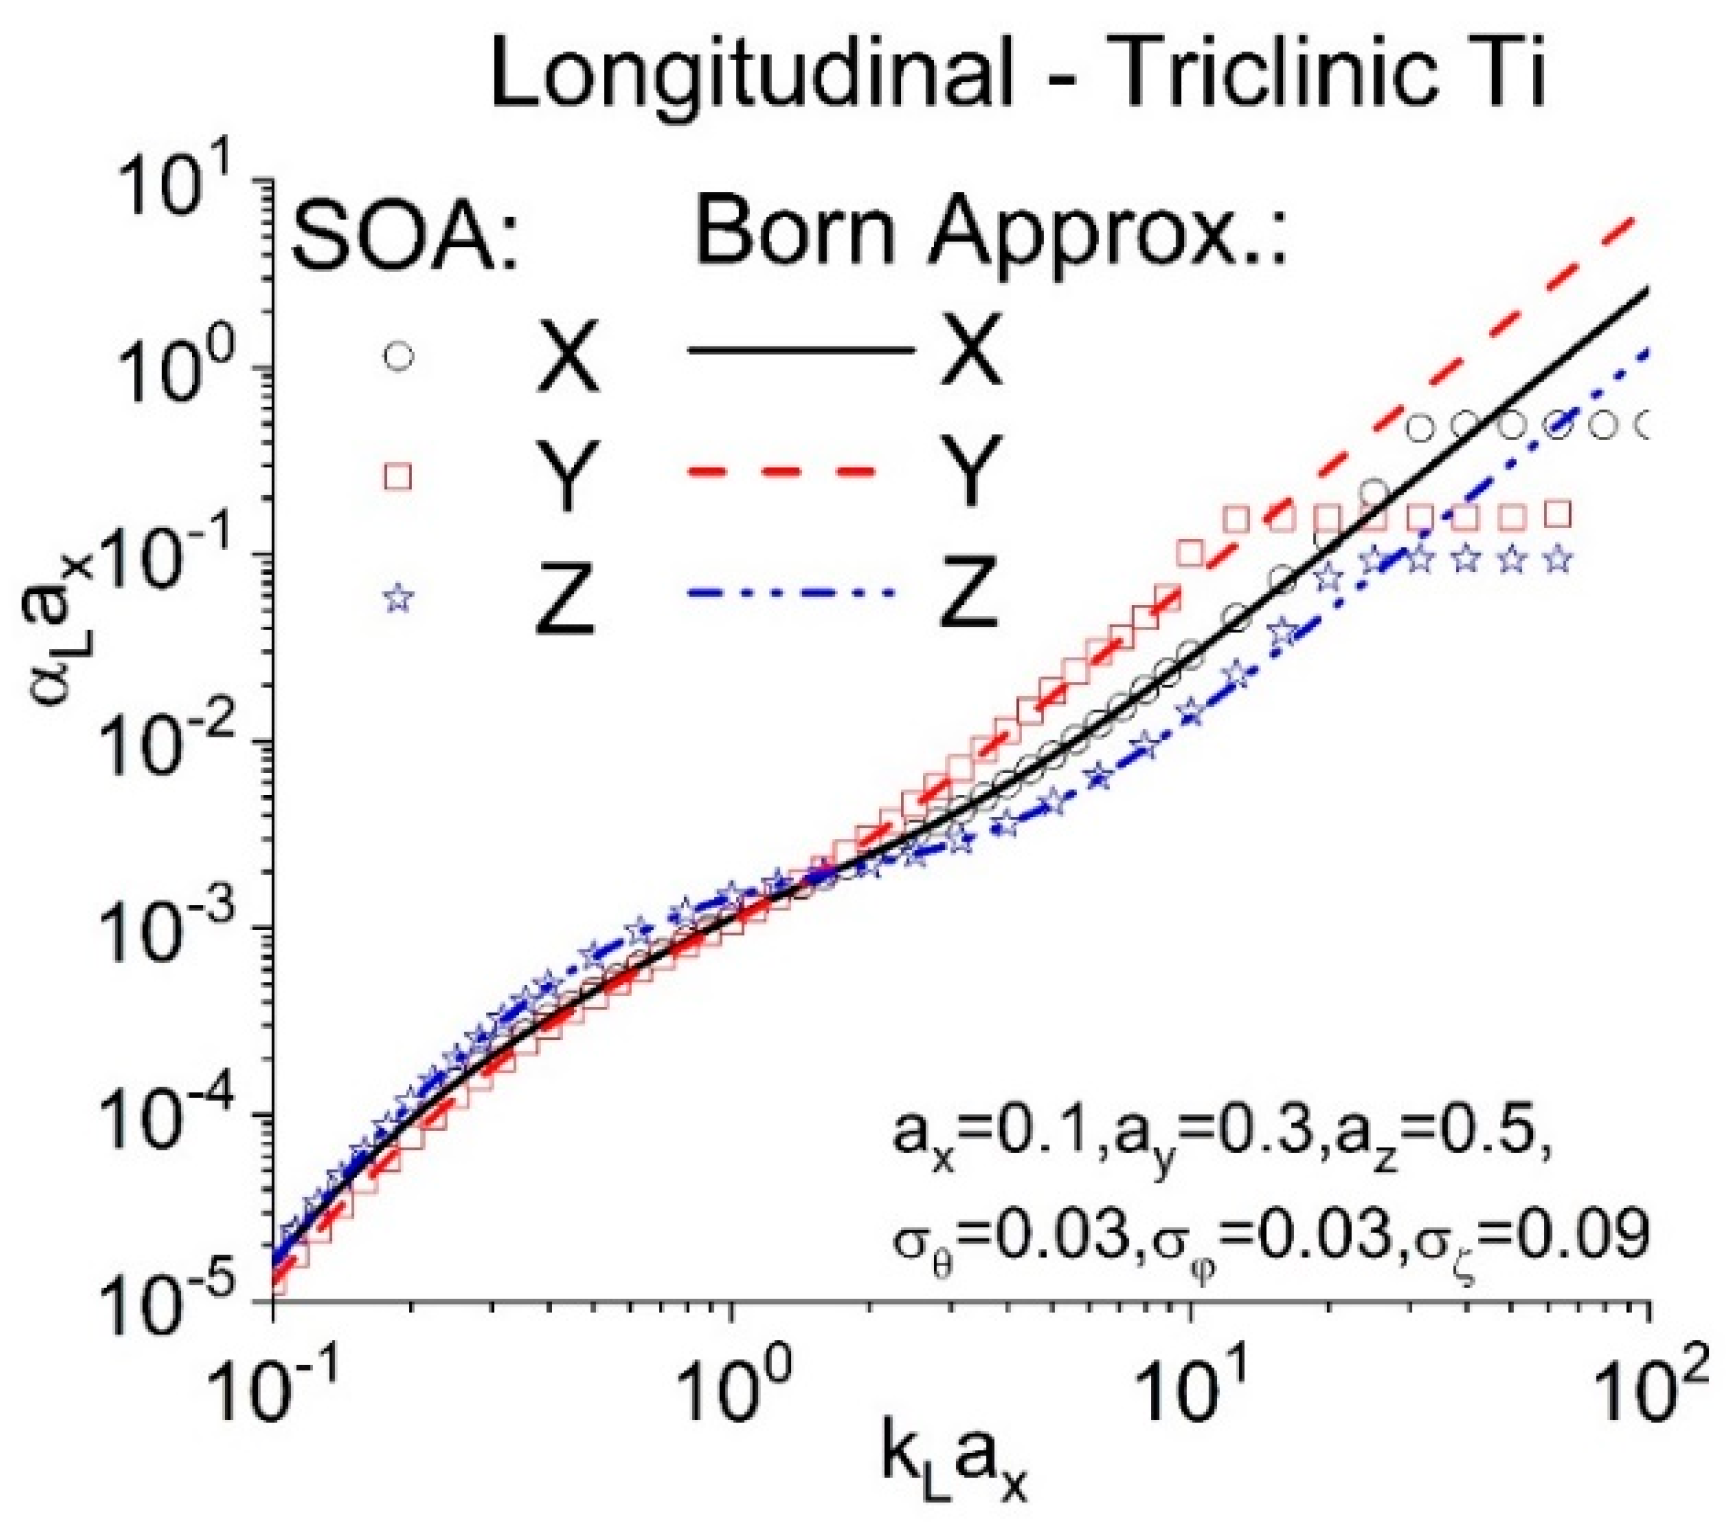
In this section, a triclinic Ti polycrystal from Refs. [40,50] is employed as an example to calculate attenuation and phase velocity via the SOA model. The single-crystal elastic constants and density of this triclinic Ti crystal from Refs. [40,50] are listed in Table 1. Assume that the polycrystal is composed of triclinic Ti crystals of ellipsoidal shape, whose main axes coincide with the global coordinate axes as shown in Figure 3. The same example in Ref. [40] is used here to facilitate the comparison between the SOA model in this work and the Born approximation in Ref. [40]: the mean grain radii are , and and the macrotexture parameters are and . In the SOA model, the calculation procedures of effective elastic constants and elastic constants covariances using 3D Gaussian ODF are the same as references [40,50], thus they will not be repeated here. The mass operator, Cauchy principal value, and dispersion equation are solved numerically by FORTRAN code, and only three wave propagation directions (X, Y and Z) are considered in this work. The computed attenuation results from the SOA model in this work will be compared with those from Ref. [40] by the Born approximation.
Figure 5 shows the longitudinal attenuation comparison between the SOA model and the Born approximation [40] for the Ti polycrystal with ellipsoidal grains ( and ). The attenuation and wavenumber are normalized by aX so that the horizontal and vertical axes are dimensionless. It can be seen from Figure 5 that the Born approximation is in reasonable agreement with our SOA model below the geometric region (also refer to the mean deviation in Table 2) and the transition frequency to geometric region varies in different directions. The deviation is defined as . The signs for all mean deviations at different wave propagation directions in Table 2 are negative, which indicates that the Born approximation underestimates the wave attenuation because it accounts for fewer scattering events than the SOA model. In the geometric region, the Born approximation [40] breaks due to its intrinsic limitation, and the break frequency of the Born approximation for each direction is also listed in Table 2. Since the departure frequency of the Born approximation from the SOA model is comparable to the stochastic-to-geometric transition frequency in the SOA model (sharp corner shown in Figure 5 from our SOA model), this departure frequency is also governed by the grain elongation and longitudinal wave scattering strength at high frequency. The attenuation at the geometric region from this work for textured polycrystals is also inversely proportional to grain size in the wave propagation direction as texture-free polycrystal case in Ref. [64,80], thus attenuation coefficients in geometric region predicated by the SOA model obey this relation: In the geometric region, the attenuation is so high that the penetration depth of an elastic wave is limited to a couple of grains [81].
Figure 6 indicates the longitudinal attenuation comparison between SOA model and the Born approximation [40] for a Ti polycrystal with equiaxed grains (), where the texture parameters are the same as Figure 5. From Figure 6, it can be seen that the Born approximation still reasonably agrees with the SOA model except for the geometric region. As shown in Table 3, the mean deviations (below departure frequency) of the Born approximation from the SOA model are −10.9% for X direction, −7.5% for Y direction and −14.4% for the Z direction, respectively. The model in Ref. [40] underestimates the attenuation coefficient on this case as well. The break frequency of the Born approximation [40] is also direction-dependent (see Table 3), and according to Table 3 the crystallographic texture affects the departure frequency most in the Z direction. In the geometric region, attenuation coefficients for X, Y and Z directions are comparable due to equiaxed grains.
The comparisons between the SOA model and the Born approximation [40] on these two cases (shown in Figure 5 and Figure 6, respectively) indicate that the Born approximation may underestimate the attenuation coefficient up to 15% below the geometric region. However, this discrepancy is still acceptable, considering that experimental attenuation can deviate from the theoretical prediction by a factor of two [82]. As for the break frequency of the Born approximation, it is affected collectively by texture extent, wave scattering extent, and the grain shape.
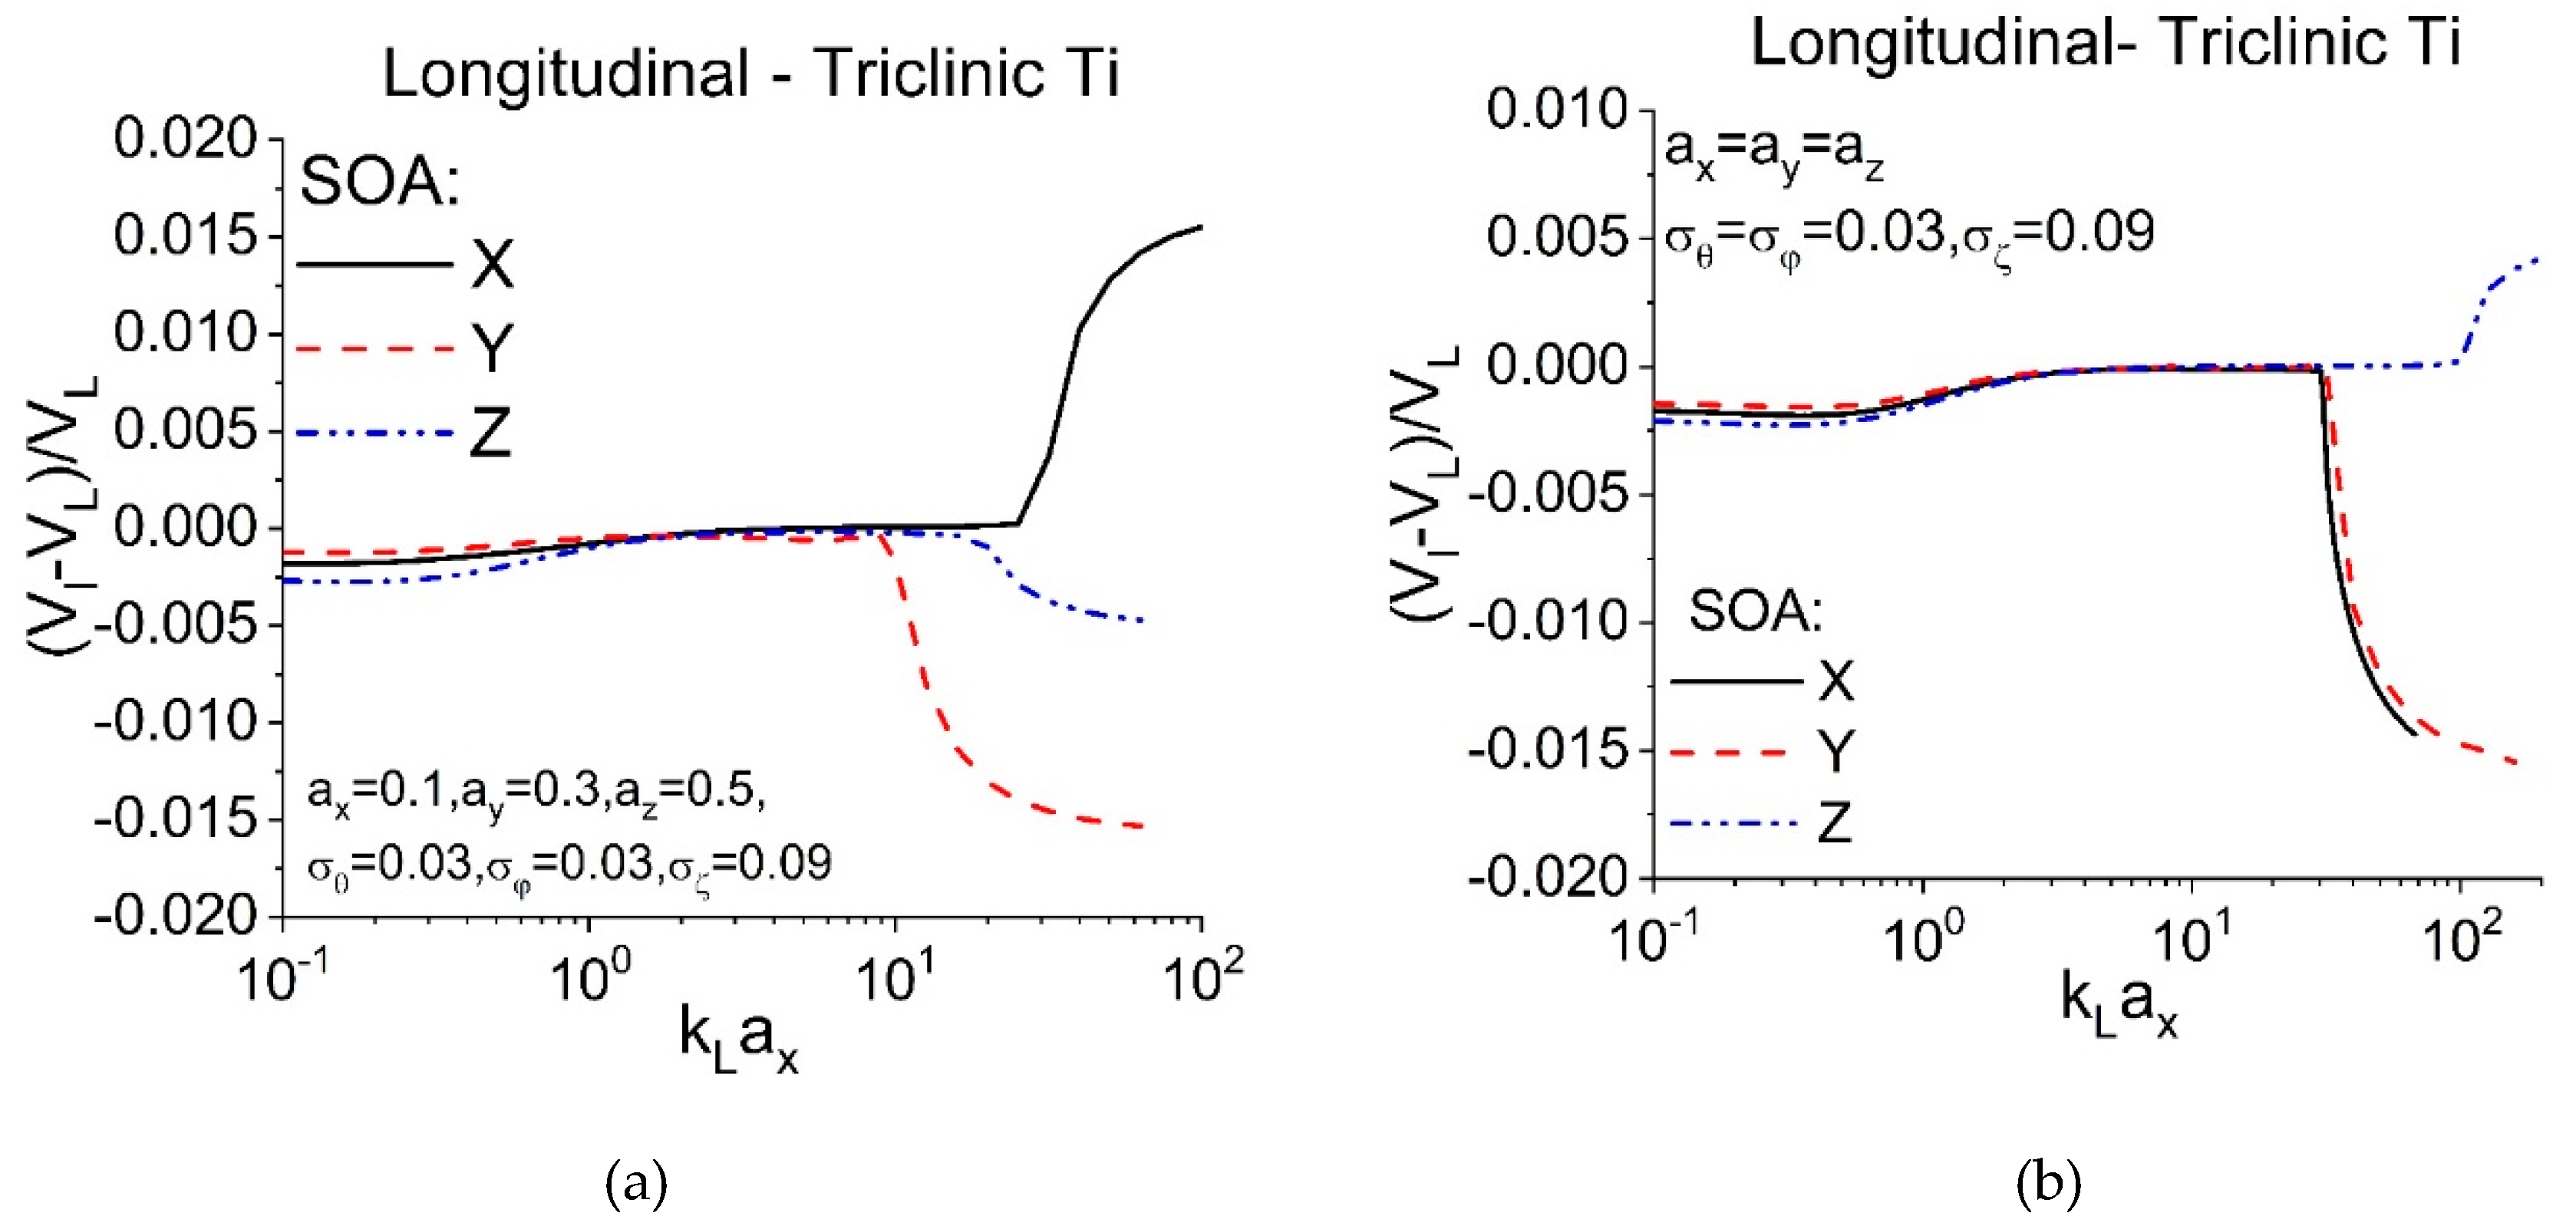
The phase velocities from the SOA model in this work for these two cases (textured Ti polycrystal with equiaxed grains and textured Ti polycrystal with elongated grains) are plotted in Figure 7 to demonstrate the dispersion behaviors of phase velocity at different frequency regimes, where normalized phase velocities (deviation from Voigt velocity) are shown. The phase velocity results in different directions for the Ti polycrystal with ellipsoidal grains are shown in Figure 7a, while the phase velocity results for the equiaxed grain case are depicted in Figure 7b. In the Rayleigh region, the phase velocities (quasi-static velocities) at X, Y and Z directions are non-dispersive for both cases and velocities in different directions follow this relation: Y > X > Z because of texture impact. Note that quasi-static phase velocities from these two cases for X, Y and Z directions are slightly different (less than 0.06%), which manifests the grain shape impact on quasi-static phase velocity. From Figure 7, the phase velocities for both cases increase from the Rayleigh region to the stochastic region and they reach a plateau before they become highly dispersive at the beginning of the geometric region. Although two branches should exist in wave propagation [32], the dominant branch is exclusively shown in Figure 7 because the subdominant branch is even harder to compute for textured polycrystals (like Ref. [36], a special approach has to be used for calculating the subdominant branch). In Figure 7a the phase velocity from X direction is above its Voigt velocity at geometric region while these for Y and Z directions in geometric region are below their corresponding Voigt velocities; intriguingly, in Figure 7b the phase velocity in the Z direction at geometric region is above its Voigt velocity while the rest are below their corresponding Voigt velocities. This interesting observation was also reported on texture-free polycrystals [3,34], but the physical meaning has not been well-interpreted. Literally, the wave chooses to propagate along faster phase velocity direction of grains at some scenarios but slower velocity direction at other scenarios. A highly dispersive phase velocity at the beginning of the geometric region also means that the energy propagation direction deviates from the propagation direction of the wavefront. Further investigation on the phase velocity in the geometric region is beyond the scope of this work.
From the phase velocity results, we can conclude that the texture impact on phase velocity is obvious in the Rayleigh region (the quasi-static phase velocities are changed) and geometric region (at some direction the phase velocity is larger than the Voigt velocity while at another direction the phase velocity becomes lower than its corresponding Voigt velocity). Additionally, the texture impact on phase velocity decreases with frequency in the transition region (from the Rayleigh region to the stochastic region) and its influence is minimal at the stochastic region. The texture also affects the transition frequency to the geometric region significantly. Last but not least, a competing effect between texture and grain shape is seen on phase velocity for textured polycrystals with elongated grain, but the grain shape impact is relatively weaker compared with crystallographic texture.
4.3. Comparison of Quasi-Static Velocity from the SOA Model with Other Velocity Bounds
An example is given here to validate the quasi-static velocity in Equation (40). The Hashin–Shtrikman bounds for anisotropic aggregates of cubic grains with arbitrary texture symmetry have been derived in Ref. [73] using variational principals while a recent study [74] explicitly represented the Hashin–Shtrikman bounds by second and fourth-order ODCs for polycrystals with arbitrary texture symmetry and crystal symmetry. Since the elastic modulus bounds of a textured polycrystalline copper (orthotropic texture symmetry) with equiaxed grains are available in Refs. [73,74], it makes possible a quantitative comparison between this work and Refs. [73,74]. Note that the derivation of Hashin–Shtrikman bounds in Ref. [74] is more rigorous than Ref. [73] because of a more generous assumption for stress polarization in Ref. [74] and the Hashin–Shtrikman bounds in Ref. [74] apply to more general texture and crystallite system cases; however, these two methods in Refs. [73,74] are comparable as demonstrated by Ref. [74]. For this textured polycrystalline copper, the orientation distribution coefficients (ODCs) of the Wigner-D function ODF from Ref. [73] are , , and all other (m stands for an integer). These ODCs in Wigner-D function ODF are converted to ODCs in Roe’s notation before they are applied to SOA model and the conversion formula is ( are ODCs in Roe’s notation). Single-crystal elastic constants of the copper grain are also from Ref. [73]. The Voigt and Reuss bounds for this textured copper reported in Refs. [73,74] were first repeated using Roe’s ODF as a cross-check of author’s FORTRAN code before calculating the quasi-static phase velocities.
The quasi-static phase velocities for this textured copper at three different wave propagation directions (X, Y and Z) are obtained based on Equation (40), and compared with velocities calculated from corresponding Hashin–Shtrikman (H-S) and self-consistent (SC) effective moduli in Refs. [73,74]. The comparison is shown in Table 4, where the Voigt and Reuss velocities are also listed. A reasonable homogenization model should follow Hashin–Shtrikman bounds and provide results close to the SC approach. From Table 4, the quasi-static velocities from this work are much better than Voigt–Reuss bounds and they obey the H-S upper and lower bounds provided in Refs. [73,74] (H-S upper and lower bounds from Refs. [73,74] are comparable), and they are also reasonably close to SC velocity given in Ref. [73]. Therefore, the explicit expression Equation (40) for quasi-static velocities obtained in this work is justified.
Although sophisticated bounds including Hashin–Shtrikman and self-consistent approaches have been developed for polycrystalline aggregates with different texture symmetry and grain symmetry like Refs. [72,74,75], no further attempt is made in this paper to systematically compare with these studies [72,74,75] because of certain constraints: these models in Refs. [72,74,75] are not straightforward to apply; no additional computational example is available in Refs. [72,74]; ODCs are not provided in Ref. [75]. More will be exploited on this aspect in further work.
To inversely determine elastic moduli from phase velocity, one has to collect sufficient phase velocity data at multiple angles and fit the elastic moduli by resorting to Christoffel’s equation. This will not be demonstrated here since details about the determination of effective elastic moduli from ultrasonic phase velocities can be found in Ref. [15].
5. Conclusions
A second-order attenuation model for textured polycrystals, which is applicable to triclinic crystallites of ellipsoidal shape and valid for the whole frequency range, has been derived in terms of the Dyson equation in this study. The SOA model can predict both attenuation and phase velocity including the quasi-static velocity. Moreover, the quasi-longitudinal attenuation coefficient predicted by the SOA model is compared to available FEM results and experimental attenuation data on a textured stainless steel polycrystal. The SOA model is further compared with an existing model [40] based on the Born approximation on two textured polycrystals with triclinic titanium grains but different grain morphology. The phase velocity results predicted by the SOA model for these two textured Ti polycrystals are also presented to demonstrate the texture impact on phase velocity. Finally, quasi-static velocities from this work on a textured polycrystalline copper are compared with other velocity bounds reported in the references [73,74] including self-consistent velocity. Several conclusions can be drawn in this study.
The attenuation comparison of the SOA model to available FEM results [22] and experimental attenuation data [77] on the textured stainless steel polycrystal indicates the SOA model is in reasonable agreement with FEM and experimental measurement. This justifies the SOA model developed in this work.
From comparisons between the SOA model and the existing model [40] based on the Born approximation on two textured polycrystalline aggregates of triclinic Ti grains (one ellipsoidal grain case and one equiaxed grain case), the SOA model validates in the whole frequency range and quantitatively shows the applicable frequency range of the Born approximation [40]. It is also concluded the accuracy of the existing model in Ref. [40] is still acceptable below the geometric region.
The computational results for these two textured Ti polycrystals show that the phase velocity predicted by the SOA model in the whole frequency range is dispersive (frequency-dependent), which is affected both by crystallographic texture and the grain shape. The texture impact on phase velocity is most phenomenal in the Rayleigh region and geometric region. Therefore, one big advantage of the SOA model is that it simultaneously provides attenuation and phase velocity.
The quasi-static velocity obtained from the SOA model applies to polycrystals with arbitrary texture symmetry and triclinic grains and also accounts for different grain shapes, which had never been achieved before. The quasi-static velocities from the SOA model obey the Hashin–Shtrikman bounds and agree reasonably with self-consistent velocity. Therefore, it may provide another homogenization approach to determine effective elastic constants of texture polycrystals.
This work can be further extended to polycrystals with a generalized two-point correlation function. Recent studies [23,83] have shown that the GTPC function of a Voronoi grain microstructure may not follow an exponential two-point correlation function. However, the numerically determined two-point correlation function can be incorporated into this work by following the approach in Ref. [23] using a summation of multiple exponential terms. Further development will be addressed in the future.
Acknowledgments
The author would like to thank Stanislav I. Rokhlin for helpful discussion.
Conflicts of Interest
The author declares no conflict of interest.
References
- Mason, W.P.; McSkimin, H.J. Attenuation and Scattering of High Frequency Sound Waves in Metals and Glasses. J. Acoust. Soc. Am. 1947, 19, 725. [Google Scholar] [CrossRef] [Green Version]
- Papadakis, E.P. Rayleigh and Stochastic Scattering of Ultrasonic Waves in Steel. J. Appl. Phys. 1963, 34, 265–269. [Google Scholar] [CrossRef]
- Stanke, F.E.; Kino, G.S. A Unified Theory for Elastic Wave Propagation in Polycrystalline Materials. J. Acoust. Soc. Am. 1984, 75, 665. [Google Scholar] [CrossRef]
- Hirsekorn, S. The Scattering of Ultrasonic Waves by Polycrystals. J. Acoust. Soc. Am. 1982, 72, 1021–1031. [Google Scholar] [CrossRef]
- Weaver, R.L. Diffusivity of Ultrasound in Polycrystals. J. Mech. Phys. Solids 1990, 38, 55–86. [Google Scholar] [CrossRef]
- Turner, J.A. Elastic Wave Propagation and Scattering in Heterogeneous, Anisotropic Media: Textured Polycrystalline Materials. J. Acoust. Soc. Am. 1999, 106, 541. [Google Scholar] [CrossRef] [Green Version]
- Yang, L.; Turner, J.A. Attenuation of Ultrasonic Waves in Rolled Metals. J. Acoust. Soc. Am. 2004, 116, 3319–3327. [Google Scholar] [CrossRef] [Green Version]
- Yang, L.; Lobkis, O.I.; Rokhlin, S.I. Explicit Model for Ultrasonic Attenuation in Equiaxial Hexagonal Polycrystalline Materials. Ultrasonics 2011, 51, 303–309. [Google Scholar] [CrossRef]
- Lobkis, O.I.; Yang, L.; Li, J.; Rokhlin, S.I. Ultrasonic Backscattering in Polycrystals with Elongated Single Phase and Duplex Microstructures. Ultrasonics 2012, 52, 694–705. [Google Scholar] [CrossRef]
- Du, H.; Turner, J.A. Ultrasonic Attenuation in Pearlitic Steel. Ultrasonics 2014, 54, 882–887. [Google Scholar] [CrossRef] [PubMed]
- Papadakis, E.P. Physical Acoustics and Microstructure of Iron Alloys. Int. Met. Rev. 1984, 29, 1–24. [Google Scholar] [CrossRef]
- Guo, C.B.; Höller, P.; Goebbels, K. Scattering of Ultrasonic Waves in Anisotropic Polycrystalline Metals. Acta Acust. united with Acust. 1985, 59, 112–120. [Google Scholar]
- Gobran, N.K.; Youssef, H. Viscous Ultrasonic Attenuation in Metals. J. Appl. Phys. 1967, 38, 3291–3293. [Google Scholar] [CrossRef]
- Nowick, A.S.; Berry, B.S.; Katz, J.L. Anelastic Relaxation in Crystalline Solids; Academic Press: New York, NY, USA; London, UK, 1972; p. 667. [Google Scholar]
- Ryzy, M.; Grabec, T.; Österreicher, J.A.; Hettich, M.; Veres, I.A. Measurement of Coherent Surface Acoustic Wave Attenuation in Polycrystalline Aluminum. AIP Adv. 2018, 8, 125019. [Google Scholar] [CrossRef] [Green Version]
- Papadakis, E.P. Grain-Size Distribution in Metals and Its Influence on Ultrasonic Attenuation Measurements. J. Acoust. Soc. Am. 1961, 33, 1616–1621. [Google Scholar] [CrossRef]
- Bai, X.; Zhao, Y.; Ma, J.; Liu, Y.; Wang, Q. Grain-Size Distribution Effects on the Attenuation of Laser-Generated Ultrasound in $α$-Titanium Alloy. Materials (Basel). 2019, 12, 102. [Google Scholar] [CrossRef] [PubMed] [Green Version]
- Sha, G. A Simultaneous Non-Destructive Characterisation Method for Grain Size and Single-Crystal Elastic Constants of Cubic Polycrystals from Ultrasonic Measurements. Insight - Non-Destructive Test. Cond. Monit. 2018, 60, 190–193. [Google Scholar] [CrossRef]
- Li, X.; Song, Y.; Liu, F.; Hu, H.; Ni, P. Evaluation of Mean Grain Size Using the Multi-Scale Ultrasonic Attenuation Coefficient. NDT E Int. 2015, 72, 25–32. [Google Scholar] [CrossRef]
- Van Pamel, A.; Brett, C.R.; Huthwaite, P.; Lowe, M.J.S. Finite Element Modelling of Elastic Wave Scattering within a Polycrystalline Material in Two and Three Dimensions. J. Acoust. Soc. Am. 2015, 138, 2326–2336. [Google Scholar] [CrossRef] [Green Version]
- Bai, X.; Tie, B.; Schmitt, J.-H.; Aubry, D. Finite Element Modeling of Grain Size Effects on the Ultrasonic Microstructural Noise Backscattering in Polycrystalline Materials. Ultrasonics 2018, 87, 182–202. [Google Scholar] [CrossRef]
- Lhuillier, P.E.; Chassignole, B.; Oudaa, M.; Kerhervé, S.O.; Rupin, F.; Fouquet, T. Investigation of the Ultrasonic Attenuation in Anisotropic Weld Materials with Finite Element Modeling and Grain-Scale Material Description. Ultrasonics 2017, 78, 40–50. [Google Scholar] [CrossRef] [PubMed]
- Van Pamel, A.; Sha, G.; Lowe, M.J.S.; Rokhlin, S.I. Numerical and Analytic Modelling of Elastodynamic Scattering within Polycrystalline Materials. J. Acoust. Soc. Am. 2018, 14, 2394–2408. [Google Scholar] [CrossRef] [PubMed] [Green Version]
- Yang, L.; Lobkis, O.I.; Rokhlin, S.I. Shape Effect of Elongated Grains on Ultrasonic Attenuation in Polycrystalline Materials. Ultrasonics 2011, 51, 697–708. [Google Scholar] [CrossRef] [PubMed]
- Kube, C.M.; Turner, J.A. Stress-Dependent Second-Order Grain Statistics of Polycrystals. J Acoust Soc Am 2015, 138, 2613–2625. [Google Scholar] [CrossRef] [PubMed] [Green Version]
- Yang, L.; Turner, J.A. Wave Attenuations in Solids with Perfectly Aligned Cracks. Acoust. Res. Lett. Online 2005, 6, 99–105. [Google Scholar] [CrossRef]
- Kube, C.M.; Turner, J.A. Stress-Dependent Ultrasonic Scattering in Polycrystalline Materials. J. Acoust. Soc. Am. 2016, 139, 811–824. [Google Scholar] [CrossRef] [Green Version]
- Ahmed, S.; Thompson, R.B.; Panetta, P.D. Ultrasonic Attenuation as Influenced by Elongated Grains. Rev. Quant. Nondestruct. Eval. ed. by D. O. Thompson D. E. Chimenti 2003, 22, 109–116. [Google Scholar]
- Karal, F.C.; Keller, J.B. Elastic, Electromagnetic, and Other Waves in a Random Medium. J. Math. Phys. 1964, 5, 537. [Google Scholar] [CrossRef]
- Hirsekorn, S. The Scattering of Ultrasonic Waves by Polycrystals. II. Shear Waves. J Acoust Soc Am 1983, 73, 1160–1163. [Google Scholar] [CrossRef]
- Page, J.H.; Sheng, P.; Schriemer, H.P.; Jones, I.; Jing, X.; Weitz, D.A. Group Velocity in Strongly Scattering Media. Science 1996, 271, 634–637. [Google Scholar] [CrossRef] [Green Version]
- Calvet, M.; Margerin, L. Velocity and Attenuation of Scalar and Elastic Waves in Random Media: A Spectral Function Approach. J. Acoust. Soc. Am. 2012, 131, 1843. [Google Scholar] [CrossRef] [PubMed]
- Kube, C.M. Iterative Solution to Bulk Wave Propagation in Polycrystalline Materials. J. Acoust. Soc. Am. 2017, 141, 1804–1811. [Google Scholar] [CrossRef] [PubMed]
- Calvet, M.; Margerin, L. Impact of Grain Shape on Seismic Attenuation and Phase Velocity in Cubic Polycrystalline Materials. Wave Motion 2016, 65, 29–43. [Google Scholar] [CrossRef]
- Frisch, U. Probabilistic Methods in Applied Mathematics; Vols. I II, Ed.; Bharucha-Reid Academic Press: New York, NY, USA, 1968. [Google Scholar]
- Rokhlin, S.I.; Li, J.; Sha, G. Far-Field Scattering Model for Wave Propagation in Random Media. J. Acoust. Soc. Am. 2015, 137, 2655–2669. [Google Scholar] [CrossRef] [PubMed]
- Kocks, U.F.; Tomé, C.N.; Wenk, H.-R. Texture and Anisotropy: Preferred Orientations in Polycrystals and Their Effect on Materials Properties; Cambridge University Press: Cambridge, UK, 2000. [Google Scholar]
- Ahmed, S.; Thompson, R.B. Propagation of Elastic Waves in Equiaxed Stainless-Steel Polycrystals with Aligned [001] Axes. J. Acoust. Soc. Am. 1996, 99, 2086. [Google Scholar] [CrossRef]
- Yang, L.; Rokhlin, S.I. Ultrasonic Backscattering in Cubic Polycrystals with Ellipsoidal Grains and Texture. J. Nondestruct. Eval. 2013, 32, 142–155. [Google Scholar] [CrossRef]
- Li, J.; Rokhlin, S.I. Propagation and Scattering of Ultrasonic Waves in Polycrystals with Arbitrary Crystallite and Macroscopic Texture Symmetries. Wave Motion 2015, 58, 145–164. [Google Scholar] [CrossRef]
- Hirsekorn, S. The Scattering of Ultrasonic Waves in Polycrystalline Materials with Texture. J. Acoust. Soc. Am. 1985, 77, 832–843. [Google Scholar] [CrossRef]
- Norouzian, M.; Turner, J.A. Ultrasonic Wave Propagation Predictions for Polycrystalline Materials Using Three-Dimensional Synthetic Microstructures: Attenuation. J. Acoust. Soc. Am. 2019, 145, 2181–2191. [Google Scholar] [CrossRef] [PubMed]
- Bunge, H.-J. Texture Analysis in Materials Science: Mathematical Methods, 1st ed.; Armco Inc.: Middeletown, OH, USA, 1982. [Google Scholar]
- Bache, M.R.; Evans, W.J.; Suddell, B.; Herrouin, F.R.M. The Effects of Texture in Titanium Alloys for Engineering Components under Fatigue. Int. J. Fatigue 2001, 23, 153–159. [Google Scholar] [CrossRef]
- Roe, R.J.; Krigbaum, W.R. Description of Crystallite Orientation in Polycrystalline Materials Having Fiber Texture. J. Chem. Phys. 1964, 40, 2608. [Google Scholar] [CrossRef]
- Roe, R.J. Description of Crystallite Orientation in Polycrystalline Materials. III. General Solution to Pole Figure Inversion. J. Appl. Phys. 1965, 36, 2024–2031. [Google Scholar] [CrossRef]
- Cho, J.H.; Rollett, A.D.; Oh, K.H. Determination of Volume Fractions of Texture Components with Standard Distributions in Euler Space. Metall. Mater. Trans. A Phys. Metall. Mater. Sci. 2004, 35, 1075–1086. [Google Scholar] [CrossRef]
- Yang, L.; Turner, J.A.; Li, Z. Ultrasonic Characterization of Microstructure Evolution during Processing. J. Acoust. Soc. Am. 2007, 121, 50. [Google Scholar] [CrossRef] [Green Version]
- Li, J.Y. Effective Electroelastic Moduli of Textured Piezoelectric Polycrystalline Aggregates. J. Mech. Phys. Solids 2000, 48, 529–552. [Google Scholar] [CrossRef]
- Li, J.; Rokhlin, S.I. Elastic Wave Scattering in Random Anisotropic Solids. Int. J. Solids Struct. 2016, 78–79, 110–124. [Google Scholar] [CrossRef]
- Mason, J.K.; Schuh, C.A. Hyperspherical Harmonics for the Representation of Crystallographic Texture. Acta Mater. 2008, 56, 6141–6155. [Google Scholar] [CrossRef]
- Huang, M. Perturbation Approach to Elastic Constitutive Relations of Polycrystals. J. Mech. Phys. Solids 2004, 52, 1827–1853. [Google Scholar] [CrossRef]
- Sha, G. Explicit Backscattering Coefficient for Ultrasonic Wave Propagating in Hexagonal Polycrystals with Fiber Texture. J. Nondestruct. Eval. 2018, 37, 37–51. [Google Scholar] [CrossRef]
- Bunge, H.J.; Esling, C.; Bechler-Ferry, E. Three- Dimensional Texture Analysis after Bunge and Roe: Correspondence between the Respective Mathematical Techniques. Textures Microstruct. 1982, 5, 95–125. [Google Scholar]
- Frisch, U. Wave Propagation in Random Media. In Probabilistic Methods in Applied Mathematics, Volume 1; Academic Press: New York, NY, USA, 1968; pp. 75–198. [Google Scholar]
- Bourret, R.C. Stochastically Perturbed Fields, with Applications to Wave Propagation in Random Media. Nuovo Cim. Ser. 10 1962, 26, 1–31. [Google Scholar] [CrossRef]
- Budreck, B.D.E. An Eigenfunction Expansion of the Elastic Wave Green ’ S Function for Anisotropic Media. Q. J. Mech. Appl. Math. 1993, 46, 1–26. [Google Scholar] [CrossRef]
- Hill, R. The Elastic Behaviour of a Crystalline Aggregate. Proc. Phys. Soc. Sect. A 2002, 65, 349–354. [Google Scholar] [CrossRef]
- Li, J.; Yang, L.; Rokhlin, S.I. Effect of Texture and Grain Shape on Ultrasonic Backscattering in Polycrystals. Ultrasonics 2014, 54, 1789–1803. [Google Scholar] [CrossRef]
- Van Pamel, A.; Sha, G.; Rokhlin, S.I.; Lowe, M.J.S. Finite-Element Modelling of Elastic Wave Propagation and Scattering within Heterogeneous Media. Proc. R. Soc. A Math. Phys. Eng. Sci. 2017, 473, 20160738. [Google Scholar] [CrossRef]
- Berryman, J.G. Bounds and Self-Consistent Estimates for Elastic Constants of Random Polycrystals with Hexagonal, Trigonal, and Tetragonal Symmetries. J. Mech. Phys. Solids 2005, 53, 2141–2173. [Google Scholar] [CrossRef]
- Stanke, F.E. Spatial Autocorrelation Functions for Calculations of Effective Propagation Constants in Polycrystalline Materials. J. Acoust. Soc. Am. 1986, 80, 1479–1485. [Google Scholar] [CrossRef]
- Hu, P.; Kube, C.M.; Koester, L.W.; Turner, J.A. Mode-Converted Diffuse Ultrasonic Backscatter. J Acoust Soc Am 2015, 134, 982–990. [Google Scholar] [CrossRef]
- Yang, L.; Lobkis, O.I.; Rokhlin, S.I. An Integrated Model for Ultrasonic Wave Propagation and Scattering in a Polycrystalline Medium with Elongated Hexagonal Grains. Wave Motion 2012, 49, 544–560. [Google Scholar] [CrossRef]
- Ahmed, S.; Thompson, R.B. Attenuation of Ultrasonic Waves in Cubic Metals Having Elongated, Oriented Grains. Nondestruct. Test. Eval. 1992, 8–9, 525–531. [Google Scholar] [CrossRef]
- Wu, R.-S. Attenuation of Short Period Seismic Waves Due to Scattering. Attenuation short period Seism. waves due to Scatt. 1982, 9, 9–12. [Google Scholar]
- Hashin, Z.; Shtrikman, S. A Variational Approach to the Theory of the Elastic Behaviour of Polycrystals. J. Mech. Phys. Solids 1962, 10, 343–352. [Google Scholar] [CrossRef]
- Brown, J.M. Determination of Hashin-Shtrikman Bounds on the Isotropic Effective Elastic Moduli of Polycrystals of Any Symmetry. Comput. Geosci. 2015, 80, 95–99. [Google Scholar] [CrossRef]
- Kube, C.M.; Arguelles, A.P. Bounds and Self-Consistent Estimates of the Elastic Constants of Polycrystals. Comput. Geosci. 2016, 95, 118–122. [Google Scholar] [CrossRef]
- Li, Y.; Thompson, R.B. Relations between Elastic Constants Cij and Texture Parameters for Hexagonal Materials. J. Appl. Phys. 1990, 67, 2663–2665. [Google Scholar] [CrossRef] [Green Version]
- Man, C.S.; Huang, M. A Simple Explicit Formula for the Voigt-Reuss-Hill Average of Elastic Polycrystals with Arbitrary Crystal and Texture Symmetries. J. Elast. 2011, 105, 29–48. [Google Scholar] [CrossRef]
- Böhlke, T.; Lobos, M. Representation of Hashin-Shtrikman Bounds of Cubic Crystal Aggregates in Terms of Texture Coefficients with Application in Materials Design. Acta Mater. 2014, 67, 324–334. [Google Scholar] [CrossRef]
- Huang, M.; Man, C.S. Explicit Bounds of Effective Stiffness Tensors for Textured Aggregates of Cubic Crystallites. Math. Mech. Solids 2008, 13, 408–430. [Google Scholar] [CrossRef]
- Lobos Fernández, M.; Böhlke, T. Representation of Hashin--Shtrikman Bounds in Terms of Texture Coefficients for Arbitrarily Anisotropic Polycrystalline Materials. J. Elast. 2019, 134, 1–38. [Google Scholar] [CrossRef]
- Tane, M.; Yamori, K.; Sekino, T.; Mayama, T. Impact of Grain Shape on the Micromechanics-Based Extraction of Single-Crystalline Elastic Constants from Polycrystalline Samples with Crystallographic Texture. Acta Mater. 2017, 122, 236–251. [Google Scholar] [CrossRef]
- Rokhlin, S.I.; Chimenti, D.E.; Nagy, P.B. Physical Ultrasonics of Composites; Oxford University Press: Oxford, UK, 2011. [Google Scholar]
- Gubernatis, J.E.; Krumhansl, J.A. Macroscopic Engineering Properties of Polycrystalline Materials: Elastic Properties. J. Appl. Phys. 1975, 46, 1875–1883. [Google Scholar] [CrossRef]
- Ploix, M.A.; Guy, P.; Chassignole, B.; Moysan, J.; Corneloup, G.; Guerjouma, R.E. Measurement of Ultrasonic Scattering Attenuation in Austenitic Stainless Steel Welds: Realistic Input Data for NDT Numerical Modeling. Ultrasonics 2014, 54, 1729–1736. [Google Scholar] [CrossRef] [PubMed]
- Pal, B. Pulse-Echo Method Cannot Measure Wave Attenuation Accurately. Ultrasonics 2015, 61, 6–9. [Google Scholar] [CrossRef] [PubMed] [Green Version]
- Yang, L.; Rokhlin, S.I. On Comparison of Experiment and Theory for Ultrasonic Attenuation in Polycrystalline Niobium. J. Nondestruct. Eval. 2012, 31, 77–79. [Google Scholar] [CrossRef]
- Sha, G.; Rokhlin, S.I. Universal Scaling of Transverse Wave Attenuation in Polycrystals. Ultrasonics 2018, 88, 84–96. [Google Scholar] [CrossRef] [PubMed]
- Wang, Y.; Hurley, D.H.; Hua, Z.; Sha, G.; Raetz, S.; Gusev, V.E.; Khafizov, M. Nondestructive Characterization of Polycrystalline 3D Microstructure with Time-Domain Brillouin Scattering. Scr. Mater. 2019, 166, 34–38. [Google Scholar] [CrossRef]
- Ryzy, M.; Grabec, T.; Sedlák, P.; Veres, I.A. Influence of Grain Morphology on Ultrasonic Wave Attenuation in Polycrystalline Media with Statistically Equiaxed Grains. J. Acoust. Soc. Am. 2018, 143, 219–229. [Google Scholar] [CrossRef] [Green Version]
Figure 1.
The orientation of the crystallite coordinate (x, y, z) in the texture coordinate system (Tx, Ty, Tz).
Figure 1.
The orientation of the crystallite coordinate (x, y, z) in the texture coordinate system (Tx, Ty, Tz).

Figure 2.
Schematic of the two-point correlation function in polycrystals.

Figure 3.
The geometry of an ellipsoidal grain with three main axes and , wave propagation and scattering direction . Angle is the angle between and .
Figure 3.
The geometry of an ellipsoidal grain with three main axes and , wave propagation and scattering direction . Angle is the angle between and .

Figure 4.
Attenuation comparison of the second-order attenuation (SOA) model (this work) to available experimental results (from Ref. [77]) and finite element modeling (FEM) results (from Ref. [22]) on a textured 316L stainless steel polycrystal with mean grain sizes , . The error bars of the FEM results are also from Ref. [22].

Figure 5.
Comparison of the longitudinal attenuation results from SOA model and the Born approximation [40] for a textured polycrystal of triclinic Ti crystallites with main grain radii and . The macrotexture parameters are and . The Rayleigh region, ; geometric region, (given in Table 2); estimated stochastic region, .

Figure 6.
Comparison of the longitudinal attenuation results from the SOA model and the Born approximation [40] for a textured Ti polycrystal of triclinic crystallites with mean grain radii . The macrotexture parameters are and . Rayleigh region, ; geometric region, (given in Table 3); estimated stochastic region, .

Figure 7.
Phase velocity results from the SOA model for two Ti polycrystals with triclinic grains: (a) the ellipsoidal grain case and (b) the equiaxed grain case. is the phase velocity predicted by the SOA model while VL is the Voigt phase velocity in the corresponding wave propagation direction.
Figure 7.
Phase velocity results from the SOA model for two Ti polycrystals with triclinic grains: (a) the ellipsoidal grain case and (b) the equiaxed grain case. is the phase velocity predicted by the SOA model while VL is the Voigt phase velocity in the corresponding wave propagation direction.


Table 1.
The elastic constants (in GPa) and the mass density ρ(g/cm3) of a triclinic Ti crystallite reported in Ref. [40,50].
| Triclinic Ti | 161.6 | 67.8 | 88.2 | 1.8 | 1.1 | −0.64 | 184.4 | 68.0 | −2.5 |
| Triclinic Ti | −1.9 | −2.6 | 161.3 | −0.18 | 0.83 | 2.4 | 50.9 | −5.1 | 0.20 |
| ρ | |||||||||
| Triclinic Ti | 39.0 | −5.2 | 50.9 | 4.54 |
Table 2.
The mean deviation between the SOA model and the Born approximation below break frequency (SOA model is treated as the reference) and the break frequency of the Born approximation for a textured polycrystal with ellipsoidal Ti grains.
Table 2.
The mean deviation between the SOA model and the Born approximation below break frequency (SOA model is treated as the reference) and the break frequency of the Born approximation for a textured polycrystal with ellipsoidal Ti grains.
| Direction | X | Y | Z |
|---|---|---|---|
| Mean deviation | −13% | −9.7% | −14% |
| Departure frequency | 31.6 | 12.7 | 25.1 |
Table 3.
The mean deviation between SOA and the Born approximation below break frequency (SOA model is treated as reference) and the break frequency of the Born approximation for a textured polycrystal with equiaxed Ti grains.
Table 3.
The mean deviation between SOA and the Born approximation below break frequency (SOA model is treated as reference) and the break frequency of the Born approximation for a textured polycrystal with equiaxed Ti grains.
| Direction | X | Y | Z |
|---|---|---|---|
| Mean deviation | −10.9% | −7.5% | −14.4% |
| Departure frequency | 31.0 | 34.4 | 102.7 |
Table 4.
Comparison of the longitudinal velocities (in km/s) at different propagation directions for a macroscopically orthotropic copper with equiaxed grains [73,74]. Hashin–Shtrikman (H-S) bounds and self-consistent (SC) velocity are directly from Ref. [73,74]. Assume copper density is 8.935g/cm3.
| Directions | Reuss | H-S Lower [73] | H-S Lower [74] | SC [73] | This work, Equation (40) | H-S Upper [74] | H-S Upper [73] | Voigt |
|---|---|---|---|---|---|---|---|---|
| X | 5.038 | 4.919 | 4.935 | 4.969 | 4.979 | 4.983 | 4.987 | 4.841 |
| Y | 4.965 | 4.834 | 4.842 | 4.883 | 4.892 | 4.897 | 4.900 | 4.743 |
| Z | 4.902 | 4.757 | 4.759 | 4.805 | 4.816 | 4.820 | 4.823 | 4.656 |
© 2020 by the author. Licensee MDPI, Basel, Switzerland. This article is an open access article distributed under the terms and conditions of the Creative Commons Attribution (CC BY) license (http://creativecommons.org/licenses/by/4.0/).
Share and Cite
MDPI and ACS Style
Sha, G. Attenuation and Phase Velocity of Elastic Wave in Textured Polycrystals with Ellipsoidal Grains of Arbitrary Crystal Symmetry. Acoustics 2020, 2, 51-72. https://0-doi-org.brum.beds.ac.uk/10.3390/acoustics2010005
AMA Style
Sha G. Attenuation and Phase Velocity of Elastic Wave in Textured Polycrystals with Ellipsoidal Grains of Arbitrary Crystal Symmetry. Acoustics. 2020; 2(1):51-72. https://0-doi-org.brum.beds.ac.uk/10.3390/acoustics2010005
Chicago/Turabian StyleSha, Gaofeng. 2020. "Attenuation and Phase Velocity of Elastic Wave in Textured Polycrystals with Ellipsoidal Grains of Arbitrary Crystal Symmetry" Acoustics 2, no. 1: 51-72. https://0-doi-org.brum.beds.ac.uk/10.3390/acoustics2010005