Article

Agent-Based Model of a Blockchain Enabled Peer-to-Peer Energy Market: Application for a Neighborhood Trial in Perth, Australia

1
Department of Civil, Construction, and Environmental Engineering, North Carolina State University, Raleigh, NC 27695, USA
2
Curtin University Sustainability Policy Institute, Curtin University, School of Design and the Built Environment, Building 209, Level 1, Kent St, Bentley, WA 6021, Australia
3
Environmental Change Institute, University of Oxford, OUCE, South Parks Road, Oxford OX1 3QY, UK
4
School of Electrical and Electronic Engineering, The University of Adelaide, Adelaide, SA 5005, Australia
*
Author to whom correspondence should be addressed.
Submission received: 24 July 2020 / Revised: 14 September 2020 / Accepted: 18 September 2020 / Published: 19 September 2020

Abstract

:
The transfer of market power in electric generation from utilities to end-users spurred by the diffusion of distributed energy resources necessitates a new system of settlement in the electricity business that can better manage generation assets at the grid-edge. A new concept in facilitating distributed generation is peer-to-peer energy trading, where households exchange excess power with neighbors at a price they set themselves. However, little is known about the effects of peer-to-peer energy trading on the sociotechnical dynamics of electric power systems. Further, given the novelty of the concept, there are knowledge gaps regarding the impact of alternative electricity market structures and individual decision strategies on neighborhood exchanges and market outcomes. This study develops an empirical agent-based modeling (ABM) framework to simulate peer-to-peer electricity trades in a decentralized residential energy market. The framework is applied for a case study in Perth, Western Australia, where a blockchain-enabled energy trading platform was trialed among 18 households, which acted as prosumers or consumers. The ABM is applied for a set of alternative electricity market structures. Results assess the impact of solar generation forecasting approaches, battery energy storage, and ratio of prosumers to consumers on the dynamics of peer-to-peer energy trading systems. Designing an efficient, equitable, and sustainable future energy system hinges on the recognition of trade-offs on and across, social, technological, economic, and environmental levels. Results demonstrate that the ABM can be applied to manage emerging uncertainties by facilitating the testing and development of management strategies.

1. Introduction

Distributed energy resources (DER) are transitioning modern electric grids by shifting generation from utilities to the end-users [1]. Solar photovoltaics (PV) and battery storage systems collectively empower traditional utility customers to become prosumers [2], or end-users, who can consume energy and sell excess electricity back to the grid [3]. The introduction of the prosumer has the potential to place a large share of the generation market into the hands of those at the grid edge [4]. This transfer of market power has created the need for a system that can better manage distributed generation (DG) of electricity [1,5]. One concept for facilitating DG is peer-to-peer (P2P) energy trading [6].
P2P electricity trading is the exchange of surplus renewable energy among pro- and consumers [6,7]. By assigning a value to units of surplus renewable energy, a virtual marketplace is created that overlays the physical infrastructure and flow of electricity with a financial accounting structure [8]. P2P energy trading provides a free-market system for prosumers to exchange excess electricity with neighboring consumers at a pre-arranged price [6,9]. Online P2P energy trading platforms may add new value to renewable electricity generation while also encouraging conservation of natural resources [4,8,10]. Moreover, the reconciliation of multiple users’ energy and pricing information may enable equity in consuming energy from renewable sources [11]. Advocates of virtual energy trading stress its potential in making green energy more affordable and more accessible to larger shares of the population [4].
While P2P offers economic and environmental benefits, little is known about the effect of P2P interactions on realized net electricity costs of households [12]. As P2P markets are an emerging and novel type of energy system configuration, new research is needed to explore how alternative electricity market structures and individual decision strategies affect the dynamics of neighborhood electricity exchanges and the performance of the market [1,10]. There are few analyses of real-world applications [6], and discussions around the virtues and shortcomings of P2P energy trading rest predominantly on theoretical analyses to date (cf. [13,14]). Systematic, empirically-based investigations are needed [12] to move beyond theoretical discussions and to advance our understanding of the effects of P2P energy trading on participants and infrastructure alike (cf. [10,15,16,17]).
The goal of this research is to explore how alternative governance structures affect the performance of a P2P market in the context of a real-world case study. We use an agent-based modelling (ABM) approach to simulate consumer and prosumer agents that enter the market equipped with storage solutions, forecasting algorithms, and willingness-to-buy and accept values. ABM is a computer simulation technique that uses an in silico approach to model micro-level actions and interactions to study the emergence of macro-level phenomena for complex adaptive systems [18]. Here, we simulate the interactions of prosumers and consumers with the physical, technical, and financial aspects of P2P systems to generate insight about the emerging dynamics of electricity prices [4,14,19]. The ABM framework is applied using empirical data to simulate decentralized electricity trades in an existing residential neighborhood in Perth, Western Australia. The ABM is developed using data about 18 consumer and prosumer households that participated in a P2P market trial. Data describing energy consumption profiles, energy generation profiles, and willingness-to-accept and willingness-to-pay values for excess solar generated power are used as input for the ABM.
The contributions of the study are twofold. This research addresses a gap in the literature by applying an ABM for observations of an existing P2P market; other applications of ABM for P2P energy trading have not been validated for real-world data observed for P2P markets [1,5,6,20]. In validating the ABM, we find that the structure of transaction fees led to market failure and a lack of engagement among consumers and prosumers in bidding. There is some discrepancy between the modeled outcomes (e.g., electricity price and energy exchanged) and the observed outcomes due to the implementation of the market: rules that were specified to limit trading were not enforced throughout the trial. Secondly, the validated ABM framework is applied to explore the performance of alternative electricity market structures that use different approaches to forecast energy generation and alternative storage solutions. As such, it explores how adaptations to the set-up of the Perth trial may change market outcomes. Results are analyzed to assess the effect of forecasting approaches and storage on untraded excess and the price of electricity. This paper develops new insight about the potential market gains, based on buyer and seller electricity price, that can be achieved through alternative market designs and structures. The model that is developed here can be applied for other systems to test potential market designs and select market governance structures for new applications.
This paper is organized as follows. Section 2 describes the theoretical foundation of blockchain-enabled P2P energy trading and the use of ABM to simulate the integration of renewables in smart grids. Section 3 characterizes the case study of Perth, Western Australia and the trial of P2P energy trading in the Fremantle residential neighborhood. Section 4 describes the ABM of the electricity market to simulate decentralized P2P energy trades and its implementation using the multi-agent simulator of neighborhoods (MASON) open-source toolkit [21].. Section 5 explains the modeling scenarios simulated in the study. Section 6 lists a set of results from the analysis of alternative electricity market structures, the use of storage, and the clustering of trial participants. Section 7 provides a discussion of the impact of governance structures on the dynamics of P2P energy systems and the scale at which they are most effectively managed. Finally, Section 8 presents the conclusions of our study.

2. Background

2.1. Peer-to-Peer Energy Trading

With the growing prominence of small-scale and local generation of renewable energy, community energy initiatives and new market models have emerged [22] to address the need for innovative management mechanisms. Given its potential effectiveness in managing DER [20], P2P energy trading as one such mechanism is expected to become a key element of future power systems [23]. Although a variety of potential P2P market configurations exist, it may generally be described as the flexible trading of excess energy from small-scale DER among customers in a neighborhood [23].
A number of benefits have been linked with P2P energy trading, including better overall system efficiency [4] and the potential to improve social cohesion and sense of community (ibid.). Energy matching, uncertainty reduction, and preference satisfaction have been identified as potential value streams offered by P2P energy trading platforms [10]. It has further been argued that the emergence of prosumers may contribute to the viability of P2P trading through increases in diversity and variability of energy demand [10]. Importantly, a central motivator for the transdisciplinary interest in P2P trading has been cost optimization, and potential cost savings for communities and their members are frequently cited (e.g., 4, 5).
Some evidence of cost savings is beginning to emerge (e.g., 20, 7), but so are indications of challenges. One study found that cost savings that can be achieved through P2P trading are highly sensitive to a range of factors that are, as of yet, poorly understood [7]. For example, it was found that higher PV penetration led to lower cost savings for households with PV systems, and that batteries only increased savings if the PV systems was sufficiently large [7]. Challenges also exist regarding the practical implementation of P2P energy trading. For example, to calculate bills, near-real-time information on amounts of electricity produced, types of trades, and time of trades is required [6]. Other questions pertain to sub-optimal economic outcomes [2,10], privacy and security concerns [13], and adequate prosumer engagement and education [2,10].
Lastly, research on P2P energy trading thus far has had limited access to empirical evidence to validate expectations. Given the novelty of the field, only a small number of practical demonstration projects and trials have been discussed in the literature, with the most frequently cited ones being Vandebron in The Netherlands [4,10,24], sonnenCommunity in Germany [4,10,24], Piclo in the UK [4,10,24], and the Brooklyn Microgrid (US) [4,6,10]. In addition to the relatively small pool of potential sources of data, projects differ substantially in focus and design [25]. As a result, literature on P2P energy trading currently suffers from a lack of empirical grounding. Simulation studies have therefore served as an important tool and source of information for researchers and practitioners.

2.2. Blockchain Technology for Facilitating Peer-to-Peer Energy Trading

Blockchain technology has garnered interest as an information and communications technology capable of addressing some of the challenges in implementing a P2P electricity market [5]. Blockchain technology promises to offer new opportunities and innovation in decentralized generation and energy markets [13,26] through improved means of managing and controlling decentralized and digitized systems [26]. Providing immutable records of all transactions in a decentralized and distributed ledger, the technology promises security, accuracy, authentication, and traceability of transactions [9,13].
A blockchain is an ever-growing data structure that is shared among member nodes in a decentralized network. This distributed ledger offers a platform for digital transactions and applications to proceed without using a trusted third-party organization for authentication. Blockchain technology enables a trustless decentralized peer-to-peer electronic cash payment network with minimal transaction cost [27]. Transactions facilitated by a blockchain are mutually agreed upon and secured by nodes through a distributed consensus, which is the process of adding new blocks of data to the blockchain data structure [26,28]. Blockchain data structures are both immutable and cryptographically verifiable [27].
The possibility of secure management of transactions without the need for a third party is a distinct feature of public blockchain platforms [10]. Blockchain-based trading platforms are differentiated from other platform models for P2P trading that focus on delivering particular benefits, such as raising awareness around community microgrids or creating a value-added service [10]. Others have highlighted the wide range of possible use cases for blockchain technology in the context of P2P trading and decentralized energy, including, for example, business-to-business trading, community energy, and coordination of virtual power plants [26]. Despite the potential benefits, Andoni et al. [26] pointed out that a key challenge in this application area is integrating trading systems into the existing network.

2.3. Agent-Based Modelling in the Context of Peer-to-Peer Energy Trading

The complex, dynamic nature of energy systems has made simulation studies, and ABM in particular, a viable approach in the study of emerging energy system structures. ABM has the ability to account for the complexity of interactions in real-world settings [29]. This makes it uniquely suited to simulating energy systems [30,31] and an important tool for the management of power systems [16]. Using ABM, dynamic processes and their emergent properties can be simulated effectively based on interactions among heterogeneous, autonomous agents. ABM is applicable for emerging P2P markets that are formed through interactions between rational and distributed decision-making units [16,17].
There is a growing body of literature dedicated to applications of ABM to energy systems. Electricity markets in particular have been the focus of many ABM applications [30,32] and include those based on P2P interactions. Mengelkamp, Notheisen, et al. [33] found that blockchain technology can be employed to design decentralized, local energy markets and confirmed the potential of these markets to lead to electricity cost savings (ibid.). An evaluation of the simulated performance of three different sharing mechanisms was conducted by Zhou, Wu, and Long [1] and indicated a potential of residential P2P energy sharing to generate economic benefits. Long et al. [20] proposed a sharing mechanism aimed at ensuring economic benefits for all individuals in a community. Analyzing these benefits further, they showed reduced costs for the community as a whole, reduced electricity bills for individuals, and an increase in both self-consumption of PV energy, and in self-sufficiency [20].
Zhang, Wu, Cheng, Zhou, and Long [34] also demonstrated the potential of P2P energy trading to balance demand and generation in a local market. Lüth et al. [6] analyzed how electricity storage in a local P2P market may benefit end-users. Proposing two different market designs—one with decentralized (prosumer-level) and one with centralized (community-level) storage—they analyzed the value of their models in a heterogeneous prosumer group that differed in terms of demand patterns as well as available technology (ibid.). Findings in this study showed that, while both models were economically viable, the centralized storage design yielded slightly lower cost savings, but more trades [6]. These dynamics were found to be primarily driven by the type of market design. The trade-off between higher independence of the main grid or higher levels of integration of storage and P2P trade suggests that, when designing markets in practice, the market’s primary objective should be considered (ibid.).
These ABM studies provide valuable insight into possible designs and dynamics of P2P energy markets. As applied to other types of studies on P2P energy trading, there is a need to establish better empirical foundations and improve the integration of empirical data into model design and analysis. The first issue lies in the type of data used in simulations. Data used to simulate trading models is often based on averages (e.g., 33, 1), may stem from various different sources (e.g., 33), or may be artificially simulated (e.g., 22). Various authors call for the use of real consumption data [33], or of local demand and generation data [1], in future research. Secondly, there is a lack of empirical data being used in the validation of ABM (cf. 35). ABMs should be rigorously grounded in theoretical and empirical foundations [35].
Another dimension of the missing empiricism is a disregard for the stakeholders involved in P2P energy trading markets. Engaging the stakeholders of local energy markets is essential to improve public acceptance of such systems, especially when both the market design and the ICT (e.g., blockchain) are new [33]. Formulation of shared visions about the objectives and operation of microgrid energy markets may help increase communities’ acceptance (ibid.). It has further been argued that end-users and their active participation in markets have received insufficient attention in market designs [6,16]. The fact that the behavior of the actors involved in such markets has not yet been sufficiently studied contributes to the current uncertainty regarding the configuration of future energy systems [31]. The imperfect communication and forecasting abilities that agents hold in the real world should be considered in modeling studies [1].
This article makes several contributions at the interface of P2P energy trading and ABM research. We contribute to the burgeoning literature on P2P energy trading by analyzing the dynamics arising from the interactions of heterogeneous pro- and consumers with an empirically tested pricing structure and trading mechanism. To the authors’ knowledge, this is the first post-hoc agent-based study of a real-life P2P energy trading trial. Methodologically, we thereby address the lack of empirical data for modelling and validation in ABM studies by presenting a framework and simulation based on a real-world trial. Using available data, real consumption and generation data was used to run the simulation, and simulation results were validated against observed dynamics. Finally, the validated ABM was used to assess alternative market structures in the context of the case study.

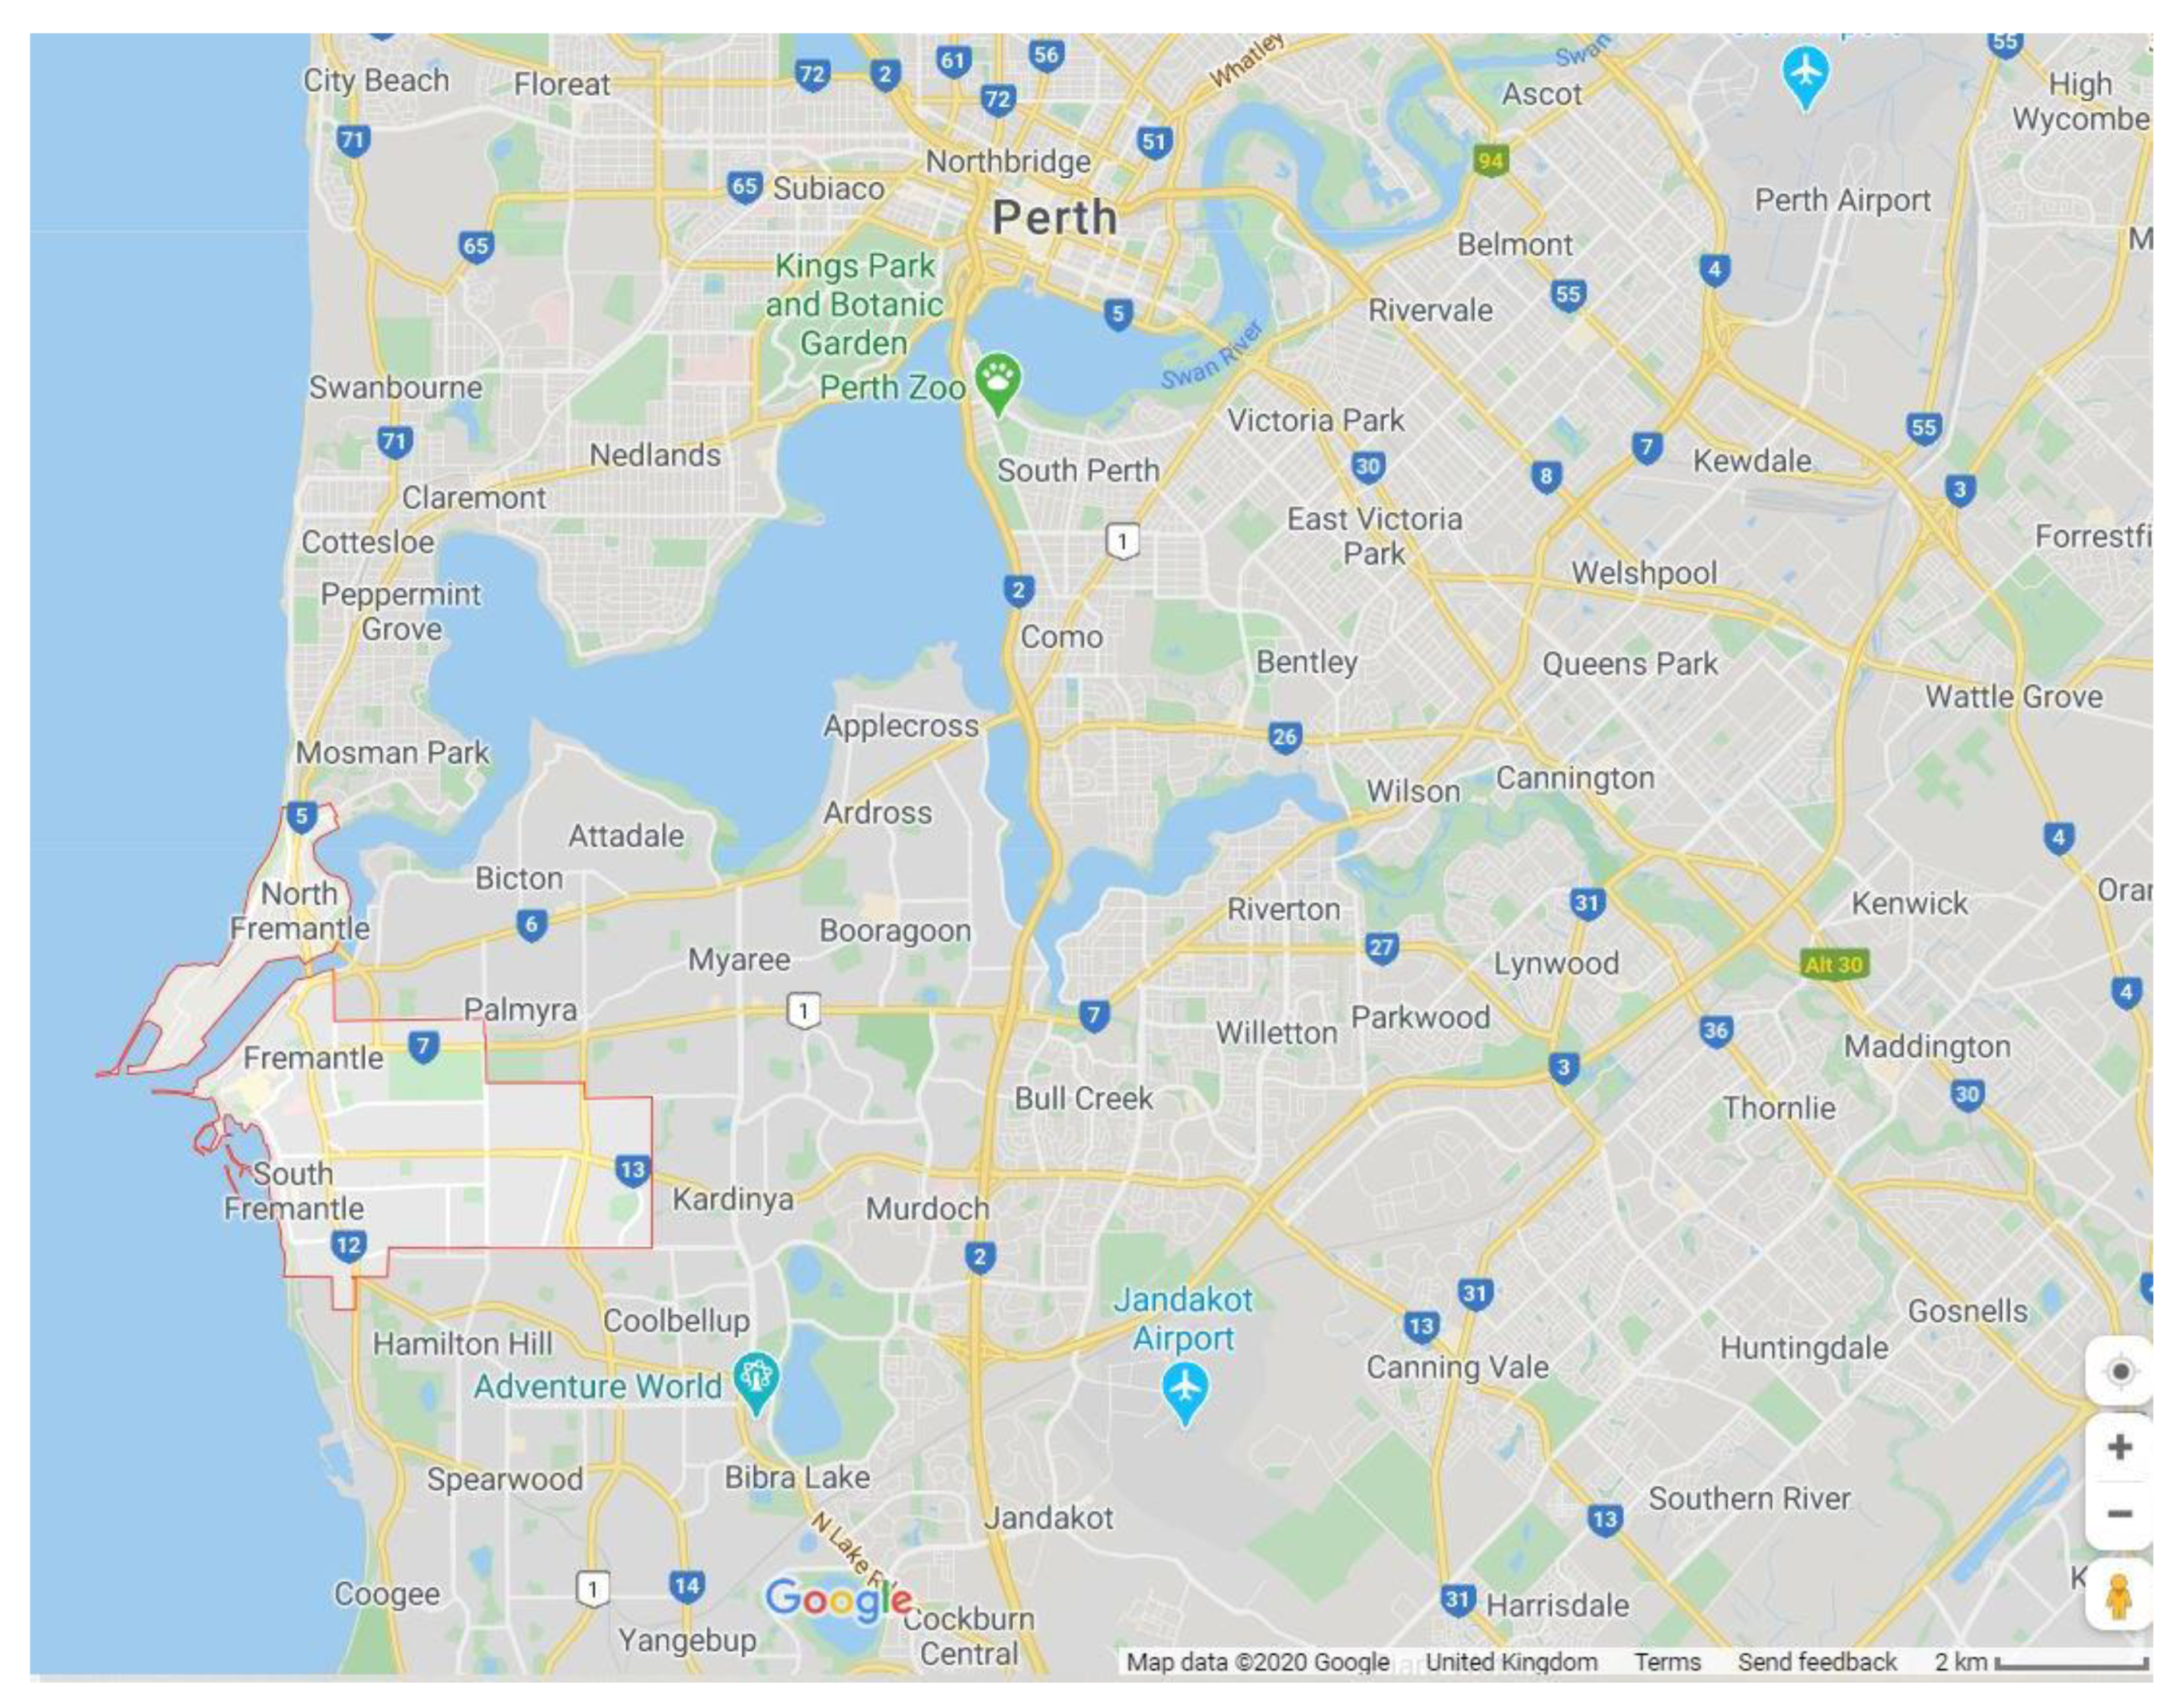
3. Case Study: The RENeW Nexus Trial in Perth, Western Australia

3.1. Case Study Description

The present study combines the capabilities of ABM with empirical data from the Renewable Energy and Water Nexus (hereafter RENeW Nexus) P2P energy trading trial conducted in Perth, Western Australia, between August 2018 and June 2019. As part of the Australian Government funded RENeW Nexus project, the trial was run by a consortium of research, government, and industry partners, including the state utilities, and a blockchain-based energy trading start-up company. Electricity consumption and solar generation data were initially collected from 50 households recruited through an expression of interest process. Eighteen of these households subsequently signed up to the P2P electricity trading trial conducted in the Perth suburb of Fremantle between November 2018 and June 2019 (Figure 1). A discussion of why participants decided to withdraw from the RENeW Nexus study is provided by Wilkinson et al. [36]. Only data from the 18 households were used in the simulation application described here.
Perth enjoys a mild climate with an annual mean temperature of approximately 24 °C (based on 1993–2019 data) [37]. Annual mean global solar exposure in Fremantle in 2019 was 5.5 kWh m2, with a low of 2.7 kWh m2 in June and a high of 8.3 kWh m2 in December [38]. An estimated 23% of dwellings in the Fremantle Local Government Area (LGA) have rooftop solar PV systems, with an installed capacity of approximately 11,280 kW [39]. This is compared to 19.5%, 23.7%, 27.3%, and 33.2% of dwellings with rooftop PV systems in the neighboring LGAs of Mosman Park, East Fremantle, Melville, and Cockburn, respectively. The state-wide average for Western Australia is 28.8%.

3.2. Neighborhood Characteristics

The trial cohort of 18 participants comprised of 6 consumers and 12 prosumers, i.e., participants with a rooftop solar PV system installed at their home. As part of the wider RENeW Nexus project, a number of surveys and workshops were administered to varying (sub-)groups of participants that provide additional background information. 14 trial participants responded to questions about household characteristics (four households elected not to participate), leading to the following statistics: average household size within the trial cohort was 2.6 adults and 1.5 children (0–18 years). Homes had an average of 3.4 bedrooms, 2.2 bathrooms, and 2.4 living areas and were built between 1945 and 2018. Solar PV system capacities averaged approximately 4–5 kWh, ranging from 1 to 10 kWh (Only 11 out of 12 prosumers provided system size; average of 4.64 kWh based on these 11). Further information on neighborhood characteristics and an analysis of qualitative data from the RENeW Nexus project is available in Wilkinson, Hojckova, Eon, Morrison, and Sandén [36].
All trial participants had access to an online trading platform that allowed them to set and adjust their buying and selling prices at any time. Set rates remained active until the next change was made. Prices to be set were peak and off-peak rates for maximum buying and minimum selling prices per kWh of excess solar energy. In addition, the following prices (in Australian Dollars) applied:
  • Rate for grid-sourced energy: $0.0572 per kWh (off-peak); $0.0990 per kWh (peak/3 p.m.–9 p.m.)
  • Retailer rate for purchase of any unsold excess: $0.04 per kWh
  • Retailer daily capacity charge: $1.10
  • Daily network operator charge: $2.20
  • Platform transaction fee: $0.005 per kWh purchased through trading

3.3. Observations of P2P Market Performance

Monthly electricity consumption and solar energy generation for 18 households are shown below for the trial system (Figure 2). The results indicate that there are seasonal gradients for both profiles: a general decrease in generation and increase in consumption from November to June. The negative gradient in solar generation can be attributed to the decrease in direct solar irradiance from the end of spring in November to the beginning of winter in June, which is consistent for geographic areas in the southern hemisphere. The positive gradient seen in the profile for electricity consumption is likely due to the general increase in household space heating from late spring to early winter. It is important to note that, in Western Australia, the penetration rate of household space heating systems (90%) is higher than that for air cooling systems (79%), which shows that the electricity consumption in the trial system is probably driven more by heating than cooling [39]. The solar generation dominates electricity consumption in the system from November to April, with the opposite being true in May and June.
The temporal profile of daily total changes to willingness-to-pay and willingness-to-accept values for all participants are shown below for the entire length of the market trial (Figure 3). Participants were highly engaged early on, with the largest peak in activity occurring on the day of the launch. Changes within the first month and a half of the trial can be attributed to the learning curve effect and early emails from program administrators with tips on how to use the trading system. Additionally, a few of the trial participants were onboarded to the market system in mid-December, which can account for some of the dynamics during that time. The profile of bid pricing updates becomes mostly static after mid-January. The decrease in the dynamics of bid pricing is likely due to apathy of engagement because of poor economic opportunities from participation resulting from high monthly fixed fees, which is described below. A lack in understanding of how to use the online trading system by some participants also likely influenced the decrease in bid pricing dynamics.

4. Agent-Based Modelling Framework

An ABM framework was developed to simulate the dynamics of a peer-to-peer energy market to model electricity exchanges and prices for the RENeW Nexus trial system in the Perth suburb of Fremantle. A set of consumers, a set of prosumers, the Power Ledger trading platform, and an electricity retailer were simulated as agents; their interactions were simulated to assess market dynamics and the value of electricity in a local peer-to-peer system (Figure 4). The framework also simulated household-level battery energy storage with multiple scenarios of varied functionality; the framework simulated automatic battery unit charging and discharging, predefined schedules for charging and discharging the battery unit, and no battery energy storage. Automatic charging and discharging provide full flexibility over battery resources, allowing energy storage units to charge whenever irradiance is present and to discharge whenever there is available capacity. Predefined schedules for charging and discharging energy storage units constrain the flow of electricity to and from battery banks to daily timelines set by the household; electricity is not allowed to flow into battery units outside of the charging timeline, and electricity is unable to flow from the units outside of the discharging timeline. The framework was constructed using the MASON agent-based modeling open-source toolkit [21]. A complete summary of the market and energy storage dynamics simulated in the ABM framework is provided below according to the ODD protocol [40].

4.1. Overview

Purpose: The purpose of the model was to assess the value of electricity as determined by the dynamics of a residential peer-to-peer energy market.
State Variables and Scales: A set of prosumer households and a set of consumer households are represented as dynamic agents in the model. The state variables for the prosumer and consumer agent types are listed below in Table 1. Additionally, the platform is represented as an oracle agent, and the retailer is represented as a retailer or utility agent; their state remains static and their behaviors are outlined below in process overview and scheduling. The model was simulated for one month with a step period of 30 min, which was the trade interval length used in the RENeW Nexus trial system.
Process Overview and Scheduling: At each time interval, the order of operations in the ABM were executed for the RENeW Nexus system rules using the set of steps described below. For a scenario with no forecasting, the following steps were applied.
Step 1. Discharge initial storage: Available storage was initially discharged at the beginning of the current interval to satisfy prosumer household demand. If the time of day was outside of discharge hours, then there was no initial storage discharge for the predefined storage method.
Step 2. Communicate bid prices: Prosumer agents communicated their willingness to accept (WTAj) for surplus electricity. Consumer agents communicated their willingness to pay (WTPj) for surplus electricity.
Step 3. Perform market exchanges: Buyers and sellers were aligned in a bilateral exchange market based on their WTPj and WTAj values. Trades were successful if the WTPj value of the buyer was greater than or equal to the WTAj value of the seller; transactions were cleared at the buyer’s WTPj value. The trade agreement was defined so that the seller could exchange up to the buyer’s full demand or their total excess generation for the upcoming interval. If two or more sellers had the same WTAj value, sellers bid together, and their upcoming excess were grouped in the same exchange. If two or more buyers have the same WTPj value, buyers bid together, and their demand values were grouped in the same exchange.
Step 4. Satisfy prosumer demand remaining after initial discharge: Prosumers used their energy generation, Gj, to satisfy demand remaining after initial storage discharge.
Step 5. Execute electricity exchanges: Seller generation remaining after demand and energy storage remaining after initial storage discharge was routed to the grid to satisfy electricity trade agreements made by sellers in the peer-to-peer market. If there were multiple sellers on the same exchange, then sellers sold all surplus electricity for the upcoming interval if the amount was smaller than the upcoming demand from the buyer(s). If the upcoming demand of the buyer(s) was smaller than the combined surplus of the sellers, then sellers exchanged an equal amount of surplus electricity between those on the same exchange, up until the seller with the smallest amount of surplus had exhausted their resources; this process repeated down the order of sellers until the demand of the buyer(s) was fully satisfied. If there were multiple buyers on the same exchange, then buyers all bought surplus electricity up to their demand for electricity for the upcoming interval if their combined demand was smaller than the total amount of surplus from the seller(s). If the upcoming amount of surplus from the seller(s) was smaller than the combined demand of the buyers, then buyers purchased an equal amount of surplus electricity between those on the same exchange up until the buyer with the smallest demand had filled their demand; this process repeated down the order of buyers until the surplus from the seller(s) had been fully purchased. Exchanged electricity from the seller(s) was first supplied by the available storage remaining after initial discharge; sold electricity could not be supplied by storage with the predefined storage method if outside of discharge hours. Solar generation remaining after prosumer demand was then supplied for the trade agreement made with the buyer(s).
Step 6. Fill battery energy storage unit: Any generation remaining after satisfying electricity exchanges in the market was routed into the battery bank. If there was more solar generation remaining than storage capacity available, then the battery bank was charged to maximum capacity, and leftover generation was routed to the local grid at the buyback rate set by the retailer. Battery energy storage was not charged by remaining generation for the predefined storage method if outside of charging hours; in this case, all leftover generation was routed to the local grid at the buyback rate set by the retailer.
Step 7. Satisfy buyer remaining demand: Any demand remaining for buyers after satisfying electricity exchanges in the market was supplied by the utility at the retail rate.
Steps were changed slightly for the solar forecasting scenario, as follows.
Step 1. Discharge initial storage: Available storage was initially discharged at the beginning of the current interval to satisfy prosumer household demand. There was no initial storage discharge for the predefined storage method if outside of discharge hours.
Step 2. Communicate bid prices: Each prosumer agent checked if GFj would satisfy remaining scheduled demand for the interval; calculations for GFj are outlined below in the sub-models section. If loads could not be satisfied, then the prosumer communicated the remaining demand amount to the market along with the WTPj value. If demand could be satisfied, then the prosumer checked to see if there as any surplus. If there as surplus between remaining storage and GFj, then this amount was communicated to the market with the WTAj value; storage was not included in the surplus calculation for the predefined storage method if outside of discharge hours. If there as no surplus, then the prosumer did not go to the market. Consumer agents communicated their upcoming demand to the market with their WTPj value.
Step 3. Perform market exchanges: Buyers and sellers were aligned in a bilateral exchange market based on their WTPj and WTAj values. Trades were successful if the WTPj value of the buyer was greater than or equal to the WTAj value of the seller; transactions were cleared at the buyer’s WTPj value. Trading was repeated until all demand was exhausted, surplus was completely bought, or the highest WTPj value of the buyers was smaller than the lowest WTAj value of the sellers.
Step 4. Satisfy seller demand remaining after initial discharge: Prosumers used Gj to satisfy demand remaining after initial storage discharge.
Step 5. Execute electricity exchanges: Seller generation remaining after demand and storage remaining after initial storage discharge were routed to the grid to satisfy electricity trade agreements made by sellers in the peer-to-peer market. Sold electricity was first supplied by the available storage remaining after initial discharge; sold electricity could not be supplied by storage with the predefined storage method if outside of discharge hours. Any sold electricity that was left over was then supplied by solar generation remaining after demand. The amount of electricity that was sold could be higher than what the household could supply to the local grid based on forecasting errors. In this case, all remaining storage and solar generation was injected into the grid; storage was not injected into the grid with the predefined storage method if outside of discharge hours. The utility supplied the amount of sold electricity that remained after all prosumer energy resources were exhausted, which the prosumer had to pay for at the retail rate.
Step 6. Fill battery energy storage unit: Any generation remaining after satisfying electricity exchanges in the market was routed into the battery bank. If there was more solar generation remaining than storage capacity available, then the battery bank was charged to maximum capacity and leftover generation was routed to the local grid at the buyback rate set by the retailer. Battery energy storage was not charged by remaining generation for the predefined storage method if outside of charging hours; in this case, all leftover generation was routed to the local grid at the buyback rate set by the retailer.
Step 7. Satisfy buyer remaining demand: Any demand remaining for buyers after satisfying electricity exchanges in the market was supplied by the utility at the retail rate.

4.2. Design Concepts

Emergence. The system price of electricity emerged from the interactions of the prosumer and consumer agents.
Heterogeneity. The prosumer and consumer agents both had a different consumption profile as well as different willingness-to-pay and willingness-to-accept values. The prosumer agents also had differing generation profiles.
Prediction. Prosumers predicted their solar production at the beginning of each trading interval using a simple forecasting model.
Sensing. Both the prosumer and consumer agents were aware of their demand profile.
Interactions. The prosumers and consumers could communicate energy bids if surplus electricity existed, and bids could be accepted or rejected based on the willingness-to-pay and willingness-to-accept values.

4.3. Details

Initialization: The agent-based modeling framework was initialized with values for number of prosumers as well as charging and discharging timelines for the predefined storage method. The default numbers of prosumers and consumers were 12 and 6, respectively. For the predefined storage method, default charging and discharging timelines were set as hours 09:00–14:59 and 15:00–20:59, respectively.
Input: The input data provided for the agent-based modeling framework included the consumption schedule for each household, generation profile of households with solar PV, and the timelines of willingness-to-accept and willingness-to-pay values for excess solar generated power. The input values were all taken from data recorded by the Power Ledger blockchain platform. These data for the RENeW Nexus system are shown in Section 3.3 above.
Forecasting Sub-Models: There are two forecasting models that prosumers used to predict upcoming solar production for each trading interval, including the perfect and simple forecasting models. The perfect forecasting model assumes that the prosumer knows exactly the solar production for the upcoming trade interval. The simple forecasting model calculates GFj for the current interval using Equation (1), which multiplies the generation value of the previous trade interval by a forecasting parameter.
GFj = Gj−1 * PF
where:
  • GFj = Generation forecast for the current trade interval
  • Gj−1 = Generation value of the previous trade interval
  • PF = Forecasting parameter

5. Modeling Scenarios

The ABM framework was applied to the 18-household trial market system using the RENeW Nexus, perfect forecasting, and simple forecasting market structures; the framework was simulated with 12 prosumers and 6 consumers. The input data that was used in each modeling scenario included generation and consumption data, as well as WTP and WTA data recorded during the actual RENeW Nexus trial. The simple forecasting market structure was modeled with a forecasting parameter (PF) of 75% and 100%. Each market structure was simulated with automatic, predefined, and no storage methods; household battery energy storage systems were modeled after the Tesla Powerwall 2.0 with a 13.5 kWh maximum capacity and a 70% depth of discharge [41]. A summary of settings is provided in Table 2 below.
A prosumer-to-consumer ratio analysis was performed for the RN-N and RN-A scenarios, where the number of prosumers was increased from 1 to 12; prosumers were chosen in each scenario by descending order of total solar generation over the entire market trial. A discharge timeline analysis was performed for the RN-P scenario in which the following timelines were tested: 15:00–20:59; 16:00–21:59; 17:00–22:59; and 18:00–23:59; a charging timeline of 09:00–14:59 was held constant for all scenarios in the discharge timeline analysis.

6. Results

The ABM was applied to simulate the existing RENeW Nexus trial and to explore alternative market structures that can affect market outcomes, based on electricity price and the amount of energy exchanged in the market. Research questions that are addressed in these results are summarized in Table 3.

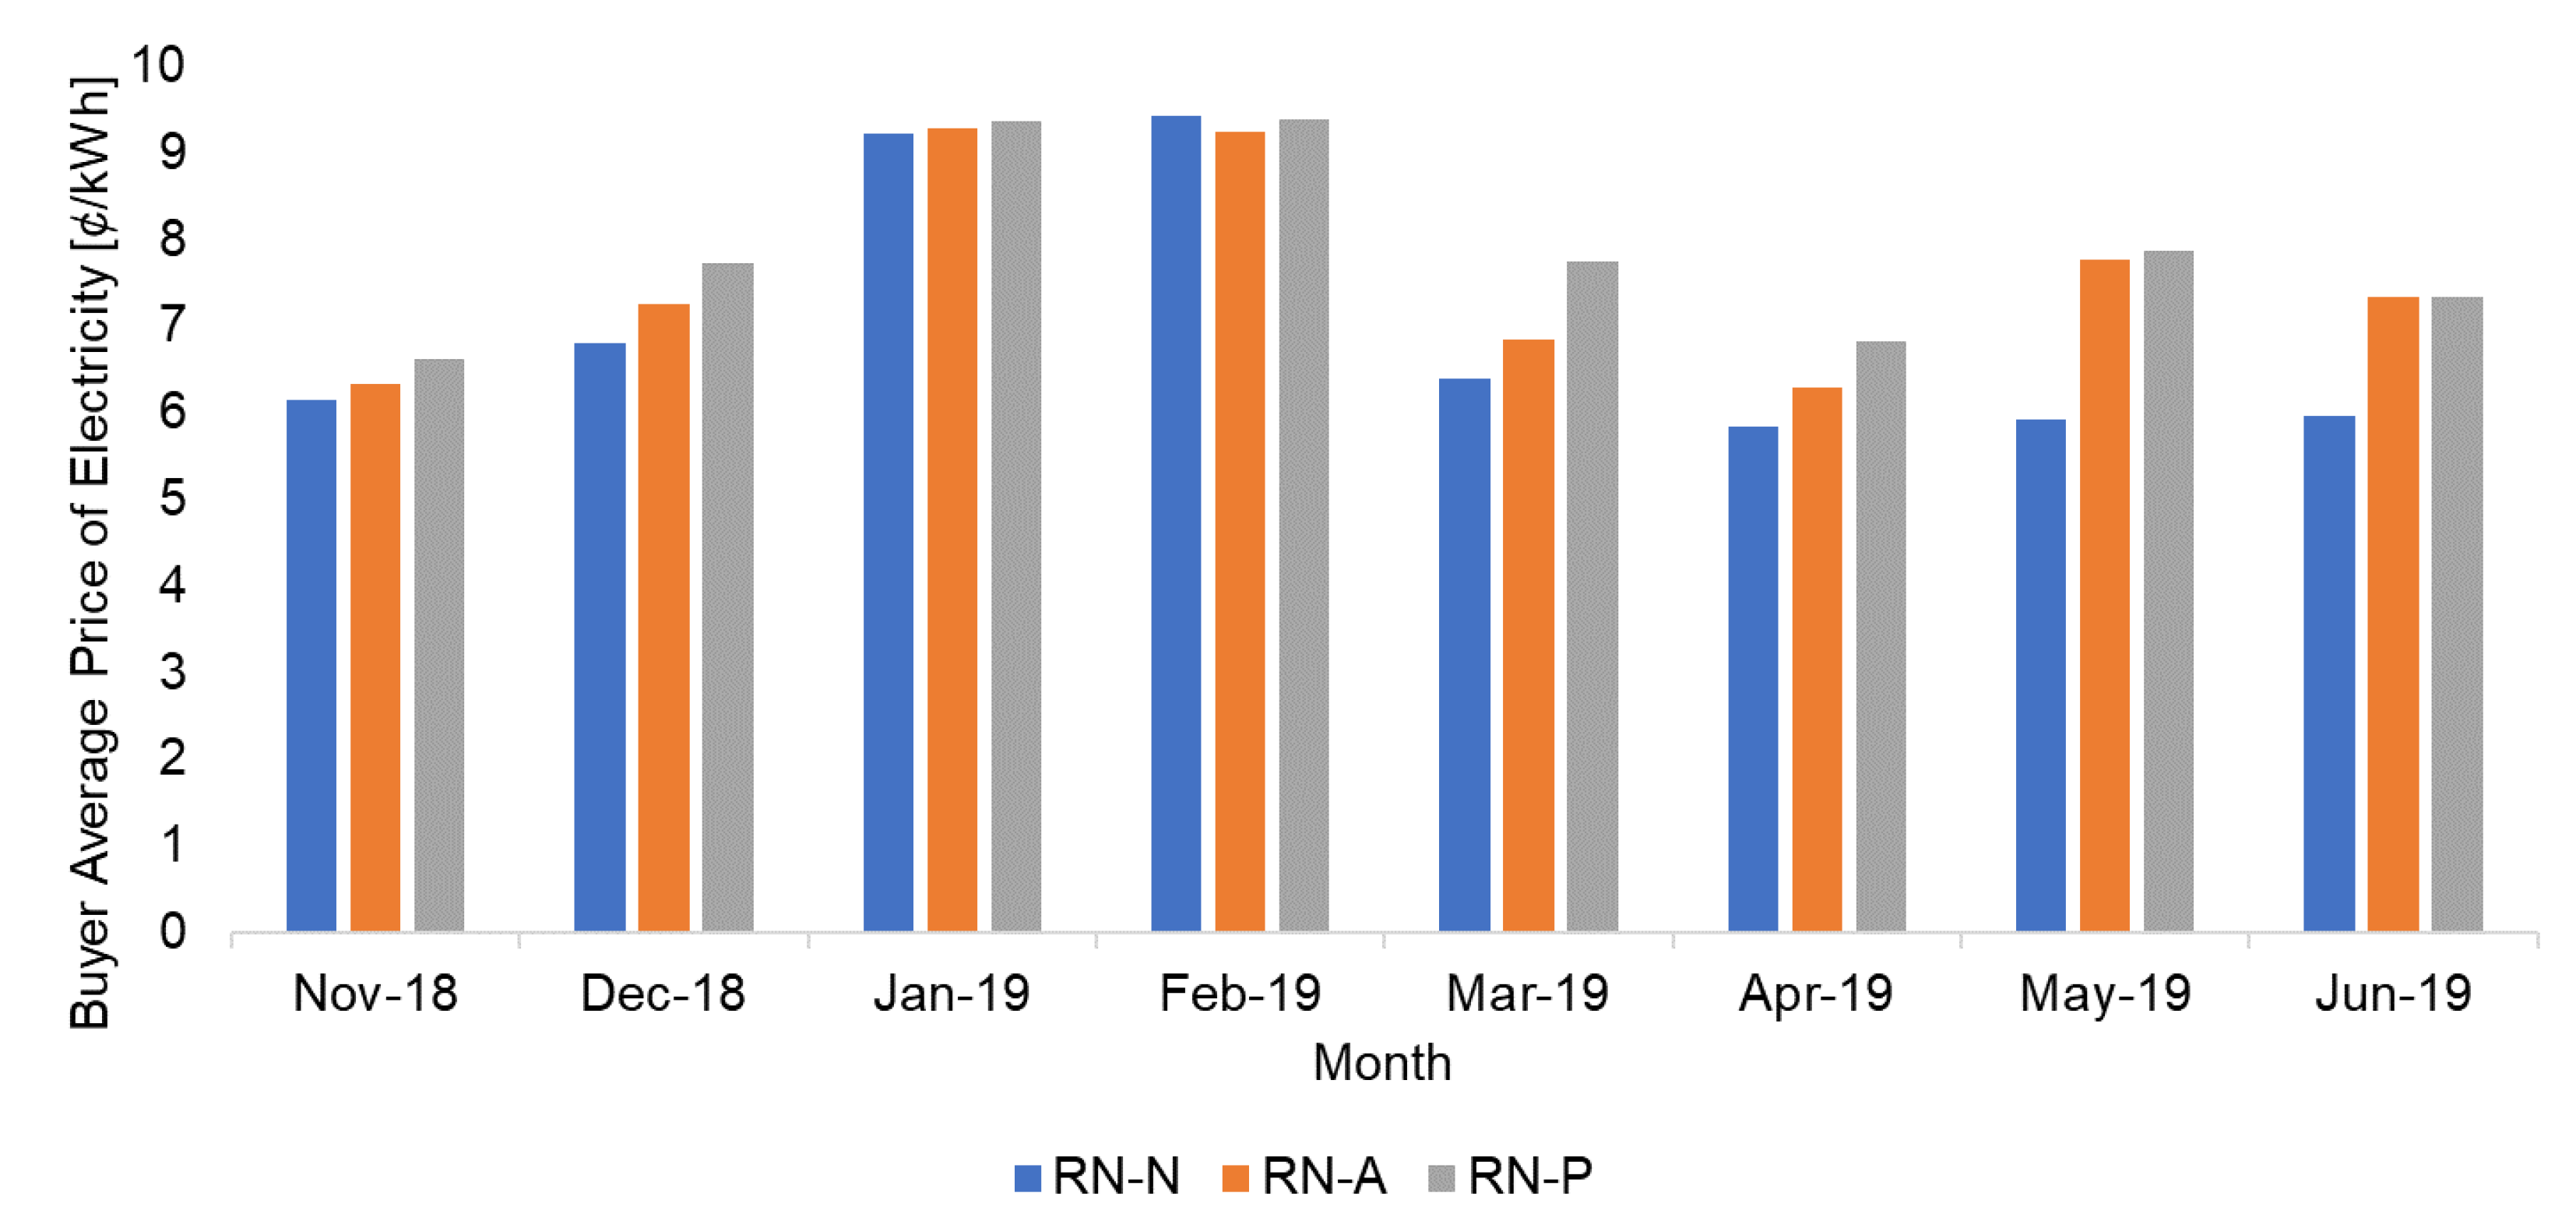
6.1. Analysis of Electricity Price in the RENeW Nexus Market

The ABM was executed to simulate the RN-N scenario, which most closely represents the RENeW Nexus market trial as it was implemented. This scenario simulated the generation, consumption, and exchange of energy for the eight months of the trial without the use of storage or forecasting approaches to improve market efficiencies. The simulated monthly seller and buyer average prices are shown below for the RN-N scenario (Figure 5); the prices include transaction fees as well as monthly generation and network fees. Average prices for buyers were calculated using simulated purchase data for all 18 participants, while the seller average prices were calculated using simulated sell data for the 12 prosumers that were involved in the trial. Buyer average prices were extremely high at multiple orders of magnitude greater than typical prices paid to the utility. The economic incentive for a buyer to participate in the market was the slim margin of savings that was made possible through a prosumer that underbids the retail rate of electricity; however, the fixed monthly generation and network fees overshadowed the marginal savings accrued in the peer-to-peer market. Negative values can be seen for seller average prices, indicating that sellers had to pay to send their excess onto the grid; this happened because the fees were greater than the revenue gained from exchanging excess solar power. Seller prices were much lower than buyer prices, because prosumers received revenue from consumers in the peer-to-peer market and buyback payouts from the utility for untraded excess. There was no economic benefit for either group to participate in the trial, as consumers paid substantially more than typical rates for electricity, while prosumers paid to send their excess power onto the grid.

6.2. Comparison of Observed and Simulated Trading Data

The observed and simulated time series of daily energy exchanged in the peer-to-peer market are shown below for the entire time period of the trial system (Figure 6); the simulated data is based on the RN-N scenario, which is the scenario that most closely resembles the structure of the actual system. There is a large error between the two series, as the actual energy exchanged was higher than simulated values. Over the trial period, the actual energy exchanged was approximately 6900 kWh, while the simulated energy exchanged was 2600 kWh, which is 62% lower than the observed energy exchanged. The error can be attributed to differences between the rules that were modeled for energy exchange and the actual implementation of the trading algorithm. The Power Ledger trading algorithm specifies that (1) prosumers cannot both buy and sell excess generation in the same trade interval, (2) prosumers cannot buy excess generation from themselves, and (3) prosumers cannot enter into more than one exchange per trade interval. The simulated series of energy exchange shows the temporal profile of the trial system with strict adherence to the rules outlined for the Power Ledger trading algorithm. Inspection of the trading data reveals that these three rules were violated in the implementation of the Power Ledger trading algorithm, which inflated the amount of energy that was exchanged in the peer-to-peer market. While there is a discrepancy in the magnitude of values between the actual and simulated energy exchanged, the pattern of peaks and troughs in the temporal profiles are similar.
The actual and simulated daily average price of electricity exchanged in the peer-to-peer market is shown below for entire length of the trial system (Figure 7); the simulated data is representative of the RN-N scenario and only includes transaction fees. Both series keep the price of electricity reasonably close to retail rates, although they can be higher than the on-peak rate during some periods of the year. All prices shown are greater than the 4 ¢/kWh utility buyback rate for excess solar generation. The modeled data matches the observed data well over the trial timeline, although the modeled temporal profile overvalues the actual profile from early January through mid-February and undervalues the actual profile from mid-March through late May.

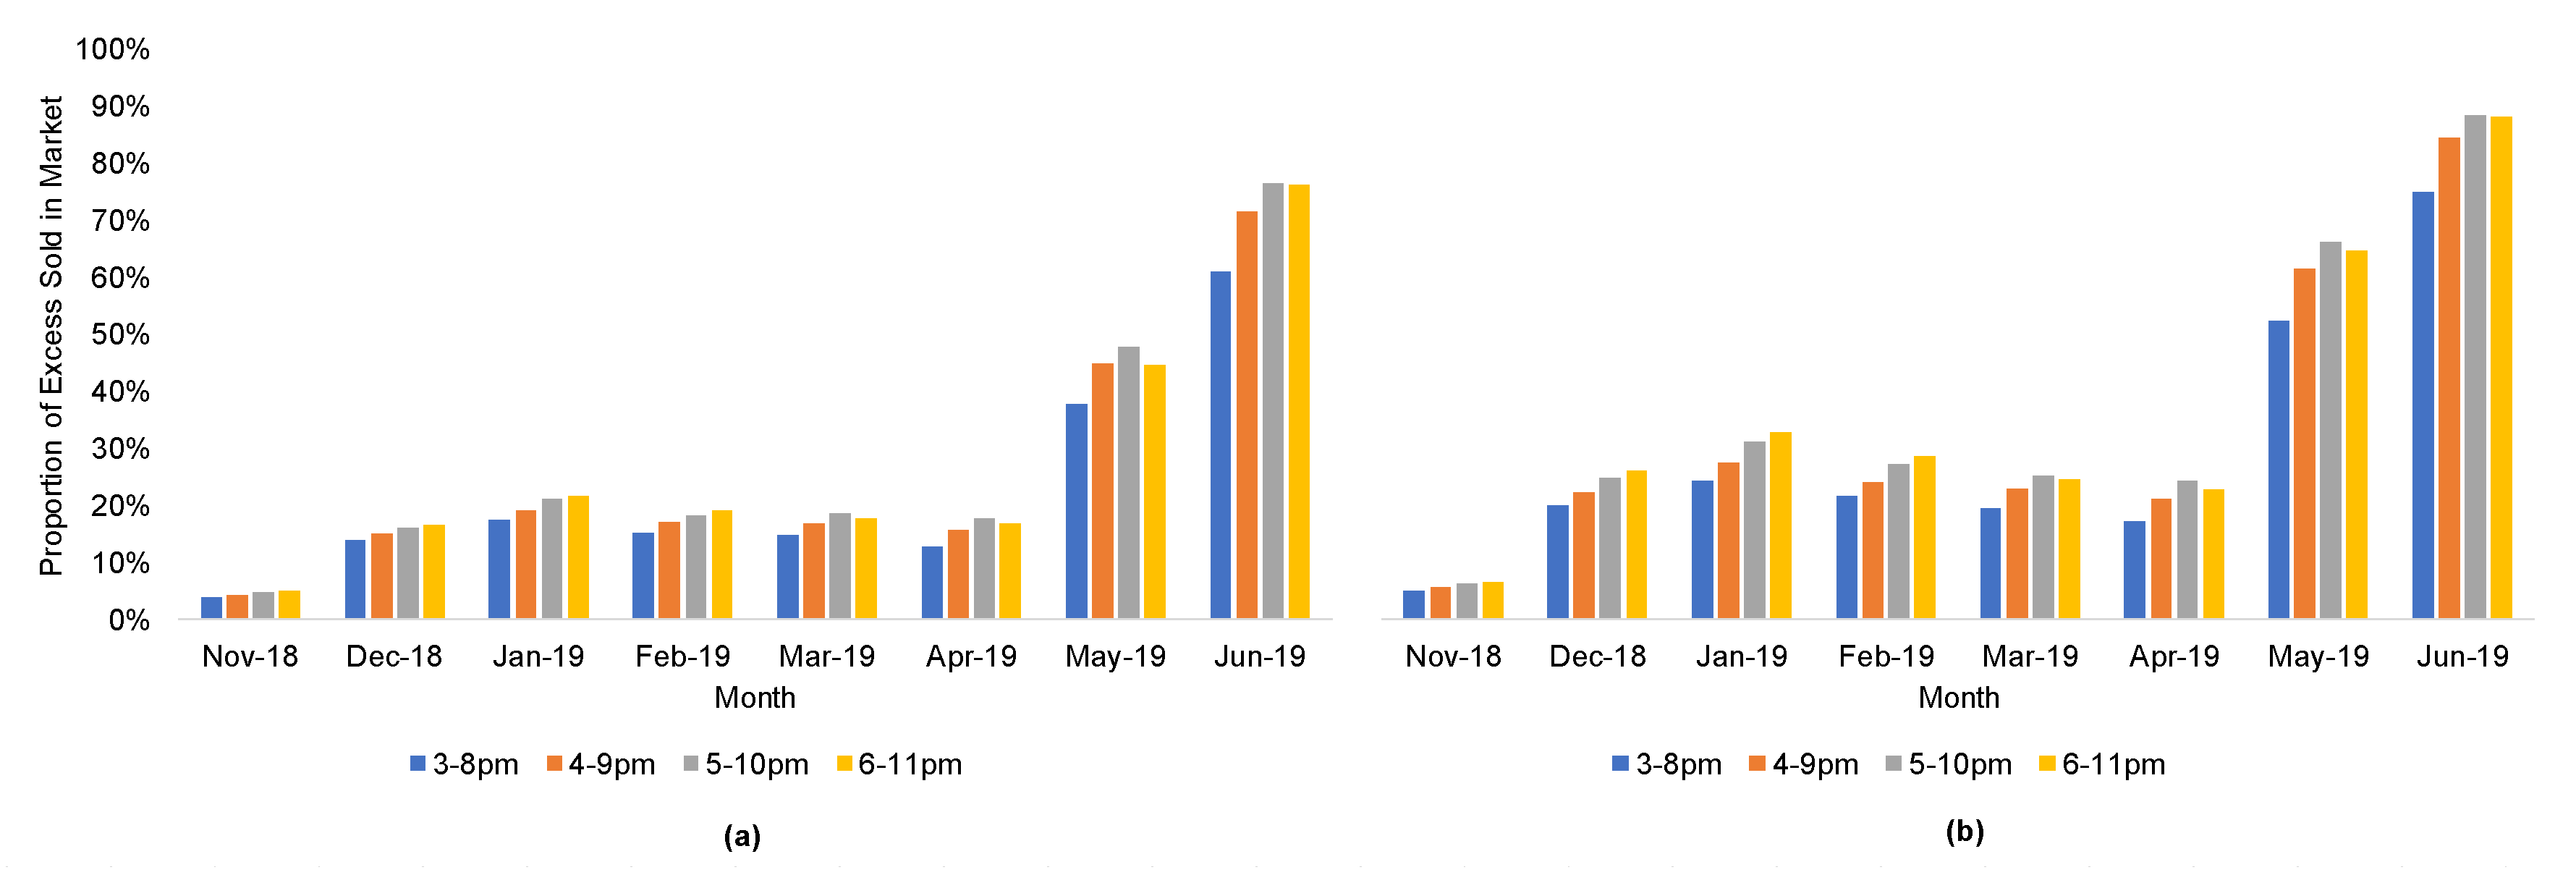
6.3. Evaluating the Effect of Storage on Market Performance

The simulated seller average price of electricity traded in the peer-to-peer market is shown below from November 2018–June 2019 for the RN-N, RN-A, and RN-P scenarios (Figure 8). Prices shown were similar between November and April, with the peak during the month of January. The seller average price increased substantially in the months of May and June for the RN-A and RN-P scenarios, likely due to the increase in electricity consumption for these months. The range in price for each of the RN scenarios across the months was 4.06–4.55 (4.29 mean) ¢/kWh for RN-N, 4.14–6.89 (5.31 mean) ¢/kWh for RN-A, and 4.10–6.05 (4.85 mean) ¢/kWh for RN-P. Automatic and predefined storage capabilities increased prices relative to the RN-N scenario in each month except for November, which was caused by early market inefficiencies from poor bids, or the learning curve effect. The RN-A scenario dominates the RN-P scenario in all months; however, shifting the discharge timeline later in the evening could marginally improve the seller average price for the RN-P scenario (shown in Figure A1). Each monthly seller average price shown here was greater than the standard 4 ¢/kWh utility payout.
The buyer average price of electricity traded in the peer-to-peer market and the proportion of solar generation sold in the peer-to-to peer market are shown in the Appendix A for the RN scenarios (Figure A2 and Figure A3, respectively). The highest average prices emerged in the months of January and February, though prices during other months were in a similar range. The range of price for each RN scenario across the months simulated was 5.85–9.42 (6.97 mean) ¢/kWh for RN-N, 6.30–9.28 (7.55 mean) ¢/kWh for RN-A, and 6.62–9.40 (7.86 mean) ¢/kWh for RN-P. Prices were lowest for the RN-N scenario, because the electricity had to be purchased earlier in the day during off-peak hours of demand. Monthly prices were highest for the RN-P storage scenario, because prosumers were able to place bids during on-peak pricing hours.
The proportion of excess solar generation that was sold in the peer-to-peer market is shown below for simulations of the RN-N, RN-A, and RN-P scenarios (Figure 9). The values shown here correlate well with those seen for the monthly seller average price of electricity. The month of November showed much smaller values compared to the other months, because households were learning how to use the platform and efficiently conduct trades early in the trial. The proportion of sold excess was similar from December through April, then increased in May and June. Both the automatic and predefined storage capabilities increased the proportion of excess generation sold relative to the RN-N scenario, with automatic storage dominating predefined storage. Results for the RN market structure represented a lower bound of performance for the market structures that are tested in the following sections.

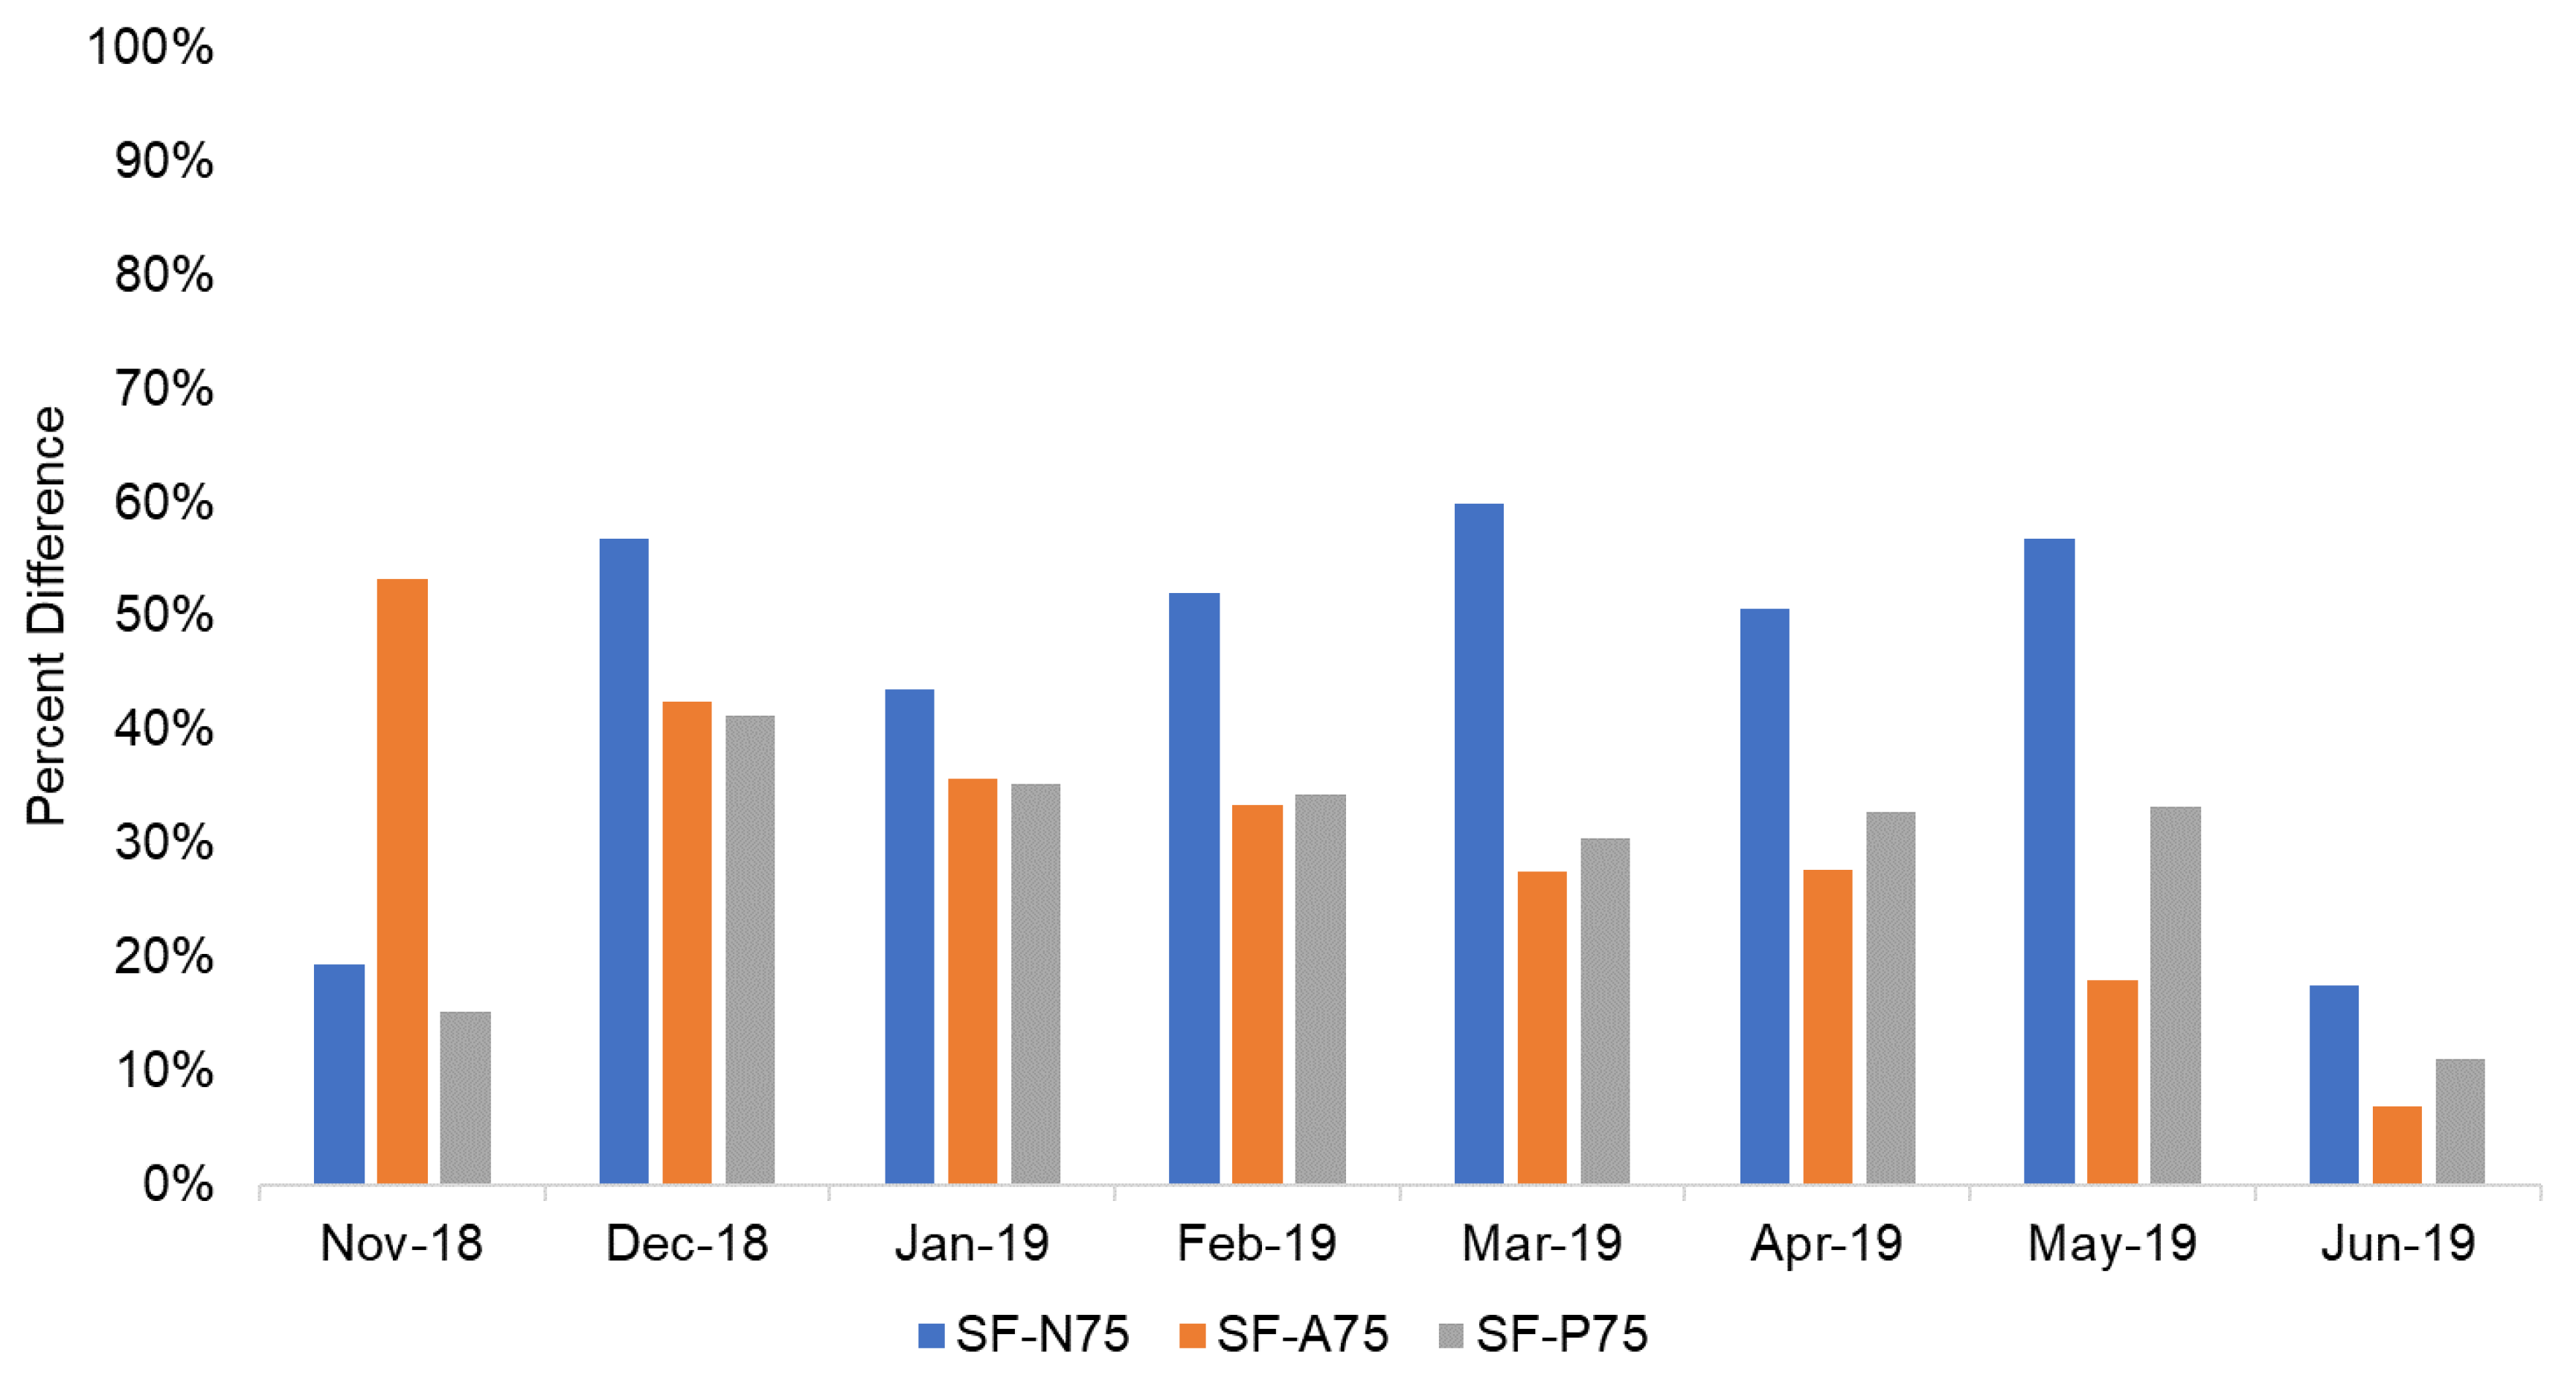
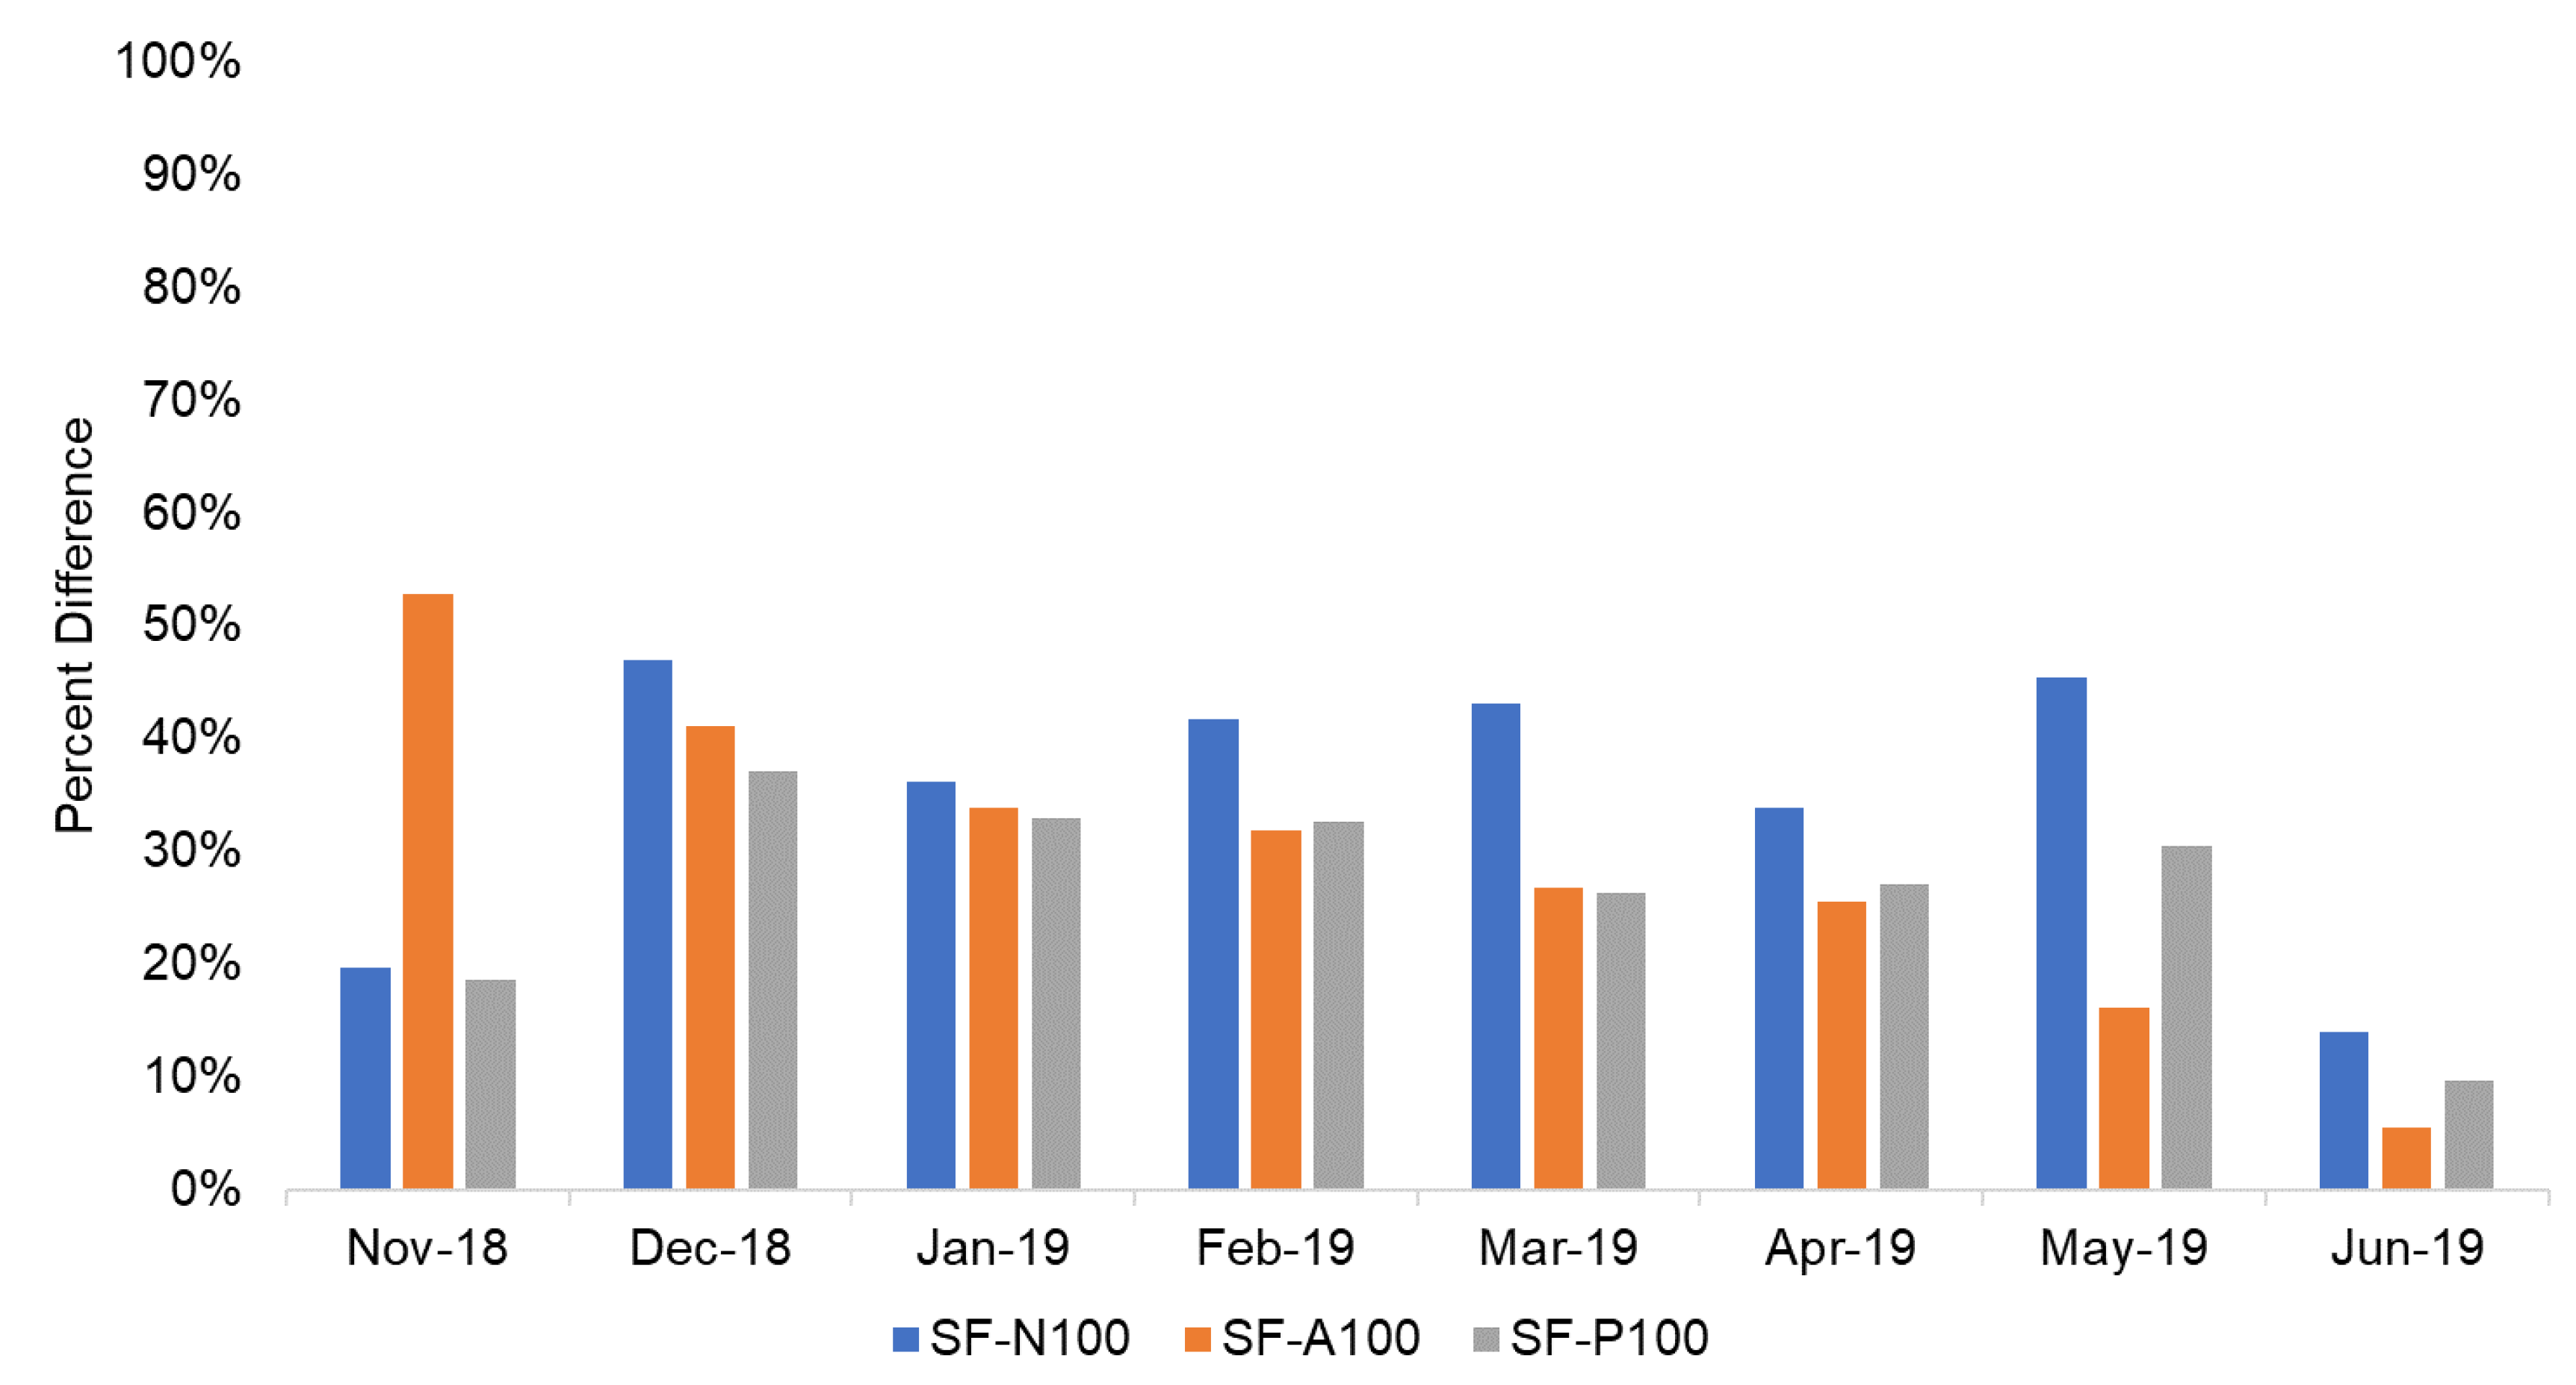
6.4. Evaluating the Effect of Forecasting on Market Performance

The ReNEWS Nexus system was modeled using two alternative rules for forecasting energy production, as shown in Table 2. Simulation results for the PF (perfect forecasting) scenarios represented an upper bound of performance of all the scenarios tested; the percent increase in performance of the PF scenarios relative to the RN scenarios in terms of the proportion of excess generation sold in the peer-to-peer market is shown below for all months and storage scenarios (Figure 10). PF generates a positive increase in sold excess generation for each month and storage scenario. For all months except November, the order of increase in performance of the storage scenarios from largest to smallest was no storage, predefined, and automatic, respectively. The range of increase for each storage scenario across the months was 35–71% (57% mean) for no storage, 6–51% (35% mean) for predefined, and 22–44% (29% mean) for automatic.
Results for the SF (simple forecasting) scenarios represented the middle ground between the RN and PF scenarios; the percent increases in the proportion of excess generation sold in the peer-to-peer market relative to the RN scenarios are shown in the supplemental information for a forecasting parameter value of 75% (Figure A4) and 100% (Figure A5). Similar to the PF scenarios, the SF-N75, SF-A75, SF-P75, SF-N100, SF-A100, and SF-P100 scenarios lead to a positive increase in excess generation sold relative to the RN scenarios for all months simulated. The mean increase in performance for the SF-N75, SF-A75, and SF-P75 scenarios across the months simulated was 45%, 31%, and 29%, respectively; the SF-N100, SF-A100, and SF-P100 scenarios result in a mean increase of 35%, 29%, and 27%, respectively. Limiting the forecasting parameter to a value of 75% lead to a larger proportion of excess sold into the market on average than a value of 100% for each SF storage scenario, because the 75% SF scenario underestimated upcoming solar generation and limited shortfall penalties. This allowed prosumers farther down the sell list to exchange their excess generation instead of prosumers higher up on the list filling buyer demand with an inaccurate amount of generation that must be eventually supplied by the utility. Both PF and SF market structures improvde performance of the no storage scenario greater than the automatic and predefined storage scenarios relative to the RN market structure.

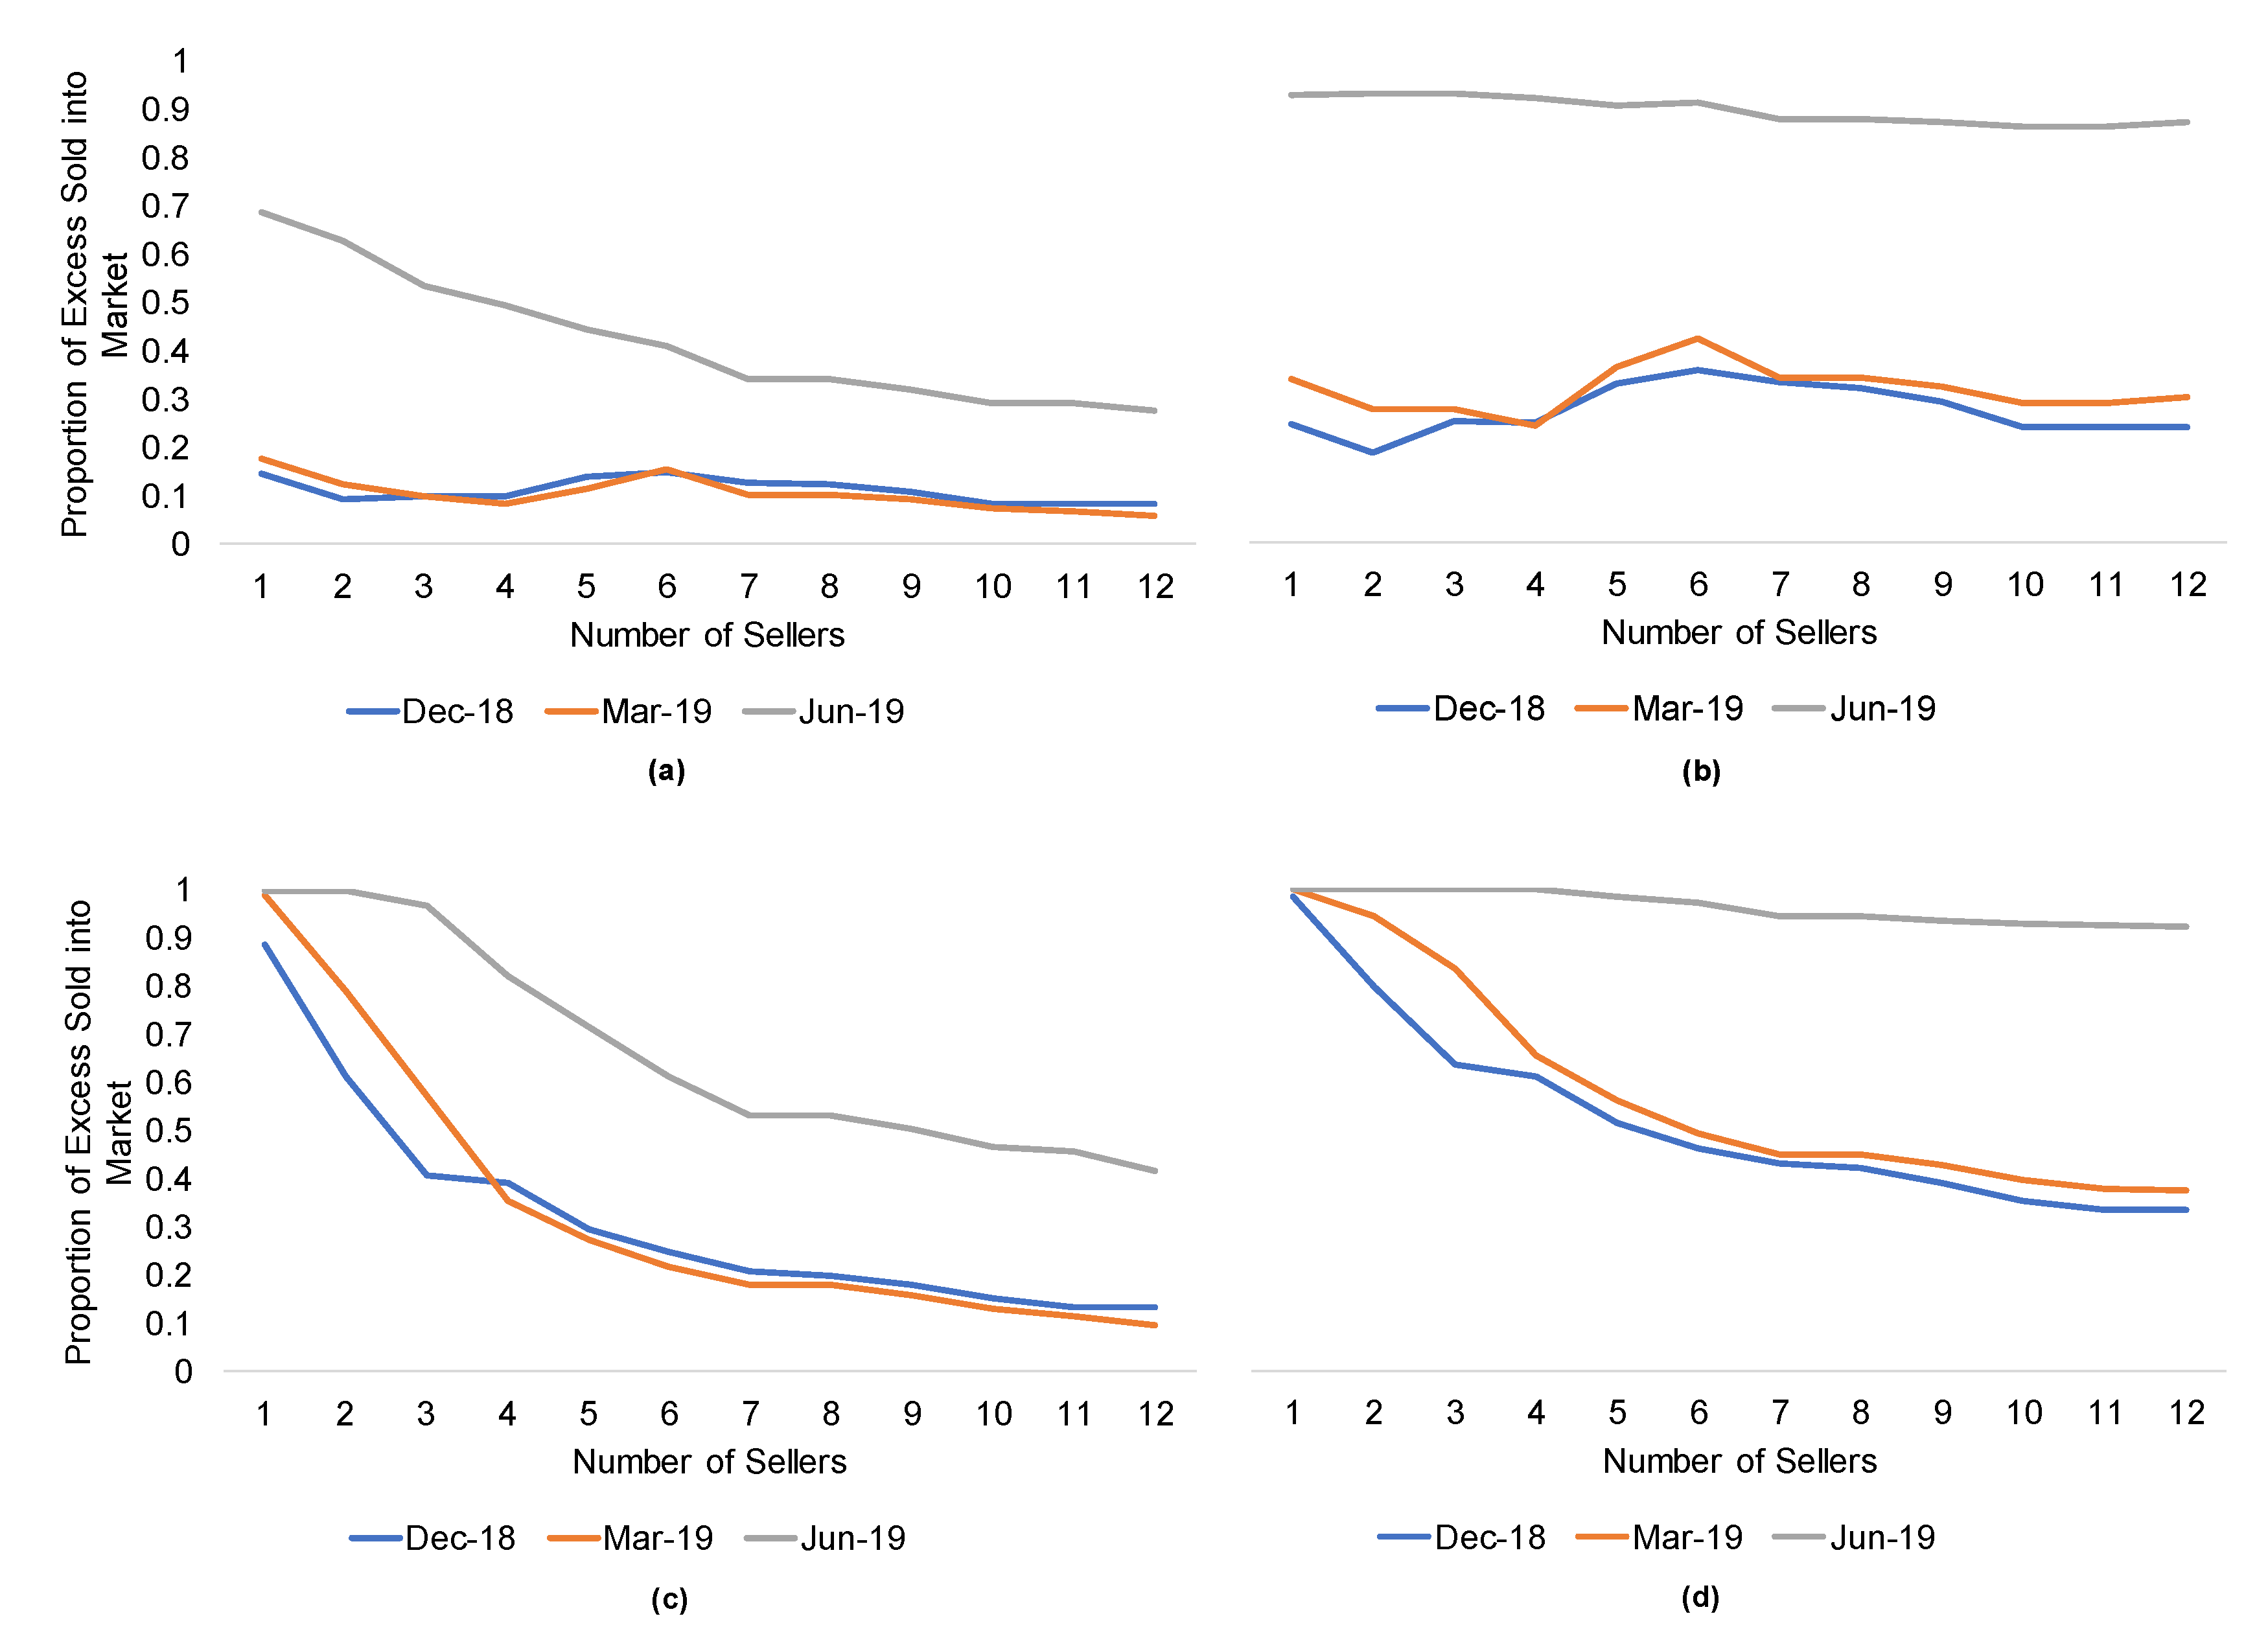
6.5. Evaluating the Effect of Prosumer-to-Consumer Ratio on Market Performance

As shown in Figure 2, the amount of energy generated by prosumers was greater than the energy required by consumers during some parts of the year. The amount of energy produced and consumed should be balanced to improve market inefficiency, and the ratio of prosumers to consumers engaged in the market has a significant effect on this balance. The proportion of excess solar generation sold in the peer-to-peer market versus the number of prosumers in the market is shown below for three months (Figure 11). Results are shown for the RN-N scenario (Figure 11a) and the RN-A scenario (Figure 11b). Additionally, results are shown for the PF-N scenario (Figure 11c) and the PF-A scenario (Figure 11d). For each scenario, the total number of households simulated in the market was held at 18, while the number of prosumers increased from one to 12.
For the RN-N scenario (Figure 11a), March and December followed similar trajectories; the trend dipped within the first few numbers of prosumers, then increased until six prosumers, and finally decreased all the way through 12 prosumers. The odd profiles seen for March and December were likely due to a combination of low demand and the restrictive rule of one exchange per prosumer per trade interval; as the number of prosumers increased, more consumers could participate in exchanges to meet more demands through decentralized production. The month of June showed an expected trajectory with a decreasing trend from one to 12 prosumers. The proportion of sold excess generation was higher in June than in March and December, because June was a higher demand month, and each consumer was able to buy a larger share of available excess, leading to increased market efficiency. The RN-A scenario demonstrated that automatic storage functionality substantially increased the proportion of excess generation sold in the peer-to-peer market (Figure 11b). March and December followed trajectories similar to those seen in the RN-N scenario, decreasing within the first few numbers of prosumers, then increasing to the peak at six prosumers, and decreasing thereafter. The month of June showed, in general, a slightly decreasing trend from one to 11 prosumers, but the overall efficiency stayed around 90% of excess energy, compared to the RN-N scenario, in which efficiency dropped to nearly 30% in the month of June for 12 prosumers. The market created overproduction of solar generation for all months at each setting for the number of prosumers, for both RN-N and RN-A scenarios.
For the PF-N scenario (Figure 11c), the market efficiency was higher than for the RN-N scenario, which did not use forecasting. For a small number of prosumers in the PF-N structure, the market efficiency was very high, between 90–100% for all three months. This demonstrates that forecasting can significantly improve market performance, even without storage, for markets with few prosumers. For the PF-A scenario (Figure 11d), the proportions sold were much higher than those seen for the PF-N scenario, and in the month of June, nearly 100% of excess generation as sold in the peer-to-peer market for 1–4 prosumers in the market. Market efficiency remained high for the month of June across the number of prosumers in the market.

7. Discussion

The validation of the ABM for the RENeW Nexus case study provided the foundation for a critical analysis of P2P energy market structures. Building on the congruence of simulated and empirical observations, systematic experimentation, and the availability of supplementary information on the trial, this section discusses the efficacy of P2P trading as a means to manage DG. Though the number of households that participated in the RENeW Nexus trial limited its success, important lessons can be extracted from the trial and from the ABM that was developed in this research. The P2P electricity trading trial succeeded in giving prosumers more control on the price of their excess generation, and the trial revealed some important tradeoffs between the decentralized and centralized paradigms of electric distribution. The decentralized system of business gives end-users more financial control over their distributed energy resources, but the time commitment of participation, combined with high fixed costs, severely limits market activity. The centralized paradigm eliminates the time burden of household participation and provides a stable price point for electricity rates, though it gives prosumers less control over the value of their excess generation and limits the ability for communities to cultivate sustainable cultural norms. Fee and market structure changes are necessary to keep decentralized energy markets from drastically raising the price of electricity for consumers and lowering the value of excess generation for prosumers. Creating the opportunity for net positive financial outcomes will likely incentivize activity in decentralized markets and increase their economic efficiency; this, in turn, may embolden morale for P2P electricity systems and household renewable energy technology.
We provide an overview of the RENeW Nexus model and lessons learned through the ABM application, followed by a discussion of limitations and future work.

7.1. Ratio of Prosumers to Consumers and Engaging Participants

Efficiency of the P2P market system depends on the balance between consumer and prosumer households, and the ratio of prosumers to consumers limited the success of the RENeW Nexus trial. The disparity between the count of prosumers to consumers created market inefficiency and, thus, large amounts of untraded excess. Using the ABM, we explored how the seller to buyer ratio affects excess solar generation, and analysis revealed that the market became oversaturated when there were only a few prosumers participating in the system. The performance of the market was sensitive to the season, and the use of storage and automatic discharging during summer months allowed a higher number of prosumers in the market. Forecasting also permitted more prosumers in the market, though storage solutions were more effective at increasing the efficiency of the market.
Qualitative data from the RENeW Nexus trial suggests that understanding differences in motivations between consumers and prosumers may help develop targeted recruitment strategies to create a more balanced market population. Financial incentives were found to be of high importance to participants [36]. As such, improving the perceived satisfaction of consumers with potential economic outcomes will likely increase their participation and enhance P2P market efficiency.
Economic payoffs appeared to gain relevance for all (consumer and prosumer) participants once the initial decision to join had been made. This is suggested by the drastic reduction in changes made to buying and selling prices. Though pro-environmental attitudes may have initially motivated participants to join, the size of the economic rewards led to a decline in market engagement. As participants realized the limited scope of potential economic outcomes, they optimized their net benefits by minimizing their time investments. As a result, rate changes stagnated. Adequate overall engagement, as well as increased market participation, may thus require the provision of sufficiently large economic incentives within the tariff structure.

7.2. Implications of Regulatory and Incentive Structures

In the case of the RENeW Nexus project, existing rules within the Western Australian electricity system significantly limited the possibilities for efficient tariff design. The rules of the RENeW Nexus trial were set to create a simplistic bilateral exchange system, where only one transaction could take place each trade interval for all sellers and buyers. The single transaction setup limited the ability for sellers to exchange all of their excess solar generation. An alternative electricity market structure involving solar forecasting was tested using the ABM framework. The alternative structure allowed for multiple transactions to take place so more energy can be exchanged. While forecasting rules have the advantage of allowing prosumers to sell more of their excess generation, penalties for incorrect forecasts are possible, which can lower the value of that excess. The forecasting scenario was adapted to create more conservative projections, which limits shortfall penalties and increase the amount of energy sold relative to the RENeW Nexus scenario. Simulation of alternative electricity market rules with constrained forecasting shows that simple changes can be made to the platform exchange structure to improve market efficiency.
The simulation and analysis of the RENeW Nexus trial demonstrates that the viability of a P2P market depends on the adequacy of incentives for participating household agents. As described above, fees were structured in a way that led to high costs for consumers and prosumers, and participants did not engage in bidding in the market due to the lack of incentives. To optimize outcomes of P2P trading in practice, collective action and design is needed to develop a fee structure that encourages participation.

7.3. Effects of Integrating Storage into Market Design

Flexibility of solar generated energy resources can be improved with the use of energy storage technology. A lack of energy storage forces prosumers to sell the majority of excess in the middle of the day during off-peak hours of demand. Further, the absence of storage leads to a considerable amount of reverse power flow, which can negatively affect the power system and make network operations more difficult for utility managers.
The ABM framework as used to evaluate the advantages of using energy storage, and results showed that energy storage can increase the amount of excess generation that is sold in the P2P market, with significant gains in summer months. Both the automatic and predefined storage scenarios allowed prosumers to shift the discharge of excess solar generation to time periods of higher demand, which reduced high levels of reverse power flow during off-peak hours and increased the value of solar power for sellers. The predefined storage scenario allowed prosumer households to pinpoint the discharge of excess during the peak price hours for retail electricity, resulting in higher prices for sold electricity. Adoption of energy storage units at residential households can give prosumers the ability to employ temporal arbitrage in the decentralized market and limit the effects of reverse power flow during off-peak periods of system demand.

7.4. Limitations and Future Work

We describe as follows some components of the ABM approach and the P2P market that can be explored in further research.

7.4.1. Agent-Based Modeling of Consumers and Prosumers

Consumers and prosumers were simulated in the ABM described here as simple automata that exchange energy when they are matched through a bi-lateral market, based on reported values for willingness to pay and willingness to accept. New research is needed to simulate the decision-making process that consumers and prosumers use to form values of exchanged solar energy. Some consumers value environmental externalities of using solar energy, while others make decisions based on price alone. Households vary in their expertise of using technology and may also vary in perceptions, such as attitude, social norms, and perceived control around using new technology. Perceptions and attitudes of households engaged in the RENeW Nexus trial are explored by Wilkinson et al. [36]. Including heterogeneity among consumers and prosumers based on characteristics, abilities, and skills is needed to more realistically simulate agents and the emerging performance of P2P energy markets. Consumers and prosumers learn as they participate in a P2P market, and they may adapt and update their bids based on past success or failure to secure an exchange. New agent-based modeling approaches can be integrated within the modeling framework developed through this research to simulate agents that optimize bids based on feedback from the market.
The population of agents that is simulated in this research consists of 18 agents, and further research is needed to explore how the size of the market can affect the emergence of market performance. A larger group of participants could create more competition, leading to an efficient market. On the other hand, some households that lack the time or expertise to compete effectively may disengage from the market.

7.4.2. Aggregation Services

Alterations to the P2P market structure can be evaluated through further development of the ABM developed in this research. An increase in economic and technical efficiencies can be achieved by transferring management to aggregation service providers who have expertise in the operation of renewable energy technology. Aggregation services eliminate the time burden for households and can decrease the uncertainty in payments for excess generation by offering a predetermined rate for solar production. However, aggregation service providers can negatively perturb electricity prices for consumers in decentralized markets if they gain enough market power; aggregators can do this by withholding energy storage capacity and manipulating the supply curve of electricity, similar to Enron in the early 2000s [42]. New research can simulate aggregation services and explore their impact on market performance.

7.4.3. Automated Trading Algorithms and Smart Contracts

A different method of solving the time burden for prosumers and consumers could be the development of an automated trading algorithm. Automated trading algorithms can be built on smart contracts. Smart contracts, which are simple scripts that perform automated algorithmic steps using data logged by the blockchain [43,44], can be used with the ledger of bids and transactions to validate that constraints are being met and to restrict market exchanges between participants. They also allow for the automatic execution of payments and their real time settlement [26]. An algorithm that automatically updates bid pricing for households can be made possible through the use of machine learning technology. Machine learning can be applied to data on historical bid success and failure as well as system-level demand data that is made available by the online trading platform to make improved decisions on P2P energy bids. Machine learning can also be applied to meteorological data to make more accurate solar forecasts during the bidding process. Automated trading algorithms can increase the technical efficiencies of decentralized electricity exchanges and defend consumers against price manipulation induced by aggregation service providers by keeping market power in the hands of individual household prosumers.
Automation may offer an alternative—or complementary—approach to improving market participation. By removing the time commitment barrier, economic outcomes may still be optimized. In addition, automated adjustment of buying and selling rates could help address potentially low levels of technological and electricity market literacy by offering participants the possibility to delegate decision-making to algorithms. Automated services can be simulated within an ABM framework to explore how they might impact market performance and provide guidance for adopting these technologies within a P2P market.

7.4.4. Using Tokens within Blockchain Technology

Decentralized electricity systems must be regulated at both the virtual market and physical distribution levels. An important issue for regulation is developing a platform solution for enforcing system-level policies, and the RENeW Nexus trial uses blockchain technology to enable trades. A novel feature of blockchain platforms is the ability to create assets and sub-assets, or tokens that represent virtual or physical objects. Asset tokens can be issued by users of a blockchain protocol that supports asset creation; they can be used for a number of purposes including representing gold bars, energy credits, concert tickets, and gift card credits [45]. Assets can also be used to represent organizations and businesses; sub-asset tokens can be created under those assets and used to develop sub-networks within the blockchain platform that, for example, facilitate the public trading of stocks for subsidiary companies, or manage boarding passes and frequent flyer miles. In the context of P2P energy trading, an asset can be created to support a decentralized electricity platform, and sub-asset tokenization can be used to regulate the virtual energy market. For example, tokens can be created and passed to prosumers for each kWh of excess generation sold in the P2P market, which can be used to enforce rules for maximum power flow. Additionally, tokens can be passed to prosumers for each kWh of energy storage that is bid into the P2P market to institute a constraint for the minimum amount of storage that must be offered each interval, which would be a defense against the gaming of aggregated energy storage resources. The feature of blockchains to support sub-asset tokenization can be employed to regulate a P2P energy trading platform and ground the virtual market into the physical constraints of the grid and protect consumers from electricity price manipulation.

7.4.5. Secondary Markets for Decentralized Energy Systems

P2P energy trading allowed prosumers in the trial to create higher value for their excess generation. However, the extra value was overshadowed by the high fixed costs of participating in the trial. Participants could accrue other value with their distributed resources if secondary markets were established in the platform. Secondary markets can be created for frequency balance, ancillary services, and peak shaving to help facilitate grid stability; this can add more value for prosumers if they own a household energy storage system. Further, secondary markets can be enabled through sub-asset tokenization of energy resources and smart contract technology. The addition of secondary markets could completely change the game theoretical approach of households that participate in the market. More simulations should be performed to determine the additional value that is created through secondary markets and to assess their impact on the dynamics of decentralized electricity systems.

7.4.6. Physical Constraints of Electric Distribution Infrastructure

The simulation framework developed here models a virtual P2P electricity market but does not consider the constraints of the physical infrastructure. P2P electricity exchanges could, however, adversely impact the power system dynamics of the distribution system. Future work can couple an electric distribution system model of the infrastructure with the ABM to perform power system analyses and determine the constraints of the grid. This insight can be valuable in planning infrastructure operations and regulating market exchanges. A better understanding of the network layout and a map of the physical vulnerabilities can help facilitators draw boundaries for sub-market systems that are more appropriate for infrastructure. Determining the physical constraints of the system can also be used to develop appropriate network and generation fees for participants.

7.4.7. Sub-Market Boundaries and Neighborhood Clustering

The geographic displacement of the participating households along with the disparity between the number of prosumers and consumers together raise an important challenge in how to appropriately scale decentralized electricity markets. As the number of participants increases, it will become important to facilitate decentralized markets at an adequate scale. Decentralized markets can be scaled by aggregating participants into clusters that function as sub-market systems. Boundaries for the sub-markets may be drawn according to power system boundaries to better facilitate grid stability. Sub-market boundaries may also be assigned through neighborhood zoning to foster community connections in decentralized electricity systems. Boundaries for sub-markets should consider the ratio of prosumers to consumers; parity between prosumer excess generation and sub-system daytime demand is necessary to ensure market efficiency. The boundaries may be redrawn over time based on market outcomes and comparing historical willingness-to-pay and willingness-to-accept values for P2P electricity. Clustering households to scale decentralized markets may induce gains in economic efficiency and help to better manage power system integrity.

8. Conclusions

An ABM framework is demonstrated here to simulate P2P electricity trades in a decentralized electricity market. The framework is applied to data from a real case study in Western Australia to validate modeling assumptions. Simulations are performed to determine the impact of alternative governance models on the dynamics of the trial system. Battery bank systems are modeled in the framework to determine the effect that energy storage can have on market performance.
The work presented here can be extended in the future to enhance the insight that is gained from using ABM. For example, the modeling framework can be applied to a P2P electricity system that allows residential apartment units to trade excess generation within and between buildings. Clustering schemes of households in the community can be tested to evaluate the scale at which to conduct decentralized energy trading. The ABM can be used to simulate the withholding of household energy storage capacity from the P2P market to determine the ability of individuals and aggregation service providers to manipulate energy prices. Though the platform used in the trial was based on blockchain technology, none of the observed outcomes could be linked directly to this feature. However, blockchain technology does provide promising features in the context of regulation and governance of decentralized energy systems. Sub-asset tokenization can be modeled to assess its ability in enforcing market constraints for limiting price manipulation and protecting grid integrity. The extent to which blockchain technology may be able to mitigate potential privacy and data accuracy concerns in the context of power control could be another possible avenue of research. Commentary regarding the usefulness of platforms in improving user engagement is beyond the scope of this study but may be an important avenue for future research. Although low engagement was observed, the study design does not allow for inferences to be made in this regard. Future studies should also consider including more heterogeneity in behavior and allow for the assessment of behaviors within social systems.
Designing and implementing an efficient, equitable, and sustainable future energy system requires collective and coordinated action from a diverse set of actors. Its success hinges on the recognition of trade-offs on, and across, social, technological, economic, and environmental levels. ABM helps manage the resulting uncertainties by facilitating the testing and development of alternative management strategies.

Author Contributions

Conceptualization: J.G.M. and E.Z.B.; methodology: J.G.M.; formal analysis: J.G.M., and P.H.; resources: M.S.; data curation: P.H.; writing—original draft preparation: J.G.M., and P.H.; writing—review and editing: M.S. and E.Z.B.; supervision: M.S. and E.Z.B.; project administration: E.Z.B. All authors have read and agreed to the published version of the manuscript.

Funding

The RENeW Nexus project was supported by the Australian Government through the Smart Cities and Suburbs Program. Paula Hansen is funded by the CRC for Low Carbon Living Ltd. supported by the Cooperative Research Centres program, an Australian Government initiative; the Australian Renewable Energy Agency as part of its Research and Development Programme; and the Australian Housing and Urban Research Institute through their research capacity building in the form of a PhD top-up scholarship. The funding bodies had no involvement in study design; data collection, analysis, or interpretation, nor in the writing of the report. Jacob G. Monroe is funded by the United States National Science Foundation Graduate Research Fellowship Program [Grant No. 2016223977] and the Hood Fellowship, funded by Ed Hood Jr. and his wife, Kay. Any opinions, findings, and conclusions or recommendations expressed in this material are those of the authors and do not necessarily reflect the views of the United States National Science Foundation or the views of the Hood Family.

Acknowledgments

The authors would like to thank Daniel Marrable and Rebecca Lange at the Curtin Institute for Computation for their assistance with data management and provision and Gregory M. Morrison at the Curtin University Sustainability Policy Institute for his support in enabling this collaboration.

Conflicts of Interest

The authors declare no conflict of interest.

Abbreviations

ABMagent-based model(s) or agent-based modelling;
DGdistributed generation;
DERdistributed energy resource(s);
ICTinformation and communication technology;
LGAlocal Government Area;
P2Ppeer-to-peer; PV–solar photovoltaic(s).

Appendix A. Supplemental Results

Figure A1. Proportion of excess solar generation sold in the peer-to-peer market versus the predefined storage discharge timeline for the (a) RN-P and (b) PF-P scenarios. Values are shown for the months of December, January, February, March, April, and May.
Smartcities 03 00053 g0a1
Figure A2. Buyer average price of electricity in the trial market. Results are shown for the RN-N, RN-A, and RN-P scenarios. Prices shown here do not include monthly generation and network fees. Transaction fees are also not included in the prices shown.
Smartcities 03 00053 g0a2
Figure A3. Proportion of total solar generation sold in peer-to-peer market. Results are shown for the RN-N, RN-A, and RN-P scenarios.
Smartcities 03 00053 g0a3
Figure A4. Percent difference in proportion of excess solar generation sold in peer-to-peer market between the SF and RN market structures. Results for the SF-N75, SF-A75, and SF-P75 scenarios are shown. The percent difference shown is for the increase in performance of the SF scenarios relative to the RN scenarios.
Smartcities 03 00053 g0a4
Figure A5. Percent difference in proportion of excess solar generation sold in peer-to-peer market between the SF and RN market structures. Results for the SF-N100, SF-A100, and SF-P100 scenarios are shown. The percent difference shown is for the increase in performance of the SF scenarios relative to the RN scenarios.
Smartcities 03 00053 g0a5

References

  1. Zhou, Y.; Wu, J.; Long, C. Evaluation of peer-to-peer energy sharing mechanisms based on a multiagent simulation framework. Appl. Energy 2018, 222, 993–1022. [Google Scholar] [CrossRef]
  2. Sousa, T.; Soares, T.; Pinson, P.; Moret, F.; Baroche, T.; Sorin, E. Peer-to-peer and community-based markets: A comprehensive review. Renew. Sustain. Energy Rev. 2018, 104, 367–378. [Google Scholar] [CrossRef] [Green Version]
  3. Zafar, R.; Mahmood, A.; Razzaq, S.; Ali, W.; Naeem, U.; Shehzad, K. Prosumer based energy management and sharing in smart grid. Renew. Sustain. Energy Rev. 2018, 82, 1675–1684. [Google Scholar] [CrossRef]
  4. Jogunola, O.; Ikpehai, A.; Anoh, K.; Adebisi, B.; Hammoudeh, M.; Son, S.Y.; Harris, G. State-of-the-art and prospects for peer-to-peer transaction-based energy system. Energies 2017, 10, 2106. [Google Scholar] [CrossRef] [Green Version]
  5. Mengelkamp, E.; Notheisen, B.; Beer, C.; Dauer, D.; Weinhardt, C. A blockchain-based smart grid: Towards sustainable local energy markets. Comput. Sci. Res. Dev. 2018, 33, 207–214. [Google Scholar] [CrossRef]
  6. Lüth, A.; Zepter, J.M.; Del Granado, P.C.; Egging, R. Local electricity market designs for peer-to-peer trading: The role of battery flexibility. Appl. Energy 2018, 229, 1233–1243. [Google Scholar] [CrossRef] [Green Version]
  7. Nguyen, S.; Peng, W.; Sokolowski, P.; Alahakoon, D.; Yu, X. Optimizing rooftop photovoltaic distributed generation with battery storage for peer-to-peer energy trading. Appl. Energy 2018, 228, 2567–2580. [Google Scholar] [CrossRef]
  8. Kloppenburg, S.; Boekelo, M. Digital platforms and the future of energy provisioning: Promises and perils for the next phase of the energy transition. Energy Res. Soc. Sci. 2019, 49, 68–73. [Google Scholar] [CrossRef]
  9. Murkin, J.; Chitchyan, R.; Byrne, A. Enabling peer-to-peer electricity trading. In Proceedings of the 4th International Conference on ICT for Sustainability, Amsterdam, The Netherlands, 29 August–1 September 2016. [Google Scholar]
  10. Morstyn, T.; Farrell, N.; Darby, S.J.; McCulloch, M.D. Using peer-to-peer energy-trading platforms to incentivize prosumers to form federated power plants. Nat. Energy 2018, 3, 94–101. [Google Scholar] [CrossRef]
  11. Cornélusse, B.; Ernst, D.; Lachi, S. Optimal operation and fair profit allocation in community microgrids. Paper presented at the CIRED Workshop, Ljubljana, Slovenia, 7–8 June 2018. [Google Scholar]
  12. Fridgen, G.; Kahlen, M.; Ketter, W.; Rieger, A.; Thimmel, M. One rate does not fit all: An empirical analysis of electricity tariffs for residential microgrids. Appl. Energy 2018, 210, 800–814. [Google Scholar] [CrossRef] [Green Version]
  13. Abdella, J.A.; Shuaib, K. Peer to peer distributed energy trading in smart grids: A survey. Energies 2018, 11, 1560. [Google Scholar] [CrossRef] [Green Version]
  14. Kraan, O.; Dalderop, S.; Kramer, G.J.; Nikolic, I. Jumping to a better world: An agent-based exploration of criticality in low-carbon energy transitions. Energy Res. Soc. Sci. 2019, 47, 156–165. [Google Scholar] [CrossRef]
  15. Bollinger, L.A.; Van Blijswijk, M.J.; Dijkema, G.P.J.; Nikolic, I. An energy systems modelling tool for the social simulation community. JASSS 2016, 19. [Google Scholar] [CrossRef]
  16. Kahrobaee, S.; Rajabzadeh, R.A.; Soh, L.K.; Asgarpoor, S. Multiagent study of smart grid customers with neighborhood electricity trading. Electr. Power Syst. Res. 2014, 111, 123–132. [Google Scholar] [CrossRef]
  17. Koritarov, V.S. Real-world market representation with agents. Modeling the electricity market at a complex adaptive system with an agent-based approach. IEEE Power Energy Mag. 2004, 2, 39–46. [Google Scholar] [CrossRef]
  18. Holland, J.H. Hidden Order: How Adaptation Builds Complexity; Addison-Wesley: Reading, MA, USA, 1995. [Google Scholar]
  19. Jager, W.; Janssen, M. The need for and development of behaviourally realistic agents. In Multi-Agent-Based Simulation II. MABS 2002. Lecture Notes in Computer Science; Simão Sichman, J., Bousquet, F., Davidsson, P., Eds.; Springer: Berlin/Heidelberg, Germany, 2003; Volume 2581, pp. 36–49. [Google Scholar]
  20. Long, C.; Wu, J.; Zhou, Y.; Jenkins, N. Peer-to-peer energy sharing through a two-stage aggregated battery control in a community Microgrid. Appl. Energy 2018, 226, 261–276. [Google Scholar] [CrossRef]
  21. Luke, S. Multiagent Simulation and the Mason Library; Final Report; George Mason University: Fairfax, VA, USA, 2011. [Google Scholar]
  22. Vergados, D.J.; Mamounakis, I.; Makris, P.; Varvarigos, E. Prosumer clustering into virtual microgrids for cost reduction in renewable energy trading markets. Sustain. Energy Grids Netw. 2016, 7, 90–103. [Google Scholar] [CrossRef]
  23. Long, C.; Wu, J.; Zhang, C.; Thomas, L.; Cheng, M.; Jenkins, N. Peer-to-peer energy trading in a community microgrid. In Proceedings of the 2017 IEEE Power & Energy Society General Meeting, Chicago, IL, USA, 16–20 July 2017. [Google Scholar]
  24. Zhou, Y.; Wu, J.; Long, C.; Cheng, M.; Zhang, C. Performance evaluation of peer-to-peer energy sharing models. Energy Procedia 2017, 143, 817–822. [Google Scholar] [CrossRef]
  25. Zhang, C.; Wu, J.; Long, C.; Cheng, M. Review of existing peer-to-peer energy trading projects. Energy Procedia 2017, 105, 2563–2568. [Google Scholar] [CrossRef]
  26. Andoni, M.; Robu, V.; Flynn, D.; Abram, S.; Geach, D.; Jenkins, D.; McCallum, P.; Peacock, A.D. Blockchain technology in the energy sector: A systematic review of challenges and opportunities. Renew. Sustain. Energy Rev. 2019, 100, 143–174. [Google Scholar] [CrossRef]
  27. Nakamoto, S. Bitcoin: A Peer-To-Peer Electronic Cash System. 2008. Available online: www.bitcoin.org (accessed on 5 June 2020).
  28. Xu, X.; Weber, I.; Staples, M.; Zhu, L.; Bosch, J.; Bass, L.; Pautasso, C.; Rimba, P. A taxonomy of blockchain-based systems for architecture design. In Proceedings of the 2017 IEEE International Conference on Software Architecture, Gothenburg, Sweden, 3–7 April 2017. [Google Scholar]
  29. Macal, C.M.; North, M. Introductory tutorial: Agent-based modeling and simulation. In Proceedings of the 2014 Winter Simulation Conference, Savannah, GA, USA, 7–10 December 2014. [Google Scholar]
  30. Hansen, P.; Liu, X.; Morrison, G.M. Agent-based modelling and socio-technical energy transitions: A systematic literature review. Energy Res. Soc. Sci. 2019, 49, 41–52. [Google Scholar] [CrossRef]
  31. Deissenroth, M.; Klein, M.; Nienhaus, K.; Reeg, M. Assessing the plurality of actors and policy interactions: Agent-based modelling of renewable energy market integration. Complexity 2017, 2017, 1–24. [Google Scholar] [CrossRef]
  32. Ringler, P.; Keles, D.; Fichtner, W. Agent-based modelling and simulation of smart electricity grids and markets—A literature review. Renew. Sustain. Energy Rev. 2016, 57, 205–215. [Google Scholar] [CrossRef]
  33. Mengelkamp, E.; Gärttner, J.; Rock, K.; Kessler, S.; Orsini, L.; Weinhardt, C. Designing microgrid energy markets. Appl. Energy 2018, 210, 870–880. [Google Scholar] [CrossRef]
  34. Zhang, C.; Wu, J.; Cheng, M.; Zhou, Y.; Long, C. A Bidding system for peer-to-peer energy trading in a grid-connected microgrid. Energy Procedia 2016, 103, 147–152. [Google Scholar] [CrossRef]
  35. Robinson, S.A.; Rai, V. Determinants of spatio-temporal patterns of energy technology adoption: An agent-based modeling approach. Appl. Energy 2015, 151, 273–284. [Google Scholar] [CrossRef] [Green Version]
  36. Wilkinson, S.; Hojckova, K.; Eon, C.; Morrison, G.M.; Sandén, B. Is peer-to-peer electricity trading empowering users? Evidence on motivations and roles in a prosumer business model trial in Australia. Energy Res. Soc. Sci. 2020, 66, 101500. [Google Scholar] [CrossRef]
  37. Bureau of Meteorology. Data from Meteorological Station Closest to Fremantle for which Data Was Available (Swanbourne). 2019. Available online: http://www.bom.gov.au/climate/averages/tables/cw_009215.shtml (accessed on 27 December 2019).
  38. Bureau of Meteorology. Fremantle Station Data. 2019. Available online: http://www.bom.gov.au/jsp/ncc/cdio/weatherData/av?p_nccObsCode=203&p_display_type=dataFile&p_startYear=&p_c=&p_stn_num=009192, (accessed on 27 December 2019).
  39. Australian Bureau of Statistics. Household Choices Related to Water and Energy, WA. Australian Bureau of Statistics. 16 June 2010; Web. Available online: https://www.abs.gov.au/ausstats/[email protected]/mf/4656.5 (accessed on 13 May 2020).
  40. Grimm, V.; Berger, U.; DeAngelis, D.L.; Polhill, J.G.; Giske, J.; Railsback, S.F.; Polhill, J.G. The ODD protocol: A review and first update. Ecol. Model. 2010, 221, 2760–2768. [Google Scholar] [CrossRef] [Green Version]
  41. Tesla. Tesla Powerwall 2 Datasheet—North America. Tesla. N.p. 11 June 2019. Web. Available online: https://www.tesla.com/sites/default/files/pdfs/powerwall/Powerwall%202_AC_Datasheet_en_northamerica.pdf (accessed on 13 May 2020).
  42. Borger, J. Tapes Reveal Enron’s Secret Role in California’s Power Blackouts. The Guardian. 4 February 2005. Web. Available online: https://www.theguardian.com/business/2005/feb/05/enron.usnews (accessed on 13 May 2020).
  43. Leng, J.; Ruan, G.; Jiang, P.; Xu, K.; Liu, Q.; Zhou, X.; Liu, C. Blockchain-empowered sustainable manufacturing and product lifecycle management in industry 4.0: A survey. Renew. Sustain. Energy Rev. 2020, 132, 110112. [Google Scholar] [CrossRef]
  44. Fenton, B.; Black, T. Ravencoin: A Peer to Peer Electronic System for the Creation and Transfer of Assets. 2018. Available online: https://ravencoin.org/assets/documents/Ravencoin.pdf (accessed on 14 September 2020).
  45. Szabo, N. Formalizing and securing relationships on public networks. First Monday 1997, 2, 1–11. [Google Scholar] [CrossRef]
Figure 1. Map showing where Fremantle (local government area) is located within the greater Perth area. Screenshot taken by the authors. Map data: Google, 2020. Accessed on 21 May 2020.
Smartcities 03 00053 g001
Figure 2. Monthly electricity consumption and solar energy generation for 18 households in the trial system.
Smartcities 03 00053 g002
Figure 3. Daily total changes to willingness-to-pay and willingness-to-accept values during the trial market system.
Smartcities 03 00053 g003
Figure 4. Agent-based modelling (ABM) framework simulates a peer-to-peer energy market to model electricity exchanges and prices for a trial system in the City of Perth. Agent attributes are shown in boxes.
Smartcities 03 00053 g004
Figure 5. Modeled monthly seller and buyer average price of electricity in the trial system. Negative seller prices indicate that sellers pay to put energy on the grid. Results are shown for the RN-N scenario. Prices shown here include monthly generation and network fees. Transaction fees are also included in the prices shown.
Smartcities 03 00053 g005
Figure 6. Actual and modeled daily energy exchanged in the peer-to-peer market system. Modeled data is shown for the RN-N scenario. Percent error of the modeled energy exchanged relative to the actual energy exchanged is also provided.
Smartcities 03 00053 g006
Figure 7. Actual and modeled daily seller average price of electricity exchanged in the peer-to-peer market system. Modeled data is shown for the RN-N scenario. Prices shown include transaction fees but do not include monthly generation and network fees. Percent error of the modeled price relative to the actual price is also provided.
Smartcities 03 00053 g007
Figure 8. Seller average price of electricity in the trial market. Results are shown for the RN-N, RN-A, and RN-P scenarios. Prices shown here do not include monthly generation and network fees or transaction fees.
Smartcities 03 00053 g008
Figure 9. Proportion of excess solar generation sold in peer-to-peer market. Results are shown for the RN-N, RN-A, and RN-P scenarios.
Smartcities 03 00053 g009
Figure 10. Percent difference in proportion of excess solar generation sold in peer-to-peer market between the forecasting parameter (PF) and RENeW Nexus (RN) market structures. Results for the PF-N, PF-A, and PF-P scenarios are shown. The percent difference shown is for the increase in performance of the PF scenarios relative to the RN scenarios.
Smartcities 03 00053 g010
Figure 11. Proportion of excess solar generation sold in the peer-to-peer market versus the number of sellers. Results are shown for the (a) RN-N and (b) RN-A scenarios. Results are also shown for the (c) PF-N and (d) PF-A scenarios. Values are shown for the months of December, March, and June.
Smartcities 03 00053 g011
Table 1. State variables for prosumer and consumer agents, which are updated at each time step j.
Prosumer AgentConsumer Agent
Generation in interval j–GjConsumption in interval jCj
Generation forecast in interval j–GFjWillingness to pay of interval j–WTPj
Consumption in interval jCj
Storage available at beginning of interval jSj
Willingness to accept of interval jWTAj
Willingness to pay of interval jWTPj
Table 2. Summary of modeling scenarios and parameter settings.
Scenario NameMarket StructureStorage MethodForecasting Parameter (PF)
RN-NRENeW NexusNo StorageNA
RN-AAutomatic StorageNA
RN-PPredefined StorageNA
PF-NPerfect ForecastingNo StorageNA
PF-AAutomatic StorageNA
PF-PPredefined StorageNA
SF-N75
SF-N100
Simple ForecastingNo Storage75%
100%
SF-A75
SF-A100
Automatic Storage75%
100%
SF-P75
SF-P100
Predefined Storage75%
100%
Table 3. Summary of research questions.
Research QuestionSection
How did the RENeW Nexus market perform?6.1
How accurately does the ABM simulate prices and exchanged energy that were observed in the RENeW Nexus market?6.2
How would storage affect the performance of the RENeW Nexus market?6.3
How would combined strategies of storage and forecasting affect the performance of the RENeW Nexus market?6.4
How does the ratio of sellers to buyers affect the performance of the RENeW Nexus market?6.5

