Using the Delphi Method to Evaluate the Appropriateness of Urban Freight Transport Solutions


Department of Civil Engineering, University of Thessaly, 38334 Volos, Greece
*
Author to whom correspondence should be addressed.
Smart Cities 2020, 3(4), 1428-1447; https://0-doi-org.brum.beds.ac.uk/10.3390/smartcities3040068
Submission received: 22 September 2020
/
Revised: 20 November 2020
/
Accepted: 27 November 2020
/
Published: 30 November 2020
Abstract
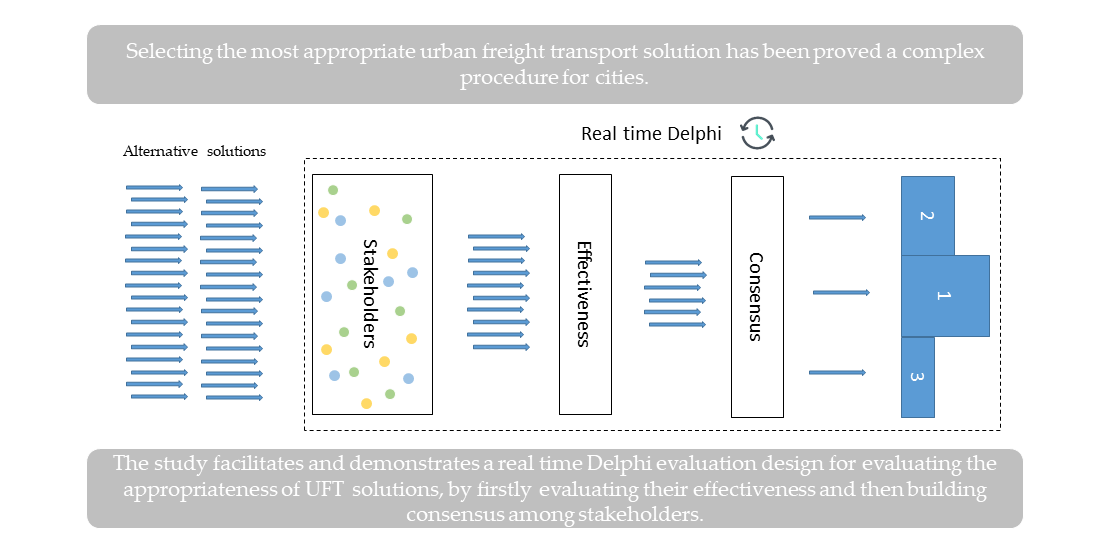
:Before implementing an Urban Freight Transport (UFT) solution, certainty is required about the effectiveness of the considered alternatives. Selecting an effective solution necessitates the engagement of all stakeholders involved in the management of the UFT system. The aim of the study is the formulation of a common assessment platform for facilitating the selection of the most appropriate UFT solution, taking into account the solutions’ effectiveness and the stakeholder perceptions and consensus. Solution maturity, social acceptance, and user uptake, which are considered as the main drivers of stakeholders’ engagement, are evaluated based on a real time Delphi survey, in parallel with solutions’ sustainability dimensions (economy and energy, environment, society, transport, and mobility). The Delphi method emerges as a suitable tool in this direction as stakeholders’ subjective judgments, and not analytical techniques, are required. The platform is demonstrated through the assessment of ten UFT solutions by 184 stakeholders (public authorities, supply chain operators, and other interested groups) who reside in cities across the world. The results of the demonstration showed that Intelligent Transportation Systems (ITS) for freight monitoring and electric vehicles are the highest rated solutions, while drone deliveries are the lowest, reaching respectively the highest and lowest consensus levels.

1. Introduction
Promoting and sustaining effective Urban Freight Transport (UFT) solutions is much needed for a sustainable UFT system [1], especially today given that more than 73% of the European population lives in urban areas [2]. Effective solutions ensure reliable, fast, and convenient deliveries at the lowest cost for the recipient, and efficient and profitable operation for the carriers and shippers [3]; at the same time, they balance congestion, nuisance, and externalities that occur to the city due to their deployment [4].
A UFT system consists of different stakeholders who have their own vision and specific goals, and tend to behave differently according to their interests. Stakeholder groups that are mainly involved in the management of UFT system are shippers, freight carriers, administrators, manufacturers, storage companies, authorities, retailers, and consumers [5]. Achieving UFT effectiveness heavily relies on stakeholder engagement [6,7]. Successful collaborative partnerships among stakeholder groups result in high impact policy design that considers and addresses city’s relevant logistical needs [8]. Freight Quality Partnerships (FQPs), Freight advisory boards and forums, and Designation of a City Logistics Manager (CLM) are some well-identified ways to bring together stakeholders to discuss problems, set objectives, and identify and implement solutions. However, these ways share some common weaknesses, i.e., the high degree of required coordination among stakeholders, and the unstructured communication and decision-making framework they follow [9].
To address this issue, the aim of the study is to formulate a common assessment platform which organizes and coordinates different stakeholders in a structured communication method. To achieve that, an adapted version of the classic Delphi method is deployed [10]. The formulation of the common assessment platform focuses on the issue of selecting the most appropriate UFT solution through the evaluation of solutions’ drivers (solution maturity, social acceptance, user uptake) and sustainability dimensions (economy and energy, environment, society, transport, and mobility); however, any topic requiring decision making can be handled following this method. Solution maturity, social acceptance, and user uptake are acknowledged as significant drivers to ensure stakeholder engagement. In brief, maturity signifies the readiness of the solution to be implemented and of the city to adopt it. Social acceptance and user uptake are associated to the degree of acknowledgment of the effectiveness of the solution by the end users and the appropriateness and compliance of the solution to city’s regulations, which affects stakeholders’ appreciation of the solution and therefore adoption and expansion, respectively [11].
As selecting and implementing a UFT solution is more an empirical process that requires a participative approach, three interchangeable Research Questions (RQ) arise:
- RQ1: How stakeholders evaluate the impacts of a number of considered solutions with regards to solutions’ drivers and sustainability dimensions?
- RQ2: What is the convergence level of the stakeholders’ perceptions?
- RQ3: How appropriateness upon UFT solution selection can be linked with effectiveness and stakeholders’ consensus?
To answer the RQs above, this study invites UFT stakeholders across the world to participate in a survey aiming at evaluating the effectiveness of a number of considered solutions. The survey is hosted in an innovative Real time Delphi platform developed by members of the Traffic, Transportation, and Logistics Laboratory (TTLog) of the University of Thessaly, Greece. The survey provides a twofold contribution; first, results enrich the knowledge around the identified impacts of UFT solutions, and second, it provides a methodology for evaluating the appropriateness of UFT solutions. The latter is realized based on the responses of the same UFT stakeholders.
The paper is structured as follows: Section 2 describes Delphi as a method of participation and reviews its advantages in evaluating UFT solutions. Section 3 outlines the steps for conducting the survey on the new Real time Delphi platform. Survey’s results are presented and analysed in Section 4. Section 5 discussesthe results and concludes this paper.
2. Literature Review
2.1. Identify and Assess Solutions with Stakeholders
Engaging stakeholders in transportation planning fosters social acceptance and facilitates solutions implementation, as increasing diversity extends problem definition and innovation and strengthens conclusiveness [12]. Especially in city logistics, where conflicting objectives are commonplace, engaging stakeholders and sharing power to all involved parties is a one-way road towards achieving sustainability [13]. According to the European Platform on Sustainable Urban Mobility Plans, the selection process of a set of UFT solutions can be seen in two phases; the first is relevant to the identification of suitable UFT solutions for implementation, and the second is the evaluation of this set by the city’s stakeholders to select the most effective one [14].
As per the first phase, there are two prevailing approaches in the literature. The first is based on a rational analysis of the generalized impacts of the alternative solutions [15]. Following this approach, the identification of suitable alternative UFT solutions is made based on their ability to achieve the desired economic, environmental, and societal impacts. Recent comprehensive reports on the generalized impacts of widely implemented UFT solutions can be found in [16,17,18]. The second approach is based on supporting tools that can help identify appropriate practices deployed in other areas. Such parametric tools have the ability to match solutions with specific city typologies as well as city logistics observatories [4,19]. The criticism against such tools is related to data credibility and the number and nature of criteria they deploy for determining appropriateness.
Regarding the second phase, policy makers create online forums in which city’s stakeholders come together and discuss about the potential impacts of each of the alternative solution. These online forums can be in the form of Freight Quality Partnerships (FQPs), freight advisory boards and forums, Design and Monitoring Framework (DMF), and Designation of a City Logistics Manager (CLM) [9]. According to Lebeau et al. [20], however, the communication which is developed in the forums promotes opinion and knowledge sharing among stakeholders rather than decision making in a structured way. To overcome this limitation, Lebeau et al. suggests the use of Mutli-Actor Multi-Criteria Analysis (MAMCA) [21], which is a decision-making model to enable evaluation of alternative policy measures considering different stakeholder categories. Likewise, Nathanail et al. [11] developed Evalog, a tool based on multicriteria analysis, that supports the choice of the most appropriate UFT solution through the facilitation of stakeholder collaboration. Both tools identify stakeholders and their criteria, assign respective weights, and score the alternatives on the criteria. A limitation of the tools is that the set of alternative solutions included in the evaluation process is not selected by the evaluators [8].
Furthermore, some representative studies of identified methodologies that evaluate UFT solutions without the direct involvement of stakeholders are Kijewska et al. [22] who used multi-criteria analysis, Holmgren [23] who used cost benefit analysis, and Quak et al. [24] who used business model analysis.
2.2. The Delphi Method
There is a number of scientific papers establishing the Delphi method to promote and encourage stakeholders’ involvement during the evaluation framing process [25,26]. The Delphi method emerges as a suitable tool, as stakeholders’ subjective judgments, and not analytical techniques, are required. The Delphi method can serve various purposes as forecast, scenario formation, and evaluation. Focusing on the selection process of UFT solutions, the latter two combined can provide a method which allows the evaluators to include additional alternative solutions in the evaluation process other than the identified ones.
To begin with, Markmann et al. [27] employed a Delphi expert survey technique as a long-term decision-making support and foresight. Focusing on the man-made risks in global supply chain, they used Delphi to identify and quantify risks, analyze stakeholders’ perceptions and worldviews, stimulate global communication process, identify outlier opinions, and facilitate risk scenario development. Melander et al. [28] presented a scenario analysis from a Delphi survey focusing on future goods transport in Sweden in 2050, with experts from industry, academia, and government. Results showed that opinions significantly differentiate; however, experts shared common desirability for improvements connected to sustainability. Le Pira et al. [29] designed a consensus building process based on the Delphi method about alternative policies to promote cycling mobility. Cafiso et al. [30] organized a survey about safety issues related to drivers, vehicles, and roads in order to evaluate operations manager knowledge and perceptions with respect to the effectiveness of various new technologies. The survey was organized following a multi-round Delphi process aiming at improving consensus among the participants. Gumus [31] investigated the evaluation and selection problem of hazardous waste transportation firm using a Delphi method. Then, a two-level fuzzy-Analytic Hierarchy Process (AHP) and TOPSIS methodology was developed to decide for the most proper firm. Finally, von der Gracht and Darkow [32] applied scenario planning and presented the findings of an extensive Delphi-based scenario study on the future of the logistics services industry in the year 2025.
There are two types of Delphi types; electronic Delphi (e-Delphi) and classical types. e-Delphi and classical types present no significant differences, except that in the former, participants use computer technology rather than post that allows for easier administration of survey, reduction of abandonment rates over rounds due to significantly lower completion time of the survey, and supporting material such as hyperlinks [33]. e-Delphi that allows for real time presentation of results is mentioned in literature as Real time Delphi [34]. A weakness of Real time Delphi is that results can change any time during the course of the second last round, especially when there is high dispersion of the data values. This might be misleading for a participant who enters the round only once; therefore, weekly reminders about checking the results should be sent to all participants. Moreover, there is a number of openly accessible Real time Delphi platforms; Global Futures Intelligence System from the Millennium Project, Risk Assessment and Horizon Scanning from Defense Science and Technology Agency, eDelfoi, Surveylet from Calibrum, etc. A comparative analysis among such platforms can be found in [35]. To the best of the authors’ knowledge, there is a small number of Real time Delphi type transportation studies [36,37,38]. Based on the reviewed studies, the critical aspects to be considered upon the usage of Real time Delphi are the number and characteristics of respondents, the consensus index and the rounds’ stop criterion/number of rounds.
The number of respondents in transport Delphi studies varies from 15 [31] to over 200 [39]; however, an expert panel that represents diversified interests and validates the research is of greater importance [10,40]. Regarding the consensus index, InterQuartile Range (IQR) and Median Absolute Deviation (MAD) are the two measures mostly met in this literature review. Other measures which were reported in the literature of the reviewed studies are Mode, Clustered Mode, Clustered Pairwise Agreement, Conger’s Kappa, De Moivre index, Extremities Version of the Clustered Pairwise Agreement, Kendall’s W, Fleiss’ Kappa and Pairwise Agreement [30,41,42,43,44]. Moreover, Le Pira et al. [29] composed a custom consensus index to measure the similarity of a collective preference ranking when combining Analytic Hierarchy Process [45] and Delphi method. Finally, three criteria were identified for stopping a Delphi survey’s rounds; predetermined number of rounds, stability of results, and achievement of consensus. Skulmoski et al. [46] reviewed 41 Delphi studies from different fields indicating that 17% consisted of two rounds, 71% of three, 10% of four, and 2% of five rounds. However, in a more recent review on Delphi-based transport scenario studies, it was stated that most studies were completed in two rounds [28].
3. Methodology
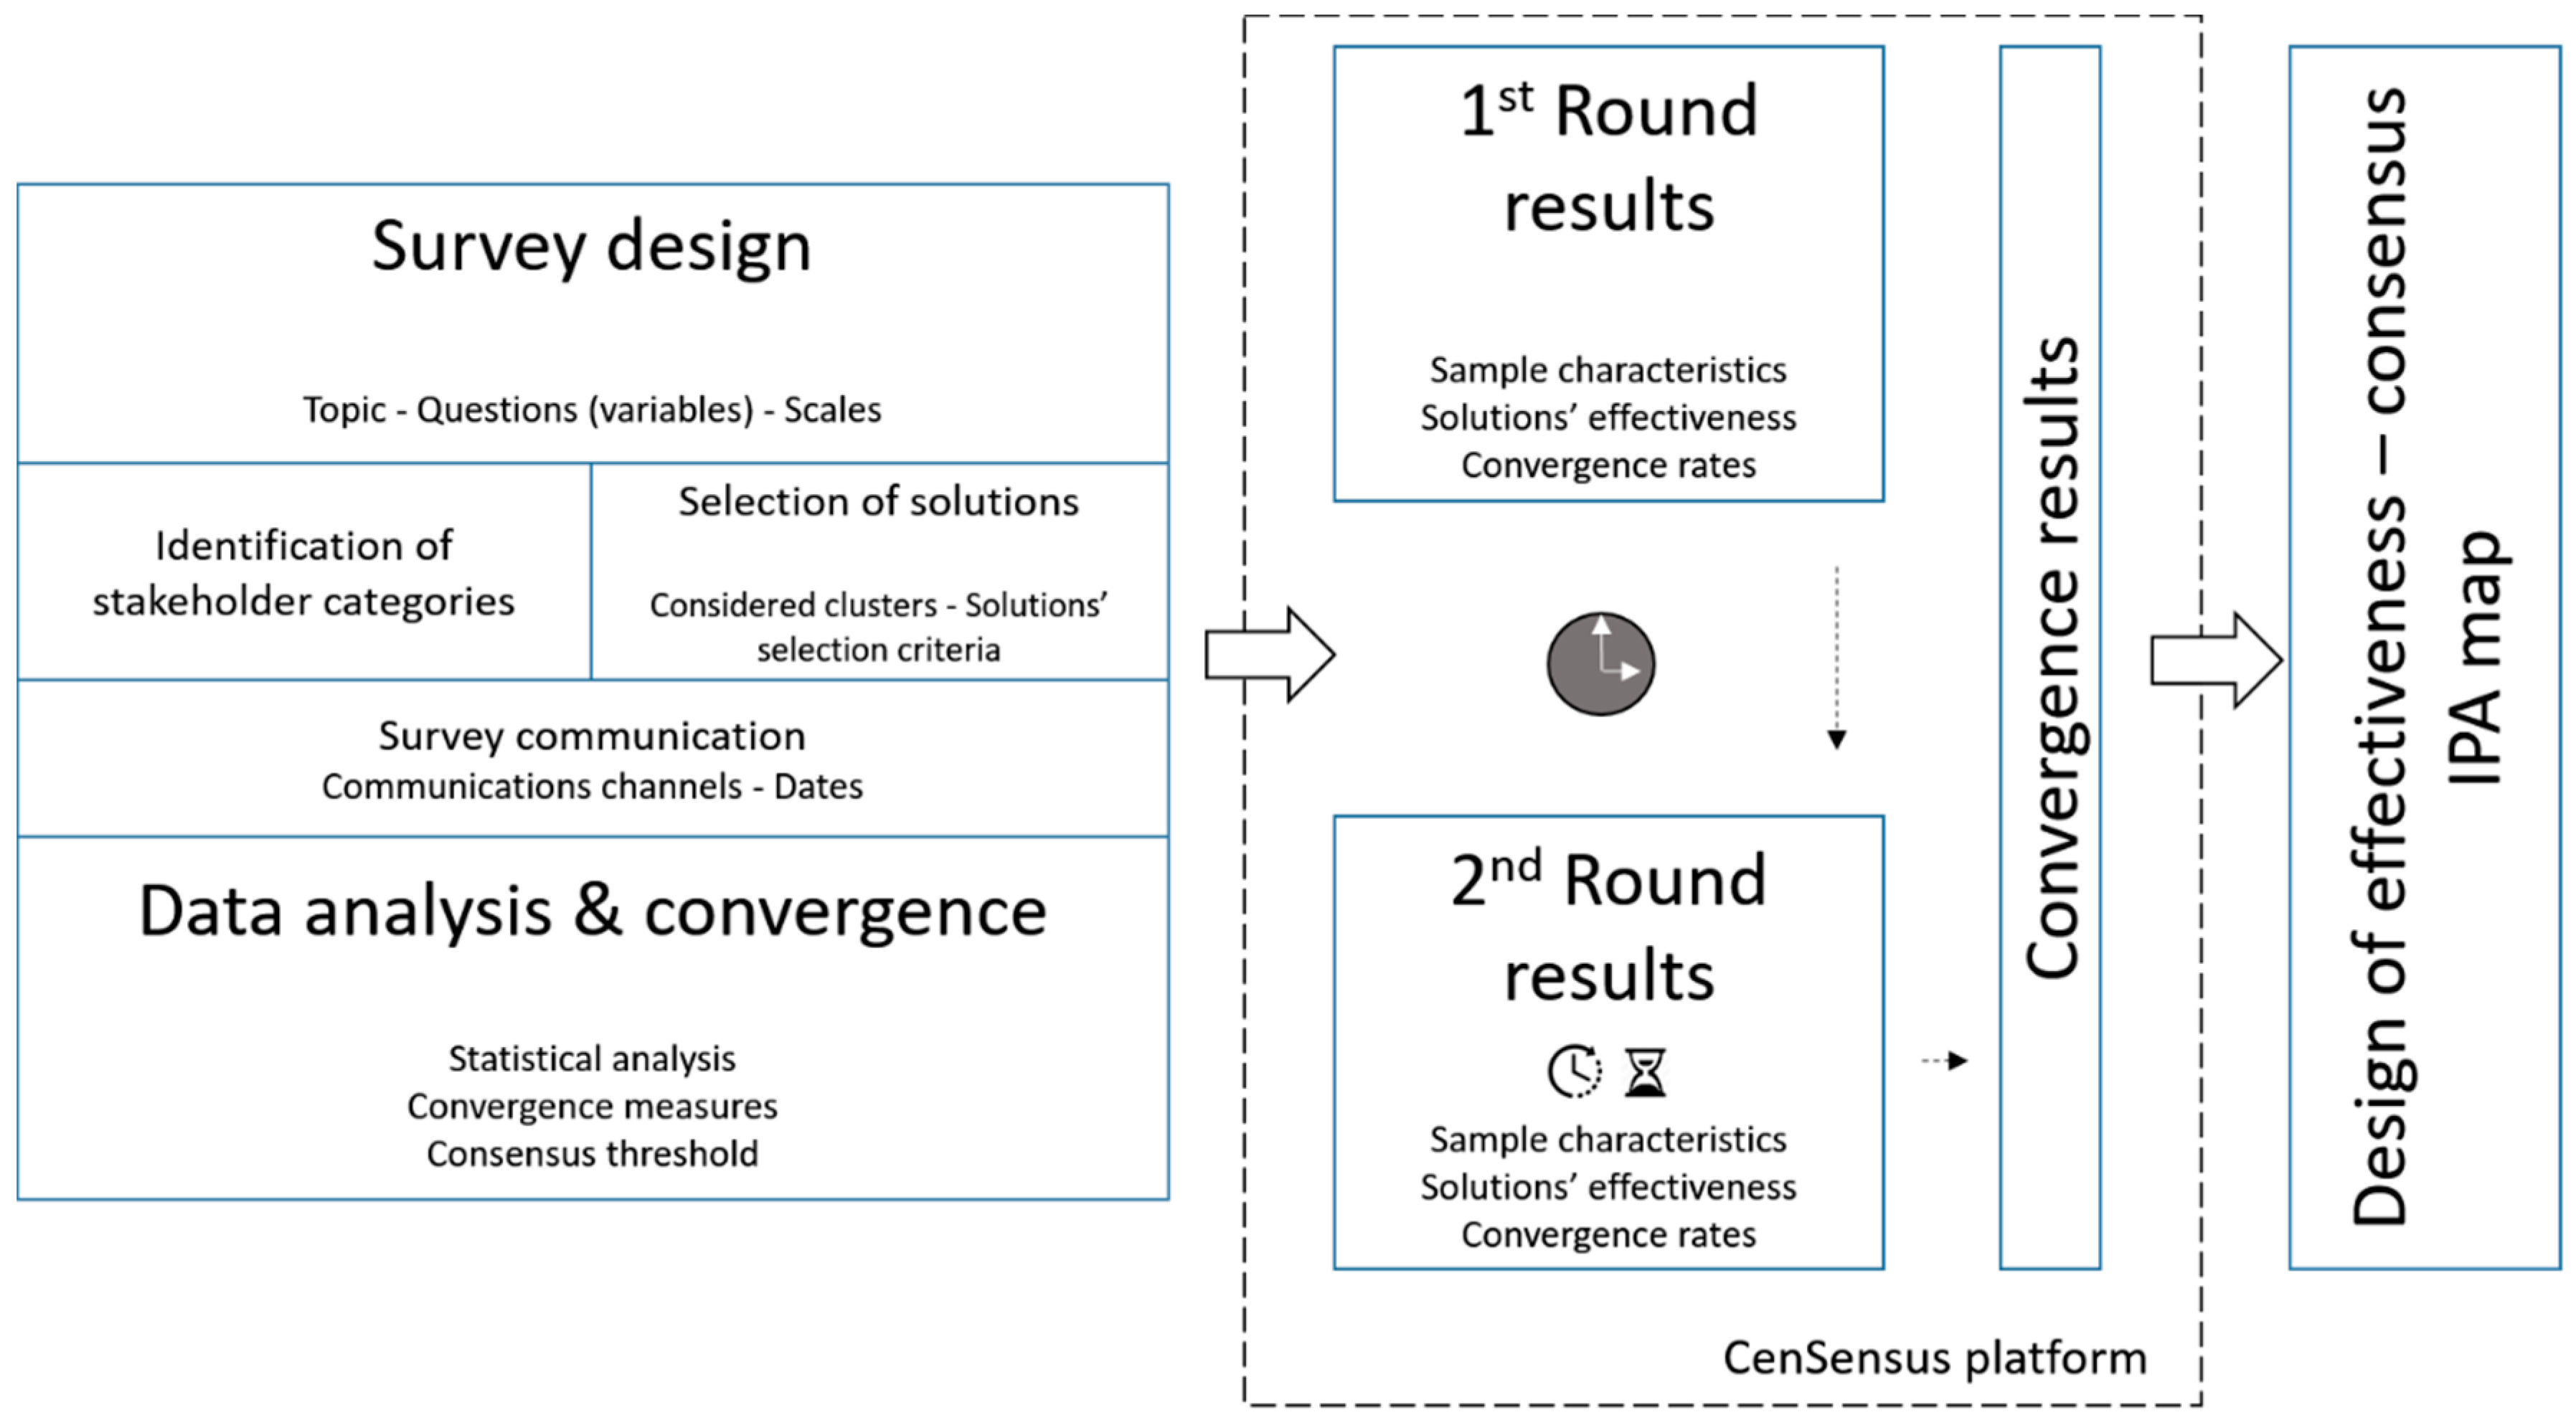
The flowchart in Figure 1 presents the methodological framework to answer the RQs of this study.
3.1. Survey Design
An online survey in the English language entitled “Impact assessment of UFT solutions” was hosted on a Real Time Delphi platform to assess the effectiveness of innovative UFT solutions projected into the seven impact areas. The survey consisted of two parts (Appendix A). The first part recorded the stakeholder category of each participant and his/her city/municipality of residence. The second part aimed at measuring the effectiveness of selected UFT solutions, according to stakeholders’ perception, if they were to be implemented in their city of residence. This was achieved by assessing each solution in the seven impact areas: economy and energy, environment, society, transport and mobility (sustainability dimensions), solution maturity, social acceptance, user uptake (drivers), using a 1–5 Likert scale of effectiveness (see below). As there are some impact areas with positive impact and some with negative, it is noted that solutions were evaluated based on their effectiveness, thus the level of improvement they would bring in the UFT system upon their implementation.
- Very low
- Low/relatively low
- Moderate
- High/relatively high
- Very high
To provide a clear and concise presentation of the selected solutions and impact areas, each solution was accompanied by an explanatory description and a short description of impacts recorded in city cases across the world, while an explanation of each impact area was given in a hyperlinked document when clicking on them. The practicality, appearance, and functionality of the survey was pretested by 19 undergraduate and 6 post graduate students of the Department of Civil Engineering of the University of Thessaly in order to identify abstruse questions, avoid biased answers, and provide feedback for the improvement of the overall survey.
3.1.1. Identification of Stakeholders
The survey was addressed to UFT stakeholders across the world. This diversity of the respondents was attempted so as to reflect stakeholder groups’ and cities’ contextual factors diversity. The considered categories were inspired based on the triple helix approach [47]:
- Supply Chain stakeholders (SC): Freight forwarders, transport operators, shippers, major retail chains, shop owners
- Public Authorities stakeholders (PA): Local government, national government
- Other stakeholders (O): Industry and commerce associations, research and academia, consumers, residents.
3.1.2. Selection of Solutions
A short list of ten innovative city logistics solutions for tackling the UFT problem was selected from a wider list. The wider list consisted of 26 solutions, 22 solutions stemming from NOVELOG project [48], plus four emerging solutions. Emerging solutions according to Scientific American [49] are solutions which are based on technological progress, driving assistance and connectivity such as the deliveries from drones or autonomous vehicles, crowdsourcing and additive manufacturing (3D-printing). Such solutions have not been implemented in full scale case studies; however, some pilots do exist [50,51,52]. An updated and extensive description of all solutions can be found in Holguín-Veras et al. [6,53].
Analytically, all 26 initial solutions were matched with exactly one cluster of solutions, as determined by Papoutsis and Nathanail [54], and then ranked within each cluster based on the times of detection in a systematic literature review [55]. To the six pre-existed clusters of solutions, one more cluster was added which regarded the emerging solutions (Table 1).
According to Table 1, the criteria for solution’s selection were the following:
- Each cluster of UFT solutions should be represented by the solution which was most frequently detected.
- Clusters with more than three solutions should be represented by the two most frequently detected solutions.
- In cases where more than one solution were the most frequently detected per cluster (i.e., new distribution and logistics models for operators), it was decided to consider one “soft” and one “hard” solution. Soft solutions are considered those based on information and communication, organizing services, and/or coordinating activities of different partners. Hard solutions are those which involve the procurement of equipment or infrastructural interference for their proper operation [56].
The only discord with the inclusion criteria regards the selection of Drone deliveries in the Emerging solutions cluster instead of Autonomous vehicles. The replacement was made on the basis that there is no case study on using autonomous vehicles for addressing last mile deliveries, at least until the time of preparation of this study. Another reason is that the last two solutions of this cluster add nearly zero vehicles to the congested urban transport networks since they deploy off-street, and therefore, they are worth an extensive feedback from the stakeholders. Lastly, between Drone deliveries and 3D-prining, the former evidently is more mature for a wide uptake in the UFT field [28].
3.1.3. Survey Communication
The online survey was targeted to stakeholders of UFT systems across the world. The Delphi process usually enables a group of experts in advance by requesting their commitment in participating in all survey’s rounds; however, within this specific survey it was deliberately decided to enable an open panel of participants i.e., stakeholders and not necessarily experts. This was decided based on the increasing recorded trend of the last few years for Delphi surveys to seek beyond experts’ opinions [57,58], in conjunction with the fact that UFT in daily life is affecting majorly and in so many ways the whole society and thus, final consumers and residents should be considered in this knowledge gathering. In that way, credibility of Delphi results is increased as individual experts cannot bias their responses favourably towards personal interests and collected knowledge reflects a wider scope of the topic [59].
Stakeholders were reached through email and messaging by first author’s Premium LinkedIn account. As a first step, emails were sent to 3436 contacts of Traffic, Transportation, and Logistics (TTLog) laboratory of University of Thessaly contact list comprised of research institutions, ministries, municipalities, associations, groups, companies, actions, projects, and postgraduate students around the world, 419 members of editorial advisory boards of top logistics journals, and 25 freight transport companies. The emails were sent from the author’s institutional email account by using the premium version of Yet Another Mail Merge (YAMM) add-on for sending mass emails. YAMM sends separate personalized mass emails to a pool of emails, thus anonymity was ensured.
As a second step, the author’s personal LinkedIn account was used, aiming at reaching 1000 additional stakeholders. The methodology that was followed was to increase the network of the account with recommended connections by LinkedIn if “city logistics”, “urban freight transport”, “urban freight”, “last mile deliveries”, and “last mile logistics” keywords were searched. The connection requests were focused primarily on the two first stakeholder categories, i.e., SC and PA, based on accounts’ description, as almost 70% of the emailed contacts belonged to the O category. However, no particular filters or any other actions were taken in favour of the two stakeholder categories. A 1062 LinkedIn network was finally formulated and privately messaged to participate in the Delphi survey. The first round opened on 2 April 2019 and remained opened till 24 May 2019. Along with the invitation to participate, information about the purpose and the design of the survey, instructions how to run the survey, and the time horizon of the two rounds were sent. The second round opened on 04 June 2019 and remained opened till 28 June 2019.
3.2. Data Analysis and Convergence
The analysis of the data was done through descriptive and inferential statistics. In the first case, sample characteristics, such as stakeholder category, city/country of residence, and number of arguments were addressed by estimating the frequency distribution per characteristic. In the second case, the statistical analysis of the responses was carried out using non-parametric tests, as data were found to not follow normal distribution [60]. Specifically, Kruskal–Wallis non-parametric testing was performed to assess statistically significant differences among the three stakeholder categories [61]. To determine if any of the differences between the medians are statistically significant, p-values were compared to the significance level to assess the null hypothesis. A confidence level of 95% and a confidence interval of 5% were assumed.
The indication of the effect of a Delphi survey is the amount of convergence caused by the iteration process, where convergence signifies how much more agreement is achieved on succeeding rounds as opposed to the first-round response [59]. Convergence is measured through established criteria which are subjective and relevant to the scope of a survey [62]. As datasets are not strictly symmetric, the convergence will be measured by the IQR; however, the MAD (Equation (1)) is also calculated to see if there are any mismatching results due to the selected method. IQR is the measure of dispersion for the median and consists of the middle 50% of the observations. Thus, an IQR of less than “1” means that more than 50% of all opinions fall within 1 point on the scale. IQR is a robust estimator that typically has inferior statistical efficiency compared to conventional estimators for data drawn from a distribution without outliers (such as a normal distribution), but has superior efficiency for data drawn from a mixture distribution or from a heavy-tailed distribution, for which non-robust measures such as the standard deviation should not be used [62]. Given the 1–5 ordinal scale of responses in the current study and its interpretation in terms of effectiveness, the adopted threshold of consensus was set to IQR ≤ 1.
where = median (x).
4. Implementation and Results
The online survey was hosted on “CenSensus”, a Real time Delphi platform and performed in two consultation rounds [63]. During the first round, stakeholders were asked to assess the ten UFT solutions and optionally back up their assessment by providing an argument. The second round was a real time round that allowed participants to see how much their evaluations diverge from the average evaluation of all participants, with color gradation, while reading the “pro” and “against” arguments. In this way, the users had the ability to change their evaluation as many times as they want till the end of the second round. The specific Real time Delphi platform was developed and used to serve to the highest degree the needs of this survey as in the rest platforms, low parameterization possibilities, and certain limitations emerged. Some identified problems were associated to the instability of the platforms, structure limitations, delays in real time, excessive access costs for certain options etc. [35]. Weaknesses of the platform such as connection with data analysis tools and visual presentation of the results are to be addressed in next releases of the platform.
The sample characteristics as well as the results of the statistical analysis are presented in the following sections.
4.1. Sample Characteristics
The final sample size of the first round comprised 184 participants who fully completed the questionnaire and successfully submitted their responses, while 97 participated successfully in both rounds. The noted abandonment rate between the two rounds is considered high according to other e-Delphi studies which ranges from 20 to 25%; however, it is satisfactory given that no commitment was pre-requested from participants [64]. Table 2 presents the reported characteristics of participants in each round.
Focusing on the O stakeholder category, which is widely represented in the sample, 9.2% reside in Athens, 7.1% Thessaloniki, 5.7% Volos, 3.5% Rome and Delft, 2.8% Lisbon, 2.1% Melbourne and Singapore, while the rest 63.8% in 79 other cities. In an effort to investigate how many of the O are UFT experts (members of associations, researchers, and academicians) and how many are stakeholders affected by UFT activities without having direct role in the deployment of activities (residents and consumers), it was concluded that 112 were experts, while for the rest, 29 no safe conclusions could be drawn. This was achieved by cross-checking the emails of the TTLog list and the list of emails which were registered in the CenSensus platform as O. On this basis, no further separation of the O category was attempted in the analysis of the results.
Almost one in four participants added an argument to their assessment which shows that the participants were very active with respect to opinion scores and expression. Analytically, 24.3% of SC in average put up an argument per solution, 26.5% of PA and 20.4% of O. The solutions with the highest number of arguments for SC (30.4% each) were city lockers, off-hours deliveries, and multi-user lanes, for PA (35.0%) Off-hours deliveries and for O (23.4%) multi-user lanes.
4.2. Results
Effectiveness
Based on the Kruskal–Wallis non-parametric testing, p-values were higher than 0.05 in all cases; thus, the differences among the ratings of the three stakeholder categories were statistically not significant. Thus, results were given in an aggregated form for all three stakeholder categories and not separately. Furthermore, the Cronbach’s alpha test was used to measure the internal “reliability” of participants’ responses for all impact areas of each solution. The Cronbach’s alpha value per solution ranged from 0.827 to 0.898, which indicated a high level of internal consistency of the scale [65]; thus, all solutions were sorted in descending order based on all participants’ average median of impact areas (Table 3).
Attempting to answer RQ1, the most effective solution overall is ITS for freight monitoring and planning/routing (3.714). Dynamic freight vehicles’ routing based on ITS allows drivers to opt for alternative routes and public authorities to enhance safety and prevent violations of access regulations. Such systems need high-quality real-time traffic data which require high capital investments; however, upon their operation they increase efficiency, improve reliability, reduce congestion, and enhance environmental sustainability [9]. The least effective solution is drone deliveries (2.571). Although drone deliveries are given great potential and a significant number of pilot programs have already been launched by the big logistics companies, the solution is considered only at an initial stage [66]. Considering that pre-existed legal problems have now been resolved (see Part 135 certification of the Federal Aviation Administration in the US), large scale implementation issues, such as drone traffic management, and a series of other i.e., theft, weather impact, drone abuse, range, power lines, and other obstacles, have not been addressed yet [67].
An interesting observation is that all solutions are rated higher in the sustainability dimensions as compared to the drivers of stakeholders’ engagement. This can be attributed to the increasing attention on efforts to reduce the impacts of transportation on environment, energy, and society, rather than on the drivers of stakeholders’ engagement, which are interpreted simply as the attractiveness of the solution to different stakeholders, irrespective of how e.g., a solution fits with the local authorities’ political agenda [68].
4.3. Convergence
As per RQ2, convergence of participants’ ratings in both rounds expressed through IQR is demonstrated in Table 4. It has to be noted here, that during the second round, participants were able to see how much their rating diverge from the median of all participants and not from the median of their stakeholder category. This was decided for two reasons; first because results among the three stakeholder categories were statistically indifferent, and second because consensus building was not targeted within the categories but within all stakeholders, i.e., at a city level. In addition, there are no records about how many times or how often stakeholders accessed the second round which could provide vital information about the achieved convergence.
Grey coloured cells designate these impact areas for which consensus is reached due to the second real time round of the Delphi platform. Consensus at a solution level (see column Consensus) is measured as the percentage of impact areas with IQR≤1 and is reached when >70% [69,70]. Furthermore, the direction of agreement for solutions not reaching consensus (≤70%) was only strengthened in Round 2.
MAD values are in all cases equal to 1, except for the Environment impact area of the solution Urban consolidation centers in Round 2, where it was equal to 0.5. Comparing the IQR and MAD values, it can be concluded that IQR is more “sensitive” to measure dispersion of data. Box plotting the data showed that the set is not symmetric and thus, IQR measure is more appropriate than MAD [71].
4.4. Design of Effectiveness—Consensus IPA Map
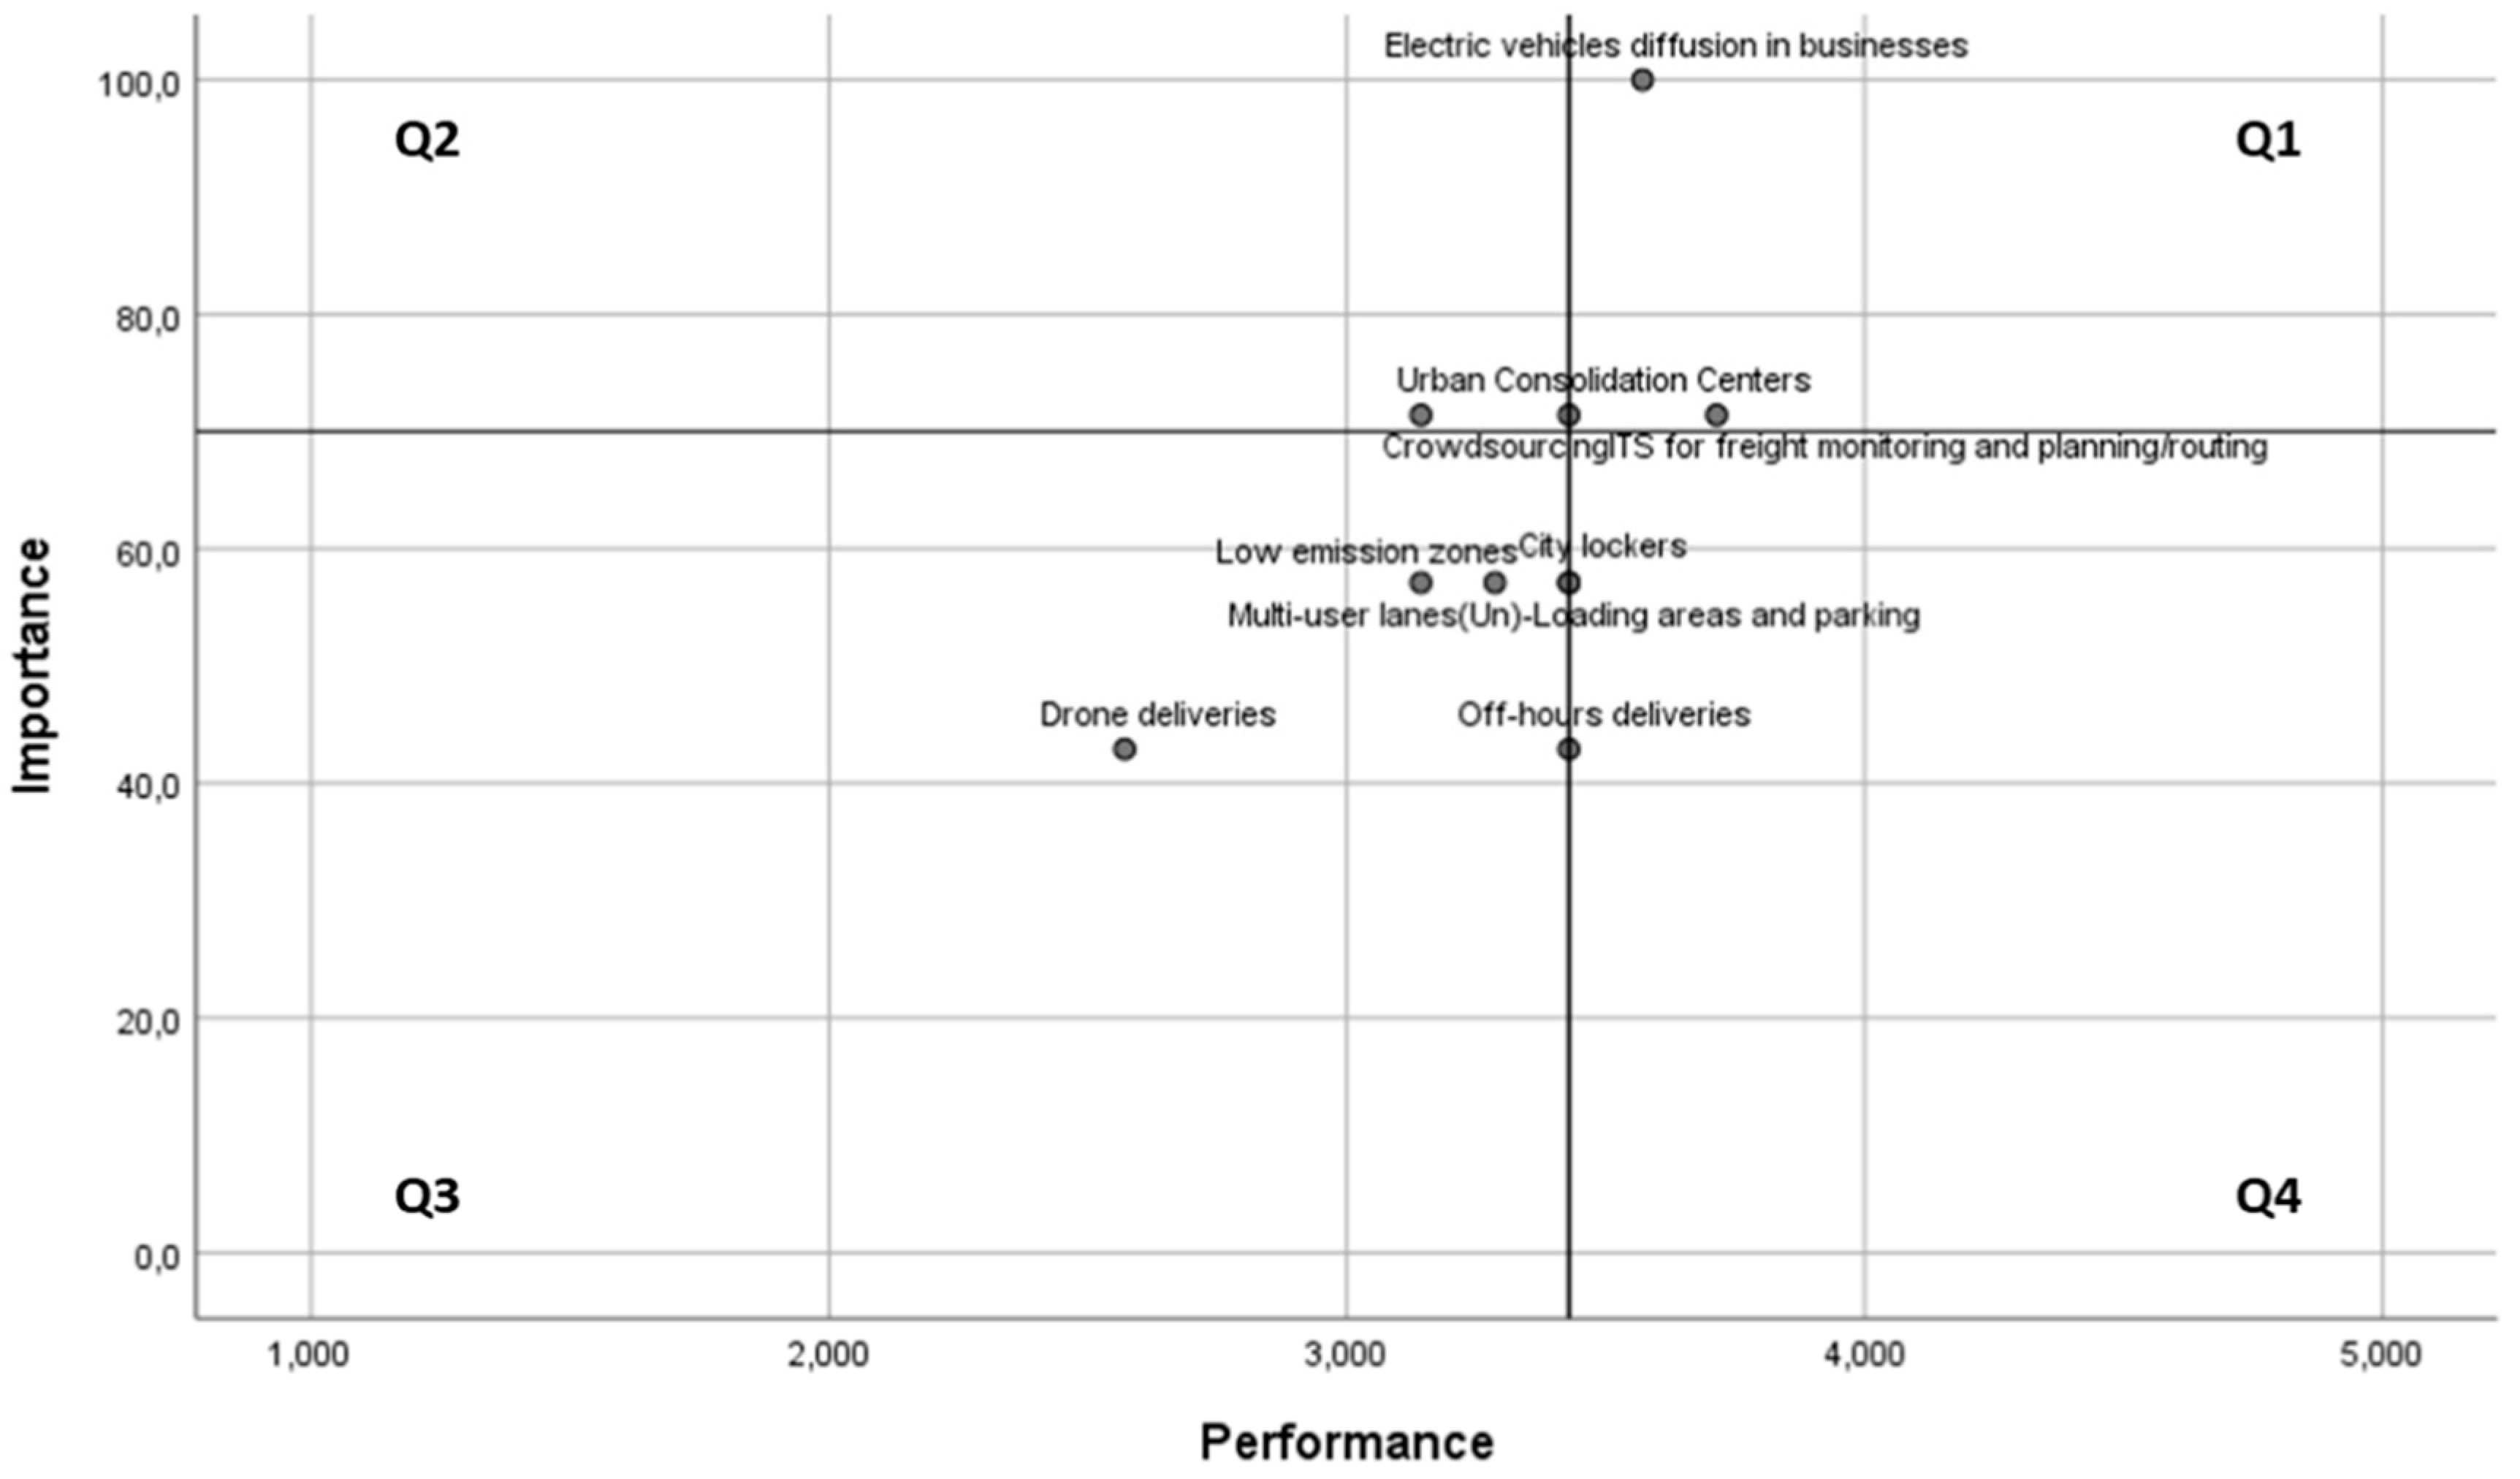
In an attempt to answer RQ3 and analyse jointly UFT solution’s effectiveness and consensus, an adapted Importance Performance Analysis (IPA) was conducted [72]. IPA’s objective is to identify the performance of a service or product—here of a UFT solution—while at the same time to facilitate data interpretation to derive practical suggestions [73]. In this study, performance is translated into solution’s effectiveness and importance into the level of convergence, following the definition of importance given by Oh [74]. The division of the IPA map into quadrants (Figure 2) was performed by setting the threshold line of 70% consensus as regards the y axis “Importance”, and the average median of all participants’ rating (3.31) for the x axis “Performance”, see “Average Median” column of Table 3. Arising issues related to the selection of the threshold lines in IPA maps are extensively discussed in [75,76,77].
In the initial analysis of Martilla and James [72], the first quadrant (Q1) hosted services or products that are performing well, while at the same time are considered important by the customers. Respectively in this study, UFT solutions lying within Q1 are appropriate for implementation upon solution selection process, as they combine high effectiveness and consensus. Q2 area contains solutions (here only crowdsourcing) that stakeholders rated unanimously as least effective; thus, solutions in the Q2 area are considered inappropriate. Likewise, in the Q3 and Q4 areas lay solutions in which consensus has not been achieved, and thus suggestions for selecting them cannot be supported, no matter how effective they are considered. Finally, some studies highlight the difficulty to interpret attributes close to the threshold lines [75,78,79], as a slight change can lead to opposite suggestions. Such an ambiguous solution in this study is Urban consolidation centres.
5. Concluding Discussion
UFT is an open and dynamically changing system where various stakeholder categories with conflicting objectives and autonomy are involved. To achieve high performance of such a system, the eurhythmic cooperation of all involved stakeholders and the adoption of effective solutions are required. The Delphi based methodological framework presented in this research is proved able to facilitate the selection of the most appropriate alternative (UFT solution) among a set of alternatives by supporting inclusiveness and equity of all stakeholders and promoting their collaboration. The framework can be either used to enrich the knowledge around the identified impacts of UFT solutions according to stakeholders’ perceptions, as in this study, or used by stakeholders of an urban area while assessing current and future performance (Principle 3), and arranging for monitoring and evaluation (Principle 7) according to the European Platform on Sustainable urban mobility and logistics plans [14]. In this case, the set of the alternative UFT solutions can be evaluated in the seven identified impact areas or under a number of specific performance indicators, each city has selected for better monitor, control, and management of the UFT system.
The results of the study indicated that the highest rated solutions i.e., ITS for freight monitoring and planning/routing and electric vehicles diffusion in businesses have also reached the highest convergence rates between stakeholders’ evaluations, and the least rated solution, i.e., drone deliveries has reached the lowest rates along with off-hours deliveries. Off-hours deliveries and drone deliveries achieve low consensus levels, which indicates that the many changes that they require across the supply chain for their deployment are dealt with scepticism from stakeholders. Such concerns about off-hours deliveries have been reported in [80,81] and about drone deliveries in [66,82]. Another possible explanation is that stakeholders do not have enough information or experience to decide, resulting in skewed perspectives over solutions’ effectiveness.
Interesting conclusions can be also drawn for the two solutions lying within the Q3 of the Effectiveness-Consensus IPA map, namely Low emission zones and Multi-user lanes. Although for example, Low emission zones in average seem to score Moderate to High/relatively high effectiveness (Table 3), there is relatively high dispersion of scores as regards the applicability drivers among stakeholders, which leads to a low consensus level (Table 4). In an attempt to generalize based on the results of Table 3 that all solutions are rated higher in the sustainability dimensions as compared to the drivers, it can be drawn that a rather effective solution cannot be transferred to another area and expect similar overall effectiveness. One step forward, comparing the convergence rates of Table 4 between sustainability dimensions and considering that the generalized impacts of UFT solutions are now rather well identified in literature, emphasis should be given to the drivers, which will finally determine which solution will be selected upon sustainable urban logistics planning.
5.1. Limitations
A major limitation of the study is that it does not capture spatial scales. For example, congestion may be the most important problem of the urban part of a city, but not of the suburban. When averaging these two areas to conclude about the congestion problem of the city, important information is lost. Comparing this paper’s results with the results of the National Cooperation Freight Research Program (NCFRP) report [83], which studies the effectiveness and applicability of UFT strategies in U.S. cities, nearly opposite conclusions can be drawn. In the NCFRP report, strategies as ITS and alternative fuels and vehicles are reviewed to have low to medium effectiveness in the U.S. context, while traffic and parking regulations, and road pricing and dedicated truck lanes are reviewed to have medium to high. Considering that 81% of survey’s participants reside in European cities, this validates the statement that the effectiveness of a UFT solution is highly correlated to urban geography, as U.S. cities are characterized by different city morphology, UFT market type, etc.
Another limitation of the study is the unbalanced sample towards O stakeholder category and European countries, which increases the margin of error. The category of O includes very different stakeholders that might affect the significance of the different responses. For instance, researchers might view the effectiveness of a solution differently from residents, but they are not fully represented as a separate group. Attributing relative weights among the three stakeholder categories, so that each stakeholder category is equally represented in the decision-making process, can be one solution to this issue.
5.2. Further Research
Further research could cluster participants in smaller categories i.e., transport operators, shop owners, researchers, and residents, to represent more accurately the perceptions of specific stakeholders. By forming smaller categories, statistically significant differences among stakeholders could emerge, allowing for further investigation of UFT solutions’ appropriateness at a city level. Moreover, integration of city cases with explicit typologies could validate the analysis performed and reveal empirical relationships of effectiveness and consensus.
Author Contributions
Conceptualization, I.K. and E.N.; methodology, I.K.; software, I.K.; validation, I.K. and E.N.; formal analysis, I.K.; investigation, E.N.; resources, I.K.; data curation, I.K.; writing—original draft preparation, I.K.; writing—review and editing, E.N.; visualization, I.K.; supervision, E.N.; project administration, E.N.; funding acquisition, I.K. All authors have read and agreed to the published version of the manuscript.
Funding
This research is co-financed by Greece and the European Union (European Social Fund- ESF) through the Operational Programme «Human Resources Development, Education and Lifelong Learning» in the context of the project “Strengthening Human Resources Research Potential via Doctorate Research” (MIS-5000432), implemented by the State Scholarships Foundation (ΙΚΥ).
Conflicts of Interest
The authors declare no conflict of interest. The funders had no role in the design of the study; in the collection, analyses, or interpretation of data; in the writing of the manuscript, or in the decision to publish the results.
Appendix A

Table A1.
Questionnaire (Part 1).
| Questions (Part 1) | ||
|---|---|---|
| 1. Please select your stakeholder category (Dropdown menu) | - SC: Supply Chain Stakeholders (Freight forwarders, Transport operators, Shippers, Major retail chains, Shop owners) data | |
| - PA: Public Authorities (Local government, National government) | ||
| - O: Other stakeholders (Industry and commerce associations, Consumers associations, Research and Academia, Citizens) | ||
| 2. Please type here your city and country of residence | [City] | [Country] |
Table A2.
Questionnaire (Part 2).
| Common question: How effective is the solution below if it was to be implemented in your city of residence? Please provide your rating and comment for all seven impact areas. | |
| (The words “impact areas” were hyperlinked with a document describing the seven impact areas, see below): 1 The impact areas consist of four sustainability disciplines; Economy and Energy, Environment, Transport and Mobility, Society; and three applicability drivers; Policy and Measure Maturity, Social Acceptance and Users’ Uptake. Economy and energy. Energy is a major field that is directly connected with economy in modern communities. Energy availability, demand, price, and actual consumption have short-term and long-term impacts on lifestyles. The creation of a sustainable economy requires partial utilization of energy and development within environmental limits. Continuous utilization of nonrenewable energy sources results in depleted energy sources and increased energy pricing, therefore unsustainable communities. Environment. The environment refers to the preservation of natural resources and the limits within which activities should take place without depleting of non-renewable resources. The environmental impact of logistics is addressed through emissions, air quality, and noise impacts on communities. Transport and Mobility. Transport and mobility are two concepts that are becoming more and more popular at the local, national, and European level. The continuous pursuit of improving transport of goods and mobility of people is usually translated into terms of attractiveness, accessibility, level of service, safety, as well as availability of infrastructure. Society. The ultimate aim of the implementation of Urban Freight Transport (UFT) measures is the positive impact of them to the society. Society is defined as different groups of people that interact with other people in a community. Societal impacts of logistics can be described adequately with respect to sustainability, convenience, and living standards of the community. Policy and measure maturity. The policy and measure maturity impact area express mainly the involvement of stakeholders into the implementation of a proposed UFT measure. More specifically, it is related with the awareness of stakeholders towards the measure, their managerial skills, as well as their related knowledge, experience, and willingness to adopt it. Social acceptance. The social acceptance impact area can be discerned into two levels; the social approval level, i.e., to what extend a measure is welcomed and respected by the society and the regulations’ acceptance level which has to do with regulations’ compliance and the way a measure is enforced. User Uptake. This impact area checks the adaptability, flexibility, transferability, and success of the implementation of a UFT measure, taking into consideration stakeholders’ opinions, agreements, and acceptance. 1 Source: Nathanail Eftihia, Mitropoulos Lambros, Karakikes Ioannis, Adamos Giannis, 2018. “Sustainability framework for assessing urban freight transportation measures”, Logistics and Sustainable Transport, 9.2 (2018): 16–36, doi:10.2478/jlst-2018-0007. | |
| Likert scale of effectiveness: 1: Very low|2: Low/relatively low|3: Moderate|4: High/relatively high|5: Very high | |
| Place here your comment to back up your evaluation: [Comment] | |
| Given description (per solution) | |
| Solution 1: City lockers | Cluster: New distribution and logistics models for operators |
| Case study and Impacts: Within the EU project NOVELOG, the city of Graz, Austria, extended the “Bring mE” service, a service which performs freight distribution by using lockers and e-cargo bikes from the shops to the customer’s addresses. The extension of the “Bring me” service was twofold. On one hand, the service expands in new housing areas and new shops, while on the other hand, a new B2B service is introduced based on the distribution of cargo by e-vehicles. According to all city’s stakeholder categories assessment, the overall performance of the logistics system was improved by 7%. Analytically, the impact area Economy and Energy was improved by 31%, Transport and Mobility 67%, Society 85%, Policy and Measure Maturity 64%, Social Acceptance −18%, and User Uptake 100%. | |
| Automated systems enabling customers to pick-up e-purchased goods from designated 24/7 Parcel Locker pickup points. They offer improved access to goods and reduced travel for consumers and delivery vehicles. Strengths: Increase efficiency; Reduce auto trips for parcel pick-up; Promote the usage of public transit; Reduce shipping costs; Enhance environmental sustainability; Offer new market opportunities. Weaknesses: May require additional parking space due to high demand; May be proved difficult to handle for senior citizens; Limited capacity. | |
| Solution 2: Off-hours deliveries | Cluster: Infrastructure development and vehicle characteristics |
| Case study and Impacts: The ARIAMA project was about the purchase of 30 electric vehicles and installation of charging points in the city center of Reggio Emilia, Italy. The electric cars were rented by companies for daily delivery activities. The impacts after the implementation of the project were characterized as “Positive” for the Environment impact area, “Slightly positive” for Economy, and “Positive” for Society. | |
| Development of a strategic framework for the promotion of electric vehicles, mobility advantages for cleaner vehicles, vehicle tax incentives, and voluntary agreements with the private sector. The use of electric and plug-in electric vehicles for last mile delivery can be combined with initiatives such as unlimited free parking from the municipal street parking regulation, free recharge street points, reduction in municipal tax on motor vehicles, and discounts on the annual fee for freight operations for hybrids. Other innovative solutions such as electric autonomous connected platoon-based systems that rely on the ability of vehicles to follow one another can also be combined. Strengths: Foster the use of environmentally friendly vehicles. Weaknesses: Require (albeit minimal) investment of public resources. | |
| Solution 3: Multi-user lanes | Cluster: Capacity sharing solutions |
| Case study and Impacts: Within the SUGAR project, the city of Barcelona, Spain, placed VMS displaying real-time access regulations on multi-use lanes for freight vehicles. The main result was a reduction of 12–15% in travel time and better traffic flow. | |
| Several multi-lane roads in the area of interest are equipped with Variable Message Signs (VMS). During the day time, one lane of the street is reserved for activities of different user groups (parking, loading, unloading, traffic flow). The VMS show the actual access rights per user group to use the lane. A first VMS shows whether the lane can be used for floating traffic or whether it is dedicated to parking and loading activities. In case the lane is dedicated to parking and loading activities, a second VMS shows the actual allowance for a particular user group. Strengths: Enhance environmental sustainability and safety; Increase efficiency; Discourage unnecessary truck movement in sensitive areas. Weaknesses: High probability for unintended consequences; Require proper communication, education and enforcement by authorities; Require high degree of coordination among jurisdictions. | |
| Solution 4: Urban Consolidation Centres (UCCs) | Cluster: Capacity sharing solutions |
| Case study and Impacts: Within the EU project NOVELOG, the city of Reggio Emilia, Italy, evaluated the establishment of an UCC. According to all city’s stakeholder categories, the overall performance of the logistics system was improved by 28%. Analytically, the impact area Economy and Energy was improved by 44%, Environment 26%, Transport and Mobility 47%, Society 29%, Policy and Measure Maturity 9%, Social Acceptance 47%, and User Uptake remained the same. | |
| Promoting the consolidation of cargo shipments at one or more urban terminals. Carriers that would otherwise make separate trips to the target area, with low load factors, transfer their loads to a neutral carrier who consolidates the cargo and manages the final delivery. Conceptually, this may include “joint delivery systems”, “cooperative logistics”, and “UCCs.” Strengths: Improve load factors; Reduce congestion; Enhance environmental sustainability; Reduce curbside occupation time. Weaknesses: Opposition from unions and suppliers; Require public subsidies; Increase the operational cost; High capital investments; Extremely large physical space; Difficult to enforce; Increase in traffic at/in the vicinity of the area/facility. | |
| Solution 5: Electric vehicles diffusion in businesses | Cluster: Infrastructure development and vehicle characteristics |
| Case study and Impacts: The ARIAMA project was about the purchase of 30 electric vehicles and installation of charging points in the city center of Reggio Emilia, Italy. The electric cars were rented by companies for daily delivery activities. The impacts after the implementation of the project were characterized as “Positive” for the Environment impact area, “Slightly positive” for Economy and “Positive” for Society. | |
| Development of a strategic framework for the promotion of electric vehicles, mobility advantages for cleaner vehicles, vehicle tax incentives, and voluntary agreements with the private sector. The use of electric and plug-in electric vehicles for last mile delivery can be combined with initiatives such as unlimited free parking from the municipal street parking regulation, free recharge street points, reduction in municipal tax on motor vehicles, and discounts on the annual fee for freight operations for hybrids. Other innovative solutions such as electric autonomous connected platoon-based systems that rely on the ability of vehicles to follow one another can also be combined. Strengths: Foster the use of environmentally friendly vehicles. Weaknesses: Require (albeit minimal) investment of public resources. | |
| Solution 6: Low Emission Zones (LEZs) | Cluster: Access control |
| Case study and Impacts: A low emission zone was originally introduced to improve air quality in Gothenburg, Sweden in 1997 and was then extended to cover a larger area in 2007. All Heavy Good Vehicles (HGVs) (over 3.5 tonnes gross laden weight) are required to meet Euro 4 emissions standards to enter a LEZ. The year after the extension of the LEZ, some 96% of HGVs operating in the city centre met Euro 4 emissions standards and the city authority expected to have reduced the amount of PM10 by 1 tonne and of NOx by 40 tonnes each year between 2007 and 2013. | |
| These strategies have a twofold positive effect: on one hand, they reduce the environmental impact of freight traffic, while on the other hand, they foster the use of clean technologies by promoting the use of electric or low-emission vehicles for urban deliveries. Vehicles renewal programmes can support this type of initiative. The introduction of low emission zones may ban all vehicular traffic, or just vehicles that do not meet a minimum environmental standard (engine-related restrictions). Strengths: Enhance environmental sustainability and liveability; Increase efficiency; Facilitate off-hour deliveries; Social acceptability. Weaknesses: Require high capital investments for the private/public sector; Require coordination among municipalities and control/enforcement; Require private-sector cooperation; High probability for unintended consequences. | |
| Solution 7: Loading/Unloading areas and parking | Cluster: Regulations on enabling activities |
| Case study and Impacts: Transport for London (TfL) aimed to provide comprehensively curbside loading facilities on London’s road network. By facilitating curbside loading at the right place and time, through a combination of appropriate physical infrastructure and traffic regulation/management orders, traffic flow was improved, and benefits arose for the local economy. | |
| On-street parking solutions aim at adapting existing street designs and loading areas to accommodate current and future traffic and commercial vehicles volumes. The measures focus on allocating adequate curb space for parking and loading activities. Parking places and loading-zone-related strategies focus on designating and enforcing curbside parking, reallocating curb space, and identifying potential freight traffic parking locations. This initiative requires significant effort to coordinate multiple stakeholders, from planning to transportation organisations, in order to update and modify current regulations, land use codes, and re-zoning strategies. Careful planning is needed when allocating curb space or implementing fees or other parking constraints. Investment costs for updating parking regulations are low and implementation times short. Increasing the capacity of parking and loading areas is an easy and low cost way to reduce congestion and improve traffic. The freight industry usually reacts very positively to this policy as it makes it easier for them to do their job. Strengths: Enhance environmental sustainability; Reduce congestion; Improve operational efficiency; Enhance safety; Reduce traffic/parking violations. Weaknesses: May require retrofitting existing developments; May result in lack of curbside space; Require public and private-sector acceptance; May not be feasible at specific locations. | |
| Solution 8: ITS for freight monitoring and planning/routing | Cluster: Enforcement, routing optimization and training |
| Case study and Impacts: ILOS was a project of freight routing optimisation in Vienna, Austria, with two main objectives: to develop and define possible indicators to show the potential time and/or distance savings based on information of traffic flows; i.e., delivery routes are optimised with the help of traffic data. The project achieved a 60% reduction in travelling time, a 15% reduction in distance, a 20% reduction in fuel and a 30% reduction in cost. | |
| Dynamic routing systems are used by public authorities to enhance safety and prevent violations of access regulations. Truck routing and the decision support system are based on Intelligent Transportation Systems; they require high-quality real-time traffic data, information on the road network and land use in the area. Strengths: Increase efficiency; Improve reliability; Reduce congestion; Enhance environmental sustainability. Weaknesses: Require real-life traffic information; Require very high/high capital investments. | |
| Solution 9: Crowdsourcing | Cluster: Emerging solutions |
| Case study and Impacts: Based on a simulated study conducted with the data for the city of Alexandria, Virginia, US, it was found that retailers could reduce their total truck mileage by 57% (which is equivalent to reducing delivery costs by 8600USD per day) by using crowdsourcing, with the individual drivers (who provide the delivery assistance to their friends) taking an average of 10 min extra per delivery. Additionally, the achieved reduction in the volumes of pollutants—NOx, PM2.5, and PM10—emitted by delivery trucks amounts to as much as 55%. Strengths: Reduce delivery costs; Reduce congestion; Increase neighbourhood acquaintance. Weaknesses: Public acceptance (whether people are going to be comfortable having their products delivered by their neighbours); Accountability and insurance issues. Source: Devari, A., Nikolaev, A.G., He, Q., 2017, Crowdsourcing the last mile delivery of online orders by exploiting the social networks of retail store customers. Transportation Research Part E 105 (2017) 105–122. | |
| The concept of crowdsourcing for last mile delivery proposes that a share of daily deliveries is performed by social media users who sustain a level of familiarization with the final recipient (not necessarily). This way, delivery costs will be decreased and multiple trips due to not-at-home situations will be nearly eliminated, bringing sustainability benefits to all stakeholders. | |
| Solution 10: Drone deliveries | Cluster: Emerging solutions |
| Case study and Impacts: In December 2016, Amazon carried out the first home delivery with a parcel drone that took place in Cambridge, Great Britain. The arrival site was near a special Amazon warehouse that has the appropriate equipment to provide this service. The UAV was a small quadrilateral and performed air routes at less than 400 feet and a maximum length of 10 miles. The delivery time was only 13 min. As the majority of Amazon orders (85%) weigh less than 5 kg, UAV may become particularly common in the future. Extended daily working periods are shown to benefit both service providers and users. | |
| Drone deliveries are realized with Unmanned Aerial Vehicles (UAVs) with advanced safety and reliability features, such as automated flight and sense-and-avoid technology to prevent collisions. The main feature of this delivery method is that UAVs carry air packages of limited weight and number each from the enterprise storage facility to the point of receipt by the customer. Strengths: Zero contribution to congestion; Presence of a driver is not required; Environmental friendly. Weaknesses: Require a strong regulatory and legislative framework; Security issues. | |
References
- Kiba-Janiak, M. Urban freight transport in city strategic planning. Res. Transp. Bus. Manag. 2017, 24, 4–16. [Google Scholar] [CrossRef]
- United Nations. Around 2.5 Billion More People Will Be Living in Cities by 2050, Projects New UN Report; United Nations Department of Economic Social Affairs: New York, NY, USA, 2018. [Google Scholar]
- Rai, H.B.; Van Lier, T.; Meers, D.; Macharis, C. Improving urban freight transport sustainability: Policy assessment framework and case study. Res. Transp. Econ. 2017, 64, 26–35. [Google Scholar] [CrossRef]
- Russo, F.; Comi, A. Urban Freight Transport Planning towards Green Goals: Synthetic Environmental Evidence from Tested Results. Sustainability 2016, 8, 381. [Google Scholar] [CrossRef] [Green Version]
- Bjørgen, A.; Seter, H.; Kristensen, T.; Pitera, K. The potential for coordinated logistics planning at the local level: A Norwegian in-depth study of public and private stakeholders. J. Transp. Geogr. 2019, 76, 34–41. [Google Scholar] [CrossRef]
- Leal, J.A.; Leal, J.A.; Sanchez-Diaz, I.; Browne, M.; Wojtowicz, J. State of the art and practice of urban freight management Part II: Financial approaches, logistics, and demand management. Transp. Res. Part A Policy Pract. 2020, 137, 383–410. [Google Scholar] [CrossRef]
- Bandeira, R.A.; D’Agosto, M.A.; Ribeiro, S.K.; Bandeira, A.P.; Goes, G.V. A fuzzy multi-criteria model for evaluating sustainable urban freight transportation operations. J. Clean. Prod. 2018, 184, 727–739. [Google Scholar] [CrossRef]
- Paddeu, D.; Aditjandra, P.T. Shaping Urban Freight Systems via a Participatory Approach to Inform Policy-Making. Sustainability 2020, 12, 441. [Google Scholar] [CrossRef] [Green Version]
- CIVITAS WIKI Consortium. Making Urban Freight Logistics More Sustainable, Civitas Policy Note. 2015. Available online: http://www.eltis.org/resources/tools/civitas-policy-note-making-urban-freight-logistics-more-sustainable (accessed on 8 October 2020).
- Rowe, G.; Wright, G. The Delphi technique as a forecasting tool: Issues and analysis. Int. J. Forecast. 1999, 15, 353–375. [Google Scholar] [CrossRef]
- Nathanail, E.; Mitropoulos, L.; Karakikes, I.; Adamos, G. Sustainability Framework for Assessing Urban Freight Transportation Measures. Logist. Sustain. Transp. 2018, 9, 16–36. [Google Scholar] [CrossRef] [Green Version]
- Ward, D. Stakeholder involvement in transport planning: Participation and power. Impact Assess. Proj. Apprais. 2001, 19, 119–130. [Google Scholar] [CrossRef]
- Katsela, K.; Browne, M. Importance of the Stakeholders’ Interaction: Comparative, Longitudinal Study of Two City Logistics Initiatives. Sustainability 2019, 11, 5844. [Google Scholar] [CrossRef] [Green Version]
- Aifandopoulou, G.; Xenou, E. Topic Guide. Sustainable Urban Logistics Planning. 2019. Available online: https://www.eltis.org/sites/default/files/sustainable_urban_logistics_planning_0.pdf (accessed on 15 October 2020).
- Akgün, E.Z.; Monios, J.; Rye, T.; Fonzone, A. Influences on urban freight transport policy choice by local authorities. Transp. Policy 2019, 75, 88–98. [Google Scholar] [CrossRef] [Green Version]
- De Marco, A.; Mangano, G.; Zenezini, G. Classification and benchmark of City Logistics measures: An empirical analysis. Int. J. Logist. Res. Appl. 2017, 21, 1–19. [Google Scholar] [CrossRef]
- Transport Decarbonisation Alliance. Zero Emission Urban Freight—A TDA Whitepaper on How to Reach Zero Emission Urban Freight by Uniting COUNTRIES, Cities/Regions and Companies. 2019. Available online: http://tda-mobility.org/wp-content/uploads/2019/05/TDA-Zero-Emission-Urban-Freight.pdf (accessed on 8 October 2020).
- ICLEI—Local Governments for Sustainability. ICLEI EcoLogistics Self-Monitoring Tool User Guide. 2020. Available online: https://sustainablemobility.iclei.org/wpdm-package/iclei-ecologistics-self-monitoring-tool-user-guide/ (accessed on 8 October 2020).
- Aditjandra, P.T.; Zunder, T. Developing a Multi-Dimensional Poly-Parametric Typology for City Logistics. In City Logistics 2; Taniguchi, E., Thompson, R.G., Eds.; Wiley: Hoboken, NJ, USA, 2018; pp. 143–163. [Google Scholar]
- Lebeau, P.; Macharis, C.; Van Mierlo, J.; Janjevic, M. Improving policy support in city logistics: The contributions of a multi-actor multi-criteria analysis. Case Stud. Transp. Policy 2018, 6, 554–563. [Google Scholar] [CrossRef]
- Macharis, C.; Milan, L.; Verlinde, S. A stakeholder-based multicriteria evaluation framework for city distribution. Res. Transp. Bus. Manag. 2014, 11, 75–84. [Google Scholar] [CrossRef]
- Kijewska, K.; Torbacki, W.; Iwan, S. Application of AHP and DEMATEL Methods in Choosing and Analysing the Measures for the Distribution of Goods in Szczecin Region. Sustainability 2018, 10, 2365. [Google Scholar] [CrossRef] [Green Version]
- Holmgren, J. Using Cost-Benefit Analysis to Evaluate City Logistics Initiatives: An Application to Freight Consolidation in Small- and Mid-Sized Urban Areas. In City Logistics 2; Taniguchi, E., Thompson, R.G., Eds.; Wiley: Hoboken, NJ, USA, 2018; pp. 271–290. [Google Scholar]
- Quak, H.; Balm, S.; Posthumus, B. Evaluation of City Logistics Solutions with Business Model Analysis. Procedia-Soc. Behav. Sci. 2014, 125, 111–124. [Google Scholar] [CrossRef] [Green Version]
- Brandon, P.R. Stakeholder participation for the purpose of helping ensure evaluation validity: Bridging the gap between collaborative and non-collaborative evaluations. Am. J. Eval. 1998, 19, 325–337. [Google Scholar] [CrossRef]
- Geist, M.R. Using the Delphi method to engage stakeholders: A comparison of two studies. Eval. Prog. Plan. 2010, 33, 147–154. [Google Scholar] [CrossRef]
- Markmann, C.; Darkow, I.L.; von der Gracht, H.A. A Delphi-based risk analysis—Identifying and assessing future challenges for supply chain security in a multi-stakeholder environment Technol. Forecast. Soc. Chang. 2013, 80, 1815–1833. [Google Scholar] [CrossRef]
- Melander, L.; Dubois, A.; Hedvall, K.; Lind, F. Future goods transport in Sweden 2050: Using a Delphi-based scenario analysis. Technol. Forecast. Soc. Chang. 2019, 138, 178–189. [Google Scholar] [CrossRef]
- Le Pira, M.; Inturri, G.; Ignaccolo, M.; Pluchino, A. Modelling consensus building in Delphi practices for participated transport planning. Transp. Res. Procedia 2017, 25, 3725–3735. [Google Scholar] [CrossRef]
- Cafiso, S.; Di Graziano, A.; Pappalardo, G. Using the Delphi method to evaluate opinions of public transport managers on bus safety. Saf. Sci. 2013, 57, 254–263. [Google Scholar] [CrossRef]
- Gumus, A.T. Evaluation of hazardous waste transportation firms by using a two step fuzzy-AHP and TOPSIS methodology. Expert Syst. Appl. 2009, 36, 4067–4074. [Google Scholar] [CrossRef]
- Von Der Gracht, H.A.; Darkow, I.-L. Scenarios for the logistics services industry: A Delphi-based analysis for 2025. Int. J. Prod. Econ. 2010, 127, 46–59. [Google Scholar] [CrossRef] [PubMed]
- Hasson, F.; Keeney, S. Enhancing rigour in the Delphi technique research. Technol. Forecast. Soc. Chang. 2011, 78, 1695–1704. [Google Scholar] [CrossRef]
- Gnatzy, T.; Warth, J.; Von Der Gracht, H.; Darkow, I.-L. Validating an innovative real-time Delphi approach—A methodological comparison between real-time and conventional Delphi studies. Technol. Forecast. Soc. Chang. 2011, 78, 1681–1694. [Google Scholar] [CrossRef]
- Aengenheyster, S.; Cuhls, K.; Gerhold, L.; Heiskanen-Schüttler, M.; Huck, J.; Muszynska, M. Real-Time Delphi in practice—A comparative analysis of existing software-based tools. Technol. Forecast. Soc. Chang. 2017, 118, 15–27. [Google Scholar] [CrossRef]
- Meyer, T. Future of Sustainable Transportation. 2018. Available online: http://fau-futurestudies.de/rtd/sft2/rtdelphi.php?token=5341624383 (accessed on 23 March 2018).
- Von Der Gracht, H.A.; Darkow, I.-L. The future role of logistics for global wealth—Scenarios and discontinuities until 2025. Foresight 2013, 15, 405–419. [Google Scholar] [CrossRef]
- Jiang, P.; Wang, Y.; Liu, C.; Hu, Y.-C.; Xie, J. Evaluating Critical Factors Influencing the Reliability of Emergency Logistics Systems Using Multiple-Attribute Decision Making. Symmetry 2020, 12, 1115. [Google Scholar] [CrossRef]
- Spickermann, A.; Grienitz, V.; von der Gracht, H. Heading towards a multimodal city of the future? Multi-stakeholder scenarios for urban mobility. Technol. Forecast. Soc. Chang. 2014, 89, 201–221. [Google Scholar] [CrossRef]
- Gill, F.J.; Leslie, G.D.; Grech, C.; Latour, J.M. Using a web-based survey tool to undertake a Delphi study: Application for nurse education research. Nurse Educ. Today 2013, 33, 1322–1328. [Google Scholar] [CrossRef] [PubMed]
- Warrens, M.J. Inequalities between multi-rater kappas. Adv. Data Anal. Classif. 2010, 4, 271–286. [Google Scholar] [CrossRef] [Green Version]
- Uebersax, J.S. Diversity of decision-making models and the measurement of interrater agreement. Psychol. Bull 1987, 101, 140–146. [Google Scholar] [CrossRef]
- Fleiss, J.L. Measuring Agreement between Two Judges on the Presence or Absence of a Trait. Biometrics 1975, 31, 651. [Google Scholar] [CrossRef]
- Conger, A.J. Integration and generalization of kappas for multiple raters. Psychol. Bull. 1971, 76, 378–382. [Google Scholar] [CrossRef]
- Saaty, T.L. The Analytical Hierarchy Process; McGraw-Hill: New York, NY, USA, 1980. [Google Scholar]
- Skulmoski, G.J.; Hartman, F.T.; Krahn, J. The Delphi Method for Graduate Research. J. Inf. Technol. Educ. Res. 2007, 6, 001–021. [Google Scholar] [CrossRef]
- Etzkowitz, H.; Leydesdorff, L. The dynamics of innovation: From National Systems and “Mode 2” to a Triple Helix of university–industry–government relations. Res. Policy 2000, 29, 109–123. [Google Scholar] [CrossRef]
- NOVELOG. Deliverable D3.2. Evaluation Tool; NOVELOG: Volos, Greece, 2016. [Google Scholar]
- Scientific American. Top 10 Emerging Technologies. 2017. Available online: https://www.scientificamerican.com/report/top-10-emerging-technologies-of-20171/ (accessed on 29 March 2019).
- Krey, M. Drones in Healthcare: Application in Swiss Hospitals. In Proceedings of the 51st Hawaii International Conference on System Sciences, Waikoloa, HI, USA, 3–6 January 2018. [Google Scholar]
- Devari, A.; Nikolaev, A.G.; He, Q. Crowdsourcing the last mile delivery of online orders by exploiting the social networks of retail store customers. Transp. Res. Part E Logist. Transp. Rev. 2017, 105, 105–122. [Google Scholar] [CrossRef]
- Reilly, D. Amazon Ponders Crowdsourcing Deliveries with ‘On My Way’ Program. Fortune. 2015. Available online: http://fortune.com/2015/06/16/amazon-crowd-source/ (accessed on 1 August 2018).
- Leal, J.A.; Leal, J.A.; Sánchez-Diaz, I.; Browne, M.; Wojtowicz, J. State of the art and practice of urban freight management. Transp. Res. Part A Policy Pract. 2020, 137, 360–382. [Google Scholar] [CrossRef]
- Papoutsis, K.; Nathanail, E. Facilitating the Selection of City Logistics Measures through a Concrete Measures Package: A Generic Approach. Transp. Res. Procedia 2016, 12, 679–691. [Google Scholar] [CrossRef] [Green Version]
- Karakikes, I.; Nathanail, E.; Savrasovs, M. Techniques for Smart Urban Logistics Solutions’ Simulation: A Systematic Review. In Advances on P2P, Parallel, Grid, Cloud and Internet Computing; Springer: Berlin, Germnay, 2019; pp. 551–561. [Google Scholar]
- C-LIEGE. Deliverable 4.2 C-Liege Toolbox for the Establishment of the City Logistics; C-LIEGE: Rome, Italy, 2012. [Google Scholar]
- Hirschhorn, F. Reflections on the application of the Delphi method: Lessons from a case in public transport research. Int. J. Soc. Res. Methodol. 2019, 22, 309–322. [Google Scholar] [CrossRef]
- Kezar, A.; Maxey, D. The Delphi technique: An untapped approach of participatory research. Int. J. Soc. Res. Methodol. 2014, 19, 143–160. [Google Scholar] [CrossRef]
- Jones, G.C. A Delphi Evaluation of Agreement between Organizations. In The Delphi Method. Techniques and Applications; Linstone, H.A., Turoff, M., Helmer, O., Eds.; Addison-Wesley Publishing Company, Inc.: Reading, MA, USA, 2002; pp. 155–161. Available online: https://web.njit.edu/~turoff/pubs/delphibook/ch3b4.pdf (accessed on 22 September 2020).
- Stuart, A.; Siegel, S. Non-Parametric Statistics for the Behavioral Sciences. Economics 1957, 24, 178. [Google Scholar] [CrossRef]
- Park, H.M. Comparing Group Means: T-Test and One-Way ANOVA Using STATAM, SAS, R, and SPSS; Working Paper; The University Information Technology Services (UITS) Center for Statistical and Mathematical Computing, Indiana University: Bloomington, IN, USA, 2009. [Google Scholar]
- Holey, E.A.; Feeley, J.L.; Dixon, J.; Whittaker, V.J. An exploration of the use of simple statistics to measure consensus and stability in Delphi studies. BMC Med. Res. Methodol. 2007, 7, 52. [Google Scholar] [CrossRef] [Green Version]
- CenSensus. 2019. Available online: http://censensus.tk (accessed on 7 July 2019).
- Hall, D.A.; Smith, H.; Heffernan, E.; Fackrell, K. Core Outcome Measures in Tinnitus International Delphi (COMiT’ID) Research Steering Group Recruiting and retaining participants in e-Delphi surveys for core outcome set development: Evaluating the COMiT’ID study. PLoS ONE 2018, 13, e0201378. [Google Scholar] [CrossRef] [Green Version]
- Cortina, J.M. What is coefficient alpha? An examination of theory and applications. J. Appl. Psychol. 1993, 78, 98–104. [Google Scholar] [CrossRef]
- Elsayed, M.; Mohamed, M. The impact of airspace regulations on unmanned aerial vehicles in last-mile operation. Transp. Res. Part D Transp. Environ. 2020, 87, 102480. [Google Scholar] [CrossRef]
- Palmer, A. Amazon Wins FAA Approval for Prime Air Drone Delivery Fleet. 2020. Available online: https://www.cnbc.com/2020/08/31/amazon-prime-now-drone-delivery-fleet-gets-faa-approval.html (accessed on 14 October 2020).
- Macário, R.; Marques, C.F. Transferability of sustainable urban mobility measures. Res. Transp. Econ. 2008, 22, 146–156. [Google Scholar] [CrossRef]
- Slade, S.C.; Dionne, C.E.; Underwood, M.; Buchbinder, R. Standardised method for reporting exercise programmes: Protocol for a modified Delphi study. BMJ Open 2014, 4, e006682. [Google Scholar] [CrossRef] [Green Version]
- Diamond, I.R.; Grant, R.C.; Feldman, B.M.; Pencharz, P.B.; Ling, S.C.; Moore, A.M.; Wales, P.W. Defining consensus: A systematic review recommends methodologic criteria for reporting of Delphi studies. J. Clin. Epidemiol. 2014, 67, 401–409. [Google Scholar] [CrossRef] [PubMed]
- Rousseeuw, J.P.; Croux, C. Alternatives to the Median Absolute Deviation. J. Am. Stat. Assoc. 1993, 88, 1273–1283. [Google Scholar] [CrossRef]
- Martilla, J.A.; James, J.C. Importance-performance analysis. J. Mark. 1977, 41, 77–79. [Google Scholar] [CrossRef]
- Dwyer, L.; Celbar, L.K.; Edwards, D.; Mihalic, T. Fashioning a destination tourism future: The case of Slovenia. Tour. Manag. 2012, 33, 305–316. [Google Scholar] [CrossRef]
- Oh, H. Revisiting importance–Performance analysis. Tour. Manag. 2001, 22, 617–627. [Google Scholar] [CrossRef]
- Bacon, D.R. A Comparison of Approaches to Importance-Performance Analysis. Int. J. Mark. Res. 2003, 45, 1–15. [Google Scholar] [CrossRef]
- Azzopardi, E.; Nash, R.J. A critical evaluation of importance–performance analysis. Tour. Manag. 2013, 35, 222–233. [Google Scholar] [CrossRef]
- Sever, I. Importance-performance analysis: A valid management tool? Tour. Manag. 2015, 48, 43–53. [Google Scholar] [CrossRef]
- Tarrant, M.A.; Smith, E.K. The use of a modified importance-performance framework to examine visitor satisfaction with attributes of outdoor recreation settings. Manag. Leis. 2002, 7, 69–82. [Google Scholar] [CrossRef]
- Wu, H.-H.; Shieh, J.-I. The development of a confidence interval-based importance–performance analysis by considering variability in analyzing service quality. Expert Syst. Appl. 2009, 36, 7040–7044. [Google Scholar] [CrossRef]
- Dias, P.A.P.; Yoshizaki, H.T.Y.; Belfiore, P.; Vieira, J.G.V. Daytime or Overnight Deliveries? Perceptions of Drivers and Retailers in São Paulo City. Sustainability 2019, 11, 6316. [Google Scholar] [CrossRef] [Green Version]
- Holguín-Veras, J.; Encarnación, T.; Gonzalez-Calderon, C.A.; Winebrake, J.; Wang, C.; Kyle, S.; Herazo-Padilla, N.; Kalahasthi, L.; Adarme, W.; Cantillo, V.; et al. Direct impacts of off-hour deliveries on urban freight emissions. Transp. Res. Part D Transp. Environ. 2018, 61, 84–103. [Google Scholar] [CrossRef]
- Aurambout, J.-P.; Gkoumas, K.; Ciuffo, B. Last mile delivery by drones: An estimation of viable market potential and access to citizens across European cities. Eur. Transp. Res. Rev. 2019, 11, 30. [Google Scholar] [CrossRef] [Green Version]
- Giuliano, G.; O’Brien, T.; Dablanc, L.; Holliday, K.; National Cooperative Freight Research Program; Transportation Research Board. Synthesis of Freight Research in Urban Transportation Planning; Transportation Research Board: Washington, DC, USA, 2013. [Google Scholar]
Figure 1.
Flowchart of methodological approach.

Figure 2.
Effectiveness—Consensus Importance Performance (IPA) map.

Table 1.
Matching and ranking Urban Freight Transport (UFT) solutions to clusters.
| Clusters and Solutions | Times of Detection |
|---|---|
| 1. New distribution and logistics models | |
| City lockers 1 | 2 |
| Off-hours deliveries 1 | 2 |
| Home deliveries system | 2 |
| Businesses recognition scheme | 2 |
| E-commerce system for small shops | 2 |
| Reverse logistics integration into supply chain | 1 |
| Public transport indirect promotion for shopping | 0 |
| 2. Capacity sharing | |
| Multi-users lanes 1 | 1 |
| Public transport for freight | 0 |
| 3. Infrastructure development and vehicle characteristics | |
| Urban consolidation centres 1 | 11 |
| Electric vehicles diffusion in businesses (zero-emission transport) 1 | 8 |
| Cargo bikes for B2B and B2C | 4 |
| Enforcement and ITS adoption for control and traffic management | 4 |
| Urban planning measures | 1 |
| 4. Access control | |
| Low emission zones 1 | 8 |
| Trans-shipment facilities | 2 |
| Access by load factor | 2 |
| 5. Regulations on enabling activities | |
| Loading/unloading areas and parking 1 | 13 |
| Multimodality for urban freight | 9 |
| Freight travel plans | |
| 6. Enforcement, routing optimization, and training | |
| ITS for freight monitoring and planning/routing 1 | 23 |
| Harmonization and simplification of city logistics rules | 1 |
| 7. Emerging solutions | |
| Crowdsourcing 1 | 2 |
| Autonomous vehicles | 2 |
| Drone deliveries 1 | 0 |
| 3D-printing | 0 |
1 Solutions which were finally considered in the Delphi survey.
Table 2.
Reported characteristics of Delphi participants.
| Round 1 (n = 184) | Round 2 (n = 97) | |
|---|---|---|
| Stakeholder category | ||
| Supply Chain stakeholders (SC) | 12.5% | 8.2% |
| Public Authorities (PA) | 10.9% | 12.4% |
| Other stakeholders (O) | 76.6% | 79.4% |
| Cities of residency | ||
| Athens (Greece) | 9.2% | 9.3% |
| Thessaloniki (Greece) | 6.5% | 8.2% |
| Volos (Greece) | 5.4% | 4.1% |
| Rome (Italy) | 3.3% | 1.0% |
| Delft (the Netherlands) | 2.7% | 2.0% |
| Lisbon (Portugal) | 2.2% | 1.0% |
| 100 other cities (less than 2%) | 70.7% | 74.4% |
| Countries of residency | ||
| Greece | 26.6% | 27.8% |
| Italy | 12.0% | 10.3% |
| The Netherlands | 6.0% | 6.2% |
| USA | 4.9% | 4.1% |
| England | 4.3% | 3.1% |
| Belgium | 3.8% | 2.1% |
| Germany | 3.8% | 3.1% |
| Spain | 3.3% | 4.1% |
| Austria, Portugal | 2.7% | 2.1% |
| 33 other countries (less than 2%) | 29.9% | 37.1% |
| Continents of residency | ||
| Europe | 81% | 82.5% |
| Asia | 8.7% | 8.2% |
| North America | 5.4% | 4.1% |
| Oceania | 2.2% | 4.1% |
| South America and Africa | 2.7% | 1.0% |
Table 3.
Second round summary rating.
| Average Median | Impact Areas | Cronbach’s Alpha | ||||||
|---|---|---|---|---|---|---|---|---|
| Sustainability Dimensions | Drivers | |||||||
| EE | E | TM | S | PMM | SA | UU | ||
| How effective is the solution below if it was to be implemented in your city of residence? | ||||||||
| ITS for freight monitoring and planning/routing (Cluster: Enforcement, routing optimization, and training) | ||||||||
| 3.714 | 4 | 4 | 4 | 4 | 3 | 4 | 3 | 0.885 |
| Electric vehicles diffusion in businesses (Cluster: Infrastructure development and vehicle characteristics) | ||||||||
| 3.571 | 4 | 4 | 3 | 4 | 3 | 4 | 3 | 0.827 |
| City lockers (Cluster: New distribution and logistics models) | ||||||||
| 3.429 | 4 | 4 | 4 | 3 | 3 | 3 | 3 | 0.867 |
| Off-hours deliveries (Cluster: New distribution and logistics models) | ||||||||
| 3.429 | 4 | 4 | 4 | 3 | 3 | 3 | 3 | 0.870 |
| Urban Consolidation Centers (Cluster: Infrastructure development and vehicle characteristics) | ||||||||
| 3.429 | 4 | 4 | 4 | 3 | 3 | 3 | 3 | 0.883 |
| Low emission zones (Cluster: Access control) | ||||||||
| 3.429 | 4 | 4 | 3 | 4 | 3 | 3 | 3 | 0.849 |
| (Un)-Loading areas and parking (Cluster: Regulations on enabling activities) | ||||||||
| 3.286 | 4 | 3 | 4 | 3 | 3 | 3 | 3 | 0.861 |
| Multi-user lanes (Cluster: Capacity sharing) | ||||||||
| 3.143 | 3 | 3 | 4 | 3 | 3 | 3 | 3 | 0.898 |
| Crowdsourcing (Cluster: Emerging solutions) | ||||||||
| 3.143 | 3 | 4 | 3 | 3 | 3 | 3 | 3 | 0.887 |
| Drone deliveries (Cluster: Emerging solutions) | ||||||||
| 2.571 | 3 | 3 | 3 | 3 | 2 | 2 | 2 | 0.881 |
Note: “EE” denotes Economy and Energy, “E” Environment, “TM” Transport and Mobility, “S” Society, “PMM” Policy and Measure Maturity, “SA” Social Acceptance, “UU” User Uptake.
Table 4.
Convergence measured by IQR.
| Round | Impact Areas | Consensus | ||||||
|---|---|---|---|---|---|---|---|---|
| Sustainability Dimensions | Drivers | |||||||
| EE | E | TM | S | PMM | SA | UU | ||
| How effective is the solution below if it was to be implemented in your city of residence? | ||||||||
| ITS for freight monitoring and planning/routing (Cluster: Enforcement, routing optimization, and training) | ||||||||
| Round 1 | 1.00 | 1.00 | 2.00 | 1.00 | 2.00 | 1.00 | 1.00 | 71.4% |
| Round 2 | 1.00 | 1.00 | 2.00 | 1.00 | 2.00 | 1.00 | 1.00 | 71.4% |
| Electric vehicles diffusion in businesses (Cluster: Infrastructure development and vehicle characteristics) | ||||||||
| Round 1 | 1.00 | 1.00 | 1.00 | 1.00 | 2.00 | 1.00 | 1.25 | 71.4% |
| Round 2 | 1.00 | 1.00 | 1.00 | 1.00 | 1.00 | 1.00 | 1.00 | 100% |
| City lockers (Cluster: New distribution and logistics models) | ||||||||
| Round 1 | 1.00 | 1.00 | 1.00 | 1.00 | 2.00 | 2.00 | 2.00 | 57.1% |
| Round 2 | 1.00 | 1.00 | 1.00 | 1.00 | 2.00 | 1.25 | 2.00 | 57.1% |
| Off-hours deliveries (Cluster: New distribution and logistics models) | ||||||||
| Round 1 | 1.25 | 1.25 | 2.00 | 1.00 | 2.00 | 2.00 | 2.00 | 14.2% |
| Round 2 | 1.00 | 1.00 | 2.00 | 1.00 | 2.00 | 2.00 | 2.00 | 42.9% |
| Urban Consolidation Centers (Cluster: Infrastructure development and vehicle characteristics) | ||||||||
| Round 1 | 1.00 | 1.00 | 1.00 | 1.00 | 2.00 | 1.00 | 2.00 | 71.4% |
| Round 2 | 1.00 | 1.00 | 1.00 | 1.00 | 2.00 | 1.00 | 2.00 | 71.4% |
| Low emission zones (Cluster: Access control) | ||||||||
| Round 1 | 1.00 | 1.00 | 1.00 | 1.00 | 2.00 | 2.00 | 2.00 | 57.1% |
| Round 2 | 1.00 | 1.00 | 1.00 | 1.00 | 2.00 | 2.00 | 2.00 | 57.1% |
| (Un)-Loading areas and parking (Cluster: Regulations on enabling activities) | ||||||||
| Round 1 | 1.00 | 1.00 | 1.00 | 1.00 | 2.00 | 2.00 | 2.00 | 57.1% |
| Round 2 | 1.00 | 1.00 | 1.00 | 1.00 | 2.00 | 2.00 | 2.00 | 57.1% |
| Multi-user lanes (Cluster: Capacity sharing) | ||||||||
| Round 1 | 1.00 | 2.00 | 1.00 | 2.00 | 1.00 | 1.00 | 2.00 | 57.1% |
| Round 2 | 1.00 | 2.00 | 1.00 | 2.00 | 1.00 | 1.00 | 2.00 | 57.1% |
| Crowdsourcing (Cluster: Emerging solutions) | ||||||||
| Round 1 | 1.00 | 1.00 | 2.00 | 2.00 | 1.00 | 2.00 | 1.00 | 57.1% |
| Round 2 | 1.00 | 1.00 | 1.00 | 2.00 | 1.00 | 1.00 | 1.00 | 71.4% |
| Drone deliveries (Cluster: Emerging solutions) | ||||||||
| Round 1 | 2.00 | 2.00 | 2.00 | 2.00 | 2.00 | 1.00 | 1.25 | 14.2% |
| Round 2 | 2.00 | 2.00 | 1.00 | 2.00 | 2.00 | 1.00 | 1.00 | 42.9% |
Note: “EE” denotes Economy and Energy, “E” Environment, “TM” Transport and Mobility, “S” Society, “PMM” Policy and Measure Maturity, “SA” Social Acceptance, “UU” User Uptake.
Publisher’s Note: MDPI stays neutral with regard to jurisdictional claims in published maps and institutional affiliations. |
© 2020 by the authors. Licensee MDPI, Basel, Switzerland. This article is an open access article distributed under the terms and conditions of the Creative Commons Attribution (CC BY) license (http://creativecommons.org/licenses/by/4.0/).
Share and Cite
MDPI and ACS Style
Karakikes, I.; Nathanail, E. Using the Delphi Method to Evaluate the Appropriateness of Urban Freight Transport Solutions. Smart Cities 2020, 3, 1428-1447. https://0-doi-org.brum.beds.ac.uk/10.3390/smartcities3040068
AMA Style
Karakikes I, Nathanail E. Using the Delphi Method to Evaluate the Appropriateness of Urban Freight Transport Solutions. Smart Cities. 2020; 3(4):1428-1447. https://0-doi-org.brum.beds.ac.uk/10.3390/smartcities3040068
Chicago/Turabian StyleKarakikes, Ioannis, and Eftihia Nathanail. 2020. "Using the Delphi Method to Evaluate the Appropriateness of Urban Freight Transport Solutions" Smart Cities 3, no. 4: 1428-1447. https://0-doi-org.brum.beds.ac.uk/10.3390/smartcities3040068