
A Smart City Is a Safe City: Analysis and Evaluation of the State of Crime and Safety in Polish Cities

1
Faculty of Mining, Safety Engineering and Industrial Automation, Silesian University of Technology, 44-100 Gliwice, Poland
2
Faculty of Organization and Management, Silesian University of Technology, 44-100 Gliwice, Poland
*
Authors to whom correspondence should be addressed.
Smart Cities 2023, 6(6), 3359-3392; https://0-doi-org.brum.beds.ac.uk/10.3390/smartcities6060149
Submission received: 22 September 2023
/
Revised: 14 November 2023
/
Accepted: 26 November 2023
/
Published: 29 November 2023
(This article belongs to the Section Applied Science and Humanities for Smart Cities)
Abstract
:The concept of a smart city is based on the extensive multidimensional use of information and communication technologies to create the most favorable living conditions for residents and visitors. It is also important to create favorable conditions for economic activity while respecting the environment. One of the most important dimensions of this concept is security in the broadest sense, particularly that which concerns urban residents. This article addresses this subject by analyzing crime and determining the state of safety in 16 Polish provincial cities between 2013–2022. The measure of this state was chosen to be a set of indicators characterizing a number of registered criminal and economic offenses in the studied cities. On this basis, values of the indices of the dynamics of change for these offenses in individual cities in the analyzed period were determined. In the next stage, the number of offenses was compared to the number of residents of the cities under study and the indices of concentration for total offenses (LQT) and for individual types of offenses (LQn) were determined. Based on these results, the studied cities were divided into four concentration levels. Afterward, these results were used for a multi-criteria analysis of the safety of studied cities, which was carried out using the TOPSIS method. The calculated values of the safety index (Pi) formed the basis for creating a ranking and specifying security levels of studied cities. The results indicate a wide variation among the cities in terms of safety levels. Gdańsk, Bydgoszcz, Olsztyn and Zielona Góra were found to be the safest cities, while Szczecin was found to be the least safe. The methodology developed and the results obtained show the validity of conducting comparative research in areas relevant to the implementation of the smart cities concept. The knowledge gained can be used to build strategies and conduct policies with regard to improving safety in cities, especially those aspiring to be smart cities.
1. Introduction
In today’s increasingly urbanizing world, cities are becoming the most important areas for people to live in [1,2]. They are concentrated, compact and densely populated spaces, interconnected not only in terms of area but increasingly also in terms of their functionality [3,4]. At present, more than 56% of the world’s population lives in cities, and this percentage is projected to rise to more than 66% by 2050 [5]. The process of urbanization is global and affects virtually all regions of the world. It is also occurring in the countries of the European Union, including Poland, where urban residents currently account for more than 60% of the population of the entire country [6]. This state of affairs as well as forecasts projecting further increases in the level of urbanization show that cities that are already facing many problems will have to confront even more of them. These problems will arise from ongoing demographic changes, aging populations, the need for adequate housing infrastructure, mobility, environmental protection, health care and the need to ensure the safety of residents and urban infrastructure in the broadest sense.
Therefore, one of the key aspects affecting living conditions in cities is security, which, at the same time, belongs to one of the basic needs of every human being (Level II needs of Maslow’s pyramid [7]). Lack of a sense of safety or insecurity, fear and various types of threats negatively affect the overall quality of life of people, especially in modern cities. Every citizen, regardless of age, gender, status or social position or ethnicity wants to feel safe in the place where he or she lives, raises children, works, studies or rests. Safety, therefore, is one of the main and basic needs of human beings and is crucial for their existence and development [8,9].
Safety itself can be understood very differently, and its division or categories cover different aspects of people’s lives. Safety in cities, due to their diversity and elaborate structure, is a very complex problem involving various aspects of life. One such very important area related to safety is issues of public order and the safety of citizens, including their exposure to various types of offenses.
Indeed, it is clear that cities are among the areas particularly vulnerable to offenses against property, life and health [10,11]. Crime, violence and vandalism have been the most common causes of insecurity in cities for years [12,13,14]. Urban security issues are now one of the main social problems determining the comfort of life in highly urbanized areas. Criminal activities cause states of insecurity, often resulting in loss of health and/or life, as well as significant property damage. This state of affairs results in high crime rates and, consequently, a lack of a sense of safety, very negatively affecting the quality of life in the city, the local economy and social relations in general. Reducing crime and consequently improving safety are now becoming priorities for building smart and citizen-friendly cities [15,16,17]. The smart city concept itself, in terms of the use of modern information and communication solutions, is also of great importance for improving urban security and reducing threats and reducing the risk of dangerous incidents [18,19,20].
Indeed, modern cities, to an increasing extent, are striving to become smart cities. For this reason, they are increasingly willing to undertake activities oriented toward sustainable development and the needs of residents, using innovative solutions and improving and applying new technologies. On the other hand, management processes in cities are being carried out with increasing public participation and involvement, for convenient and efficient infrastructure, with respect for the environment [21,22,23].
One of the key areas of implementation of the smart city concept is the Smart Living dimension—referring to a high quality of life in a safe and friendly urban environment with assured access to educational, cultural, social and recreational services [24,25,26]. The increasing inclusion of issues relating to the broader conditions of urban life and greater involvement of residents indicates that the smart cities concept has become very much humanized since its presentation [27,28,29,30]. This direction of change seems obvious and very logical. This is because it stems from the need to create the most favorable living and working conditions for residents and all other stakeholders, while respecting the environment and utilizing the social potential of residents [31,32]. The introduction of this concept makes modern cities strive to be smart and sustainable and become more ecological and humane [33].
Throughout this process of change and building smart and open cities, issues related to the safety of citizens and the activities carried out in these cities have a key place. This is because safety is one of the key dimensions (areas) that have a huge impact on living conditions in a city.
With this in mind, this article presents the results of a study of crime and safety ratings in 16 Polish provincial cities that are or aspire to be smart cities. Currently, in Poland, the cities that are considered smart cities in international rankings are Warsaw, Kraków and Wrocław [34,35]. The other cities included in this study are, therefore, among those aspiring to have this status.
Thus, when talking about a smart city, it is impossible not to refer to safety, which is also included in the world rankings. Its measure is provided by various types of indicators that characterize this area of smart city existence. Such an indicator is, for example, crime rate, taken into account in the IESE rankings, the Cities in Motion Index [35] and smart cities—a ranking of European medium-sized cities [36], among other parameters.
The purpose of our research, the results of which are presented in this paper, was to assess safety in 16 Polish provincial cities, based on a set of indicators characterizing criminal and economic offenses registered in these cities. In order to achieve this goal and at the same time provide an opportunity for a broader analysis of the problem under study, taking into account the size of the cities under study, the following two research questions were formulated:
- (1)
- What was the change dynamics in terms of studied offenses in 16 Polish cities between 2013–2022 and what was their concentration in relation to their population?
- (2)
- What was the overall level of safety and the specific levels of concentration of offenses in relation to the studied population?
These questions clarify the subject of our research, organize and direct the work carried out and enable a clear assessment of the cities under study with a discussion of the results obtained as well as the formulation of final conclusions.
The TOPSIS method was used to determine an overall level of safety of the analyzed cities. On the other hand, to assess the dynamics of change, in terms of the studied offenses and their concentration in relation to the population of the cities, the dynamics of change index and the location quotients crime index were used, respectively.
Considering the role and importance of man in the modern world and the progressive anthropocentrism of the smart cities concept, this paper refers to the actual security status of Polish cities in a 10-year perspective. Most of these cities aspire to become smart, which fully justifies taking up this research topic. After all, the safety of citizens is the basis for building a modern and knowledge-based society. Urbanization processes and the concepts of smart cities and sustainable development are forcing the development and improvement of all dimensions necessary for existence and development. Safety is one of the most important of these dimensions.
The research conducted and the results obtained should significantly enrich the knowledge of the social aspects of modern cities in Poland, as one of the larger countries of the EU. Undoubtedly, the developed methodology, using various methods and analytical tools, and the research conducted on its basis, together with our findings, represent a new and original approach to the study of citizen safety in cities.
2. Literature Studies
Topics related to smart cities and various aspects related to the implementation of the smart city concept are increasingly being addressed by researchers. The literature review presented here addresses only the most important issues related to the implementation of the smart cities concept and safety in these cities.
2.1. From Smart City to Human Smart City
The beginning of the smart city concept goes back to the 1990s, when the Smart Growth concept emerged, pointing out the possibilities of transforming urban areas into more livable environments that improve the quality of life and are climate-friendly [37,38,39,40,41].
The very dynamic development of new technologies, especially in the area of information and communication technologies, has caused the Smart Growth concept to definitely expand its scope beyond urban aspects. The result of these changes is the emergence of the concept of a city that uses information and communication technologies and related pro-development technologies as a way to improve the efficiency of the operation of these cities, improving the quality of life of residents while taking into account the needs of future generations. Thus, the concept includes a comprehensive approach to the development and existence of cities, taking into account economic, social, environmental and cultural issues [42]. Originally, the idea was to integrate systems related to services that support life in urban areas, combining human and technological capital and seeking ways to improve the relationship between a functioning city and its residents [43].
Today, the concept of smart cities has a wide range of definitions, depending on the approach of those formulating it and the area to which it applies [44]. The unifying feature of these various terms is that the concept combines technology and knowledge, with the aim of building social ties, creating smart infrastructure or improving transportation systems to improve the lives of city dwellers [45]. Thus, the concept aims to create friendly and environmentally unobtrusive living conditions in cities using new technologies.
Related to these areas is the research that is being conducted on the implementation of the concept. Currently, two main directions of this research can be distinguished. The first concerns the development and application of new technologies in cities, and the second is related to human and social capital, governance and the environment (socio-environmental issues). It can also be said that the original technocentrism of smart cities has transformed into anthropocentrism. The result of these changes, of an evolutionary nature, is the concept of the Human Smart City [46,47,48,49,50].
This concept presents a holistic approach to the process of meeting the needs of urban communities, taking into account the equality of all groups that make up the community and their involvement in the management of the city [51,52,53].
The Human Smart City is, therefore, an improvement on the smart city concept, incorporating a broader and more innovative and active approach by residents to the organization and management of cities. The goal of these activities is to use the creativity and potential of residents in the process of creating a healthy, happy and safe area for citizens and the environment for their existence.
The smart cities concept itself distinguishes the following six areas that relate holistically to the quality and conditions of life in modern cities:
- (1)
- Smart People—refers to an open society, i.e., city residents who have access to smart solutions offered by the city and are able to use them, ready to improve their skills, learn, cooperate and be creative and involved in the life of the city. This society should rationally and consciously manage available resources for the benefit of present and future generations [54,55,56,57];
- (2)
- Smart Living—defines a high quality of life in a safe and friendly urban environment with universal access to public services and educational, cultural, health and social infrastructure [25];
- (3)
- Smart Mobility—defines a transport system in cities that is both safe for people and goods and environmentally friendly; the system provides all current and future stakeholders with fast, convenient, hassle-free and efficient movement by various means of transport (in particular, this applies to urban mass public transport using ecological rolling stock) [58,59];
- (4)
- Smart Environment—includes the use of environmental resources by residents in a sustainable manner, the use of renewable energy sources and concern for the quality of all environmental components, including water, air and biodiversity. It also includes environmental education of the urban community [60,61];
- (5)
- (6)
2.2. Public Safety in the Concept of Smart Cities
Modern cities are densely populated cities, with both positive and negative consequences associated with this condition. In many cities around the world, one of the most serious problems is ensuring the safety of people in those cities. The urban environment is conducive to the development of crime, which often results in a reduction in this safety [69]. Among the main reasons for the increase in crime in cities are disparities in the income of residents and differences in education or cultural backgrounds which, in the final stage, result in the appearance of social inequality [70,71]. The presence of racial, religious and ethnic minorities and related integration and economic conflicts as well as the intensity and anonymity of social interactions and low levels of social control can also be reasons for the increase in crime. This process is also exacerbated by a high level of social disorganization [70,72,73], a significant number of single-parent and dysfunctional families [70,74], the presence of numerous events, facilities and areas that attract crime [70,75] and the establishment of contacts between criminals, leading to the formation of gangs and other forms of organized crime [70,76].
Another important aspect, very unfavorable to urban development, is the considerable peculiar attractiveness of potential objects and victims of crime [77], the high position of the city in the settlement system causing an increase in crime in its area [78,79] and the social exclusion of individuals and entire groups [80].
Factors that reduce crime and, thus, increase the level of security are low unemployment, high wages, well-functioning city surveillance, gated/guarded neighborhoods, and high efficiency of police and law enforcement [81].
The role and importance of safety for urban residents are, therefore, considerable. In many cases, in cities with a low level of security, a sense of danger becomes a reason for residents to move [82].
As Kourtit et al. [82] point out, from an urban–sociological and humanistic–geographical perspective, that cities constitute a base of connective social capital for which safety is crucial. This base must meet a number of conditions for the well-being of urban residents for whom safety issues are important. Increasingly, safety and absence/low crime are seen as a sine qua non for the attractiveness of cities.
When considering the role and importance of safety in modern cities, the concepts of not only smart cities but also of healthy and safe cities (smart, safe and sound cities), so-called 3-S cities, have become increasingly popular in recent years.
These developments show the evolution and enrichment of the smart cities concept, originally oriented primarily to technologies that support urban life, which is now expanding its areas of influence, increasingly appreciating the roles and importance of humans in urban processes. It can be assumed that smart cities and aspiring smart cities are just some kind of tool that enables humans to achieve higher goals in terms of life and sustainability [82,83]. These higher goals, however, can only be achieved if one of the primary needs [84] can be met, which is the need for security, strongly associated with crime, among other things.
When referring to crime, which is very important in assessing the security of cities, it should be noted that different countries’ legal systems define and interpret crimes in slightly different ways [85]. In general, crime is a set of acts prohibited by the legal acts in force in a given country under penalty, with these acts being committed in the area of a given territorial unit at a given time. It is, therefore, obvious that crime itself, as a prohibited and socially harmful act, is a threat to the existing legal order. Therefore, for each city, the number of offenses registered in it and their nature are very important and have a great impact on public opinion in assessing security. In addition to the number of offenses registered in a given city, detection rates are also very important and can definitely be helped by intelligent ITC solutions or social activism [86].
The smart cities concept, therefore, makes it possible to create safe cities that enable crime reduction through the integration of various technologies, in order to create a safe environment for residents to live in and achieve preparedness and rapid response to threats or emergencies that occur [40]. To ensure safety, city authorities can use the latest advanced technology, which should help prevent, detect, investigate and reduce the impact of various incidents, including crime, riots, accidents or natural disasters [87]. However, as Neumannová points out [88], technology alone (no matter how clever and well configured it may be) contributes only partially to reducing crime or preventing various dangerous events. In this context, it is also pointed out that for smart cities to reduce crime, technological solutions alone will not be sufficient [89,90]. It is necessary to use, for example, the concept of Crime Prevention Through Environmental Design (CPTED), which broadly describes a set of principles and actions that contribute to reducing certain types of crime. The concept is based on Crime Prevention Through Urban Design and focuses on creating safe public spaces in cities and reducing criminal opportunities [91].
An analysis of the literature indicates that safety issues are crucial to the well-being of city residents. Thus, city authorities and residents themselves, in accordance with the concepts of smart cities and Human Smart Cities, should strive to minimize crime, and their cooperation in this regard is undoubtedly necessary to ensure safety. Thus, taking up the subject of analyzing crime in cities over a dozen years becomes as legitimate as possible and gives a picture of the changes that are taking place in these cities in this regard.
Conducting such an analysis for Poland’s provincial cities should significantly enrich knowledge on building smart and safe cities in Poland.
3. Research Methodology
This section presents the research methodology developed and applied and discusses the research area along with the characteristics of the analytical methods used.
3.1. Research Area
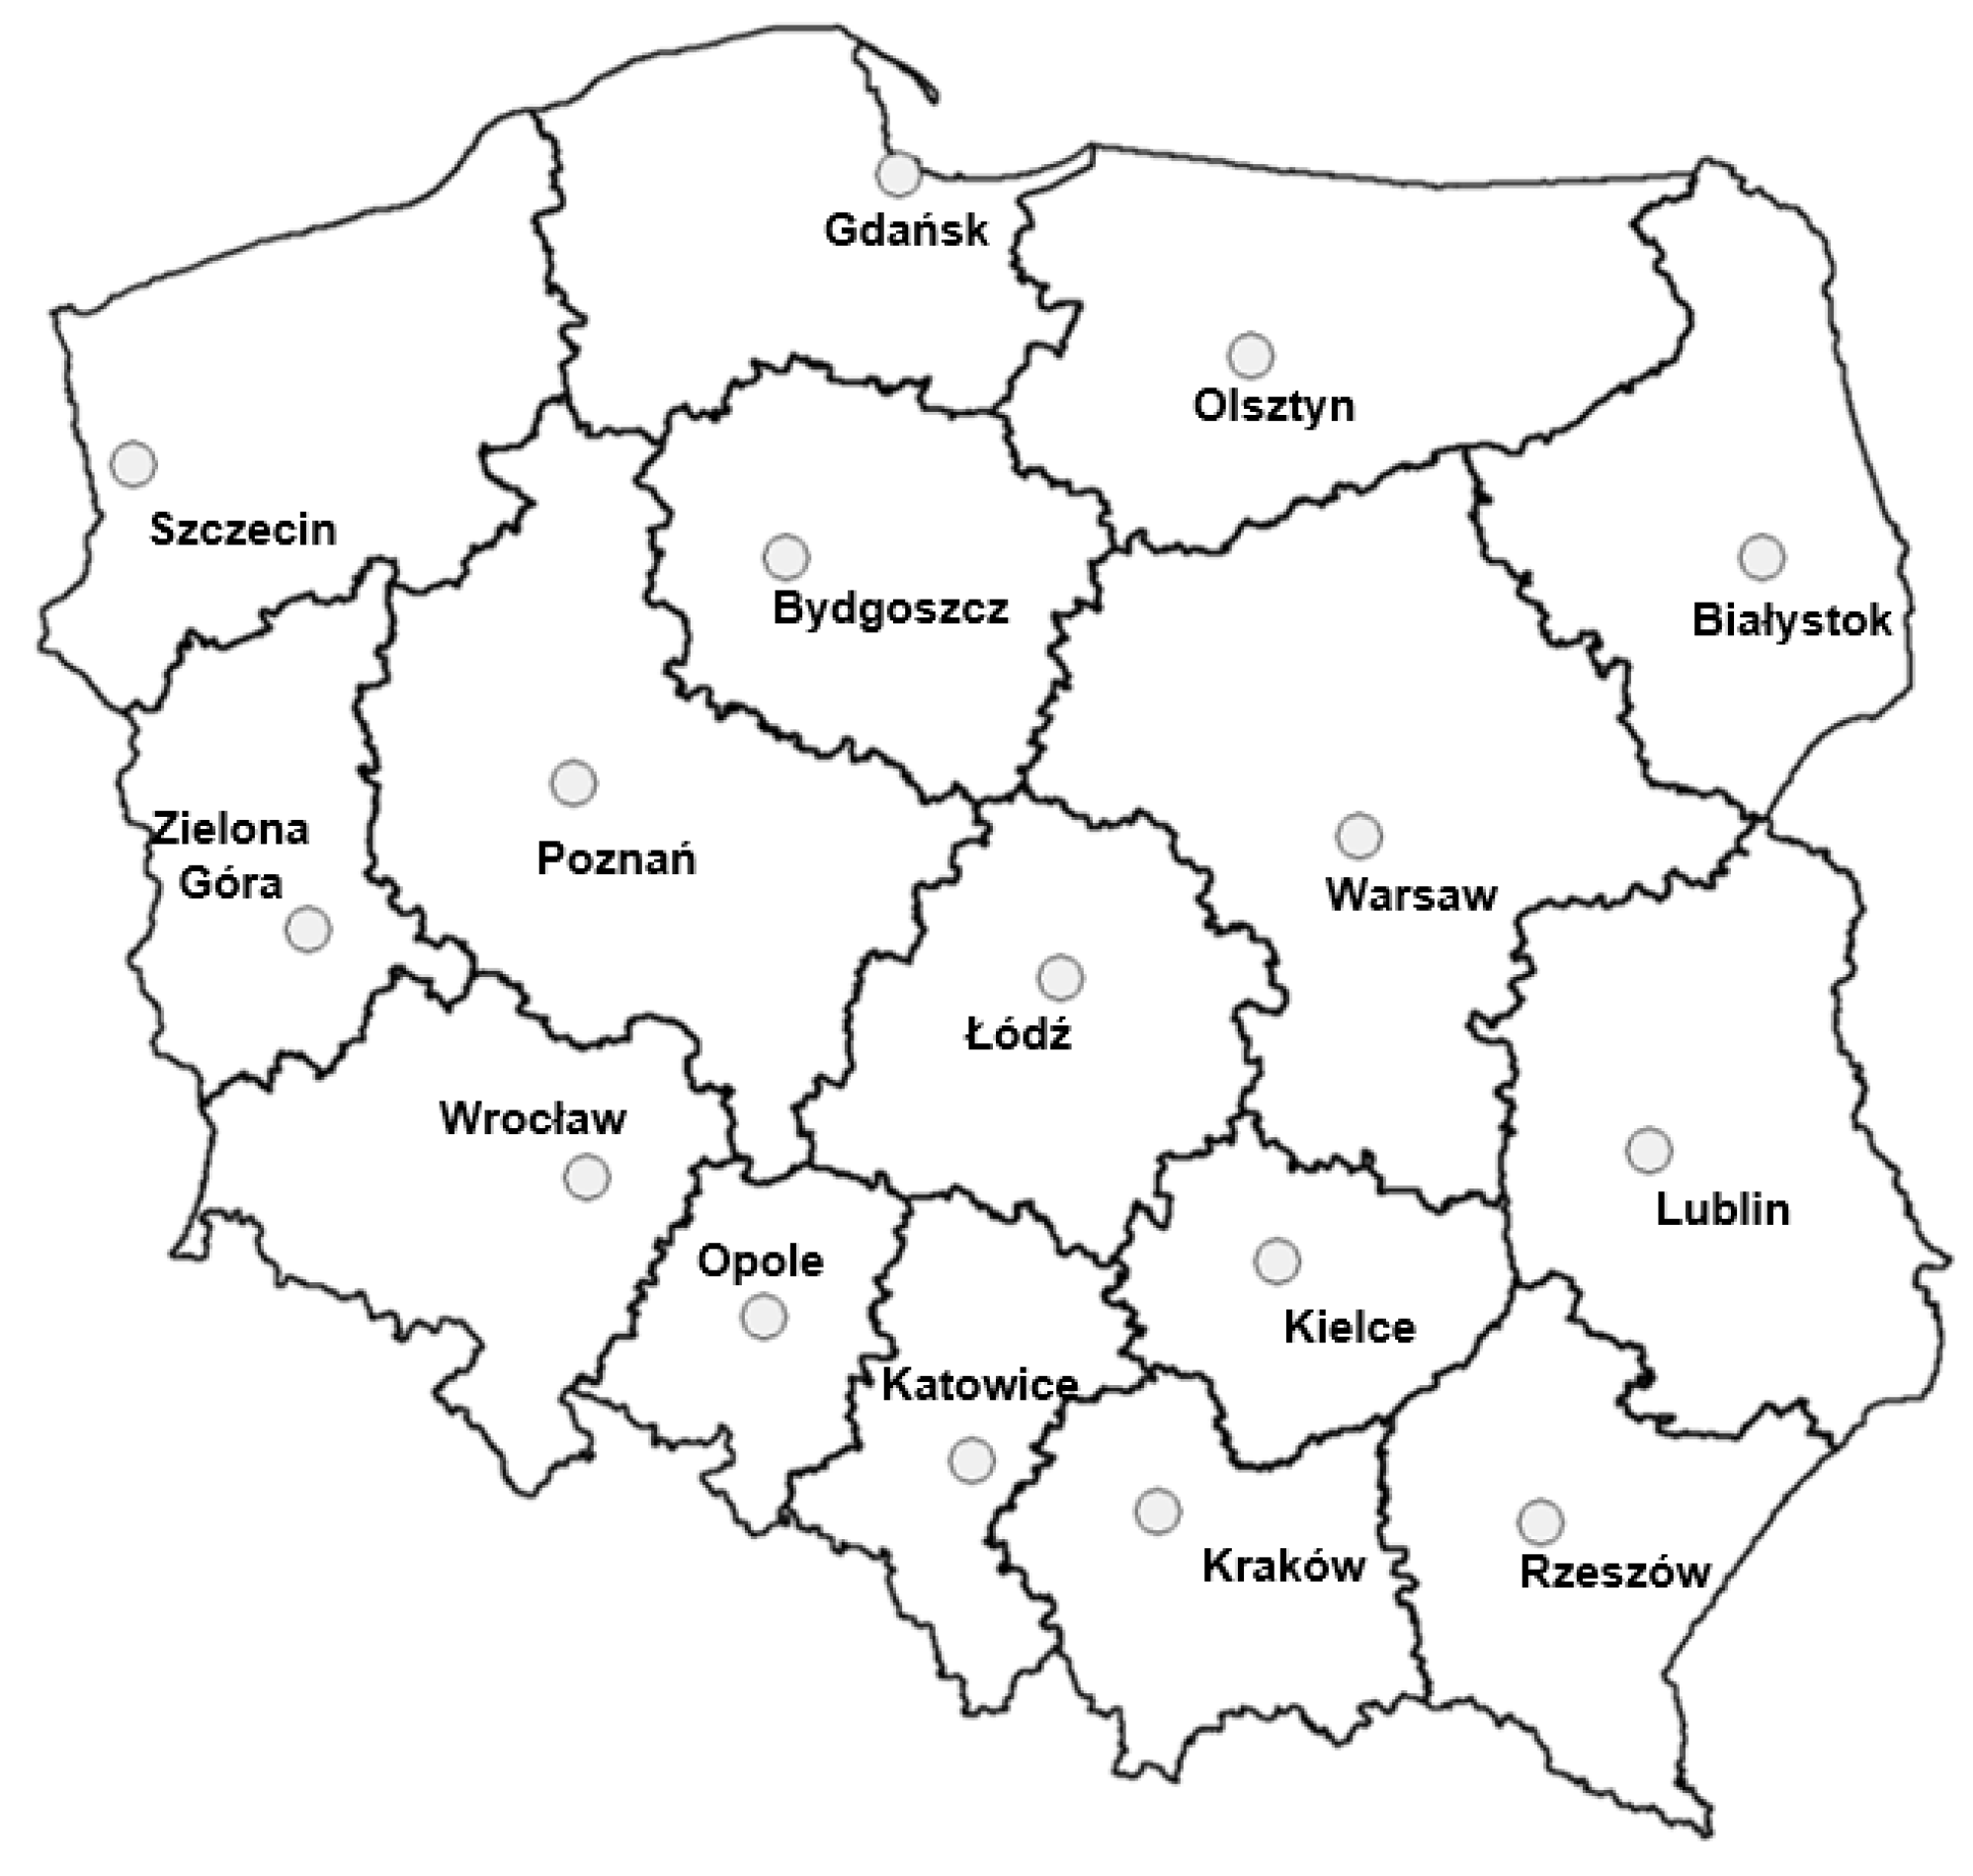
This study was conducted for 16 cities located in Poland. These are provincial cities (Białystok, Zielona Góra, Gdańsk, Katowice, Kielce, Kraków, Lublin, Łódź, Olsztyn, Opole, Poznań, Rzeszów, Szczecin, Toruń, Warsaw and Wrocław), which are administrative centers for their regions. With Poland’s total population of 36.75 million [92], the surveyed cities collectively house more than 7,343,400 residents or about 20% of all Polish citizens.
The cities studied are characterized by great diversity, both in terms of population and size of their area. Regardless of this diversity, according to Christaller’s theory [93], these cities have higher-order central functions, including mainly administrative and political functions.
Thus, these are very important cities where political, scientific, economic and social life is concentrated. These cities, due to their functions and location, show great interest in implementing the smart (and sustainable) city concept. This involves prestige and popularization of their modern image in the country and the world. Therefore, these cities can be regarded in Poland as forerunners in the quest to become a smart (and sustainable) city.
Their location on the map of Poland is shown in Figure 1, while their characteristics are shown in Table 1.
Warsaw has the largest number of residents, among the studied cities (over 1.7 million), and Zielona Góra has the smallest (over 118,000) number of residents. The studied cities also vary in terms of area, which ranges from 88 km2 (Olsztyn) to 517 km2 (Warsaw). The smallest population density is in Zielona Góra at 500.5 persons/km2, and the highest is in Warsaw at 3600.1 persons/km2.
For the purposes of this study, four groups of cities were identified among the surveyed cities by population and their importance in the country’s settlement system. The first group includes cities with a metropolitan character, with more than 1.5 million residents. In Poland, only Warsaw is considered such a city. The second group of cities are those aspiring to be metropolises with populations between 500,000 and 1.5 million. This group includes Kraków, Poznań, Łódź and Wrocław. Another group includes large centers of regional importance with populations from 150,000 to 500,000, viz: Białystok, Gdańsk, Katowice, Kielce, Lublin, Olsztyn, Rzeszów, Szczecin and Bydgoszcz. The last group comprises the smallest cities that are regional centers, with up to 150 thousand inhabitants, namely Zielona Góra and Opole.
3.2. Data
The crime data used for this study were obtained from the Central Statistical Office’s database called the Local Data Bank [94] and covered the period from 2013 to 2022 (a 10-year perspective). Data on the number of offenses recorded by the police were collected and analyzed according to the following types of offenses: total, criminal and economic. In addition, criminal offenses included offenses against public safety and safety in transportation (traffic offenses), against life and health, against property, freedom, freedom of conscience and religion, sexual freedom and morality, and against family and guardianship.
3.3. Methods
The adopted scope of this study formed the basis for developing a research procedure consisting of several stages.
In the first stage, values of the dynamic index for the analyzed types of offenses were determined. The value of this index shows by how much the number of offenses in a given city increased or decreased compared to the base period. Thus, the value of this index makes it possible to gain knowledge of the direction and strength of changes in crime.
The index of the dynamics of change for the analyzed types of offenses between 2013–2022 was determined according to Equation (1):
where yn is the level of the phenomenon in a certain period, and y0 is the level of the phenomenon during the reference (base) period.
In the next stage, a study was conducted on the concentration of crime, which was determined in the studied cities based on the crime-to-population ratio (LQ). This indicator is commonly used in regional studies and provides a measure of the spatial density (concentration) of facilities [95]. In crime studies, this indicator was first used by Brantingham and Brantingham [96]. The values of the crime concentration index, relative to population, were determined based on Equation (2):
where LQ is the location quotients crime index, is the count of crime i in a spatial unit (city) n, is the count of all offenses in spatial units (cities), is the count of population in a spatial unit (city) and is the count of population in all spatial units (cities).
If the value of the LQ index is greater than “1”, it means that the number of offenses in the assessed city exceeds the value derived from the population of that city. On the other hand, an LQ value of less than “1” indicates a state in which there is a smaller number of offenses than is implied by the population of the city being assessed. This interpretation is appropriate for a situation in which there are no factors that promote or reduce crime and when the amount of crime is directly proportional to the population of a city [75,97].
In general, there is currently no method that would make it possible, based on the value of the LQ crime concentration index, to determine the level of this concentration in a given city. Therefore, the evaluation of cities in terms of the level of crime concentration was based on the average values of the determined LQ index and its standard deviation. For this approach, when grouping objects (cities) in linear order, they were divided into groups on the basis of the deviations in the value of the LQ index and its average value, taking into account the magnitude of these deviations.
According to this procedure, the set of surveyed cities was divided into four groups, containing cities with LQ values belonging to the following four class ranges:
- –
- Class I—low concentration of crime (3):
- –
- Class II—medium–low concentration of crime (4):
- –
- Class III—medium–high concentration of crime (5):
- –
- Class IV—high concentration of crime (6):
The determined values of the crime concentration index were also used to assess the overall level of safety in the studied cities.
A multi-criteria analysis was performed in the overall safety assessment of the cities under evaluation, which allowed us to aggregate the determined partial values of the LQ index (related to different types of offenses) and create a ranking of the cities under study. Multi-criteria analysis allowed us to combine the analyzed criteria into a single objective function which, in this article, is the assessment of safety in the studied cities. The assessment of safety and the determination of the safety index for each city were carried out using the TOPSIS method, which belongs to the group of MCDM methods. Its essence is based on linear ordering, while decision making is implemented using the ideal and anti-ideal solutions [98,99]. The algorithm of the TOPSIS method consists of the following steps:
- (1)
- Identify criteria for assessing city safety in terms of crime concentration relative to population;
- (2)
- Based on the identified evaluation criteria, create a decision matrix:
- (3)
- Since the evaluation criteria may have different units of measurement, it is necessary to normalize the values of the evaluation criteria to make them comparable, according to Equation (8):
- (4)
- The normalized matrix is used to create a weighted matrix that takes into account the weights given to each evaluation criterion, according to Equation (9):
- (5)
- Determine the model coordinates of the ideal solution (A+) and the anti-ideal solution (A−):
- (6)
- Determine the positive distance () and negative distance () of each evaluated variant (city):
- (7)
- Calculate the safety index, that is, the value of the coefficient of relative proximity for each alternative:
- (8)
- Create a ranking of alternatives based on the value of the relative proximity coefficient () in the descending direction;
- (9)
- Determine the level of safety in cities based on the value of the safety index (.
For this purpose, the algorithm described by Equations (3)–(6) was used, in which, instead of the value of the LQ coefficient, the value of the safety index (, the mean value of this index and the standard deviation from the mean value were applied.
In the TOPSIS method, for each evaluation criterion, its weight is taken into account (Equation (9)). In the present study, it is assumed that all values of crime concentration coefficients are destimulants (the lower the value of the LQ coefficient, the better), and their weights take the following values:
- –
- Economic offenses, LQe (weight = 0.1);
- –
- Criminal traffic offenses, LQt (weight = 0.125);
- –
- Criminal offenses against life and health, LQl&h (weight = 0.25);
- –
- Criminal offenses against property, LQp (weight = 0.15);
- –
- Criminal offenses against liberty, freedom of conscience, sexual freedom and morality, LQf (weight = 0.12);
- –
- Criminal offenses against family and guardianship, LQf&c (weight = 0.13);
- –
- Criminal offenses against general security and safety in communications, LQps (weight = 0.125).
The methodology developed in this way was used to study the state of crime and safety in selected provincial cities in Poland.
4. Results
Based on the methodology developed (Section 3), a study was conducted, the results of which are presented in this section.
4.1. Analysis of Offenses and Their Concentration Relative to the Population of the Cities Studied
The first stage of this study analyzed offenses and their concentration in relation to the number of residents in the cities studied.
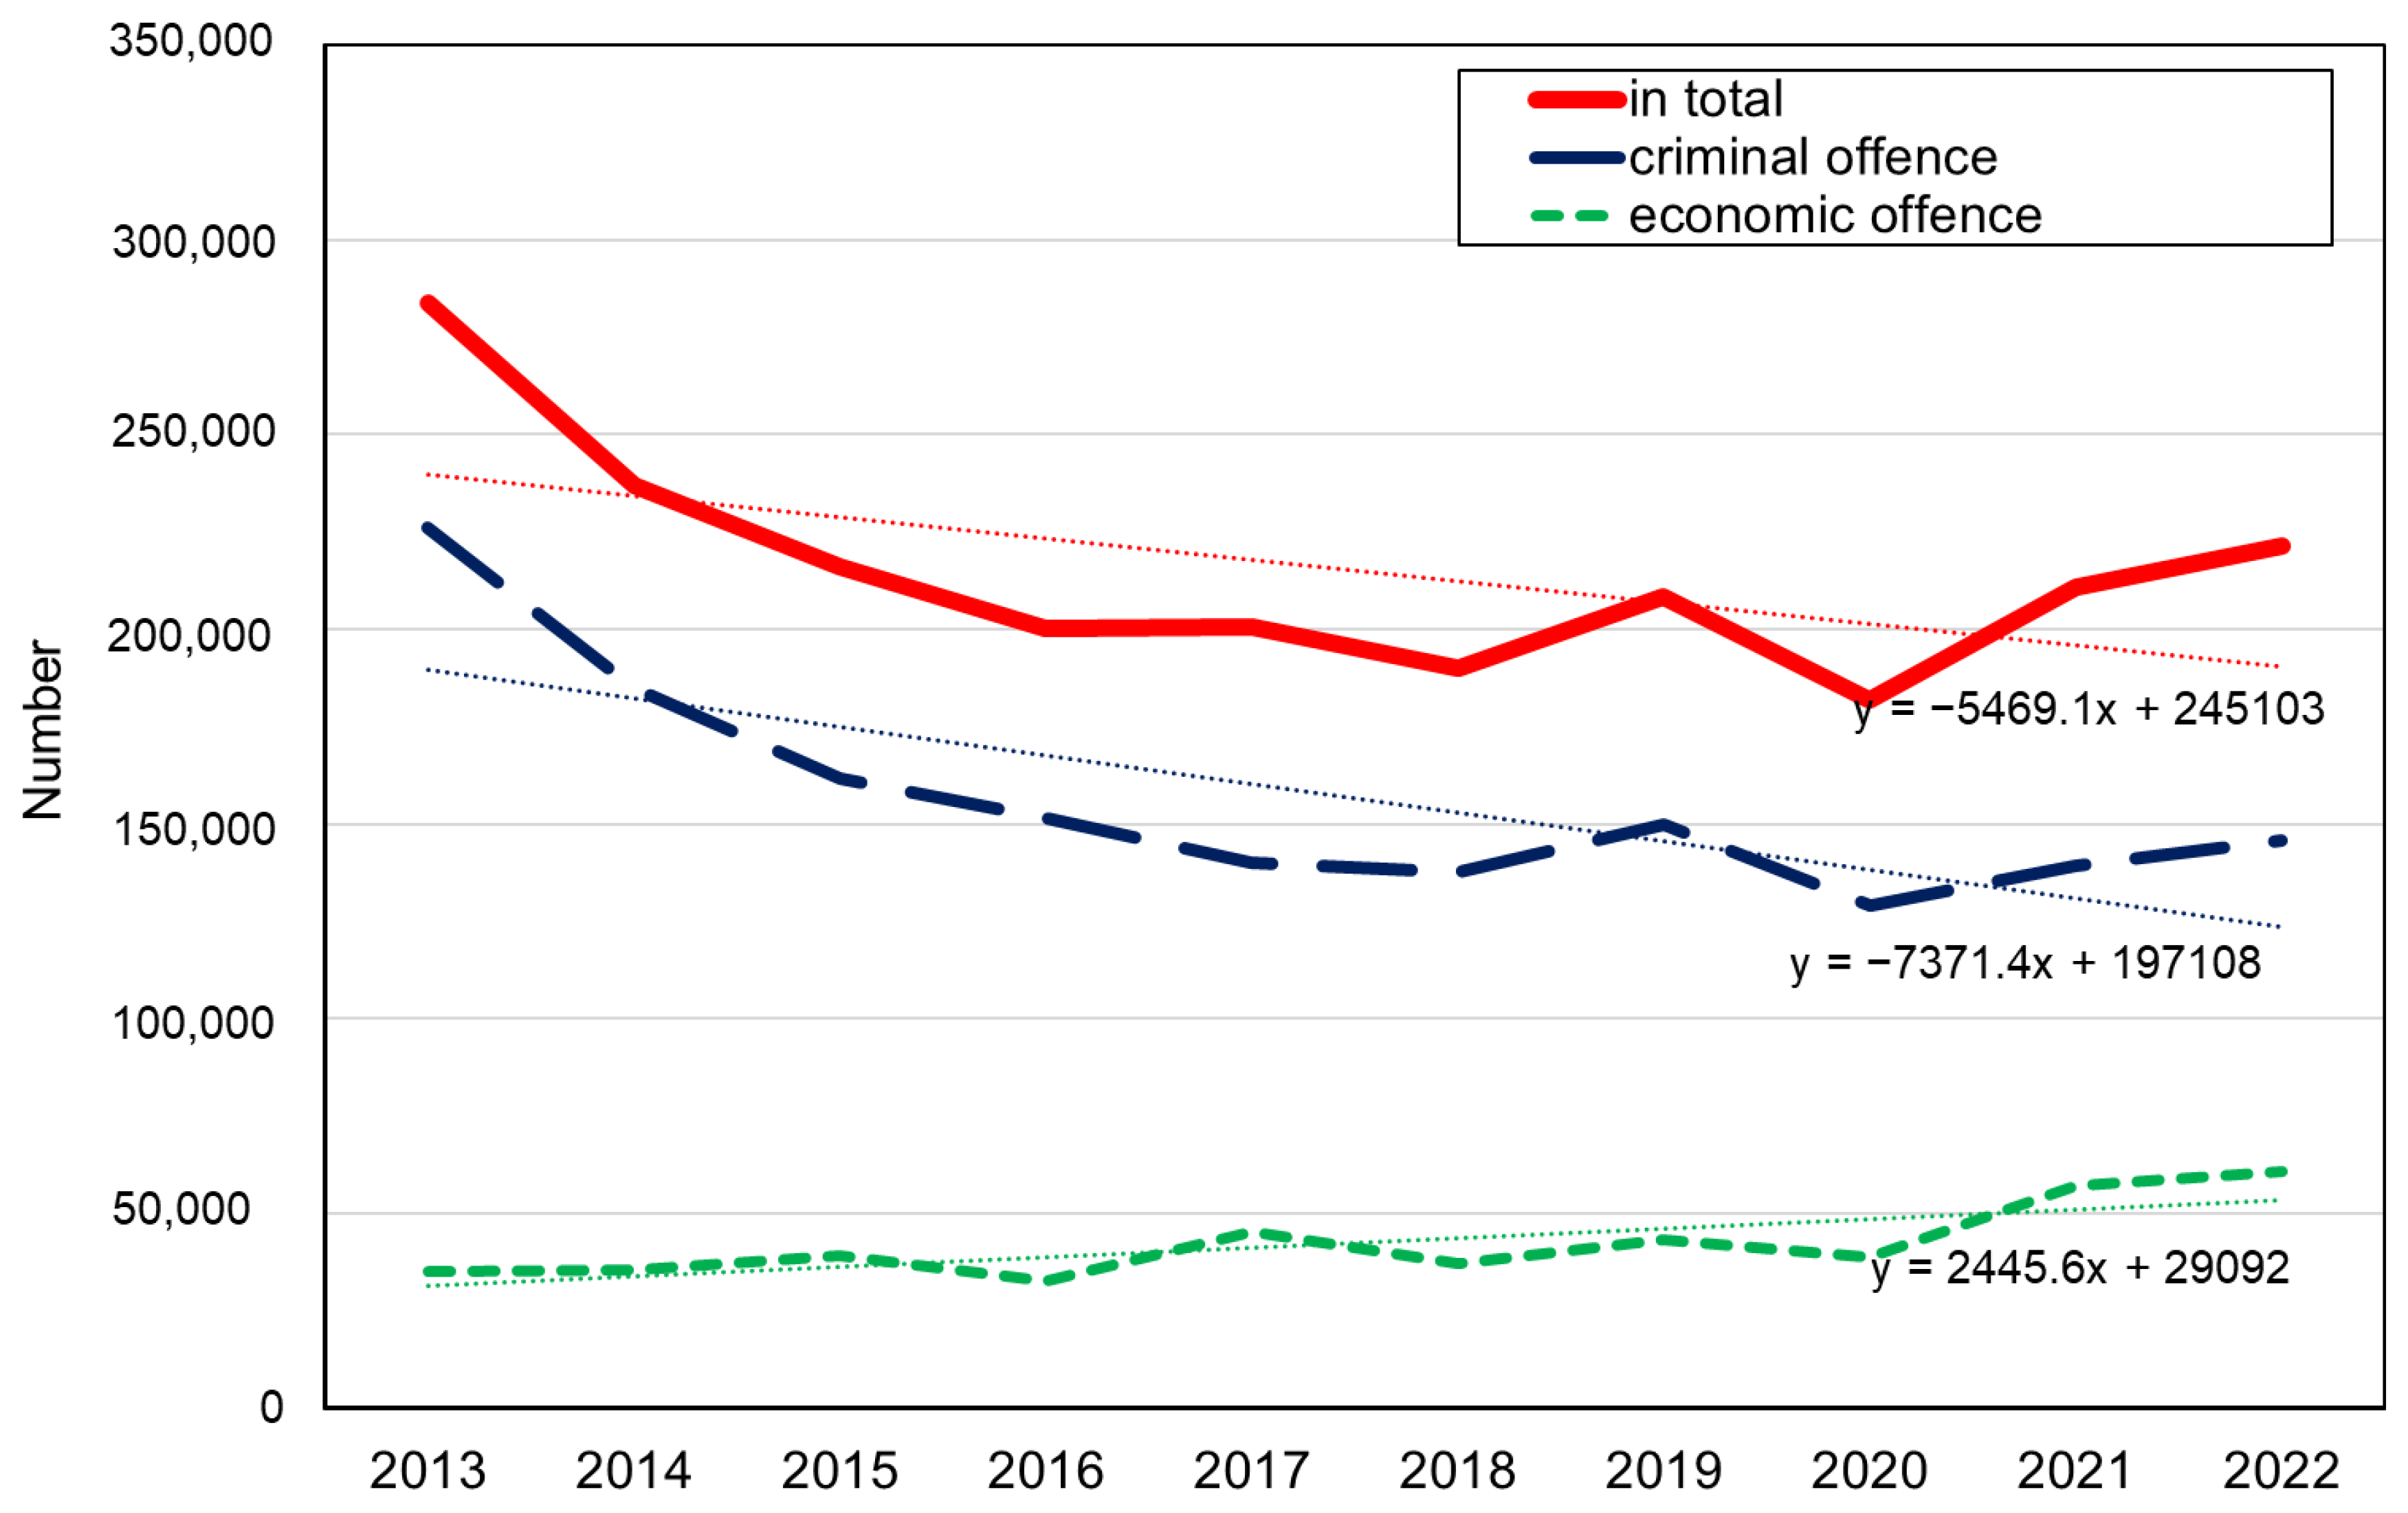
It was reported that the total number of offenses in the study population of 16 provincial cities decreased by nearly 22% between 2013 and 2022 (Table 2). There was a clear downward trend between 2013–2018 and 2019–2020 (Figure 2). However, between 2018–2019 and between 2020–2022, there was an increase in the number of total registered offenses, which was mainly related to the increase in economic offenses.
An analysis of the value of the change dynamics index shows that, overall, the number of crimes decreased by 22% (from 283,796 in 2013 to 221,437 in 2022) (Table 2). The largest decrease in total crime was reported in Poznań, while two cities—Warsaw and Katowice—registered an increase, with Warsaw increasing by just 0.2% and Katowice by nearly 5% (Table 2).
In the case of offenses of a criminal nature, the number of offenses was found to have decreased between 2013–2018 and 2019–2020 and to have increased between 2018–2019 and 2020–2020, which is similar in nature to the change in total offenses. The number of offenses of a criminal nature decreased in all the surveyed cities combined by nearly 36%, from 226,051 in 2013 to 145,670 in 2022. The largest decrease in this group of offenses was reported in Poznań (by more than 50%) and the smallest in Gdańsk (by just over 10%) (Table 2). None of the 16 cities saw an increase in the number of offenses of a criminal nature in 2022 compared to 2013.
In the case of economic offenses in the surveyed cities, a clear upward trend is noticeable (Figure 2). This is also confirmed by the determined index of the dynamics of change, which indicates that the number of offenses of an economic nature in 2022, compared to the base year (2013), increased in the entire study population by as much as 74%. The largest increase, nearly fourfold, occurred in Olsztyn and Katowice. A decrease in this type of offense was registered only in Gdańsk, Poznań and Szczecin (Table 2).
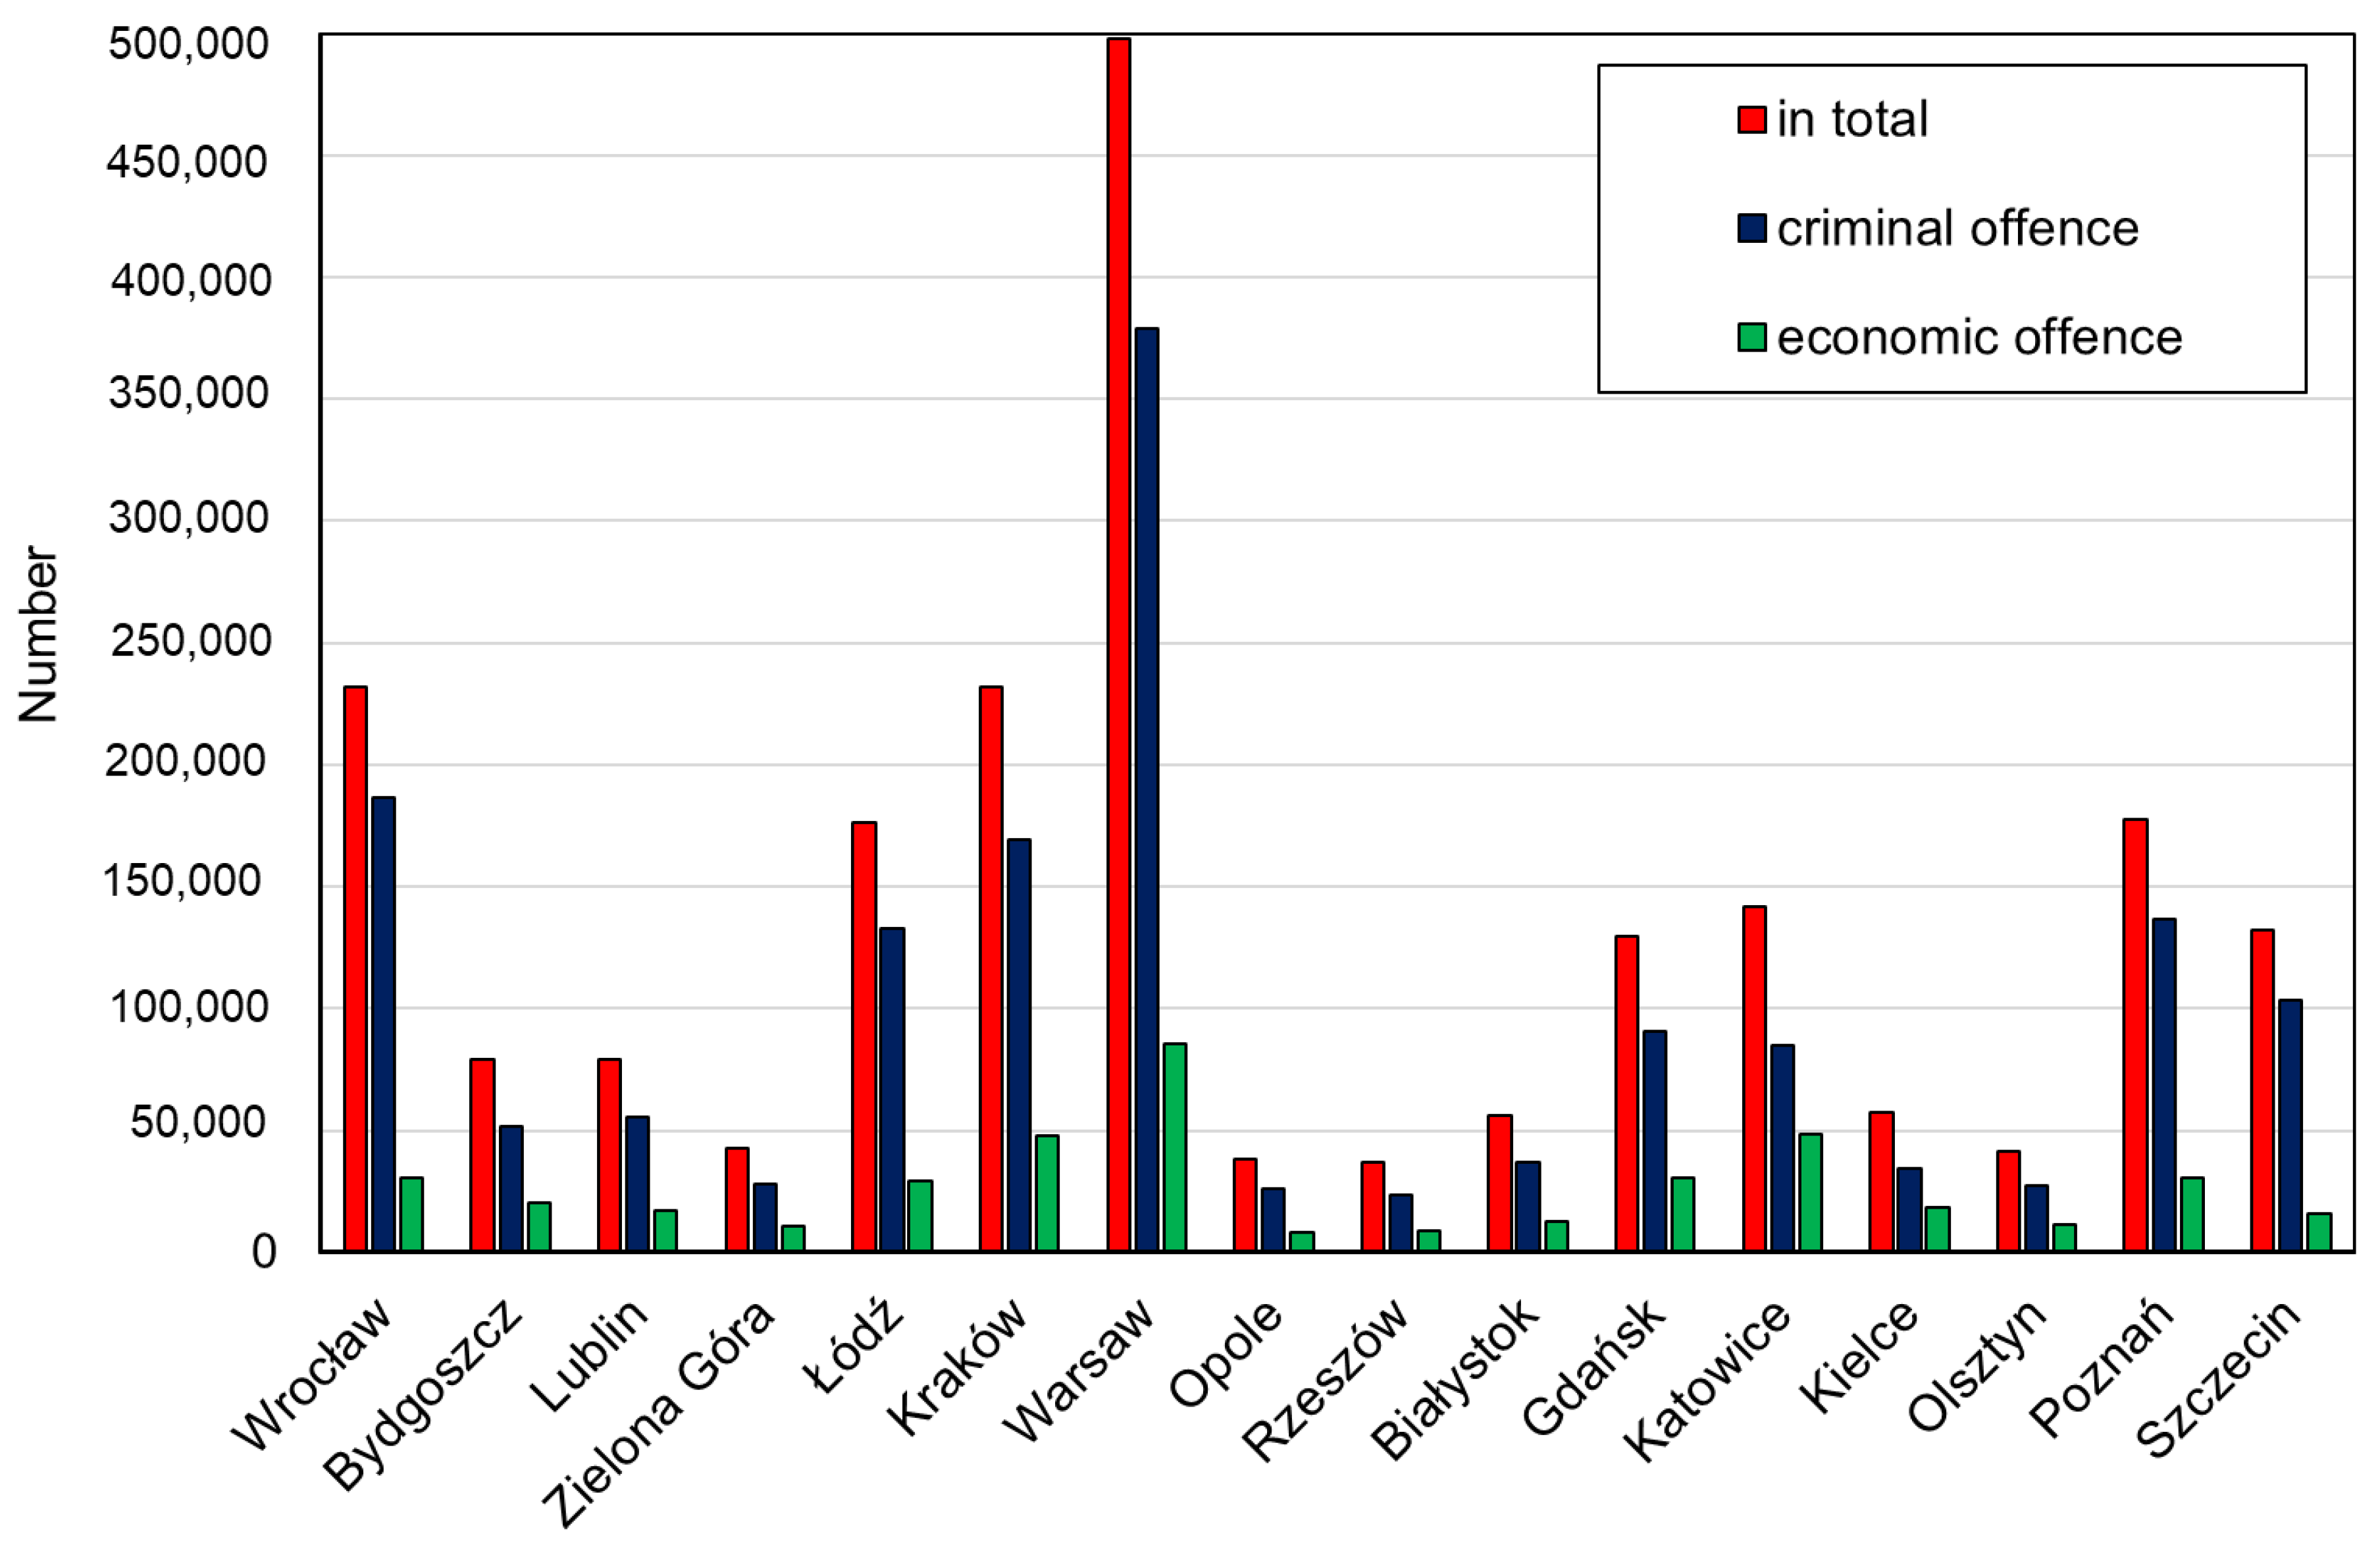
The total number of offenses committed between 2013 and 2022 in the studied cities was 2,150,234, with 20,464 of them recorded in Rzeszów and 497,650 in Warsaw. Warsaw (the Polish capital) also had the highest numbers of criminal and economic offenses, at 379,204 and 85,208, respectively (Figure 3). The smallest number of offenses of a criminal nature, on the other hand, were committed in Rzeszów (23,776) and—of an economic nature—in Opole (8091) (Figure 3).
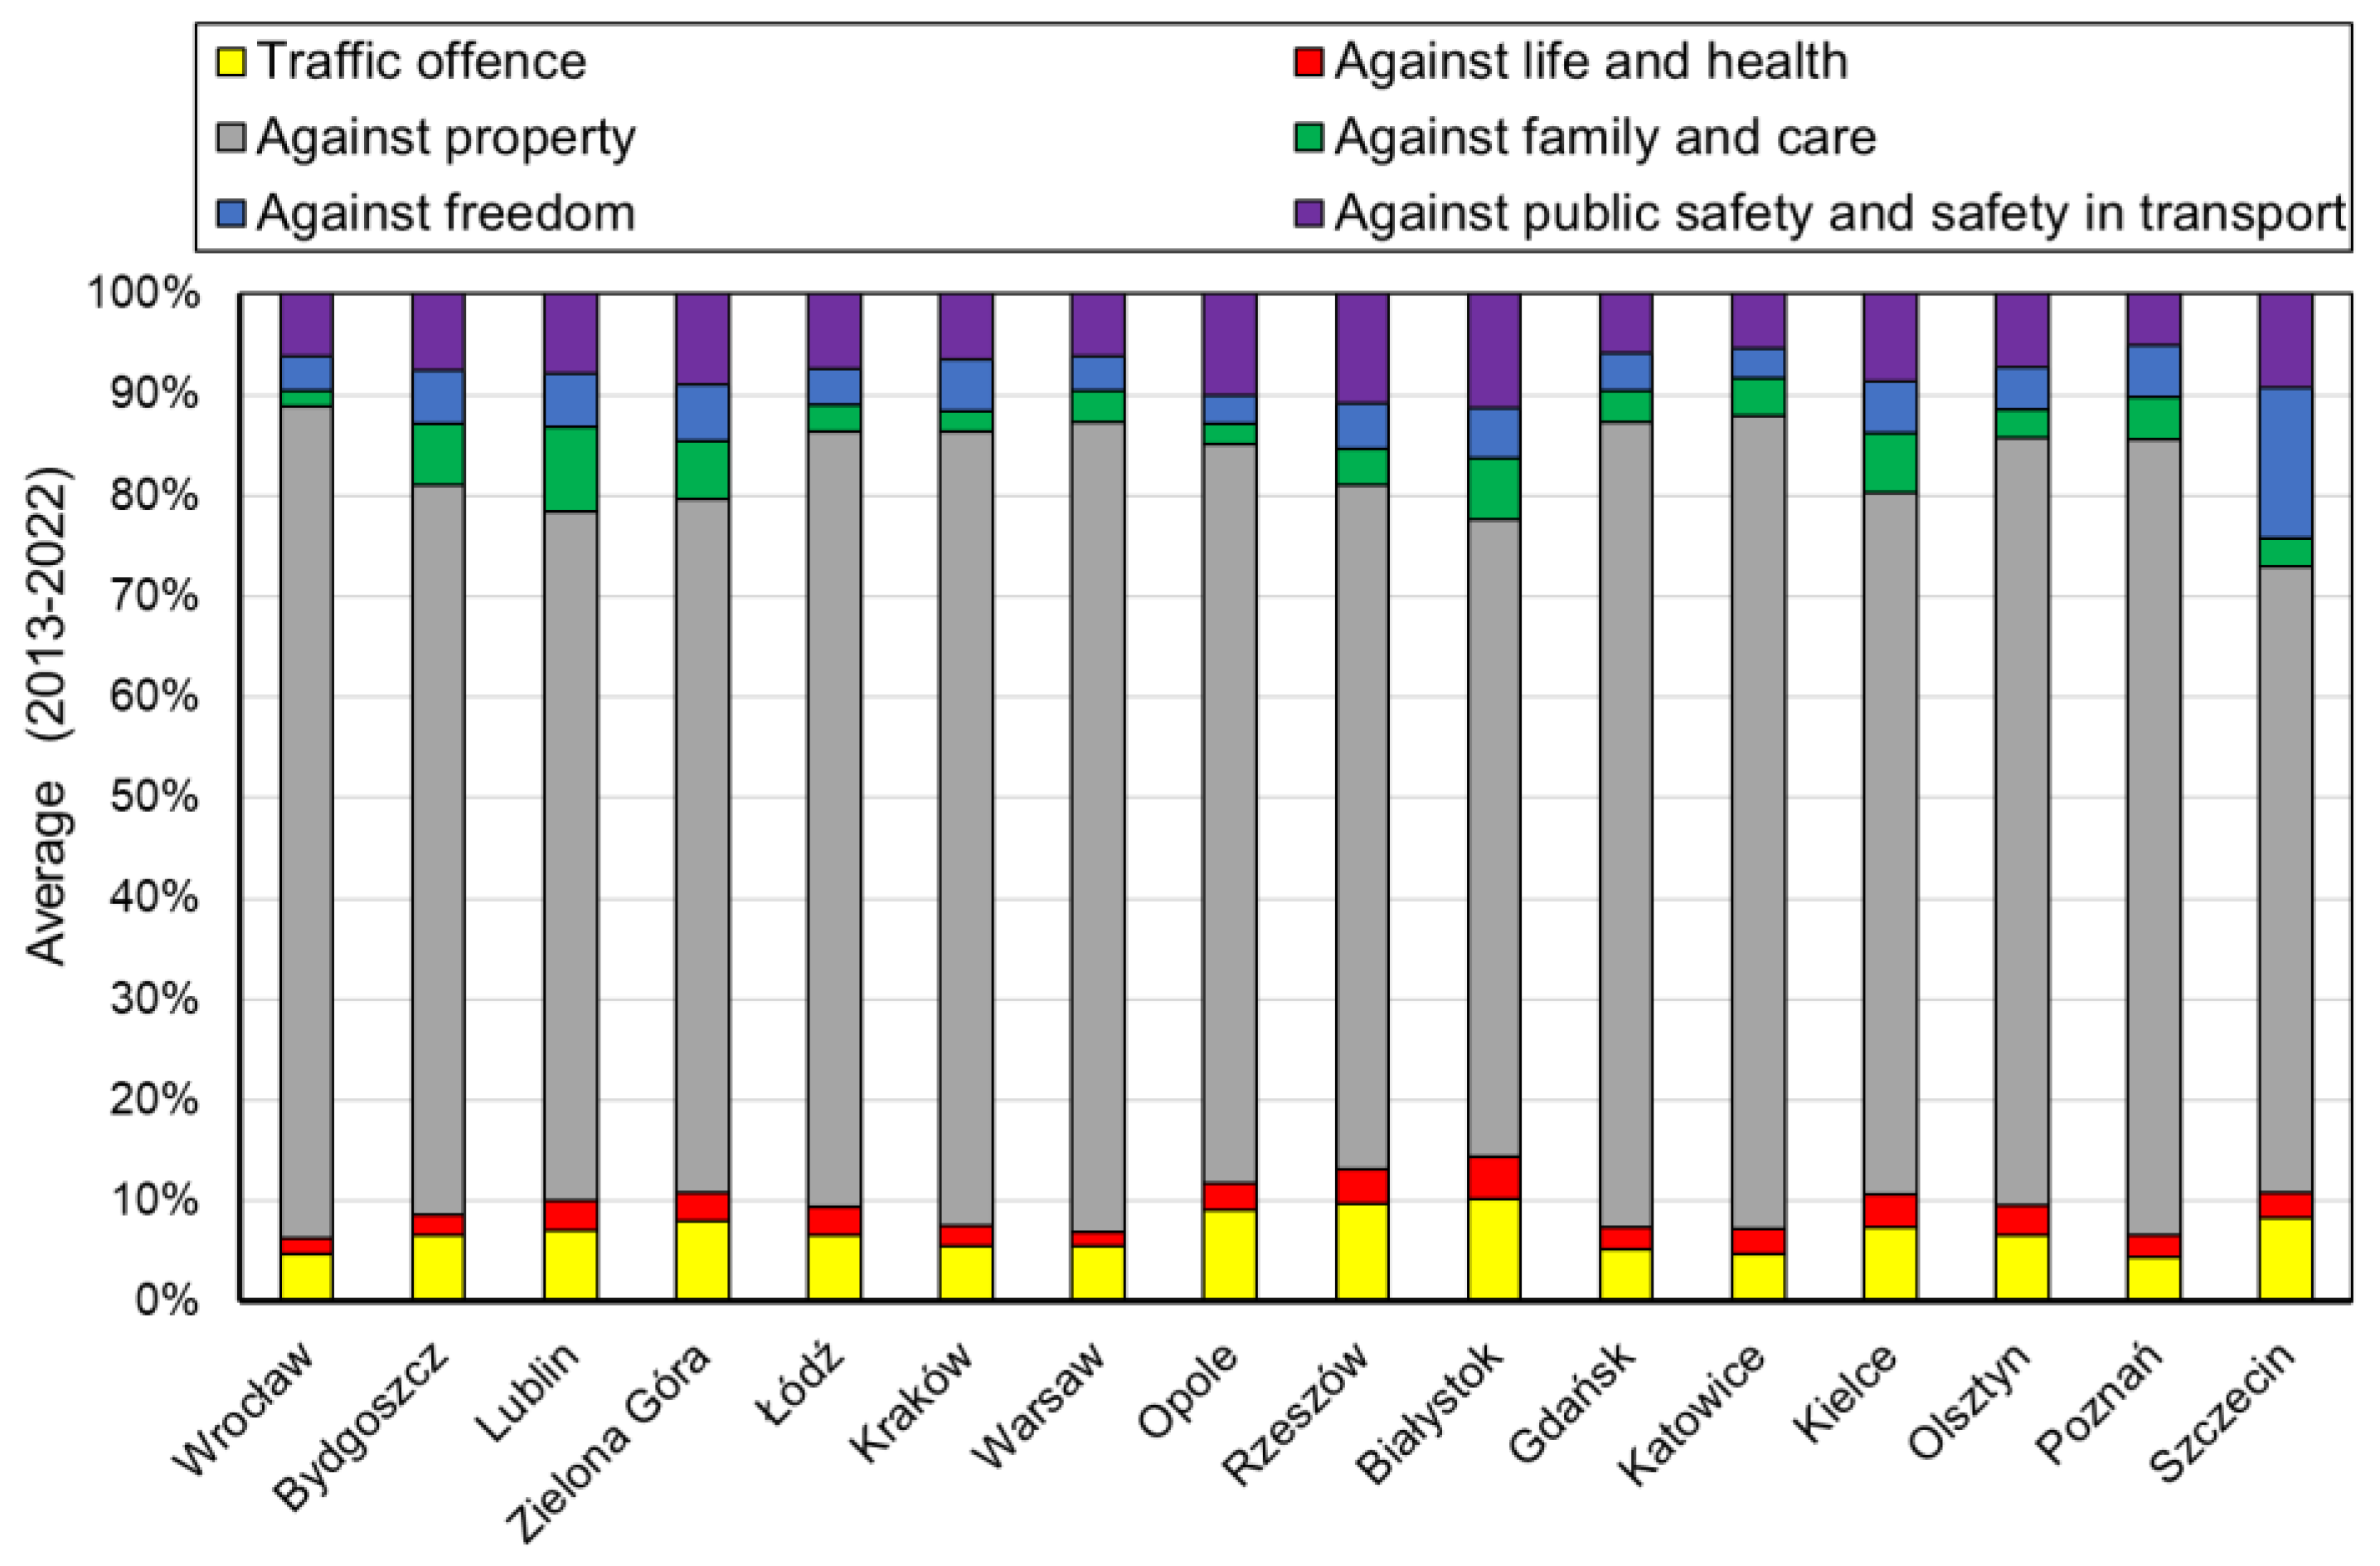
The structure of offenses committed in the studied cities by type is summarized in Table 3 (quantitatively), and the percentages are shown in Figure 4.
The majority of offenses in the entire surveyed population of cities (more than 156 thousand, or about 75% of the total) are criminal in nature (Figure 2). Among them, offenses against property dominate, with an average annual number of more than 134,000 (about 86% of criminal offenses and about 65% of the total). The number of economic crimes is more than 42,000 (about 20% of the total), and traffic offenses amount to close to 10,500 (about 5% of the total offenses). Offenses against life and health, which are particularly dangerous for urban residents, deteriorating their sense of safety and quality of life, averaged more than 3800 (2.5% of criminal offenses and about less than 2% of the total) during the period under review. On the other hand, regarding crime considered harmful to families, especially children, offenses against the family and guardianship were nearly 6000 in number (less than 3% of the total and nearly 4% of criminal offenses).
An analysis of crime in individual cities showed that the highest number, in percentage terms, of offenses against life and health during the analyzed period was registered in Rzeszów and Białystok, which accounted for an average of about 4% of criminal offenses each, and the lowest number was found in Warsaw, Bydgoszcz, Kraków, Poznań, Szczecin, Gdańsk, Katowice and Wrocław (about 2% each). Offenses against property accounted for 82% of criminal offenses in Wrocław and “only” 62% in Poznań (Figure 4).
Traffic offenses accounted for as much as 10% of criminal offenses in Rzeszów and Białystok and the smallest percentage, 4%, was found in Poznań. Offenses against family and guardianship, on the other hand, accounted for between 2% of criminal offenses in Wrocław and 8% in Lublin (Figure 4).
Particularly interesting seems to be the share of offenses against freedom, freedom of conscience, sexual freedom and morality. In most cities, these offenses account for 3% to 6% of criminal offenses on an average annual basis but, in Szczecin, it is as high as 15% (Figure 4).
When analyzing the dynamics of change, the changes in the level of criminal offenses in 2022 compared to 2013 (the base year) were also determined (Table 4). In general, the number of traffic offenses, offenses against life and health, offenses against property and offenses against public safety and communication decreased in the studied cities. By contrast, many cities saw an increase in the number of offenses against family and guardianship and against freedom, freedom of conscience, sexual freedom and morality. The largest increase in the number of offenses against family and guardianship was registered in Gdańsk, Kielce, Zielona Góra, Warsaw, Rzeszów and Białystok, and the largest increase in offenses against freedom, freedom of conscience, sexual freedom and morality was registered in Kraków and Gdańsk. In turn, the largest decreases in the number of offenses against family and guardianship were registered in Kraków and in the number of offenses against freedom, freedom of conscience and sexual liberty and morality in Wrocław.
In order to determine the average annual (for the entire period 2013–2022) concentration of crime occurring in the analyzed cities, the values of the LQ indicators were specified (Equation (2)), which are presented in Table 5, while the results of calculating the concentration of crime for individual sub-years are presented in Appendix A of this paper. Using the average value for a year is an appropriate measure that makes it possible to present the situation that occurred in the studied cities in a single decade, since the absolute number of different types of offenses did not change dynamically from year to year. The summary included in Table 5 shows the average annual values of crime concentration.
The determined values of crime concentration indices made it possible to determine how the concentration of the number of total offenses (LQT) was shaped in relation to the population of the cities under study. The highest values of this index (LQT), exceeding the value of 1, in terms of total offenses occurred in half of the analyzed cities, i.e., Poznań, Szczecin, Katowice, Kielce, Opole, Kraków, Zielona Góra and Wrocław (Table 5). Warsaw was not among these cities, where, although the highest absolute number of offenses was registered (Figure 2), the value of the crime concentration index in this city reached a value below 1. The lowest value of the LQT index for total offenses was reported in Rzeszów, the city with the lowest average annual absolute number of crimes. In general, the calculations carried out indicate that the highest crime concentration in relation to population happened in most cities located in the western and southern parts of Poland (i.e., Szczecin, Poznan, Katowice, Opole, Kraków, Zielona Góra and Wrocław).
In terms of criminal offenses, in absolute terms, Warsaw had the highest average annual crime rate, and Olsztyn had the lowest (Figure 3). However, the highest crime concentration in relation to population was found in Wroclaw, and the lowest was found in Katowice and Kielce. High values of the LQ coefficient of the concentration of criminal offenses (greater than 1) were found, in addition to Wrocław, in Łódź, Warsaw, Poznań, Szczecin and Kraków, i.e., in the largest Polish cities. The highest concentration of criminal offenses occurred primarily in the cities of western Poland (Szczecin, Wrocław, Poznań) and in those of central Poland (Warsaw and Łódź) and southern Poland (Kraków) (Table 5). In this case, there is no clear regularity, as there was with the total crime concentration.
With regard to offenses of a criminal nature, it is worth also analyzing offenses against health and life and against property. In the case of offenses against health and life—which are the most dangerous for city residents (in the Polish legal system, they are counted among the most serious forms of transgression of the law and moral principles) and at the same time bring the most serious consequences for the victims, including loss of life—in as many as nine cities, the values of the LQl&h coefficient reached values greater than 1. These cities were Katowice and Poznań (the highest values), Lublin, Kraków, Łódź, Białystok, Gdańsk, Kielce and Olsztyn (Table 5). The most favorable situation in this regard was found in Warsaw, which had the lowest crime concentration in relation to population among the studied cities but, at the same time, had the highest number of such offenses in absolute terms. In the case of these offenses, it is also difficult to find a regularity indicating that they occurred in a higher concentration in a particular part of the country.
On the other hand, the highest concentration of the number of offenses against property (Table 5), which are the highest among all the analyzed types of offenses in their total number (Figure 3), was found in Wrocław and Warsaw, which coincides with their quantities in absolute numbers. By contrast, the smallest concentration of this type of offense in relation to the number of residents was reported in Białystok and was significant also in Kraków and Gdańsk, large and affluent urban centers.
The determined values of the concentration coefficients of offenses in relation to the number of inhabitants of LQT made it possible to assess the differentiation and division of cities into classes of different levels. The basis for this division, in addition to the value of the concentration coefficient, were two additional parameters of this taxonomic measure, namely the arithmetic mean and standard deviation (Equations (3)–(6)). The division criteria adopted made it possible to carry out the process of hierarchization of studied cities.
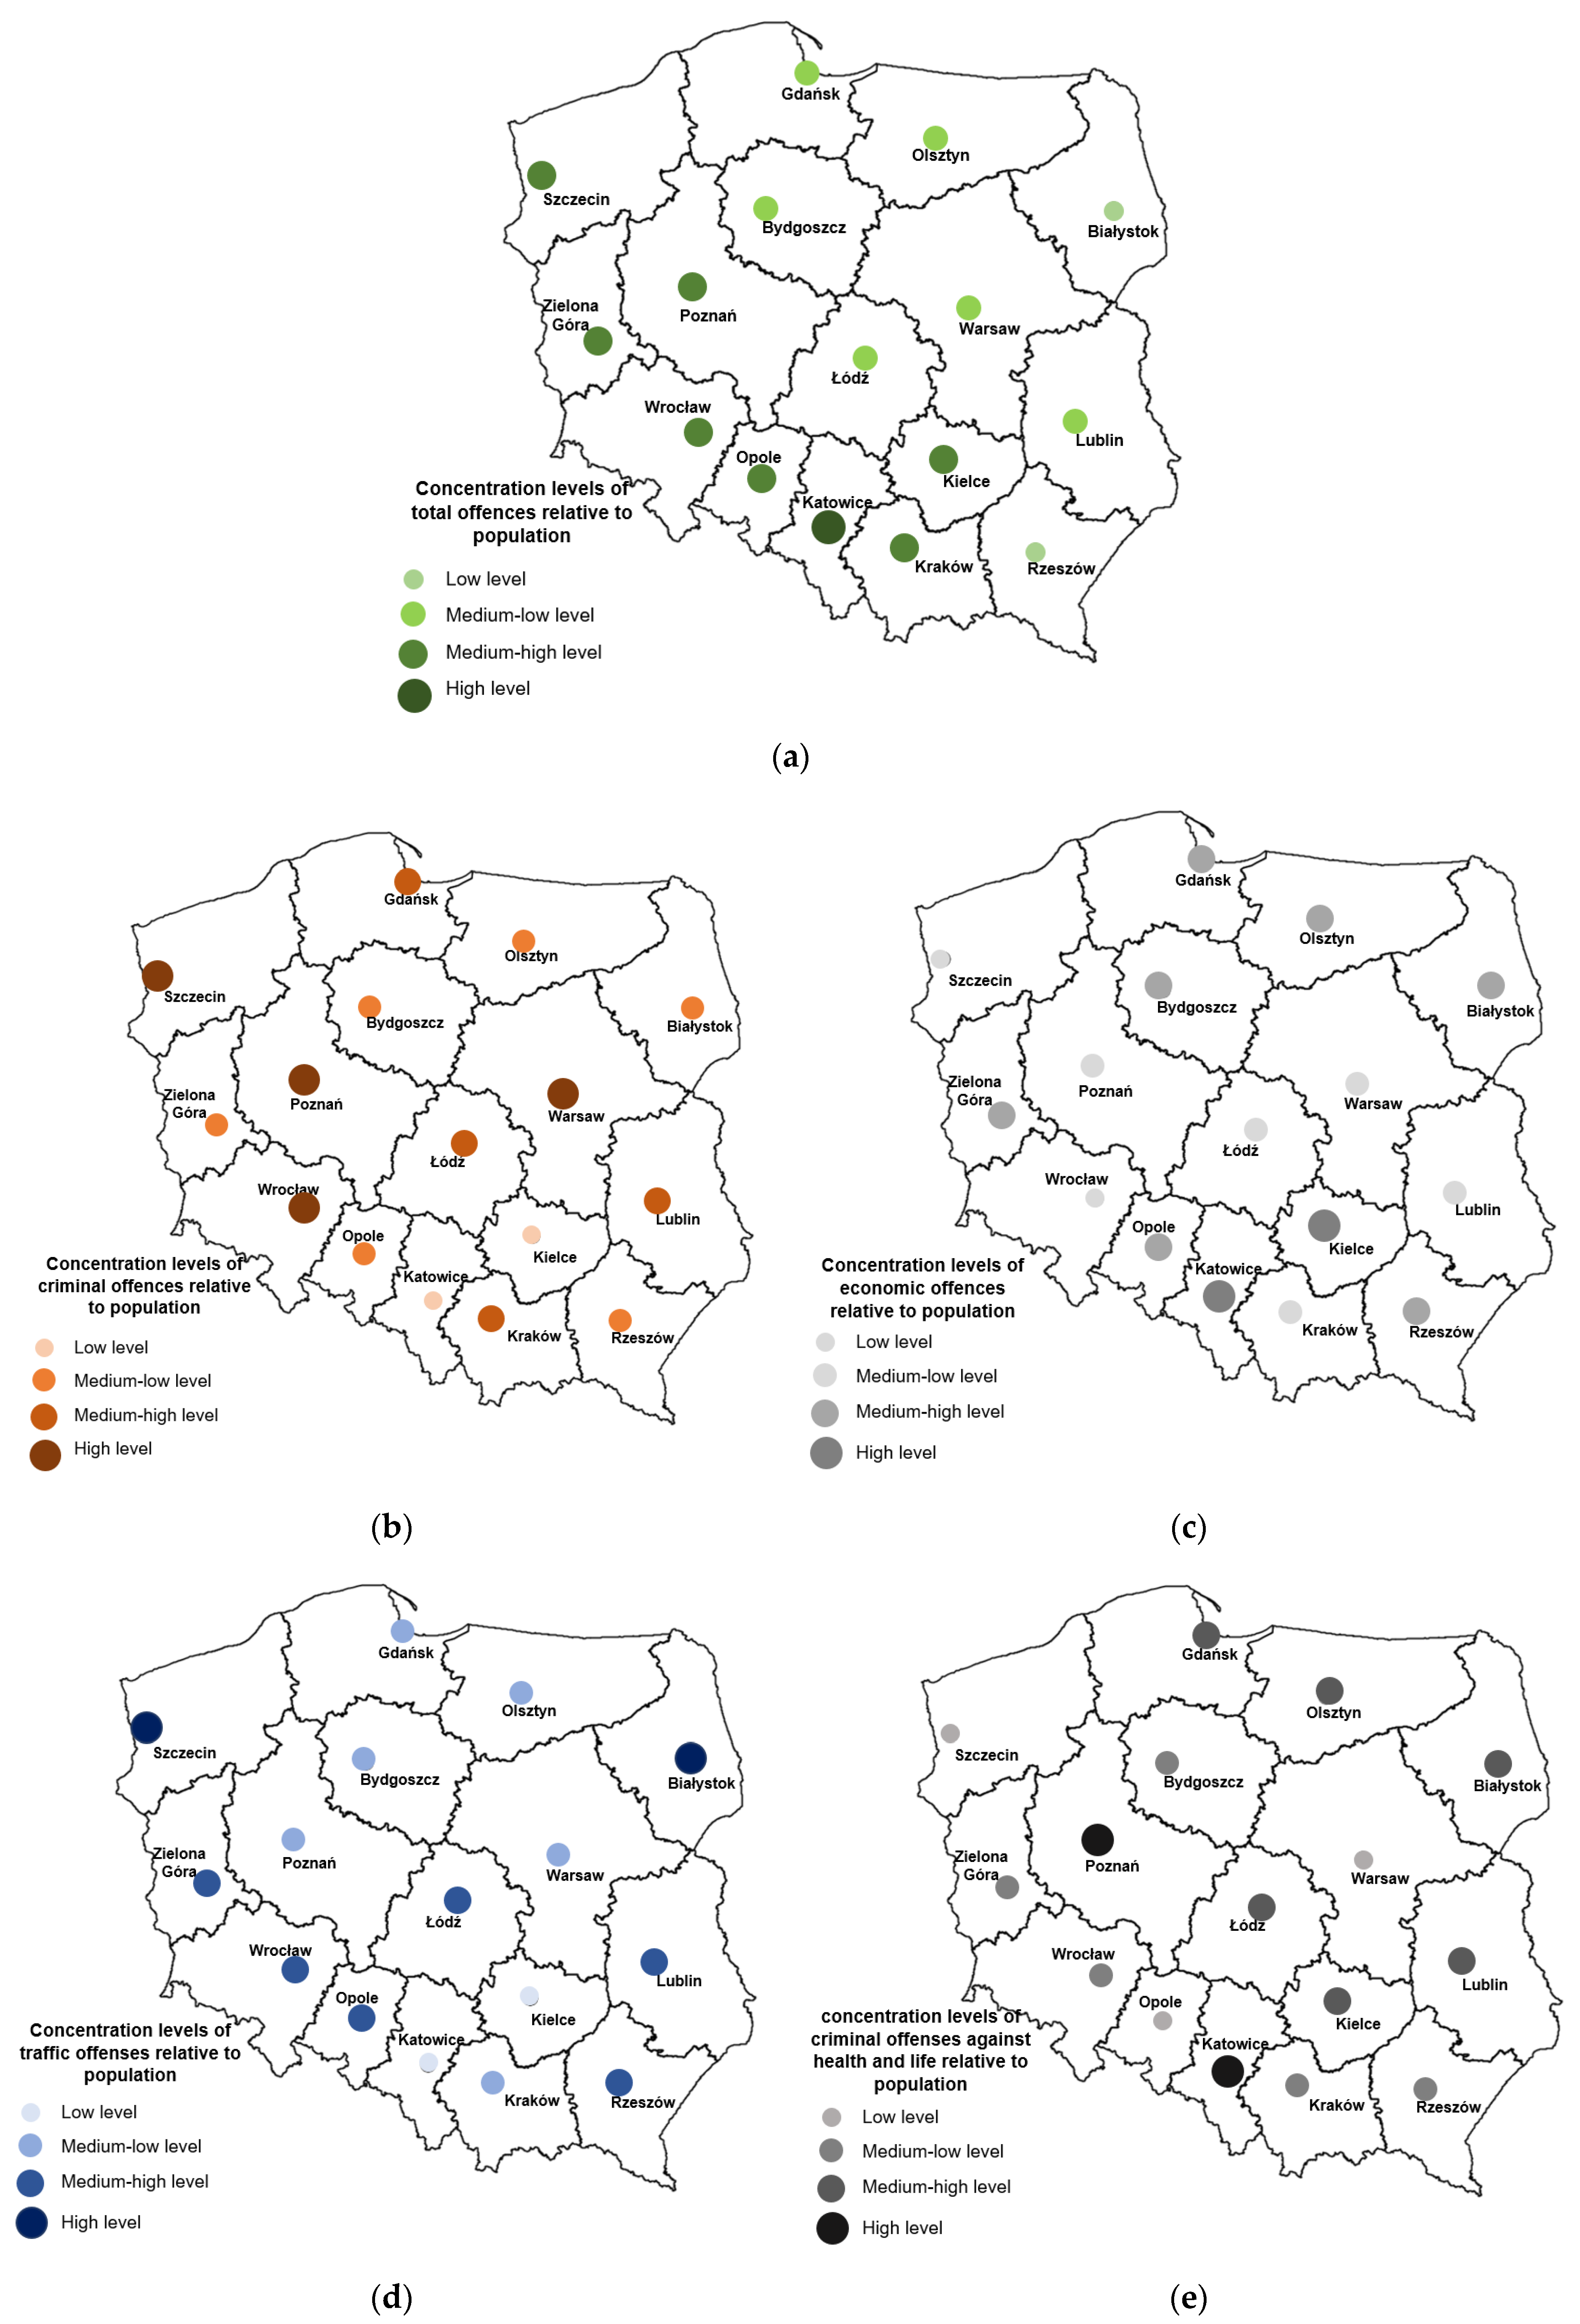
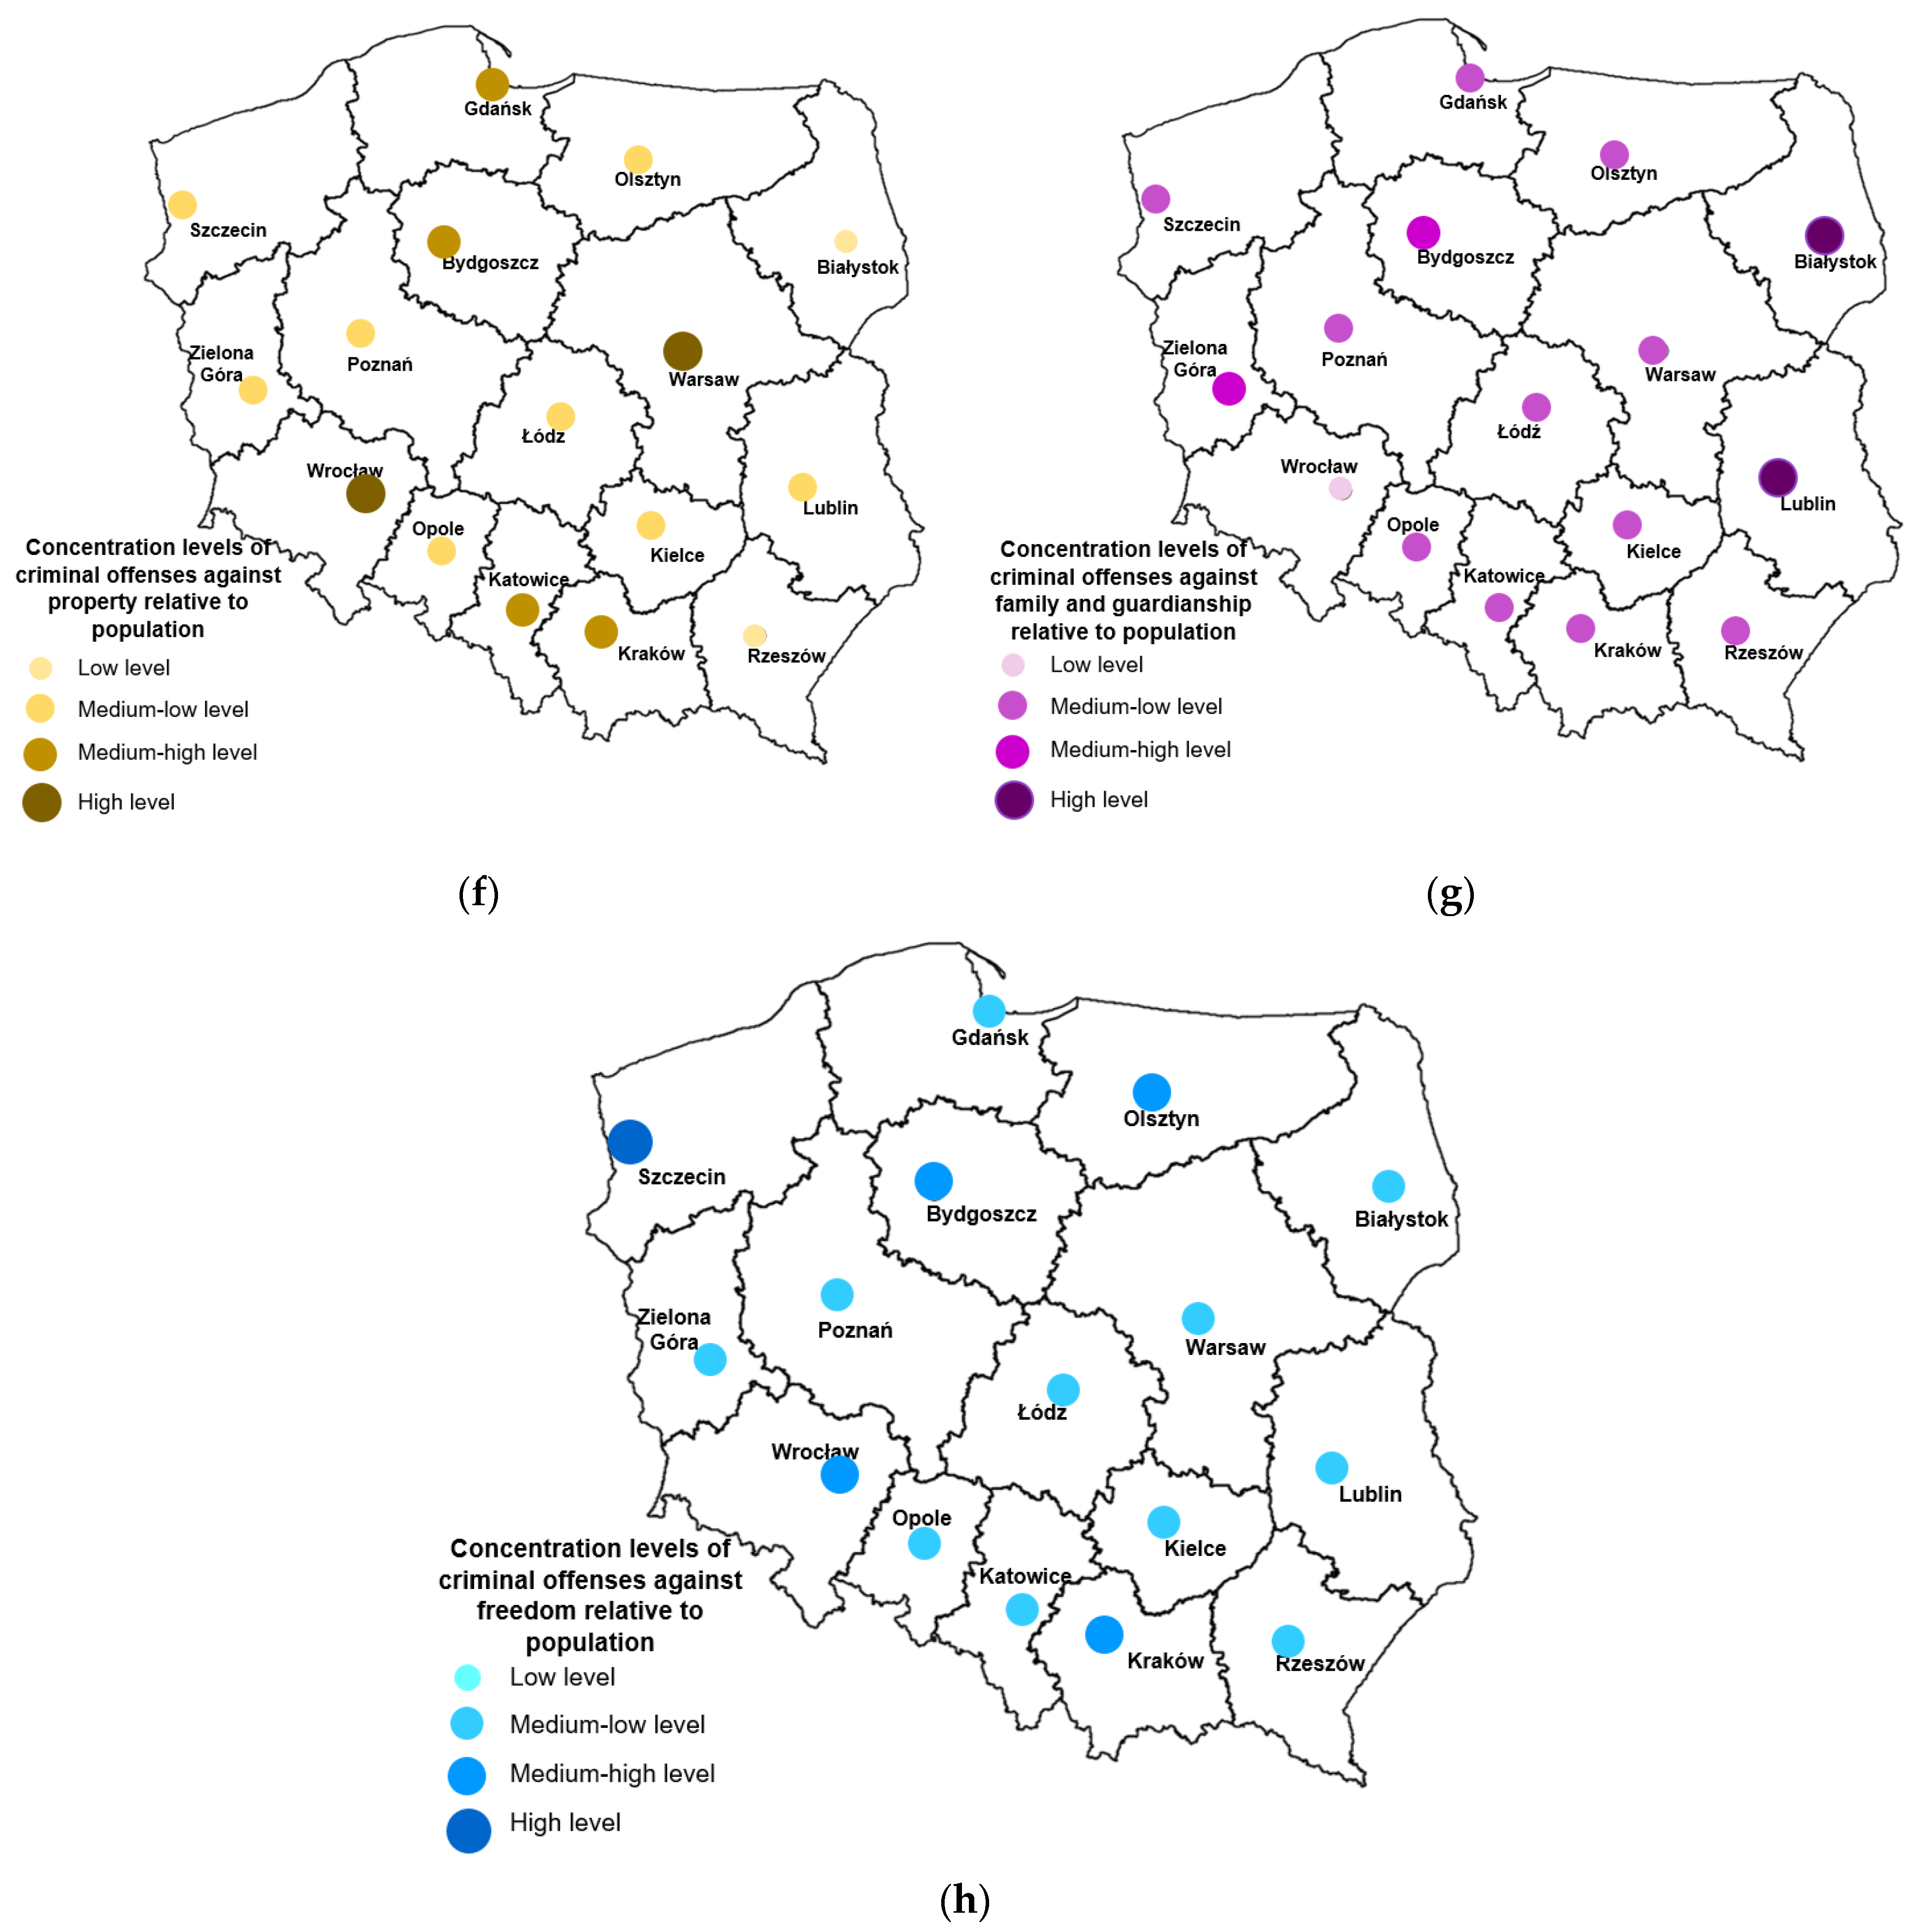
Figure 5 shows the results, illustrating the spatial differentiation of studied cities in terms of the level of concentration of offenses in relation to their total population and for individual types of these offenses.
In general, the safest cities in terms of the concentration of total offenses (relative to the number of residents) were Rzeszów and Białystok (low level) and Bydgoszcz, Lublin, Łódź, Warsaw, Gdańsk and Olsztyn (medium–low level). Katowice was considered the most dangerous city (high level), while Wrocław, Zielona Góra, Kraków, Opole, Kielce, Poznań and Szczecin were considered moderately dangerous (medium–high level).
From the point of view of residents, however, the most important issue remains that of safety in the context of the occurrence of threats of a criminal nature, including offenses against life and health, which are offenses with the most severe consequences for residents and are threatened with the highest penalties under current laws in the Polish legal system.
The most dangerous cities for all criminal offenses were Wrocław, Warsaw, Poznań and Szczecin (high level) and Lublin, Łódź, Kraków and Gdańsk (medium–high level) (Figure 5b). For criminal offenses against life and health, the most dangerous cities were Poznań and Katowice (high level) and Lublin, Łódź, Białystok, Gdańsk, Kielce and Olsztyn (medium–high level) (Figure 5e). On the other hand, safe cities in terms of concentration of total criminal offenses included Katowice and Kielce (low level) and, in terms of criminal offenses against life and health, Warsaw, Opole and Szczecin. The results obtained show that the concentration of criminal offenses in the assessment of the state of safety in individual cities cannot be considered only from the point of view of total offenses, or even only those of a criminal nature, but each type of criminal offense should be considered separately, as their effects have different severity and are perceived differently by city residents.
4.2. Assessment of the Level of Security in the Surveyed Cities
The next stage of our research involved an assessment of the level of safety in the studied cities.
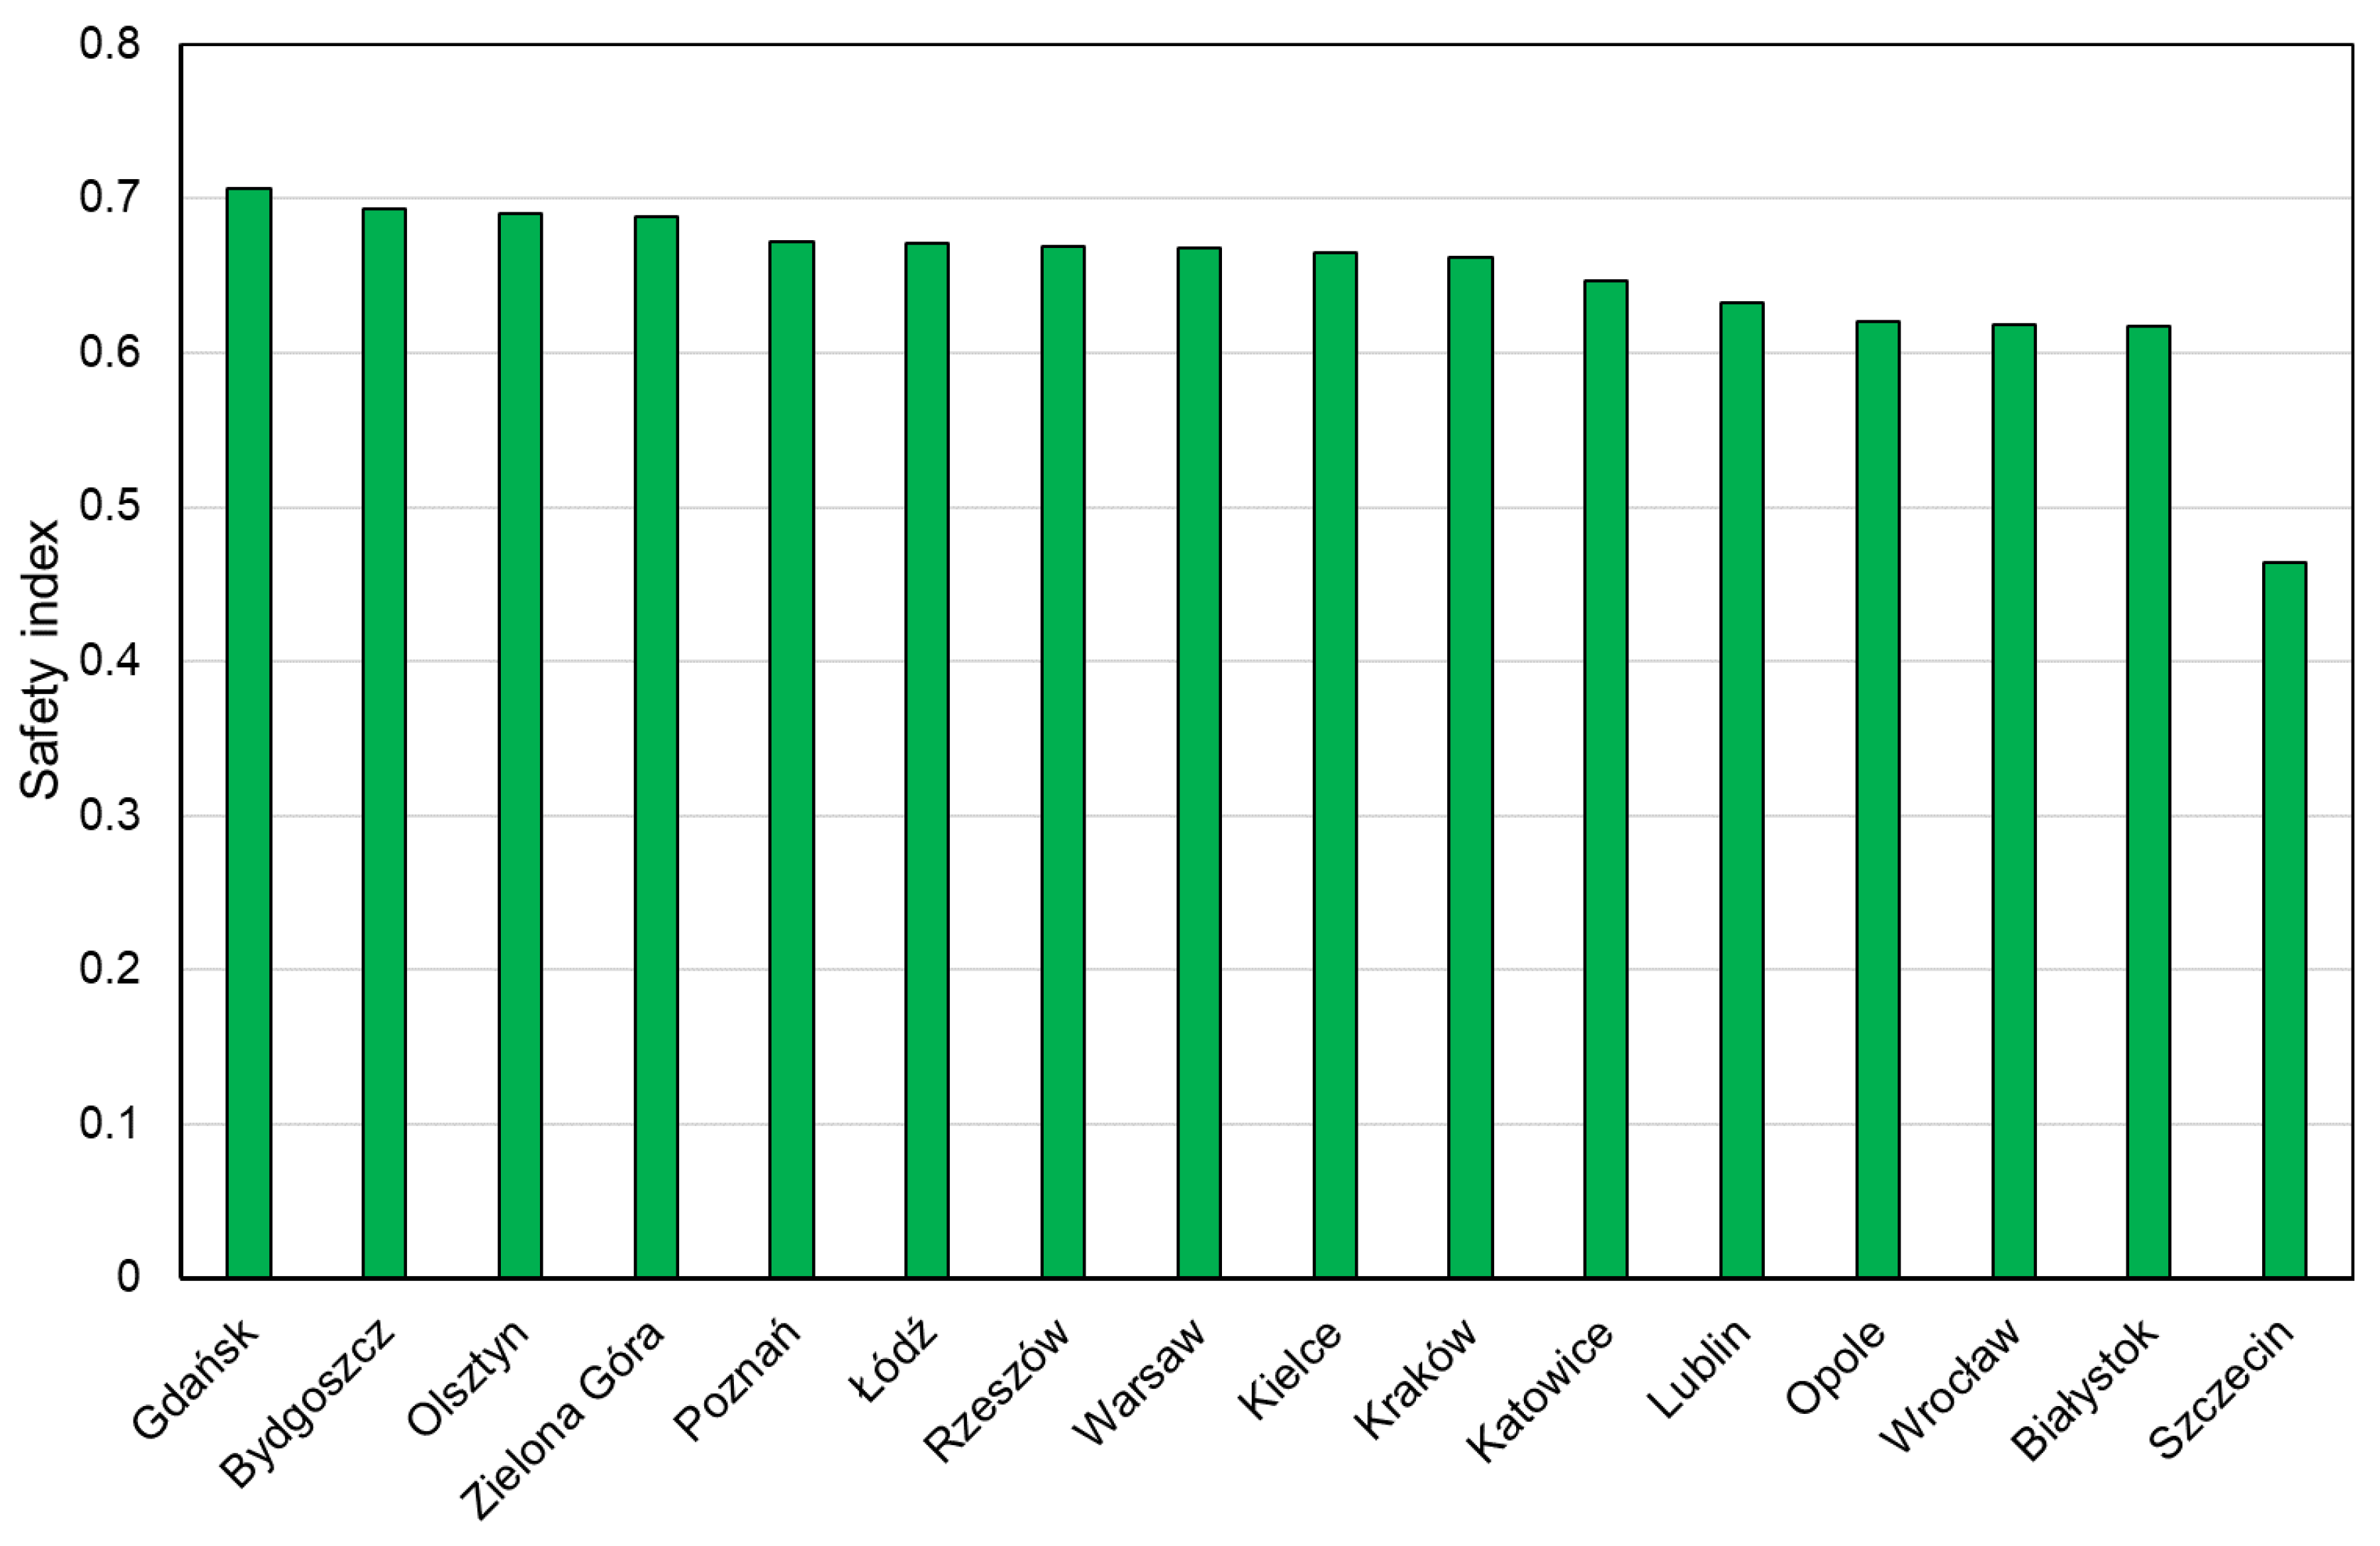
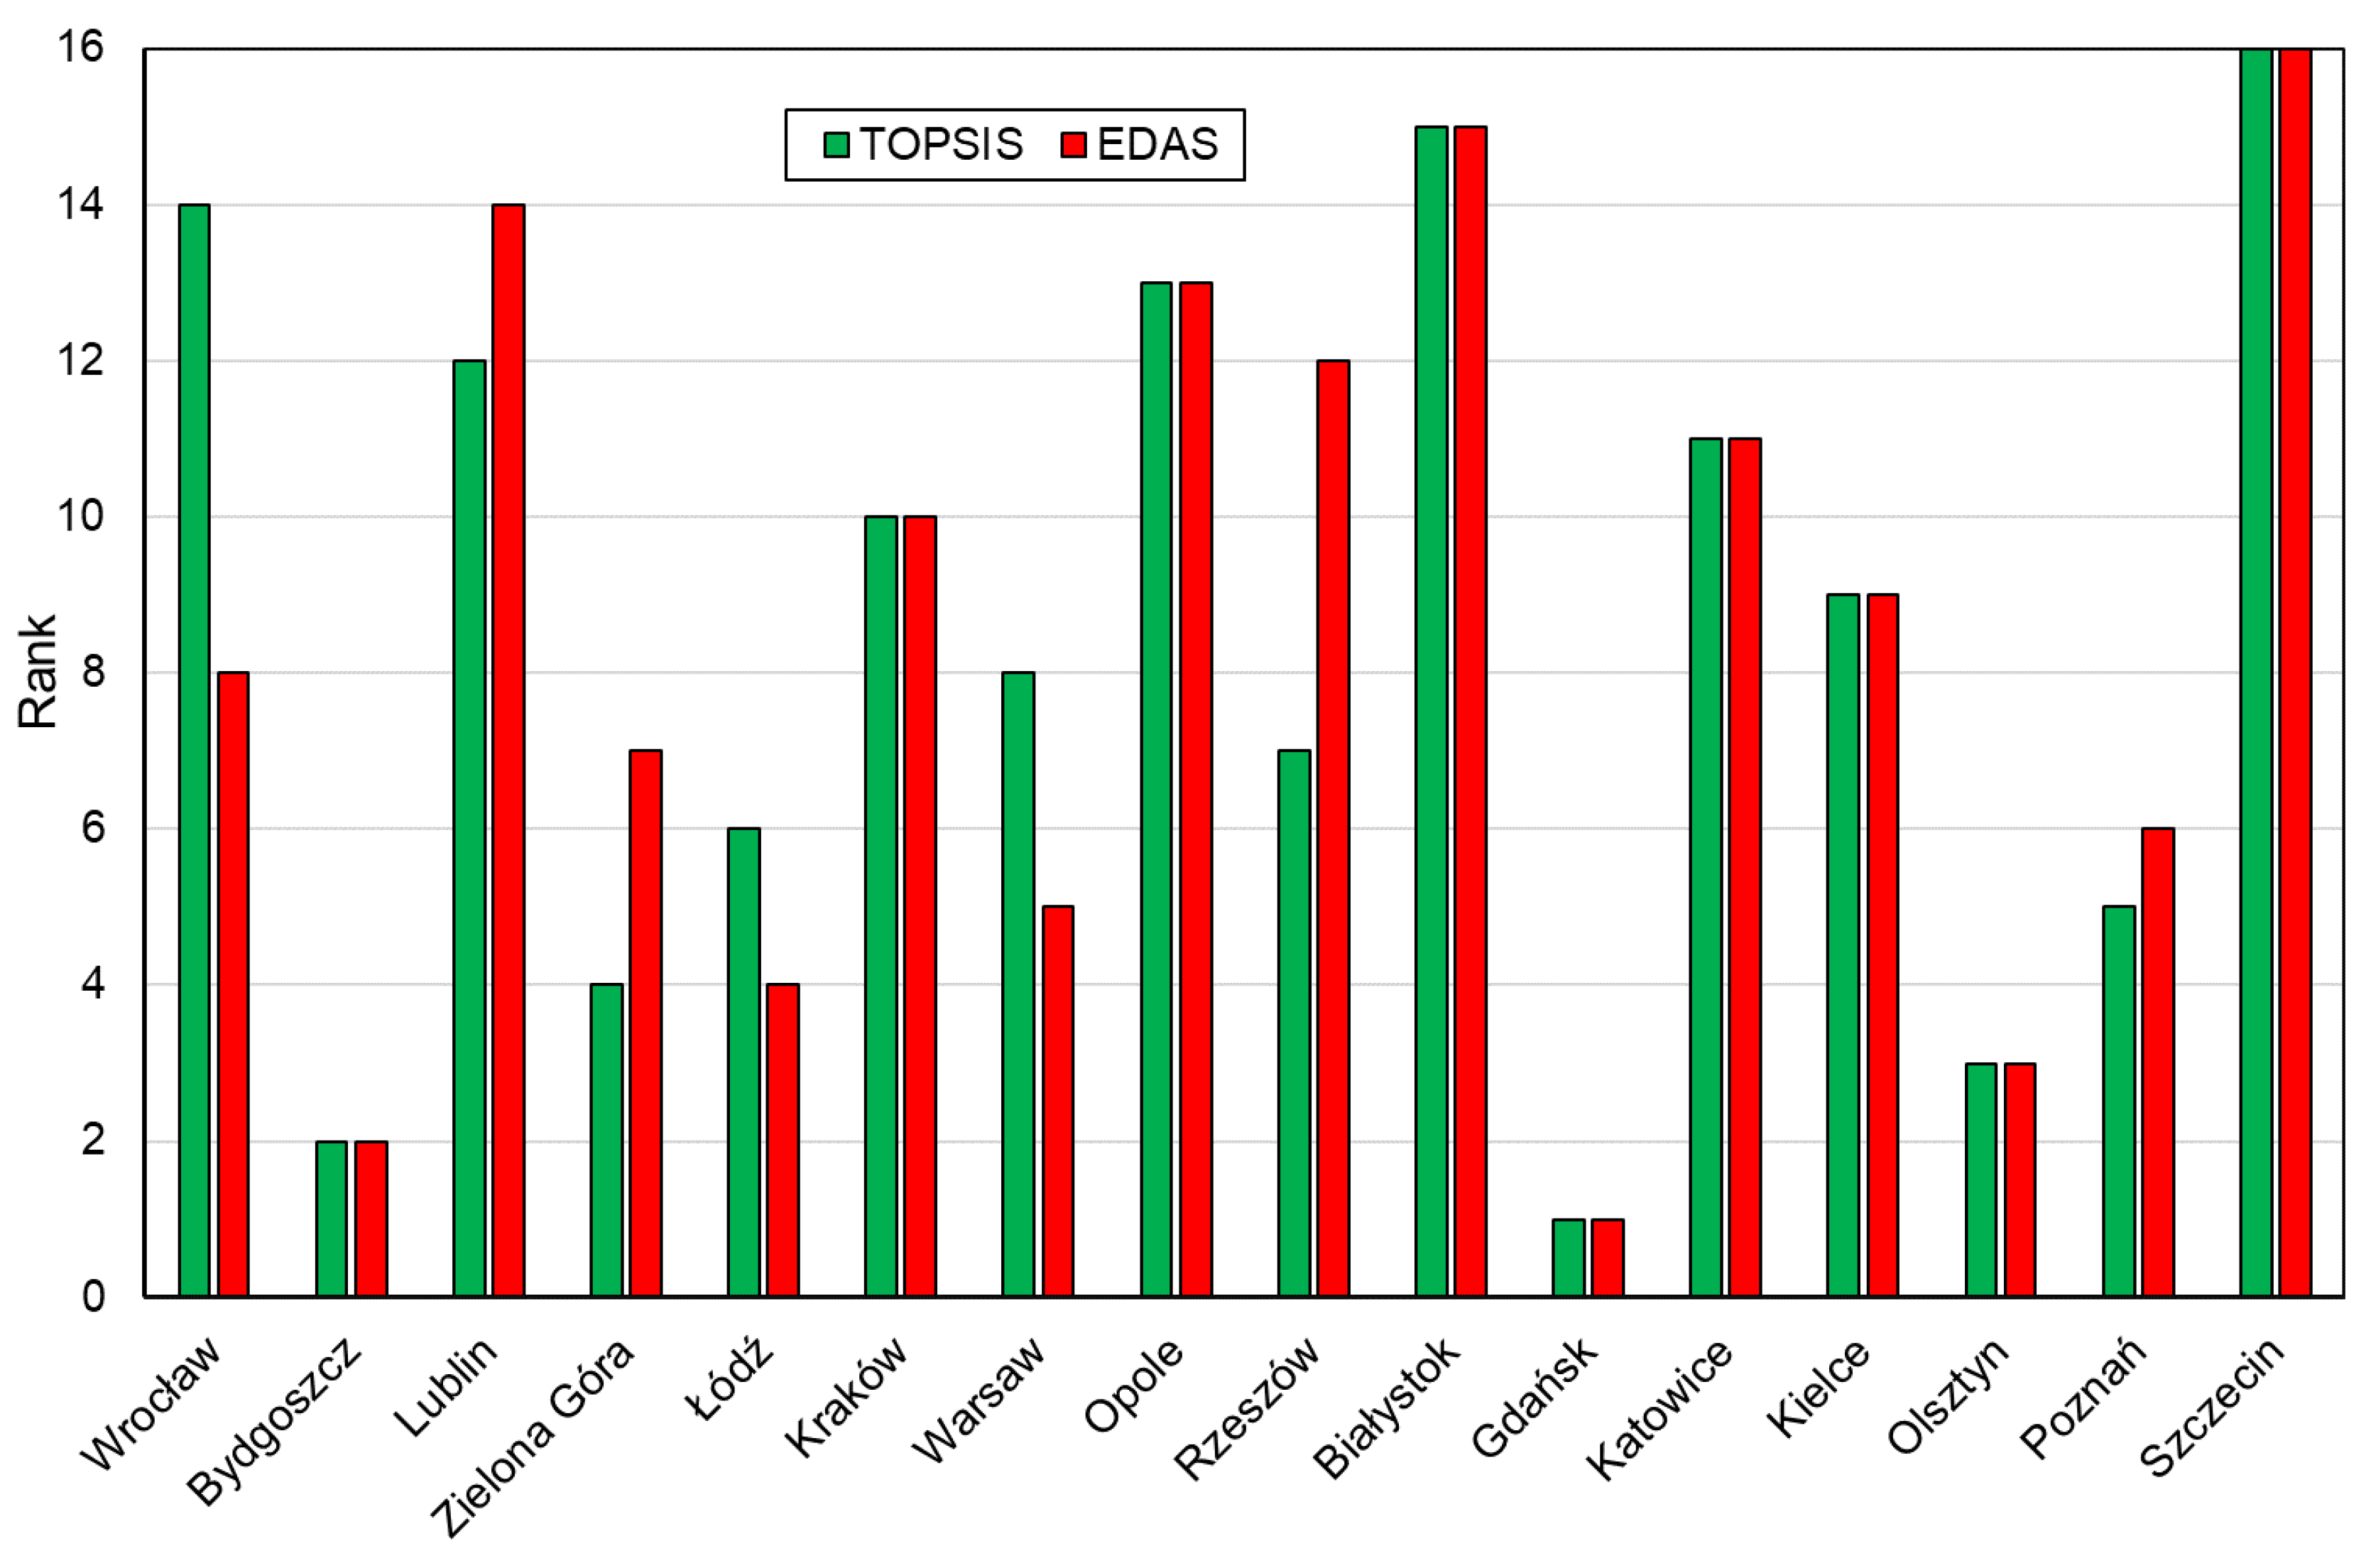
The methodology for determining the safety index, based on which the ranking of studied cities in terms of safety was determined, is discussed in Section 3, and the results are shown in Figure 6. The results of the sensitivity analysis of the effect of the weight values on the results obtained, as well as the verification of the results obtained by the TOPSIS method versus the results obtained by the EDAS method (the MCDM group of methods), are presented in Appendix B of this paper.
The analysis showed that the highest value of the safety index (Pi (Safety index)) was achieved by the city of Gdańsk (0.71). Bydgoszcz was ranked second and Olsztyn third. These cities were characterized by a relatively low concentration of the most serious crimes in relation to the number of residents, which significantly affect the perception of these cities as friendly to live in and also the perceptions of tourists.
The lowest score was given to Szczecin (0.46), which was characterized, during the period under study, by a very high concentration of economic offenses and criminal offenses against freedom, freedom of conscience, sexual freedom and morality. These values were almost three times higher than the average for the surveyed cities. Offenses against freedom are particularly dangerous, as they include rape, promotion of pedophiles or forced prostitution, among other crimes.
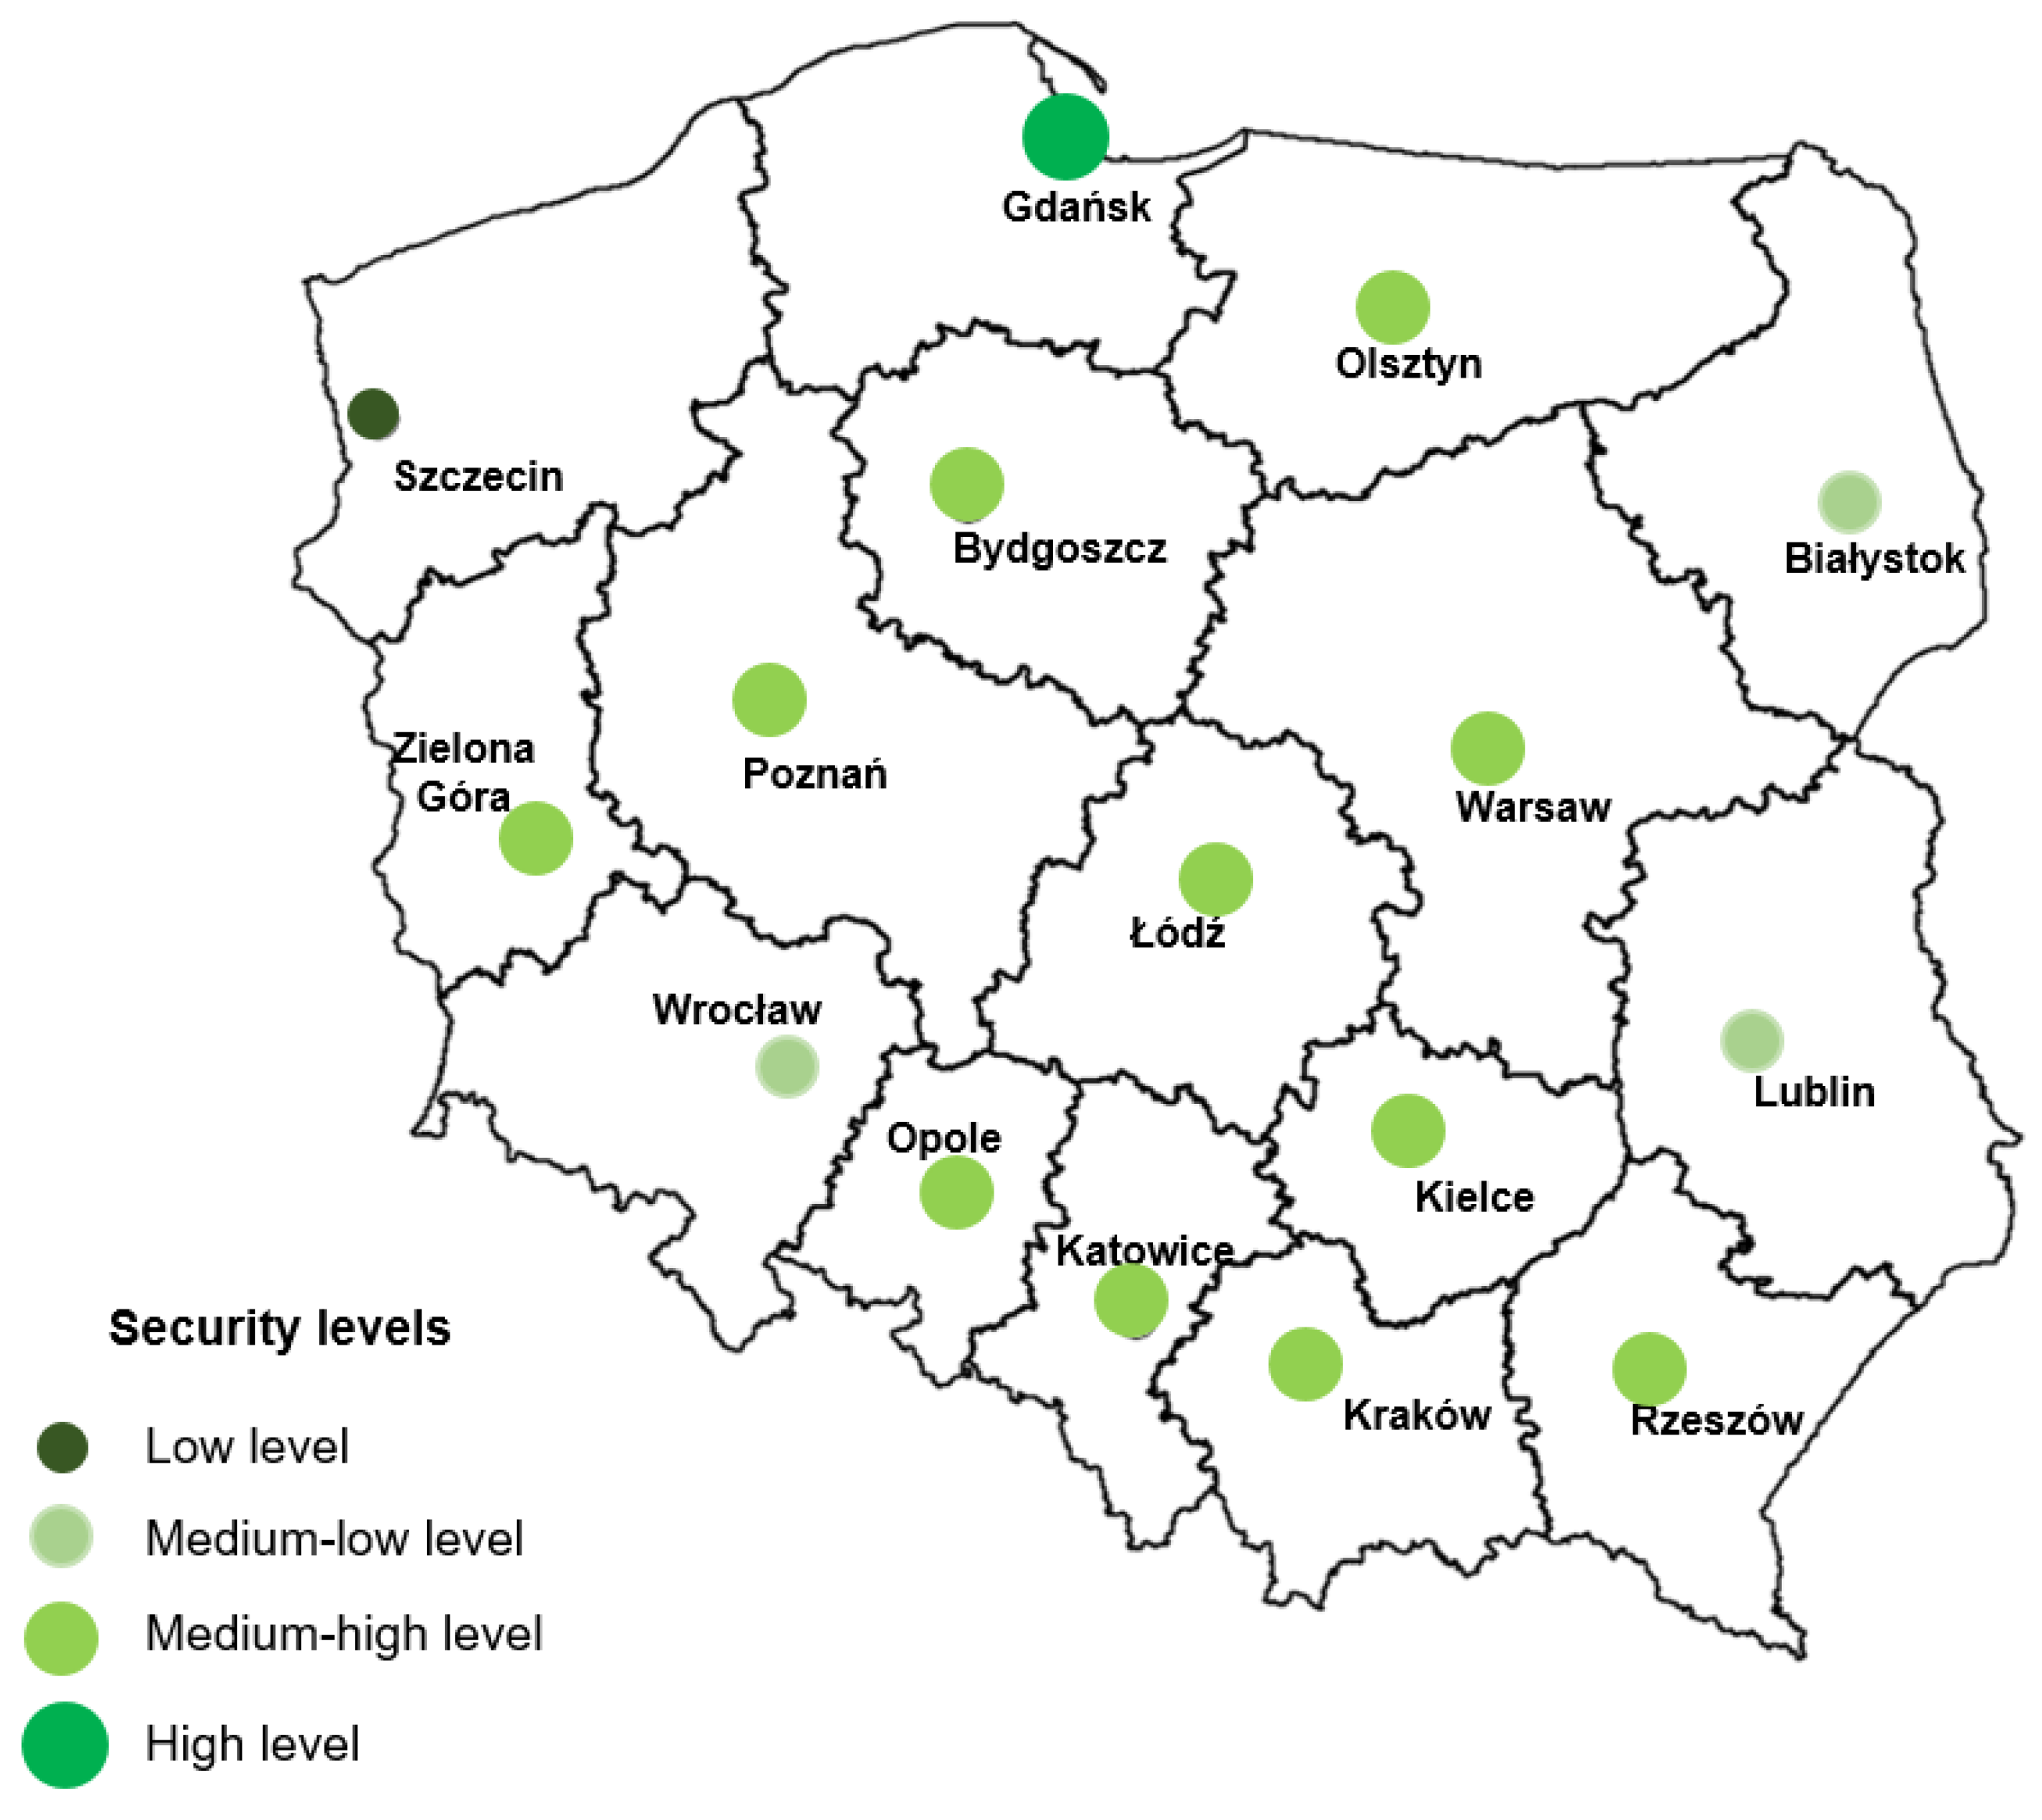
Based on the determined values of the safety index, cities were divided into four classes with different levels of safety. The results are presented graphically in Figure 7.
A high level of safety was reported for Gdańsk, considered a provincial city, a major cultural and academic center and, at the same time, a tourist city visited by a significant number of tourists each year. The medium–high level of safety is characterized by the vast majority of the surveyed population of cities. These are the following 10 cities: Bydgoszcz, Olsztyn, Zielona Góra, Poznań, Łódź, Rzeszów, Warsaw, Kielce, Kraków and Katowice. This result should be considered very good for both residents and visitors. A medium–low level of safety was found in Lublin, Opole, Wrocław and Bialystok. One city where a low level of safety was found was Szczecin.
The levels determined make it possible to conclude that cities located in the south of Poland and in the central–western part of the country are among the safest cities. The exceptions in this case were Szczecin and Wroclaw. By contrast, cities located in the east of the country were characterized by a lower degree of safety than those located in southern Poland.
The results indicate that cities characterized by high and medium–high levels of safety are well-developed cities, most often classified as wealthy (high GDP), that implement and develop modern solutions to facilitate their management and improve safety. These cities have increasingly effective monitoring and notification systems for dangerous incidents as well as modern communications systems that increase the effectiveness of intervention efforts. Thus, in these cases, one can see the clear impact of smart solutions on the safety of urban life. At the same time, the results and solutions used in the best cities should be used in those with slightly poorer results to improve their safety.
5. Discussion and Conclusions
Striving to achieve the status of a smart city is now becoming one of the priorities of most modern cities, including those located in Poland. Achieving this goal is a huge challenge for the authorities of these cities and individual countries. This is due to the multidimensionality of the issues related to the implementation of the smart cities concept and the economy of sustainable development as well as the growing number of urban residents. These factors raise a number of social, economic and environmental problems in the process, which should be addressed as the concept is implemented. The goal of these changes is to improve the quality of life of the population, taking into account the elements of the sustainable development economy, including mainly environmental ones. The complexity and multidimensionality of this issue mean that providing the best possible conditions for living in a smart city involves not only implementing modern technological solutions but also ensuring the safety of residents and all visitors to these cities. Currently, in addition to technological aspects, social issues are becoming increasingly important in these processes. The role and importance of the human being, who, on the one hand, is to be a beneficiary of these changes and, on the other hand, should co-create this well-being and actively participate in its management, are growing [100].
One of the most important factors affecting the quality of life in a city is issues related to citizen safety. This paper addresses this social problem as key in the process of creating (building) smart cities. In order to assess and compare citizen safety in 16 provincial cities in Poland, a research methodology was developed using a set of indicators characterizing registered crime in these cities. The values of these indicators became the basis for determining crime concentration indices and safety indices of these cities. On the basis of the values of these indices, the ranking of studied cities and their safety levels were determined.
The research conducted showed that:
- –
- Over the 10 years studied (2013–2022), the entire study population of 16 cities saw a 22% decrease in total offenses. The largest decrease occurred in Poznań (by nearly 40%). By contrast, two cities, Warsaw and Katowice, registered an increase in offenses, by 0.2% and about 5%, respectively;
- –
- In the case of criminal offenses, there was a decrease of about 36% in the entire population studied. All cities reduced the number of criminal offenses, with the largest decrease recorded in Opole (by about 55%). The smallest decrease in this group of offenses, over the decade studied, took place in Gdańsk—by about 11%;
- –
- The number of economic offenses in the studied cities increased by 74% on average. The decrease in economic offenses occurred in two cities: in Poznań and Szczecin (by nearly 40%). The largest increase, on the other hand, occurred in Olsztyn (by nearly four times);
- –
- The concentration of total offenses (relative to the population) was highest, on an average annual basis, in Katowice (1.67) and the lowest, in Rzeszów (0.64). As for offenses of a criminal nature, the worst situation was in Wrocław (1.10) and the best was in Katowice and Kielce (0.82). On the other hand, the concentration of economic offenses was highest in Szczecin (2.04) and lowest in Katowice (0.43);
- –
- Among the surveyed cities, Gdańsk has the highest value of the safety index in terms of the concentration of crimes in relation to the number of residents, and Szczecin has the lowest. These cities occupy the first and last positions, respectively, in the created safety ranking;
- –
- The studied populations of cities in the vast majority (11 out of 16 cities) had high and medium–high levels of safety. There was a high level of safety in Gdańsk and a medium–high level of safety in Bydgoszcz, Olsztyn, Zielona Góra, Poznań, Łódź, Rzeszów, Warsaw, Kielce, Kraków and Katowice. There was a medium–low level of safety in four cities (Lublin, Opole, Wrocław and Białystok) and a low level in one (Szczecin).
The results unequivocally show great variation in crime and, thus, also in the state of safety in the cities studied. The findings also provide an opportunity to compare the state of safety in individual cities, which should be an important source of knowledge for the managers of these cities and national authorities. The goal of such analyses should be to improve the state of safety. Undoubtedly, the use of new technologies provides such opportunities. It is also obvious that their implementation is expensive and not all cities can afford it to the same extent. National and regional security policies, on the other hand, should take this into account.
The research also indicates that, as in the rest of the world, there are no crime-free cities in Poland, either criminally or economically. However, striving to achieve the status of smart cities should mobilize their authorities and residents to minimize these offenses. The results obtained for cities in Poland should be assessed as acceptable, and these cities should be assessed as safe. Among the cities with a high or medium–high level of safety are large urban centers with well-developed ICT infrastructure and implementing smart solutions, which is confirmed by their presence (Warsaw, Wrocław and Kraków) in international smart cities rankings such as the IMD Smart City Index [34] and the IESE Cities in Motion Index [35].
As the literature [15,101,102] indicates, cities that are smarter and use modern technologies to fight crime have a certain advantage over cities that do not use these technologies. An important factor is also accessibility to these technologies by citizens (taking into account the requirements of RODO, of course). Such accessibility gives residents the opportunity to actively participate in the life of the urban community and respond early to dangerous situations that may result in criminal acts. It goes without saying that such accessibility facilitates the work of security services.
At this point, it is worth mentioning the results of studies included in some studies [103]. According to them, the implementation of modern technologies can improve the lives of residents (smart city) by an average of 10 to 30% in each key aspect. These studies also show that, in a smart city, the cost of living decreases by 3%, water consumption drops by up to 30% and the time wasted on commuting decreases by about 15%. In terms of ensuring the safety of life in a smart city, the number of fatal accidents can be as much as 10% less, the number of offenses can decrease by nearly 40% (!) and the response time of emergency services to a call is reduced by about 35%. These results clearly indicate that cities that have and implement high-tech infrastructure can affect the quality of life of residents, including their safety.
However, it should be remembered that in the concept of a smart city, technology alone, regardless of its type and application, only partially contributes to reducing crime [88]. In the context of ensuring security in smart cities, in addition to the use of smart solutions, it is also necessary to properly plan urban and suburban spaces and take into account the nature of the city [104,105,106]. It is also necessary to consider the fact that the application of new technological solutions, while reducing the amount of one type of crime (criminal, traffic, etc.), activates other types of crime (such as cybercrime). Thus, the process of studying the impact of smart solutions on the structure and amount of crime and consequently on urban safety requires a comprehensive and multidimensional approach. Such research requires reliable data [107].
One of the elements of concern for the quality of life of residents is strengthening their sense of safety, which involves building awareness of threats and emergency response skills. The use of “smart” technology provides such opportunities.
With advanced monitoring systems, smart cities can, therefore, significantly reduce crime. Systems deployed in public places using artificial intelligence, deep learning and machine learning allow precise monitoring of risky behavior of people, responding to violations and predicting threats for effective prevention. An example is the increasingly widespread use of smart cameras, which not only automatically analyze recorded footage in real time but can also detect motion and sound, measure the flow of people and recognize vehicle license plates [16,108,109]. Such systems using artificial intelligence can detect suspicious behavior and activate appropriate services. This undoubtedly provides an opportunity to reduce the likelihood of dangerous incidents and even prevent terrorist attacks.
However, in the context of the increasingly widespread use of modern technology, it is also necessary to mention citizens’ right to privacy. The increasingly modern technologies used in the modern world, unfortunately, raise concerns about preserving the right to privacy [110].
In summary, intelligent solutions used in cities are able to influence reductions in the threat of crime, especially criminal offenses, but their use requires very precise legal regulations.
Data obtained from such systems should be used for a well-defined and formally sanctioned purpose, such as rapid response to dangerous events, prevention, identification of offenders or criminal proceedings [111].
In the context of the Polish cities included in this study (those already considered “smart” as well as those aspiring to be part of this group), as well as others, it is worth mentioning solutions that are able to improve the state of safety in these cities.
First of all, it seems necessary to develop monitoring systems. It also seems reasonable to provide residents with access to the National Security Threat Map. This should sensitize them to unconventional behavior and indicate places where they should exercise heightened caution. It also makes sense to create strategic programs that address the issue of improving safety based on new technologies and regional community activity. It is worth taking advantage of the experience of other cities in these processes. Such an example is the city of Neom in Saudi Arabia and many others where such measures are being taken. Finding crime patterns based on historical data would probably help predict and even prevent, for example, burglaries, which are steadily increasing in urban centers around the world [112]. In Polish cities, finding crime patterns using historical data and, e.g., machine learning, is still a major challenge. Programs to educate and promote appropriate citizen behavior should also be intensified.
To sum up the research conducted, it can be said that smart cities should be safe cities. In the process of building this safety, in addition to modern technologies, people and the entire legal system, which should take into account the changes made, are of key importance. Only such a holistic approach to this issue gives a chance to significantly improve the state of safety and citizens’ appreciation of smart solutions. At present, the concepts of smart cities and Human Smart Cities increasingly point to the increasing participation of citizens in the creation and implementation of modern solutions, especially in the urban environment [113]. Smart cities should be viewed as open spatiotemporal systems of social relations consisting of subsystems, linking various activities and groups. It should also be taken into account that most urban activities are not implemented solely on the basis of the decisions of a single individual [114,115].
Let the role and importance of citizens and their knowledge in the creation of modern cities be evidenced by the definition of smart cities included in a study [116] by Albino et al. which reads, “A smart city is a city of people who have many opportunities to use their human potential and lead creative lives. From this point of view, a term related to a smart city is a knowledge city. It is a city that is designed to encourage the nurturing and development of knowledge”.
The research conducted and the results obtained also indicate the need for further studies of the state of city safety and crime. It seems reasonable to study various types of crime not only in cities but also in individual provinces. Monitoring changes in the indicators and indices presented should provide ongoing information for the services responsible for safety.
Author Contributions
Conceptualization, M.T. and J.B.; methodology, J.B. and M.T.; software, M.T. and J.B.; formal analysis, J.B. and M.T.; investigation, J.B. and M.T.; resources, M.T. and J.B.; data curation, M.T. and J.B.; writing—original draft preparation, M.T. and J.B.; writing—review and editing, J.B. and M.T.; visualization, M.T.; supervision, M.T. and J.B.; project administration, M.T. and J.B.; funding acquisition, M.T. All authors have read and agreed to the published version of the manuscript.
Funding
This publication was funded by the statutory research performed at Silesian University of Technology, Department of Production Engineering, Faculty of Organization and Management and Department of Safety Engineering, Faculty of Mining, Safety Engineering, and Industrial Automation (06/030/BKM23/0079).
Data Availability Statement
Data are contained within the Local data bank: https://bdl.stat.gov.pl/bdl/dane/podgrup/tablica.
Conflicts of Interest
The authors declare no conflict of interest.
Appendix A
The results of calculating the concentration of crime for individual sub-years are presented in Table A1, Table A2, Table A3, Table A4, Table A5, Table A6, Table A7, Table A8, Table A9 and Table A10.

Table A1.
Values of crime concentration ratios (LQn) in 2013.
| Grand Total | Criminal Offense | Economic Offense | Traffic Offense | Against Life and Health | Against Property | Against Family and Guardianship | Against Freedom | Against Public Safety and Safety in Transport | |
|---|---|---|---|---|---|---|---|---|---|
| Wroclaw | 1.42 | 1.05 | 0.49 | 1.23 | 1.07 | 1.60 | 0.68 | 1.39 | 1.39 |
| Bydgoszcz | 0.78 | 0.89 | 1.92 | 0.61 | 1.06 | 0.88 | 1.49 | 0.61 | 1.06 |
| Lublin | 0.84 | 1.02 | 0.84 | 1.25 | 1.07 | 0.81 | 2.67 | 0.35 | 1.09 |
| Zielona Góra | 0.92 | 0.92 | 1.31 | 1.44 | 0.80 | 0.64 | 1.68 | 0.97 | 1.06 |
| Lodz | 0.93 | 1.05 | 0.72 | 1.27 | 1.30 | 0.82 | 1.22 | 0.69 | 1.00 |
| Krakow | 1.07 | 1.07 | 0.59 | 1.62 | 0.84 | 1.18 | 0.81 | 1.30 | 0.85 |
| Warsaw | 0.84 | 1.04 | 0.74 | 1.50 | 0.70 | 1.25 | 0.94 | 0.81 | 1.34 |
| Opole | 1.18 | 0.96 | 0.92 | 2.03 | 0.73 | 0.80 | 0.49 | 1.34 | 2.31 |
| Rzeszow | 0.65 | 0.96 | 1.05 | 1.56 | 0.88 | 0.71 | 1.09 | 0.87 | 1.48 |
| Bialystok | 0.60 | 0.91 | 1.04 | 2.52 | 0.92 | 0.37 | 2.11 | 0.77 | 1.64 |
| Gdansk | 0.98 | 0.83 | 2.84 | 0.32 | 1.11 | 1.29 | 0.40 | 1.23 | 1.28 |
| Katowice | 1.57 | 0.95 | 1.51 | 0.40 | 1.66 | 1.10 | 0.82 | 0.63 | 0.95 |
| Kielce | 0.98 | 0.81 | 2.58 | 0.58 | 1.10 | 0.69 | 1.12 | 0.72 | 1.45 |
| Olsztyn | 0.71 | 1.02 | 0.84 | 1.38 | 1.81 | 0.45 | 0.93 | 1.34 | 0.88 |
| Poznan | 1.41 | 1.01 | 1.14 | 0.61 | 1.32 | 1.03 | 0.96 | 1.03 | 0.67 |
| Szczecin | 0.95 | 1.01 | 0.84 | 1.39 | 0.98 | 0.78 | 1.16 | 3.08 | 0.33 |
Table A2.
Values of crime concentration ratios (LQn) in 2014.
| Grand Total | Criminal Offense | Economic Offense | Traffic Offense | Against Life and Health | Against Property | Against Family and Guardianship | Against Freedom | Against Public Safety and Safety in Transport | |
|---|---|---|---|---|---|---|---|---|---|
| Wroclaw | 1.31 | 1.07 | 0.72 | 1.01 | 0.97 | 1.44 | 0.58 | 0.98 | 1.26 |
| Bydgoszcz | 0.67 | 0.92 | 1.27 | 1.19 | 0.66 | 1.00 | 1.03 | 1.31 | 1.11 |
| Lublin | 0.87 | 0.93 | 1.42 | 0.81 | 1.26 | 0.64 | 1.13 | 2.74 | 0.41 |
| Zielona Góra | 1.19 | 0.85 | 1.72 | 1.20 | 0.58 | 0.87 | 1.11 | 1.11 | 1.61 |
| Lodz | 0.90 | 1.03 | 0.77 | 1.49 | 1.20 | 0.77 | 0.70 | 1.11 | 1.40 |
| Krakow | 1.07 | 1.05 | 0.74 | 1.11 | 1.26 | 0.93 | 0.89 | 1.20 | 0.80 |
| Warsaw | 0.90 | 1.06 | 0.69 | 1.38 | 0.71 | 1.47 | 0.66 | 1.31 | 1.09 |
| Opole | 1.21 | 0.95 | 1.14 | 1.23 | 0.84 | 0.92 | 0.51 | 0.54 | 4.69 |
| Rzeszow | 0.68 | 0.94 | 1.07 | 1.69 | 0.84 | 0.68 | 0.89 | 0.75 | 2.63 |
| Bialystok | 0.56 | 0.99 | 0.80 | 1.99 | 1.60 | 0.33 | 1.48 | 2.21 | 0.58 |
| Gdansk | 0.83 | 0.98 | 1.19 | 0.75 | 1.08 | 1.12 | 0.59 | 1.16 | 1.23 |
| Katowice | 1.80 | 0.82 | 2.54 | 0.31 | 1.55 | 0.92 | 0.60 | 1.71 | 0.68 |
| Kielce | 0.97 | 0.90 | 1.56 | 0.87 | 1.02 | 0.56 | 1.44 | 1.66 | 0.74 |
| Olsztyn | 0.86 | 0.90 | 1.47 | 1.06 | 0.91 | 0.76 | 1.11 | 0.83 | 1.56 |
| Poznan | 1.26 | 1.04 | 0.85 | 0.79 | 1.13 | 1.31 | 2.25 | 0.32 | 0.94 |
| Szczecin | 1.06 | 0.95 | 1.18 | 1.00 | 0.82 | 0.92 | 2.65 | 0.42 | 1.20 |
Table A3.
Values of crime concentration ratios (LQn) in 2015.
| Grand Total | Criminal Offense | Economic Offense | Traffic Offense | Against Life and Health | Against Property | Against Family and Guardianship | Against Freedom | Against Public Safety and Safety in Transport | |
|---|---|---|---|---|---|---|---|---|---|
| Wroclaw | 1.35 | 1.08 | 0.70 | 0.99 | 0.92 | 1.61 | 0.71 | 0.67 | 1.40 |
| Bydgoszcz | 0.67 | 0.94 | 1.07 | 1.16 | 0.81 | 0.97 | 1.50 | 1.09 | 0.85 |
| Lublin | 0.77 | 1.02 | 0.79 | 1.78 | 0.97 | 0.63 | 1.55 | 1.68 | 0.60 |
| Zielona Góra | 1.13 | 0.87 | 1.52 | 1.23 | 0.79 | 0.66 | 1.55 | 1.08 | 1.13 |
| Lodz | 0.94 | 1.01 | 0.92 | 1.23 | 1.05 | 0.90 | 0.81 | 1.14 | 1.14 |
| Krakow | 1.09 | 1.00 | 1.06 | 0.79 | 0.90 | 1.29 | 1.01 | 0.89 | 0.98 |
| Warsaw | 0.96 | 1.05 | 0.77 | 1.15 | 0.81 | 1.37 | 0.77 | 1.09 | 1.13 |
| Opole | 1.34 | 0.97 | 1.11 | 1.16 | 0.90 | 0.81 | 0.93 | 0.47 | 2.91 |
| Rzeszow | 0.65 | 0.90 | 1.26 | 1.59 | 1.00 | 0.49 | 1.02 | 0.89 | 2.22 |
| Bialystok | 0.59 | 0.90 | 1.23 | 1.55 | 1.21 | 0.41 | 1.79 | 1.45 | 0.76 |
| Gdansk | 0.82 | 1.00 | 1.01 | 0.99 | 0.99 | 1.07 | 0.84 | 0.93 | 1.16 |
| Katowice | 1.49 | 0.90 | 1.61 | 0.63 | 1.35 | 0.78 | 0.98 | 1.52 | 0.63 |
| Kielce | 0.86 | 0.87 | 1.63 | 0.91 | 1.18 | 0.50 | 2.24 | 1.08 | 0.69 |
| Olsztyn | 0.89 | 0.92 | 1.40 | 0.84 | 1.31 | 0.72 | 1.17 | 1.17 | 0.74 |
| Poznan | 1.25 | 1.00 | 1.13 | 0.57 | 1.35 | 1.21 | 0.96 | 0.82 | 0.75 |
| Szczecin | 1.00 | 0.94 | 1.21 | 1.03 | 1.15 | 0.63 | 1.89 | 0.49 | 1.48 |
Table A4.
Values of crime concentration ratios (LQ) in 2016.
| Grand Total | Criminal Offense | Economic Offense | Traffic Offense | Against Life and Health | Against Property | Against Family and Guardianship | Against Freedom | Against Public Safety and Safety in Transport | |
|---|---|---|---|---|---|---|---|---|---|
| Wroclaw | 1.33 | 1.11 | 0.55 | 1.22 | 1.03 | 1.44 | 0.75 | 0.74 | 1.16 |
| Bydgoszcz | 0.70 | 0.97 | 1.09 | 1.01 | 1.08 | 0.85 | 1.52 | 1.39 | 0.55 |
| Lublin | 0.77 | 0.95 | 1.10 | 1.33 | 0.98 | 0.65 | 1.72 | 1.44 | 0.59 |
| Zielona Góra | 0.89 | 0.93 | 1.08 | 1.58 | 1.13 | 0.49 | 1.72 | 1.26 | 0.88 |
| Lodz | 0.88 | 1.06 | 0.62 | 1.78 | 1.04 | 0.86 | 0.90 | 0.90 | 1.33 |
| Krakow | 1.14 | 0.95 | 1.31 | 0.71 | 0.88 | 1.12 | 1.00 | 0.93 | 1.14 |
| Warsaw | 1.02 | 1.00 | 1.03 | 0.85 | 0.82 | 1.48 | 0.79 | 0.99 | 1.10 |
| Opole | 1.17 | 0.95 | 1.04 | 1.46 | 0.74 | 0.85 | 0.75 | 0.81 | 2.57 |
| Rzeszow | 0.61 | 0.93 | 1.02 | 2.14 | 0.81 | 0.57 | 1.08 | 0.30 | 6.21 |
| Bialystok | 0.61 | 0.92 | 1.16 | 1.64 | 1.13 | 0.45 | 1.27 | 1.56 | 0.92 |
| Gdansk | 0.89 | 0.97 | 1.23 | 0.78 | 1.08 | 1.07 | 0.93 | 0.92 | 0.99 |
| Katowice | 1.36 | 0.92 | 1.51 | 0.80 | 1.20 | 0.76 | 0.83 | 1.47 | 0.83 |
| Kielce | 0.96 | 0.81 | 2.30 | 0.55 | 1.08 | 0.65 | 1.88 | 0.85 | 0.96 |
| Olsztyn | 0.97 | 0.93 | 1.40 | 0.82 | 1.34 | 0.73 | 0.90 | 1.89 | 0.57 |
| Poznan | 1.13 | 1.10 | 0.57 | 1.04 | 1.56 | 0.98 | 1.23 | 0.75 | 0.76 |
| Szczecin | 0.98 | 0.97 | 1.04 | 1.21 | 0.84 | 0.87 | 1.48 | 0.81 | 1.18 |
Table A5.
Values of crime concentration ratios (LQ) in 2017.
| Grand Total | Criminal Offense | Economic Offense | Traffic Offense | Against Life and Health | Against Property | Against Family and Guardianship | Against Freedom | Against Public Safety and Safety in Transport | |
|---|---|---|---|---|---|---|---|---|---|
| Wroclaw | 1.20 | 1.14 | 0.52 | 1.64 | 0.76 | 1.66 | 0.68 | 0.91 | 1.19 |
| Bydgoszcz | 0.67 | 1.02 | 0.85 | 1.29 | 1.14 | 0.79 | 1.27 | 1.58 | 0.56 |
| Lublin | 0.83 | 0.91 | 1.34 | 0.98 | 1.17 | 0.72 | 1.11 | 1.96 | 0.53 |
| Zielona Góra | 0.97 | 0.97 | 1.09 | 1.12 | 1.18 | 0.68 | 1.72 | 0.96 | 0.73 |
| Lodz | 0.85 | 1.07 | 0.68 | 1.73 | 0.95 | 0.95 | 0.70 | 1.48 | 1.06 |
| Krakow | 1.45 | 0.75 | 2.49 | 0.35 | 0.92 | 1.13 | 0.80 | 0.79 | 1.56 |
| Warsaw | 0.95 | 1.10 | 0.63 | 1.28 | 0.78 | 1.59 | 0.78 | 1.06 | 1.03 |
| Opole | 0.97 | 1.06 | 0.62 | 2.48 | 0.89 | 0.77 | 0.37 | 0.95 | 4.17 |
| Rzeszow | 0.65 | 0.89 | 1.30 | 1.48 | 0.81 | 0.66 | 0.90 | 0.59 | 3.50 |
| Bialystok | 0.57 | 1.00 | 0.76 | 2.44 | 1.18 | 0.43 | 1.57 | 1.47 | 0.79 |
| Gdansk | 0.92 | 0.94 | 1.29 | 0.79 | 1.18 | 0.86 | 0.69 | 1.30 | 1.07 |
| Katowice | 1.48 | 0.94 | 1.27 | 0.84 | 1.47 | 0.76 | 0.72 | 1.30 | 0.93 |
| Kielce | 0.91 | 0.81 | 1.89 | 0.70 | 1.38 | 0.46 | 1.42 | 1.51 | 0.80 |
| Olsztyn | 0.86 | 0.98 | 1.07 | 1.02 | 1.47 | 0.68 | 0.96 | 1.13 | 0.86 |
| Poznan | 1.08 | 1.02 | 0.96 | 0.76 | 1.41 | 0.97 | 0.93 | 1.02 | 0.81 |
| Szczecin | 0.95 | 1.14 | 0.36 | 3.44 | 0.80 | 0.72 | 4.70 | 0.33 | 1.12 |
Table A6.
Values of crime concentration ratios (LQ) in 2018.
| Grand Total | Criminal Offense | Economic Offense | Traffic Offense | Against Life and Health | Against Property | Against Family and Guardianship | Against Freedom | Against Public Safety and Safety in Transport | |
|---|---|---|---|---|---|---|---|---|---|
| Wroclaw | 1.19 | 1.12 | 0.59 | 1.21 | 0.93 | 1.56 | 0.59 | 0.61 | 1.84 |
| Bydgoszcz | 0.80 | 0.90 | 1.41 | 0.72 | 0.74 | 1.33 | 1.25 | 1.50 | 0.58 |
| Lublin | 0.77 | 0.99 | 0.97 | 1.36 | 1.10 | 0.58 | 1.17 | 3.31 | 0.38 |
| Zielona Góra | 1.22 | 0.92 | 1.33 | 0.95 | 0.99 | 0.78 | 1.02 | 2.06 | 0.66 |
| Lodz | 0.84 | 1.01 | 0.90 | 1.46 | 1.03 | 0.84 | 0.60 | 0.92 | 2.08 |
| Krakow | 0.91 | 1.05 | 0.79 | 1.17 | 0.80 | 1.30 | 0.64 | 0.96 | 1.64 |
| Warsaw | 1.03 | 1.04 | 0.88 | 0.88 | 1.05 | 1.29 | 0.59 | 1.35 | 0.95 |
| Opole | 0.96 | 1.02 | 0.77 | 2.15 | 0.75 | 0.76 | 0.62 | 1.56 | 1.71 |
| Rzeszow | 0.63 | 0.86 | 1.50 | 1.34 | 0.84 | 0.68 | 0.92 | 0.71 | 2.78 |
| Bialystok | 0.80 | 0.74 | 2.52 | 0.76 | 1.22 | 0.39 | 1.15 | 1.10 | 1.59 |
| Gdansk | 0.90 | 1.04 | 0.83 | 1.29 | 1.12 | 0.87 | 0.83 | 1.43 | 0.88 |
| Katowice | 1.37 | 0.92 | 1.36 | 0.77 | 1.42 | 0.66 | 0.81 | 1.98 | 0.67 |
| Kielce | 1.03 | 0.83 | 1.96 | 0.59 | 1.26 | 0.69 | 0.85 | 2.56 | 0.56 |
| Olsztyn | 0.87 | 0.86 | 1.75 | 0.82 | 0.61 | 1.50 | 0.69 | 0.77 | 1.96 |
| Poznan | 1.15 | 0.93 | 1.50 | 0.50 | 1.30 | 0.99 | 0.84 | 1.74 | 0.53 |
| Szczecin | 1.32 | 1.04 | 0.54 | 2.09 | 0.69 | 0.90 | 6.04 | 0.11 | 2.33 |
Table A7.
Values of crime concentration ratios (LQ) in 2019.
| Grand Total | Criminal Offense | Economic Offense | Traffic Offense | Against Life and Health | Against Property | Against Family and Guardianship | Against Freedom | Against Public Safety and Safety in Transport | |
|---|---|---|---|---|---|---|---|---|---|
| Wroclaw | 1.10 | 1.06 | 0.78 | 1.16 | 0.73 | 1.73 | 0.34 | 1.34 | 1.67 |
| Bydgoszcz | 0.88 | 0.79 | 2.23 | 0.47 | 0.84 | 1.49 | 0.39 | 4.50 | 0.47 |
| Lublin | 0.78 | 0.90 | 1.38 | 1.05 | 0.96 | 0.68 | 0.57 | 5.72 | 0.46 |
| Zielona Góra | 1.26 | 0.80 | 2.11 | 0.53 | 1.37 | 0.81 | 0.38 | 3.88 | 0.64 |
| Lodz | 0.78 | 0.99 | 0.95 | 1.43 | 1.25 | 0.66 | 0.39 | 1.86 | 1.65 |
| Krakow | 0.89 | 1.04 | 0.84 | 1.08 | 1.48 | 0.75 | 0.36 | 1.50 | 1.69 |
| Warsaw | 1.00 | 1.03 | 0.90 | 0.93 | 0.67 | 1.98 | 0.27 | 2.92 | 0.97 |
| Opole | 1.00 | 0.80 | 1.95 | 0.94 | 0.74 | 0.87 | 0.28 | 1.75 | 3.11 |
| Rzeszow | 0.56 | 0.95 | 0.97 | 2.05 | 1.14 | 0.38 | 0.65 | 2.87 | 1.17 |
| Bialystok | 0.71 | 0.83 | 1.70 | 1.18 | 1.08 | 0.59 | 0.41 | 3.19 | 1.20 |
| Gdansk | 1.05 | 0.86 | 1.75 | 0.61 | 1.04 | 1.23 | 0.53 | 1.50 | 0.96 |
| Katowice | 1.24 | 0.98 | 0.95 | 1.17 | 1.20 | 0.66 | 0.33 | 4.58 | 0.85 |
| Kielce | 1.09 | 0.75 | 2.52 | 0.44 | 1.40 | 0.55 | 0.65 | 3.81 | 0.54 |
| Olsztyn | 0.78 | 0.87 | 1.66 | 0.74 | 1.23 | 0.79 | 0.47 | 1.35 | 1.58 |
| Poznan | 0.90 | 1.12 | 0.55 | 1.38 | 1.49 | 0.81 | 0.51 | 3.30 | 0.52 |
| Szczecin | 2.01 | 1.20 | 0.32 | 2.34 | 0.71 | 0.69 | 13.28 | 0.07 | 2.29 |
Table A8.
Values of crime concentration ratios (LQ) in 2020.
| Grand Total | Criminal Offense | Economic Offense | Traffic Offense | Against Life and Health | Against Property | Against Family and Guardianship | Against Freedom | Against Public Safety and Safety in Transport | |
|---|---|---|---|---|---|---|---|---|---|
| Wroclaw | 1.12 | 1.13 | 0.53 | 1.57 | 0.79 | 1.59 | 0.69 | 0.58 | 1.94 |
| Bydgoszcz | 0.89 | 0.89 | 1.55 | 0.64 | 0.78 | 1.28 | 1.46 | 1.30 | 0.56 |
| Lublin | 0.78 | 0.94 | 1.21 | 0.96 | 1.25 | 0.64 | 1.86 | 1.11 | 0.61 |
| Zielona Góra | 1.24 | 0.93 | 1.23 | 0.98 | 1.17 | 0.66 | 1.49 | 1.23 | 0.69 |
| Lodz | 0.96 | 0.94 | 1.25 | 0.94 | 1.22 | 0.73 | 0.89 | 0.80 | 1.54 |
| Krakow | 0.91 | 1.05 | 0.84 | 0.88 | 1.03 | 1.10 | 1.36 | 0.35 | 1.98 |
| Warsaw | 1.02 | 1.02 | 0.94 | 0.91 | 0.74 | 1.67 | 0.80 | 0.99 | 1.01 |
| Opole | 0.82 | 0.95 | 0.97 | 1.95 | 0.59 | 0.85 | 0.80 | 1.17 | 2.04 |
| Rzeszow | 0.72 | 0.88 | 1.35 | 1.37 | 1.15 | 0.44 | 1.69 | 1.02 | 1.15 |
| Bialystok | 0.83 | 0.94 | 1.11 | 1.42 | 1.14 | 0.51 | 1.43 | 1.90 | 0.65 |
| Gdansk | 1.01 | 1.03 | 0.87 | 1.05 | 1.13 | 1.06 | 0.75 | 1.13 | 0.97 |
| Katowice | 1.42 | 1.02 | 0.98 | 0.70 | 1.70 | 0.88 | 0.72 | 1.87 | 0.52 |
| Kielce | 1.10 | 0.73 | 2.54 | 0.54 | 1.21 | 0.60 | 1.41 | 1.23 | 0.83 |
| Olsztyn | 0.94 | 0.77 | 2.32 | 0.50 | 0.97 | 0.97 | 0.95 | 0.84 | 1.28 |
| Poznan | 1.04 | 1.01 | 1.01 | 0.75 | 1.56 | 0.86 | 1.04 | 1.52 | 0.48 |
| Szczecin | 1.09 | 1.03 | 0.68 | 2.65 | 0.77 | 0.60 | 1.43 | 0.58 | 2.50 |
Table A9.
Values of crime concentration ratios (LQ) in 2021.
| Grand Total | Criminal Offense | Economic Offense | Traffic Offense | Against Life and Health | Against Property | Against Family and Guardianship | Against Freedom | Against Public Safety and Safety in Transport | |
|---|---|---|---|---|---|---|---|---|---|
| Wroclaw | 1.08 | 1.14 | 0.57 | 1.61 | 0.88 | 1.18 | 0.64 | 0.72 | 2.04 |
| Bydgoszcz | 0.88 | 0.95 | 1.11 | 0.99 | 0.97 | 0.77 | 1.30 | 1.86 | 0.58 |
| Lublin | 0.89 | 0.91 | 1.35 | 0.82 | 1.30 | 0.72 | 1.15 | 2.40 | 0.39 |
| Zielona Góra | 1.14 | 0.85 | 1.53 | 0.84 | 1.00 | 0.92 | 0.95 | 1.69 | 0.67 |
| Lodz | 0.88 | 1.07 | 0.75 | 1.59 | 1.35 | 0.61 | 0.73 | 0.90 | 1.81 |
| Krakow | 0.85 | 1.03 | 0.96 | 0.77 | 1.12 | 1.24 | 1.12 | 0.39 | 1.77 |
| Warsaw | 0.94 | 1.10 | 0.72 | 1.16 | 0.79 | 1.42 | 0.57 | 1.80 | 0.87 |
| Opole | 1.08 | 0.76 | 1.95 | 0.89 | 0.83 | 0.60 | 0.73 | 1.18 | 2.41 |
| Rzeszow | 0.77 | 0.82 | 1.66 | 1.04 | 0.96 | 0.63 | 1.12 | 1.29 | 1.16 |
| Bialystok | 0.69 | 0.94 | 1.03 | 1.78 | 0.99 | 0.47 | 1.10 | 2.23 | 0.90 |
| Gdansk | 1.02 | 1.04 | 0.88 | 0.97 | 1.11 | 1.14 | 0.71 | 1.01 | 1.10 |
| Katowice | 2.50 | 0.51 | 4.59 | 0.20 | 1.13 | 2.23 | 0.31 | 1.72 | 0.75 |
| Kielce | 1.24 | 0.78 | 1.94 | 0.69 | 0.93 | 1.04 | 0.87 | 1.16 | 1.08 |
| Olsztyn | 0.67 | 0.93 | 1.18 | 1.02 | 1.17 | 0.68 | 0.92 | 1.01 | 1.30 |
| Poznan | 0.95 | 1.17 | 0.53 | 1.29 | 1.54 | 0.82 | 0.79 | 2.00 | 0.49 |
| Szczecin | 1.11 | 1.24 | 0.23 | 6.54 | 0.68 | 0.56 | 7.24 | 0.16 | 2.20 |
Table A10.
Values of crime concentration ratios (LQ) in 2022.
| Grand Total | Criminal Offense | Economic Offense | Traffic Offense | Against Life and Health | Against Property | Against Family and Guardianship | Against Freedom | Against Public Safety and Safety in Transport | |
|---|---|---|---|---|---|---|---|---|---|
| Wroclaw | 1.23 | 1.11 | 0.68 | 1.21 | 1.06 | 1.16 | 0.59 | 0.55 | 2.42 |
| Bydgoszcz | 0.80 | 0.83 | 1.62 | 0.94 | 0.72 | 0.94 | 1.22 | 1.22 | 1.03 |
| Lublin | 0.71 | 0.96 | 1.09 | 1.18 | 1.22 | 0.60 | 1.58 | 1.32 | 0.66 |
| Zielona Góra | 1.11 | 1.04 | 0.75 | 1.99 | 0.78 | 0.80 | 1.62 | 1.25 | 0.76 |
| Lodz | 0.73 | 1.06 | 0.76 | 1.61 | 1.22 | 0.68 | 0.72 | 1.16 | 1.41 |
| Krakow | 0.95 | 1.07 | 0.82 | 0.96 | 0.93 | 1.32 | 2.27 | 0.14 | 2.59 |
| Warsaw | 1.07 | 1.06 | 0.83 | 0.95 | 0.74 | 1.67 | 0.58 | 1.78 | 0.79 |
| Opole | 0.90 | 0.91 | 1.23 | 1.36 | 1.00 | 0.66 | 0.83 | 0.96 | 1.86 |
| Rzeszow | 0.81 | 0.74 | 1.74 | 0.94 | 1.29 | 0.46 | 1.24 | 1.38 | 0.94 |
| Bialystok | 0.62 | 0.90 | 1.16 | 1.82 | 0.87 | 0.55 | 0.95 | 2.53 | 0.89 |
| Gdansk | 1.11 | 1.02 | 0.98 | 0.91 | 1.15 | 1.04 | 0.66 | 1.45 | 0.88 |
| Katowice | 2.12 | 0.56 | 3.81 | 0.25 | 1.28 | 1.14 | 0.58 | 1.61 | 0.75 |
| Kielce | 0.98 | 0.91 | 1.32 | 0.89 | 1.15 | 0.65 | 1.12 | 1.82 | 0.69 |
| Olsztyn | 0.79 | 0.71 | 2.33 | 0.68 | 0.99 | 1.04 | 0.57 | 0.77 | 2.11 |
| Poznan | 0.93 | 1.16 | 0.56 | 1.14 | 1.82 | 0.83 | 0.81 | 1.72 | 0.49 |
| Szczecin | 0.89 | 1.22 | 0.27 | 5.65 | 0.74 | 0.65 | 3.09 | 0.43 | 1.52 |
Appendix B
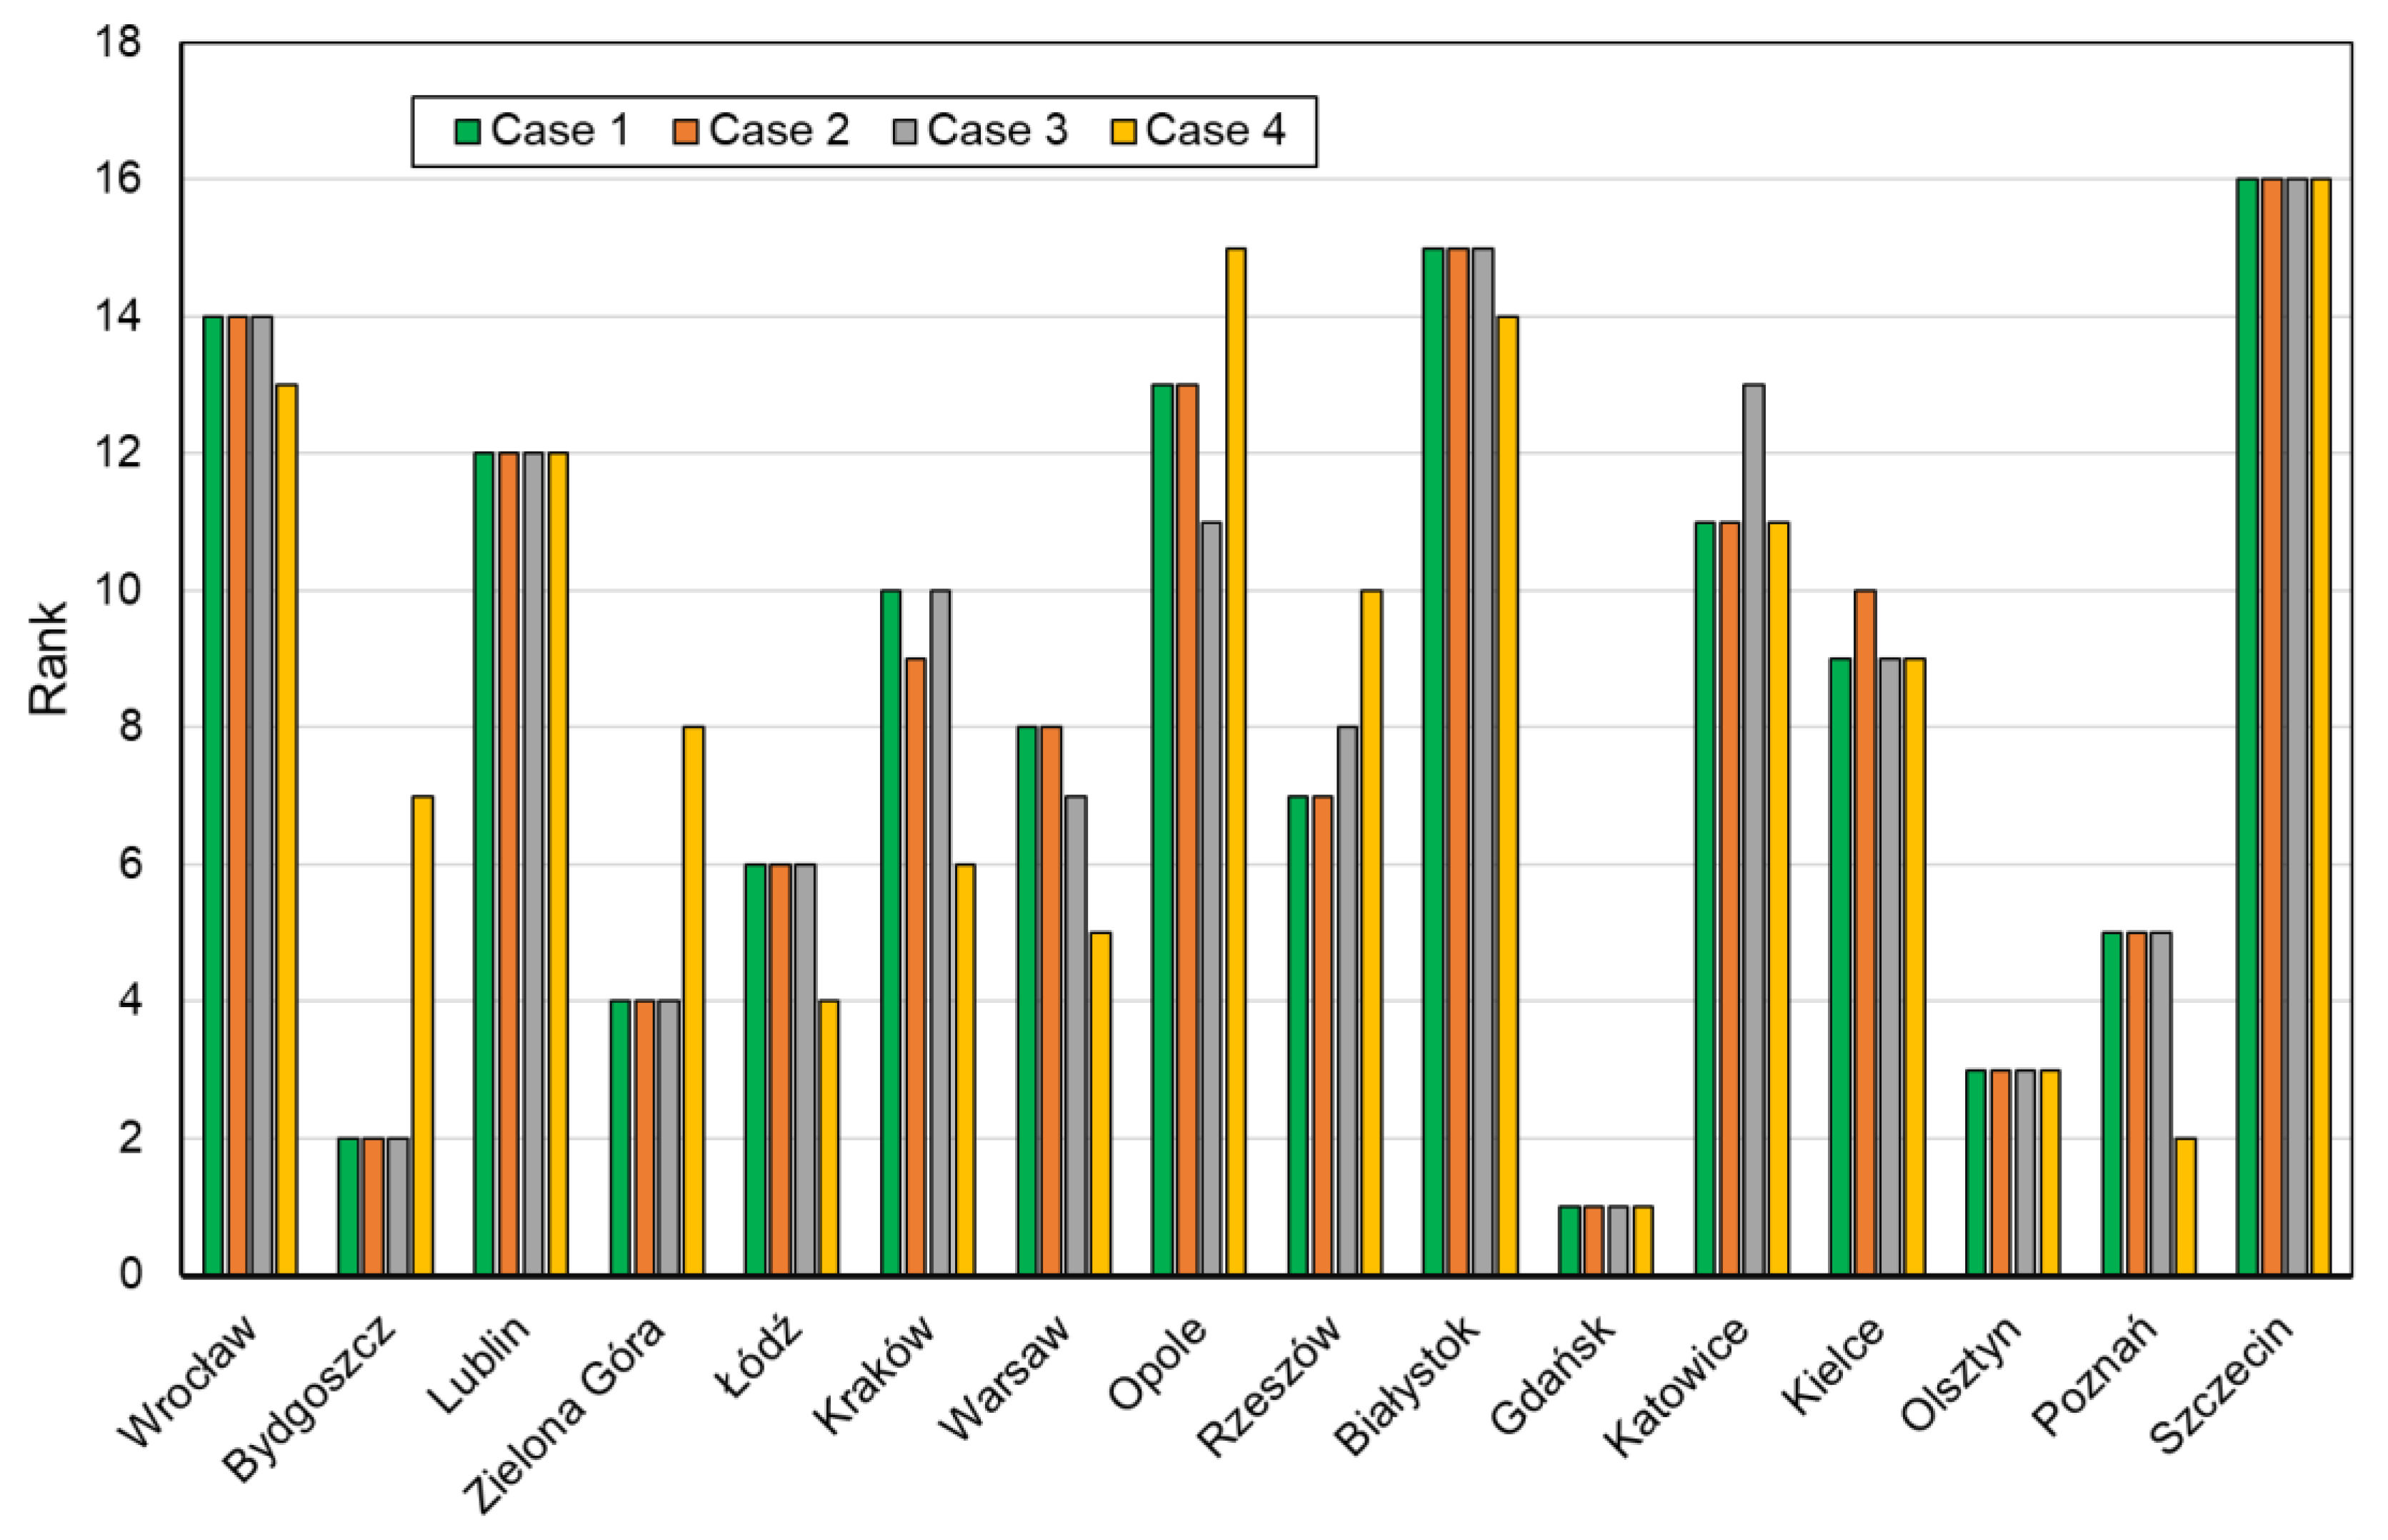
Sensitivity Analysis—the effect of weight values on the obtained ranking of cities by the TOPSIS method.
The sensitivity analysis was carried out for the approach based on changing weights of indicators included in the study. A total of four cases of different values of indicator weights were analyzed (Table A11).
Table A11.
Values of studied indicator weights.
| Case 1 (Expert Method—Method Included in the Study) | Case 2 (Change in Weight Values from Expert Method by +/−5%) | Case 3 (Standard Deviation Method) | Case 4 (Method of Equal Weights of Indicators) | |
|---|---|---|---|---|
| Economic offenses | 0.100 | 0.105 | 0.101 | 0.143 |
| Criminal traffic offenses | 0.125 | 0.131 | 0.129 | 0.143 |
| Criminal offenses against life and health | 0.250 | 0.213 | 0.251 | 0.143 |
| Criminal offenses against property | 0.150 | 0.158 | 0.133 | 0.143 |
| Criminal offenses against liberty, freedom of conscience, sexual freedom and morality | 0.120 | 0.126 | 0.101 | 0.143 |
| Criminal offenses against family and guardianship | 0.130 | 0.137 | 0.151 | 0.143 |
| Criminal offenses against general security and safety in communications | 0.125 | 0.131 | 0.134 | 0.143 |
The results obtained allow us to conclude that there is little sensitivity of the indicator weights to changes in the ranking position of the cities included in the analysis (Figure A1).
Figure A1.
Ranking of cities obtained by the TOPSIS method for different indicator weights.

Spearman correlation coefficients (Table A12) were determined to assess the consistency and similarity (variation) between the obtained rankings for different values of indicator weights.
Table A12.
Spearman’s rank correlation coefficient values between ranking positions for different methods of determining indicator weights.
Table A12.
Spearman’s rank correlation coefficient values between ranking positions for different methods of determining indicator weights.
| Tested Parameters | Spearman Rank | p < 0.05 |
|---|---|---|
| Case 1 and Case 2 | 0.997 | 0.00000 |
| Case 1 and Case 3 | 0.985 | 0.00000 |
| Case 1 and Case 4 | 0.862 | 0.00002 |
Based on the analysis of the values of Spearman correlation coefficients, it can be concluded that in terms of the ranking position of cities, depending on the values of the indicator weights included in the study, the biggest differences are between case 1 and case 4.
Verification of the results—comparison of the ranking obtained by the TOPSIS method with the ranking results obtained by the EDAS method.
Figure A2 shows the ranking of cities obtained from calculations using TOPSIS and EDAS methods.
Figure A2.
Ranking of cities obtained by TOPSIS method and EDAS method.

To assess the consistency and similarity (variation) between the rankings obtained from each method, Spearman correlation coefficients were determined for these results by the TOPSIS and EDAS methods (Table A13).
Table A13.
Spearman rank correlation coefficient values between ranking positions by TOPSIS and EDAS methods.
Table A13.
Spearman rank correlation coefficient values between ranking positions by TOPSIS and EDAS methods.
| Tested Parameters | Spearman Rank | p < 0.05 |
|---|---|---|
| TOPSIS and EDAS | 0.871 | 0.00001 |
Based on the analysis of Spearman correlation coefficient values, there is a strong correlation between the results in terms of the ranking position of cities by the TOPSIS and EDAS methods.
References
- Yu, D.; Fang, C. The dynamics of public safety in cities: A case study of Shanghai from 2010 to 2025. Habitat Int. 2017, 69, 104–113. [Google Scholar] [CrossRef]
- Biłozor, A.; Cieślak, I. Review of Experience in Recent Studies on the Dynamics of Land Urbanisation. Land 2021, 10, 1117. [Google Scholar] [CrossRef]
- Nuissl, H.; Siedentop, S. Urbanisation and Land Use Change. In Sustainable Land Management in a European Context. Human-Environment Interactions; Weith, T., Barkmann, T., Gaasch, N., Rogga, S., Strauß, C., Zscheischler, J., Eds.; Springer: Cham, Switzerland, 2021; Volume 8. [Google Scholar] [CrossRef]
- Bibri, S.E.; Krogstie, E.; Kärrholm, M. Compact city planning and development: Emerging practices and strategies for achieving the goals of sustainability. Dev. Built Environ. 2020, 4, 100021. [Google Scholar] [CrossRef]
- United Nations. World Population Prospects: 2017 Revision; Department of Economic and Social Affairs: New York, NY, USA, 2022; Available online: https://population.un.org/wpp/ (accessed on 19 September 2023).
- Sustainable Urban Development in Poland: National Urban Policy in the Context of the 2030 Agenda’s Goal 11 and the New Urban Agenda. Available online: https://www.funduszeeuropejskie.gov.pl/media/72570/raport_en_final.pdf (accessed on 19 September 2023).
- Maslow, A.H. A theory of human motivation. Psychol. Rev. 1943, 50, 370–396. [Google Scholar] [CrossRef]
- Ajdari, B.; Asgharpour, S.E. Human security and development, emphasizing on sustainable development. Procedia Soc. Behav. Sci. 2011, 19, 41–46. [Google Scholar] [CrossRef]
- Kollarova, M.; Granak, T.; Strelcova, S.; Ristvej, J. Conceptual Model of Key Aspects of Security and Privacy Protection in a Smart City in Slovakia. Sustainability 2023, 15, 6926. [Google Scholar] [CrossRef]
- Pak, A.; Gannon, B. The effect of neighbourhood and spatial crime rates on mental wellbeing. Empir. Econ. 2023, 64, 99–134. [Google Scholar] [CrossRef]
- Mataković, H.; Mataković, I. The impact of crime on security in tourism. Secur. Def. Q. 2019, 27, 1–20. [Google Scholar] [CrossRef]
- Onyeneke, C.C.; Karam, A.H. An Exploratory Study of Crime: Examining Lived Experiences of Crime through Socioeconomic, Demographic, and Physical Characteristics. Urban Sci. 2022, 6, 43. [Google Scholar] [CrossRef]
- Prieto Curiel, R.; Bishop, S.R. A metric of the difference between perception of security and victimisation rates. Crime Sci. 2016, 5, 12. [Google Scholar] [CrossRef]
- Caridade, S.; Magalhães, M.; Azevedo, V.; Dinis, M.A.P.; Maia, R.L.; Estrada, R.; Sani, A.I.; Nunes, L.M. Predicting Frequent and Feared Crime Typologies: Individual and Social/Environmental Variables, and Incivilities. Soc. Sci. 2022, 11, 126. [Google Scholar] [CrossRef]
- Park, M.-S.; Lee, H. Smart City Crime Prevention Services: The Incheon Free Economic Zone Case. Sustainability 2020, 12, 5658. [Google Scholar] [CrossRef]
- Ma, C. Smart city and cyber-security; technologies used, leading challenges and future recommendations. Energy Rep. 2021, 7, 7999–8012. [Google Scholar] [CrossRef]
- Brzeziński, Ł.; Wyrwicka, M.K. Fundamental Directions of the Development of the Smart Cities Concept and Solutions in Poland. Energies 2022, 15, 8213. [Google Scholar] [CrossRef]
- Moch, N.; Wereda, W. Smart Security in the Smart City. Sustainability 2020, 12, 9900. [Google Scholar] [CrossRef]
- Szczepańska, A.; Kaźmierczak, R.; Myszkowska, M. Smart City Solutions from a Societal Perspective—A Case Study. Int. J. Environ. Res. Public Health 2023, 20, 5136. [Google Scholar] [CrossRef]
- Syed, A.S.; Sierra-Sosa, D.; Kumar, A.; Elmaghraby, A. IoT in Smart Cities: A Survey of Technologies, Practices and Challenges. Smart Cities 2021, 4, 429–475. [Google Scholar] [CrossRef]
- Tura, N.; Ojanen, V. Sustainability-oriented innovations in smart cities: A systematic review and emerging themes. Cities 2022, 126, 103716. [Google Scholar] [CrossRef]
- Gracias, J.S.; Parnell, G.S.; Specking, E.; Pohl, E.A.; Buchanan, R. Smart Cities—A Structured Literature Review. Smart Cities 2023, 6, 1719–1743. [Google Scholar] [CrossRef]
- Angelidou, M.; Psaltoglou, A.; Komninos, N.; Kakderi, C.; Tsarchopoulos, P.; Panori, A. Enhancing sustainable urban development through smart city applications. J. Sci. Technol. Policy Manag. 2018, 9, 146–169. [Google Scholar] [CrossRef]
- Attaran, H.; Kheibari, N.; Bahrepour, D. Toward integrated smart city: A new model for implementation and design challenges. GeoJournal 2022, 87 (Suppl. S4), 511–526. [Google Scholar] [CrossRef] [PubMed]
- Chang, S.; Smith, M.K. Residents’ Quality of Life in Smart Cities: A Systematic Literature Review. Land 2023, 12, 876. [Google Scholar] [CrossRef]
- Giffinger, R.; Fertner, C.; Kramar, H.; Kalasek, R.; Pichler-Milanovic, N.; Meijers, E. Smart Cities—Ranking of European Medium-Sized Cities; Centre of Regional Science: Vienna, Austria, 2007; Available online: http://www.smart-cities.eu (accessed on 19 September 2023).
- Keshavarzi, G.; Yalcin, Y.; Arefi, M. Does scale matter? An overview of the “smart cities” literature. Sustain. Cities Soc. 2021, 74, 103151. [Google Scholar] [CrossRef]
- Su, Y.; Fan, S. Smart cities and sustainable development. Reg. Stud. 2023, 57, 722–738. [Google Scholar] [CrossRef]
- Mora, L.; Deakin, M.; Zhang, X.; Batty, M.; de Jong, M.; Santi, P.; Appio, F.P. Assembling Sustainable Smart City Transitions: An Interdisciplinary Theoretical Perspective. J. Urban Technol. 2020, 28, 1–27. [Google Scholar] [CrossRef]
- Bhattacharya, T.R.; Bhattacharya, A.; Mclellan, B.; Tezuka, T. Sustainable smart city development framework for developing countries. Urban Res. Pract. 2020, 13, 180–212. [Google Scholar] [CrossRef]
- Del-Real, C.; Ward, C.; Sartipi, M. What do people want in a smart city? Exploring the stakeholders’ opinions, priorities and perceived barriers in a medium-sized city in the United States. Int. J. Urban Sci. 2021, 27, 50–74. [Google Scholar] [CrossRef]
- Chen, C.W. From smart cities to a happy and sustainable society: Urban happiness as a critical pathway toward sustainability transitions. Local Environ. 2022, 27, 1536–1545. [Google Scholar] [CrossRef]
- Aurigi, A.; Odendaal, N. From “Smart in the Box” to “Smart in the City”: Rethinking the Socially Sustainable Smart City in Context. J. Urban Technol. 2021, 28, 55–70. [Google Scholar] [CrossRef]
- IMD. Smart City Index. 2023. Available online: https://imd.cld.bz/IMD-Smart-City-Index-Report-20231/10/ (accessed on 19 September 2023).
- IESE. Cities in Motion Index. 2022. Available online: https://media.iese.edu/research/pdfs/ST-0633-E.pdf (accessed on 19 September 2023).
- Smart Cities. Ranking of European Medium-Sized Cities. Available online: https://www.smart-cities.eu/download/smart_cities_final_report.pdf (accessed on 19 September 2023).
- Lim, Y.; Edelenbos, J.; Gianoli, A. Identifying the results of smart city development: Findings from systematic literature review. Cities 2019, 95, 102397. [Google Scholar] [CrossRef]
- Zheng, C.; Yuan, J.; Zhu, L.; Zhang, Y.; Shao, Q. From digital to sustainable: A scientometric review of smart city literature between 1990 and 2019. J. Clean. Prod. 2020, 258, 120689. [Google Scholar] [CrossRef]
- Kaklauskas, A.; Zavadskas, E.K.; Radzeviciene, I.; Ubarte, A.; Podviezko, V.; Podvezko, A.; Kuzminske, A.; Banaitis, A.; Binkyte, A.; Bucinskas, V. Quality of city life multiple criteria analysis. Cities 2018, 72 Pt A, 82–93. [Google Scholar] [CrossRef]
- Campisi, T.; Severino, A.; Al-Rashid, M.A.; Pau, G. The Development of the Smart Cities in the Connected and Autonomous Vehicles (CAVs) Era: From Mobility Patterns to Scaling in Cities. Infrastructures 2021, 6, 100. [Google Scholar] [CrossRef]
- Baran, M.; Kłos, M.; Chodorek, M.; Marchlewska-Patyk, K. The Resilient Smart City Model–Proposal for Polish Cities. Energies 2022, 15, 1818. [Google Scholar] [CrossRef]
- Silva, B.N.; Khan, M.; Han, K. Towards sustainable smart cities: A review of trends, architectures, components, and open challenges in smart cities Sustain. Cities Soc. 2018, 38, 697–713. [Google Scholar] [CrossRef]
- De Marco, A.; Mangano, G. Evolutionary trends in smart city initiatives. Sustain. Futures 2021, 3, 100052. [Google Scholar] [CrossRef]
- Wall, R.S.; Stavropoulos, S. Smart cities within world city networks. Appl. Econ. Lett. 2016, 23, 875–879. [Google Scholar] [CrossRef]
- Yadav, G.; Mangla, S.K.; Luthra, S.; Rai, D.P. Developing a sustainable smart city framework for developing economies: An Indian context Sustain. Cities Soc. 2019, 47, 101462. [Google Scholar] [CrossRef]
- Martin, C.J.; Evans, J.; Karvonen, A. Smart and sustainable? Five tensions in the visions and practices of the smart-sustainable city in Europe and North America. Technol. Forecast. Soc. Chang. 2018, 133, 269–278. [Google Scholar] [CrossRef]
- Marchetti, D.; Oliveira, R.; Figueira, A.R. Are global north smart city models capable to assess Latin American cities? A model and indicators for a new context. Cities 2019, 92, 197–207. [Google Scholar] [CrossRef]
- Shayan, S.; Kim, K.P.; Ma, T.; Nguyen, T.H.D. The First Two Decades of Smart City Research from a Risk Perspective. Sustainability 2020, 12, 9280. [Google Scholar] [CrossRef]
- Oliveira, Á.; Campolargo, M. From Smart Cities to Human Smart Cities. In Proceedings of the 2015 48th Hawaii International Conference on System Sciences, Kauai, HI, USA, 5–8 January 2015; pp. 2336–2344. [Google Scholar] [CrossRef]
- Kuzior, A.; Sobotka, B. The role of social capital in the development of smart cities. Sci. Pap. Silesian Univ. Technol. Organ. Manag. Ser. 2019, 134, 109–119. [Google Scholar] [CrossRef]
- Kummitha, R.K.R.; Crutzen, N. Smart cities and the citizen-driven internet of things: A qualitative inquiry into an emerging smart city. Technol. Forecast. Soc. Chang. 2019, 140, 44–53. [Google Scholar] [CrossRef]
- Fu, S. Smart Café Cities: Testing human capital externalities in the Boston metropolitan area. J. Urban Econ. 2007, 61, 86–111. [Google Scholar] [CrossRef]
- Sheikh, H.; Mitchell, P.; Foth, M. More-than-human smart urban governance: A research agenda. Digit. Geogr. Soc. 2023, 4, 100045. [Google Scholar] [CrossRef]
- Mun Chye, C.; Fahmy-Abdullah, M.; Sufahani, S.F.; Bin Ali, M.K. A Study of Smart People Toward Smart Cities Development. In Proceedings of the Third International Conference on Trends in Computational and Cognitive Engineering, Batu Pahat, Malaysia, 21–22 October 2021; Kaiser, M.S., Ray, K., Bandyopadhyay, A., Jacob, K., Long, K.S., Eds.; Lecture Notes in Networks and Systems; Springer: Singapore, 2022; Volume 348. [Google Scholar] [CrossRef]
- Kim, S.-C.; Hong, P.; Lee, T.; Lee, A.; Park, S.-H. Determining Strategic Priorities for Smart City Development: Case Studies of South Korean and International Smart Cities. Sustainability 2022, 14, 10001. [Google Scholar] [CrossRef]
- Bednarska-Olejniczak, D.; Olejniczak, J.; Svobodová, L. Towards a Smart and Sustainable City with the Involvement of Public Participation—The Case of Wroclaw. Sustainability 2019, 11, 332. [Google Scholar] [CrossRef]
- McKenna, H.P. Human-Smart Environment Interactions in Smart Cities: Exploring Dimensionalities of Smartness. Future Internet 2020, 12, 79. [Google Scholar] [CrossRef]
- Bıyık, C.; Abareshi, A.; Paz, A.; Ruiz, R.A.; Battarra, R.; Rogers, C.D.F.; Lizarraga, C. Smart Mobility Adoption: A Review of the Literature. J. Open Innov. Technol. Mark. Complex. 2021, 7, 146. [Google Scholar] [CrossRef]
- Paiva, S.; Ahad, M.A.; Tripathi, G.; Feroz, N.; Casalino, G. Enabling Technologies for Urban Smart Mobility: Recent Trends, Opportunities and Challenges. Sensors 2021, 21, 2143. [Google Scholar] [CrossRef]
- Almihat, M.G.M.; Kahn, M.T.E.; Aboalez, K.; Almaktoof, A.M. Energy and Sustainable Development in Smart Cities: An Overview. Smart Cities 2022, 5, 1389–1408. [Google Scholar] [CrossRef]
- Liu, L.; Zhang, Y. Smart environment design planning for smart city based on deep learning. Sustain. Energy Technol. Assess. 2021, 47, 101425. [Google Scholar] [CrossRef]
- Popova, Y.; Popovs, S. Impact of Smart Economy on Smart Areas and Mediation Effect of National Economy. Sustainability 2022, 14, 2789. [Google Scholar] [CrossRef]
- Micozzi, N.; Yigitcanlar, T. Understanding Smart City Policy: Insights from the Strategy Documents of 52 Local Governments. Sustainability 2022, 14, 10164. [Google Scholar] [CrossRef]
- Akande, A.; Cabral, P.; Casteleyn, S. Understanding the sharing economy and its implication on sustainability in smart cities. J. Clean. Prod. 2020, 277, 124077. [Google Scholar] [CrossRef]
- Kuzior, A.; Pakhnenko, O.; Tiutiunyk, I.; Lyeonov, S. E-Governance in Smart Cities: Global Trends and Key Enablers. Smart Cities 2023, 6, 1663–1689. [Google Scholar] [CrossRef]
- Gao, Z.; Wang, S.; Gu, J. Public Participation in Smart-City Governance: A Qualitative Content Analysis of Public Comments in Urban China. Sustainability 2020, 12, 8605. [Google Scholar] [CrossRef]
- Tan, S.Y.; Taeihagh, A. Smart City Governance in Developing Countries: A Systematic Literature Review. Sustainability 2020, 12, 899. [Google Scholar] [CrossRef]
- Laurini, R. A primer of knowledge management for smart city governance. Land Use Policy 2020, 111, 104832. [Google Scholar] [CrossRef]
- Mouratidis, K. Urban planning and quality of life: A review of pathways linking the built environment to subjective well-being. Cities 2021, 115, 103229. [Google Scholar] [CrossRef]
- Sypion-Dutkowska, N.; Leitner, M.; Dutkowski, M. Impact of metropolization on the crime structure (case study of provincial capitals in Poland). Cities 2021, 119, 103359. [Google Scholar] [CrossRef]
- Hooghe, M.; Vanhoutte, B.; Hardyns, W.; Bircan, T. Unemployment, inequality, poverty and crime: Spatial distribution patterns of criminal acts in Belgium, 2001–2006. Br. J. Criminol. 2011, 51, 1–20. [Google Scholar] [CrossRef]
- Zembroski, D. Sociological theories of crime and delinquency. J. Hum. Behav. Soc. Environ. 2011, 21, 240–254. [Google Scholar] [CrossRef]
- Cameron, S. Killing for money and the economic theory of crime. Rev. Soc. Econ. 2014, 21, 28–41. [Google Scholar] [CrossRef]
- Eriksson, K.H.; Hjalmarsson, R.; Lindquist, M.J.; Sandberg, A. The importance of family background and neighborhood effects as determinants of crime. J. Popul. Econ. 2016, 29, 219–262. [Google Scholar] [CrossRef]
- Sypion-Dutkowska, N.; Leitner, M. Land use influencing the spatial distribution of urban crime: A case study of Szczecin Poland. ISPRS Int. J. Geoinf. 2017, 6, 74. [Google Scholar] [CrossRef]
- Wolfe, M.K.; Mennis, J. Does vegetation encourage or suppress urban crime? Evidence from Philadelphia, PA. Landsc. Urban Plan. 2012, 108, 112–122. [Google Scholar] [CrossRef]
- Neilson, W.; Winter, H. On criminals’ risk attitudes. Econ. Lett. 1997, 55, 97–102. [Google Scholar] [CrossRef]
- Chuqiao, Y.V.; Papachristos, A.V.; Abrams, D.M. Modeling the origin of urban-output scaling laws. Phys. Rev. E 2019, 100, 302–306. [Google Scholar]
- Oliveira, M.; Bastos-Filho, C.; Menezes, R. The scaling of crime concentration in cities. PLoS ONE 2017, 12, e0183110. [Google Scholar] [CrossRef]
- Pyka, R. Minimizing the side effects of the metropolization as a condition for maintenance of transition and resilience in post-industrial agglomerations. J. Econ. Manag. 2013, 10, 121–136. [Google Scholar]
- Dabrowski, A.P.; Matczak, A.W.; Leitner, M. Identification of experimental and control areas for CCTV effectiveness assessment—The issue of spatially aggregated data. ISPRS Int. J. Geo-Inf. 2018, 7, 471. [Google Scholar] [CrossRef]
- Kourtit, K.; Nijkamp, P.; Susuzki, S. Comparative urban performance assessment of safe cities through data envelopment analysis. Reg. Sci. Policy Pract. 2021, 13, 591–602. [Google Scholar] [CrossRef]
- Allam, Z.; Sharifi, A.; Bibri, S.E.; Jones, D.S.; Krogstie, J. The Metaverse as a Virtual Form of Smart Cities: Opportunities and Challenges for Environmental, Economic, and Social Sustainability in Urban Futures. Smart Cities 2022, 5, 771–801. [Google Scholar] [CrossRef]
- Kaur, A. Maslow’s need hierarchy theory: Applications and criticisms. Glob. J. Manag. Bus. Stud. 2013, 3, 1061–1064. [Google Scholar]
- Harrendorf, S.; Heiskanen, M.; Malby, S. (Eds.) International Statistics on Crime and Justice; European Institute for Crime Prevention and Control, Affiliated with the United Nations (HEUNI): Helsinki, Finland, 2010; Available online: https://www.unodc.org/documents/data-and-analysis/Crime-statistics/International_Statistics_on_Crime_and_Justice.pdf (accessed on 19 September 2023).
- Kościołek, A. Przestępstwa i dezorganizacja społeczna a Smart City—Na podstawie strategii z miast średniej wielkości w Polsce. Stud. Sociol. 2019, 11, 175–189. [Google Scholar]
- Risdiana, D.M.; Susanto, T.D. The Safe City: Conceptual Model Development—A Systematic Literature Review. Procedia Comput. Sci. 2019, 161, 291–299. [Google Scholar] [CrossRef]
- Neumannová, M. Smart Districts: New Phenomenon in Sustainable Urban Development. Case Study of Špitálka in Brno, Czech Republic. Folia Geogr. 2021, 63, 27–48. [Google Scholar]
- Matlovicová, K.; Mocák, P.; Kolesárová, J. Environment of estates and crime prevention through urban environment formation and modification. Geogr. Pannonica 2016, 20, 168–180. [Google Scholar] [CrossRef]
- Sun, L.; Zhang, G.; Zhao, D.; Ji, L.; Gu, H.; Sun, L.; Li, X. Explore the Correlation between Environmental Factors and the Spatial Distribution of Property Crime. ISPRS Int. J. Geo-Inf. 2022, 11, 428. [Google Scholar] [CrossRef]
- Chiodi, S.I. Crime prevention through urban design and planning in the smart city era: The challenge of disseminating CP-UDP in Italy: Learning from Europe. J. Place Manag. Dev. 2016, 9, 137–152. [Google Scholar] [CrossRef]
- Eurostat Database. Available online: https://ec.europa.eu/eurostat/web/main/data/database (accessed on 19 September 2023).
- Christaller, W. Central Places in Southern Germany; Prentice Hall: Englewood Cliffs, NJ, USA, 1966. [Google Scholar]
- Bank Danych Lokalnych. Available online: https://bdl.stat.gov.pl/bdl/start (accessed on 19 September 2023).
- Yue, H.; Zhu, X.; Ye, X.; Guo, W. The Local Colocation Patterns of Crime and Land-Use Features in Wuhan, China. ISPRS Int. J. Geo-Inf. 2017, 6, 307. [Google Scholar] [CrossRef]
- Brantingham, P.L.; Brantingham, P.J. Location quotients and crime hot spots in the city. In Crime Analysis through Computer Mapping; Criminal Justice Information Authority: Chicago, IL, USA, 1993. [Google Scholar]
- Piquero, A.R.; Brame, R.W. Assessing the Race–Crime and Ethnicity–Crime Relationship in a Sample of Serious Adolescent Delinquents. Crime Delinq. 2008, 54, 390–422. [Google Scholar] [CrossRef] [PubMed]
- Wang, C.; Wang, L.; Gu, T.; Yin, J.; Hao, E. CRITIC-TOPSIS-Based Evaluation of Smart Community Safety: A Case Study of Shenzhen, China. Buildings 2023, 13, 476. [Google Scholar] [CrossRef]
- Hajduk, S.; Jelonek, D. A Decision-Making Approach Based on TOPSIS Method for Ranking Smart Cities in the Context of Urban Energy. Energies 2021, 14, 2691. [Google Scholar] [CrossRef]
- Kim, H.M.; Sabri, S.; Kent, A. Chapter 2—Smart cities as a platform for technological and social innovation in productivity, sustainability, and livability: A conceptual framework. In Smart Cities for Technological and Social Innovation; Case Studies, Current Trends, and Future Steps; Elsevier: Amsterdam, The Netherlands, 2021; pp. 9–28. [Google Scholar]
- Fabrègue, B.F.G.; Bogoni, A. Privacy and Security Concerns in the Smart City. Smart Cities 2023, 6, 586–613. [Google Scholar] [CrossRef]
- Ciaburro, G.; Iannace, G. Improving Smart Cities Safety Using Sound Events Detection Based on Deep Neural Network Algorithms. Informatics 2020, 7, 23. [Google Scholar] [CrossRef]
- Woetzel, J.; Remes, J.; Boland, B.; Lv, K.; Sinha, S.; Strube, G.; Means, J.; Law, J.; Cadena, A.; von der Tann, V. Smart Cities: Digital Solutions for a More Livable Future. 2018. Available online: https://www.mckinsey.com/~/media/McKinsey/Industries/Public%20and%20Social%20Sector/Our%20Insights/Smart%20cities%20Digital%20solutions%20for%20a%20more%20livable%20future/MGI-Smart-Cities-Executive-summary.pdf (accessed on 19 September 2023).
- Hegedűs, L.D.; Túri, Z.; Apáti, N.; Pénzes, J. Analysis of the Intra-Urban Suburbanization with GIS Methods. The Case of Debrecen Since the 1980s. Folia Geograph. 2023, 65, 23–39. [Google Scholar]
- Pawlusinski, R. Managing of the Night-Time Economy: Challenges for a Sustainable Urban Policy The case of Krakow (Poland). Folia Geograph. 2023, 65, 5–22. [Google Scholar]
- Mocak, P.; Matlovicova, K.; Matlovic, R.; Penzes, J.; Pachura, P.; Mishra, P.; Kostilnikova, K.; Demkova, M. 15-minute City Concept as a Sustainable Urbandevelopment Alternative: A Brief Outlineof Conceptual Frameworks and Slovakcities as a Case. Folia Geograph. 2022, 64, 69–89. [Google Scholar]
- Perrot, P. What about AI in criminal intelligence? From predictive policing to AI perspectives. Eur. Law Enforc. Res. Bull. 2017, 16, 65–75. [Google Scholar]
- Dakalbab, F.; Talib, M.A.; Waraga, O.; Nassif, A.; Abbas, S.; Nasir, Q. Artificial intelligence & crime prediction: A systematic literature review. Soc. Sci. Humanit. Open 2022, 6, 100342. [Google Scholar]
- Zhao, H. Artificial intelligence-based public safety data resource management in smart cities. Open Comput. Sci. 2023, 13, 20220271. [Google Scholar] [CrossRef]
- Prislan, K.; Slak, B. Analysis of the Relationship Between Smart Cities, Policing and Criminal Investigation. J. Crim. Justice Secur. 2020, 4, 389–413. [Google Scholar]
- Byrne, J.; Marx, G. Technological Innovations in Crime Prevention and Policing. A Review of the Research on Implementation and Impact. Cah. Politiestud. Jaargang 2011, 3, 17–40. [Google Scholar]
- Roses, R.; Kadar, C.; Malleson, N. A data-driven agent-based simulation to predict crime patterns in an urban environment. Comput. Environ. Urban Syst. 2021, 89, 101660. [Google Scholar] [CrossRef]
- Gawkowski, K.K. Smart Robi Różnicę. Available online: https://aspolska.pl/smart-robi-roznice/ (accessed on 19 September 2023).
- Ammara, U.; Rasheed, K.; Mansoor, A.; Al-Fuqaha, A.; Qadir, J. Smart Cities from the Perspective of Systems. Systems 2022, 10, 77. [Google Scholar] [CrossRef]
- Branny, A.; Moller, M.; Korpilo, S.; McPhearson, T.; Gulsrud, N.; Olafsson, A.; Raymond, C.; Andersson, E. Smarter greener cities through a social-ecological-technological systems approach. Curr. Opin. Environ. Sustain. 2022, 55, 101168. [Google Scholar] [CrossRef]
- Albino, V.; Berardi, U.; Dangelico, R.M. Smart Cities: Definitions, Dimensions, Performance, and Initiatives. J. Urban Technol. 2015, 22, 3–21. [Google Scholar] [CrossRef]
Figure 1.
Distribution of studied cities in Poland.

Figure 2.
Number of registered offenses in the entire study population between 2013–2022.

Figure 3.
Total number of stated offenses between 2013–2022 in each city.

Figure 4.
Summary of types of criminal offenses (in %) in the studied cities.

Figure 5.
Differentiation of cities in terms of concentration of offenses (relative to population): total (a), criminal (b), economic (c) traffic (d), against life and health (e), property (f), against family and guardianship (g) and against freedom (h).
Figure 5.
Differentiation of cities in terms of concentration of offenses (relative to population): total (a), criminal (b), economic (c) traffic (d), against life and health (e), property (f), against family and guardianship (g) and against freedom (h).


Figure 6.
Ranking of studied cities in terms of the value of safety index ().

Figure 7.
Safety levels in studied cities.

Table 1.
Characteristics of studied cities.
| City | Inhabitants | Surface, km2 | Population Density, Persons/km² | Character of the City |
|---|---|---|---|---|
| Wrocław | 632,067 | 293 | 2302.1 | A city aspiring to be a metropolitan city |
| Bydgoszcz | 359,428 | 176 | 1875.6 | Large regional center |
| Lublin | 343,598 | 148 | 2246.5 | Large regional center |
| Zielona Góra | 118,405 | 278 | 500.5 | Small regional center |
| Łódź | 711,332 | 293 | 2245.3 | A city aspiring to be a metropolitan city |
| Kraków | 758,992 | 327 | 2457.6 | A city aspiring to be a metropolitan city |
| Warsaw | 1,724,404 | 517 | 3600.1 | Metropolitan city |
| Opole | 120,146 | 149 | 848.5 | Small regional center |
| Rzeszów | 183,108 | 129 | 1528.4 | Large regional center |
| Białystok | 295,282 | 102 | 2865.0 | Large regional center |
| Gdańsk | 461,531 | 266 | 1829.3 | Large regional center |
| Katowice | 304,362 | 165 | 1700.9 | Large regional center |
| Kielce | 199,870 | 110 | 1677.0 | Large regional center |
| Olsztyn | 174,675 | 88 | 1904.6 | Large regional center |
| Poznań | 548,028 | 262 | 2066.8 | A city aspiring to be a metropolitan city |
| Szczecin | 408,172 | 301 | 1302.5 | Large regional center |
Table 2.
Index of change dynamics for total, criminal and economic offenses.
| City | Total Offenses | Criminal Offenses | Economic Offenses |
|---|---|---|---|
| % | |||
| Wrocław | 67.72 | 59.36 | 222.21 |
| Bydgoszcz | 80.35 | 61.95 | 140.22 |
| Lublin | 66.27 | 51.29 | 179.86 |
| Zielona Góra | 93.82 | 87.45 | 135.07 |
| Łódź | 61.13 | 51.01 | 145.13 |
| Kraków | 69.65 | 57.59 | 214.35 |
| Warsaw | 100.23 | 84.87 | 257.09 |
| Opole | 59.47 | 46.52 | 167.33 |
| Rzeszów | 96.60 | 62.11 | 278.01 |
| Białystok | 80.87 | 65.86 | 198.26 |
| Gdańsk | 88.06 | 89.40 | 82.63 |
| Katowice | 104.84 | 51.26 | 347.77 |
| Kielce | 78.25 | 72.71 | 100.21 |
| Olsztyn | 87.15 | 50.58 | 376.97 |
| Poznań | 51.53 | 49.16 | 64.83 |
| Szczecin | 73.11 | 72.68 | 62.63 |
| Total (studied city population) | 78.0 | 64.44 | 173.44 |
Table 3.
Average annual number of offenses for the period from 2013 to 2022.
| Cities Studied | Average Annual Number of Offenses for the Period from 2013 to 2022 | ||||||||
|---|---|---|---|---|---|---|---|---|---|
| Total | Criminal | Economic | Traffic Offense | Against Life and Health | Against Property | Against Family and Guardianship | Criminal Offenses against Freedom, Freedom of Conscience, Sexual Freedom and Morality | Against Public Safety and Safety in Transport | |
| Wrocław | 23,215.60 | 18,624.80 | 3078.50 | 945.10 | 315.6 | 16,536.4 | 333.3 | 691.5 | 1226.3 |
| Bydgoszcz | 7884.80 | 5183.30 | 2003.40 | 410.00 | 131 | 4538.4 | 375.1 | 329.5 | 478.3 |
| Lublin | 7936.00 | 5537.10 | 1716.00 | 463.5 | 189.6 | 4474.1 | 543.3 | 350.1 | 516.3 |
| Zielona Góra | 4251.50 | 2781.80 | 1045.70 | 282.8 | 96.8 | 2439 | 201.8 | 195.5 | 319.4 |
| Łódź | 17,601.50 | 13,274.50 | 2912.60 | 1018.6 | 431.5 | 11,817.5 | 400.5 | 543.7 | 1138.3 |
| Kraków | 23,213.70 | 16,920.30 | 4795.10 | 973.6 | 358.2 | 13835 | 369.8 | 908.5 | 1130 |
| Warsaw | 49,765.00 | 37,920.40 | 8520.80 | 2231.7 | 632 | 32,940.3 | 1309.5 | 1360.6 | 2549.6 |
| Opole | 3844.60 | 2632.00 | 809.10 | 285.3 | 82.9 | 2296.8 | 62.6 | 90.2 | 314.8 |
| Rzeszów | 3693.70 | 2377.60 | 866.40 | 295.9 | 103.1 | 2056.3 | 107.7 | 137.8 | 329.8 |
| Białystok | 5614.10 | 3675.50 | 1249.90 | 480.9 | 195.8 | 2986.9 | 289.6 | 234.9 | 534.9 |
| Gdańsk | 12,978.40 | 9048.70 | 3078.30 | 577.1 | 231.9 | 8787 | 339.5 | 410.9 | 650.9 |
| Katowice | 14,188.70 | 8462.50 | 4853.50 | 511.8 | 264.6 | 8767.7 | 408.3 | 327.8 | 580.2 |
| Kielce | 5723.10 | 3415.70 | 1837.10 | 301.1 | 127.1 | 2825.8 | 235.8 | 211 | 349.1 |
| Olsztyn | 4160.00 | 2717.80 | 1107.30 | 229.2 | 100.5 | 2637.7 | 94.1 | 148.5 | 250.2 |
| Poznań | 17,726.70 | 13,642.80 | 3073.70 | 627.8 | 324.1 | 11,296.7 | 607.8 | 743.7 | 717.1 |
| Szczecin | 13,226.00 | 10,351.00 | 1596.10 | 842.9 | 247.6 | 6316.9 | 283.1 | 2514.5 | 938.8 |
| Total for the studied cities | 215,023.40 | 156,565.80 | 42,543.50 | 10,477.30 | 3832.30 | 134,552.50 | 5961.80 | 9198.70 | 12,024.00 |
Table 4.
Index of the dynamics of change in criminal offenses from 2013 to 2022 (2013 = 100%).
| Cities Studied | Dynamics of Change in Criminal Offenses | |||||
|---|---|---|---|---|---|---|
| Against General Security and Safety in Communications—Road Traffic | Against Life and Health | Against Property | Against the Family and Guardianship | Against Freedom, Freedom of Conscience, Sexual Freedom and Morality | Against General Security and Safety in Communications | |
| % | ||||||
| Wrocław | 74.31 | 70.63 | 66.73 | 57.88 | 51.95 | 31.77 |
| Bydgoszcz | 73.52 | 47.79 | 67.26 | 122.01 | 112.31 | 85.28 |
| Lublin | 57.53 | 62.81 | 61.21 | 87.21 | 127.33 | 65.07 |
| Zielona Góra | 62.86 | 58.41 | 95.54 | 210.91 | 119.35 | 68.52 |
| Łódź | 62.19 | 55.79 | 60.46 | 75.85 | 65.13 | 68.60 |
| Kraków | 42.83 | 44.94 | 65.81 | 48.32 | 177.78 | 49.64 |
| Warsaw | 55.17 | 55.76 | 97.23 | 194.40 | 92.76 | 62.41 |
| Opole | 37.96 | 49.64 | 53.54 | 157.14 | 83.58 | 41.41 |
| Rzeszów | 56.68 | 78.69 | 66.31 | 189.53 | 107.84 | 60.74 |
| Białystok | 48.52 | 44.21 | 86.74 | 180.50 | 63.78 | 55.73 |
| Gdańsk | 78.23 | 77.94 | 81.97 | 358.02 | 137.39 | 87.78 |
| Katowice | 73.27 | 53.87 | 73.09 | 151.81 | 102.25 | 83.86 |
| Kielce | 51.96 | 51.83 | 64.67 | 215.04 | 111.73 | 61.57 |
| Olsztyn | 62.46 | 32.65 | 98.19 | 85.33 | 56.86 | 67.50 |
| Poznań | 40.85 | 53.70 | 56.87 | 150.11 | 58.10 | 47.03 |
| Szczecin | 86.26 | 62.05 | 67.34 | 141.54 | 72.68 | 91.92 |
| Total for the surveyed cities | 58.64 | 56.00 | 73.32 | 91.70 | 133.90 | 58.78 |
Table 5.
Annual values of offense concentration indicators (LQT and LQn).
| Cities Studied | Grand Total LQT | Criminal Offense LQc | Economic Offense LQe | Traffic Offense LQtc | Against Life and Health LQl&h | Against Property LQp | Against Family and Guardianship LQf&c | Against Freedom LQf | Against Public Safety and Safety in Transport LQps |
|---|---|---|---|---|---|---|---|---|---|
| Wrocław | 1.24 | 1.10 | 0.61 | 1.25 | 0.91 | 1.49 | 0.45 | 1.34 | 1.36 |
| Bydgoszcz | 0.82 | 0.90 | 1.42 | 0.83 | 0.87 | 0.99 | 1.87 | 0.57 | 1.11 |
| Lublin | 0.81 | 0.96 | 1.14 | 1.10 | 1.12 | 0.67 | 2.74 | 0.42 | 1.13 |
| Zielona Góra | 1.04 | 0.90 | 1.38 | 1.10 | 0.94 | 0.72 | 1.87 | 0.63 | 1.25 |
| Łódź | 0.90 | 1.04 | 0.81 | 1.42 | 1.16 | 0.78 | 0.76 | 0.88 | 1.60 |
| Kraków | 1.02 | 1.00 | 1.04 | 0.82 | 1.01 | 1.10 | 0.60 | 1.59 | 0.95 |
| Warsaw | 0.95 | 1.05 | 0.83 | 1.06 | 0.77 | 1.48 | 0.90 | 0.67 | 1.43 |
| Opole | 1.03 | 0.94 | 1.13 | 1.43 | 0.79 | 0.79 | 0.62 | 0.93 | 2.67 |
| Rzeszów | 0.64 | 0.88 | 1.34 | 1.39 | 0.95 | 0.57 | 1.18 | 0.83 | 1.83 |
| Białystok | 0.65 | 0.90 | 1.25 | 1.56 | 1.11 | 0.43 | 2.19 | 0.53 | 1.74 |
| Gdańsk | 0.95 | 0.96 | 1.25 | 0.76 | 1.10 | 1.08 | 0.87 | 0.78 | 1.21 |
| Katowice | 1.67 | 0.82 | 2.11 | 0.43 | 1.41 | 0.94 | 1.05 | 0.52 | 1.35 |
| Kielce | 1.02 | 0.82 | 1.98 | 0.67 | 1.15 | 0.63 | 1.88 | 0.58 | 1.27 |
| Olsztyn | 0.84 | 0.90 | 1.50 | 0.84 | 1.20 | 0.75 | 0.81 | 1.02 | 1.29 |
| Poznań | 1.14 | 1.06 | 0.83 | 0.83 | 1.41 | 0.99 | 1.21 | 0.79 | 0.74 |
| Szczecin | 1.14 | 1.07 | 0.57 | 2.14 | 0.80 | 0.73 | 1.01 | 3.89 | 0.29 |
Disclaimer/Publisher’s Note: The statements, opinions and data contained in all publications are solely those of the individual author(s) and contributor(s) and not of MDPI and/or the editor(s). MDPI and/or the editor(s) disclaim responsibility for any injury to people or property resulting from any ideas, methods, instructions or products referred to in the content. |
© 2023 by the authors. Licensee MDPI, Basel, Switzerland. This article is an open access article distributed under the terms and conditions of the Creative Commons Attribution (CC BY) license (https://creativecommons.org/licenses/by/4.0/).
Share and Cite
MDPI and ACS Style
Tutak, M.; Brodny, J. A Smart City Is a Safe City: Analysis and Evaluation of the State of Crime and Safety in Polish Cities. Smart Cities 2023, 6, 3359-3392. https://0-doi-org.brum.beds.ac.uk/10.3390/smartcities6060149
AMA Style
Tutak M, Brodny J. A Smart City Is a Safe City: Analysis and Evaluation of the State of Crime and Safety in Polish Cities. Smart Cities. 2023; 6(6):3359-3392. https://0-doi-org.brum.beds.ac.uk/10.3390/smartcities6060149
Chicago/Turabian StyleTutak, Magdalena, and Jarosław Brodny. 2023. "A Smart City Is a Safe City: Analysis and Evaluation of the State of Crime and Safety in Polish Cities" Smart Cities 6, no. 6: 3359-3392. https://0-doi-org.brum.beds.ac.uk/10.3390/smartcities6060149