Effect of Soil Moisture Content and End-Effector Speed on Pick-up Force and Lump Damage for Seedling Transplanting


Key Laboratory of Modern Agricultural Equipment and Technology, Ministry of Education, Jiangsu University, Zhenjiang 212013, China
*
Author to whom correspondence should be addressed.
AgriEngineering 2019, 1(3), 343-355; https://0-doi-org.brum.beds.ac.uk/10.3390/agriengineering1030026
Submission received: 15 May 2019
/
Revised: 1 July 2019
/
Accepted: 18 July 2019
/
Published: 22 July 2019
(This article belongs to the Special Issue Robotics and Automation Engineering in Agriculture)
Abstract
:Efficient transplanting has been identified as one of the essential steps towards achieving an increased yield in the farm. However, many factors are affecting these processes such as soil moisture content and the speed of pickup. This study was carried out to investigate the effect of different soil moisture content and pickup speeds on pickup force, balance, resistance, and lump damage during transplanting of seedlings. The results showed that penetration resistance was inversely proportional to the speed and soil moisture content. The highest penetration resistance (38 N) values were recorded under the lowest speed (0.5 mm/s) at the low moisture content; whereas, the lowest penetration resistance was obtained at highest speed (10 mm/s) under high moisture content. The highest pick-up force resistance values were recorded under the lowest speed (0.5 mm/s) at low moisture content than the lowest pick-up force resistance of 1.4 N at (10 mm/s) under the high moisture content. On the other hand, an increase of pick-up force led to a decrease in the pick-up force resistance. The pick-up damage and the pick-up speed are directly proportional—nevertheless, the former increased with a decreasing soil moisture content. The highest pick-up damage values (82%) were observed under the top-most speed (10 mm/s) at high moisture content. It can be concluded that for successful auto-transplanting of seedling the soil condition, the force applied and speed should be taken into consideration. This work will implement an effective seedling-picking performance and basis for the optimal design of end-effectors.
1. Introduction
Efficient transplanting has been identified as one of the critical steps towards achieving an increased yield on the farm. However, understanding the importance of the soil-lump physical and mechanical interaction effect on transplanting could enhance effective means of transplanting vegetables automatically [1]. The seedling transplanting machinery is mainly semi-automatic, and the bottleneck of its development lies in the seedling collection mechanism that is still in continuous research [2].
As developed by Choi (2002) [3], a gripping robot could be used for vegetable transplanting. The end-effector’s design of plug seedlings transplanting should be based on the mechanical properties of substrate lump [4]. Although the development of seedling transplanting system is focused on the composition of mechanical systems, there is relatively much less research on the effect of soil moisture content (SMC) and end-effector speed on changes in seedling pickup force and lump damage [5].
The impact of the restricting factors influencing seedling transplanting include soil substrate, lump moisture content, soil-root deformation, stress distribution by penetration pins, the end-effector’s pick-up speed, execution structure and characteristics used during transplanting [6,7,8,9].
Throughout the transplanting process, seedlings are picked-up steadily from the roots (usually in cell trays) by end-effectors and planted into pots or plug trays. The dynamic nature of the process, particularly the varieties of mechanical properties of seedling lump at varying moisture content and the influence of mechanical roles at different speeds affect the transplanting efficiency, which is a significant problem. Furthermore, the situation where end-effector’s pick-up pins penetrate through the soil-lump medium and damage the seedling lump is a serious problem [10].
This study aims to investigate the damage effect on seedling lumps under the effects of the end-effector pick-up force and extraction speed, as well as the effect of different moisture content levels. Moreover, a subsequent monitoring of this damage occurring on tomato plant seedling lump by using X-ray computed tomography (CT) system visualization techniques.
2. Materials and Methods
2.1. Principle of Force Gripping Seedling Lump Damage
From previous studies soils can be represented for seedling transplanting purpose, as a continuum medium with seedling lump and other items being components [11,12]. The root growth in the soil can be described with the assumptions that the root is considered as finite fibers with a relatively high tensile to differentiate its size from that of other components in the soil, which is assumed as having lower mechanical properties [13].
As a scientific approach, the aspect of considering mini-soil volume for analysis was brought to discussion as well as being pointed out by Dupuy et al. [14]. Such a method is particularly excellent as a mean of assessing the factors contributing to the development of lump properties in the soil, which corresponds to the seedlings lump damage in the soil, including elongation, cessation or death of meristems in the fiber of the living tissues, in addition to the root damage, which is the most significant part in the seedling soil lump conformity.
In estimating the soil-lump behavior under a compressive pick-up force, it was assumed that the substrate soil-lump medium is isotropic and the penetration force, as well as, parallel compression had an effect on the soil-lump properties. Additionally, following the principle proposed by Zhang and Cai, 2010 [15], the following equations were used to quantify the damage of materials:
where, is the damaged area and is the total area of the object. In this study, d is the damaged part.
2.2. Study Area Characterization
This study was carried out in the modern greenhouse of Jiangsu University—China. Soil substrate mix of peat moss, vermiculite and perlite was prepared in the ratio of 3:1:1 (v/v), then was packaged into cell trays at a bulk density of 0.28 g cm−3. Tomato (Lycopersicon esculentum L.) seeds were sown in the center of each individual tray cell. After germination, the samples were subjected to daily watering application to restore some cohesion between aggregates and restructure the soil.
2.3. Force Application on the Seedling Soil Lump
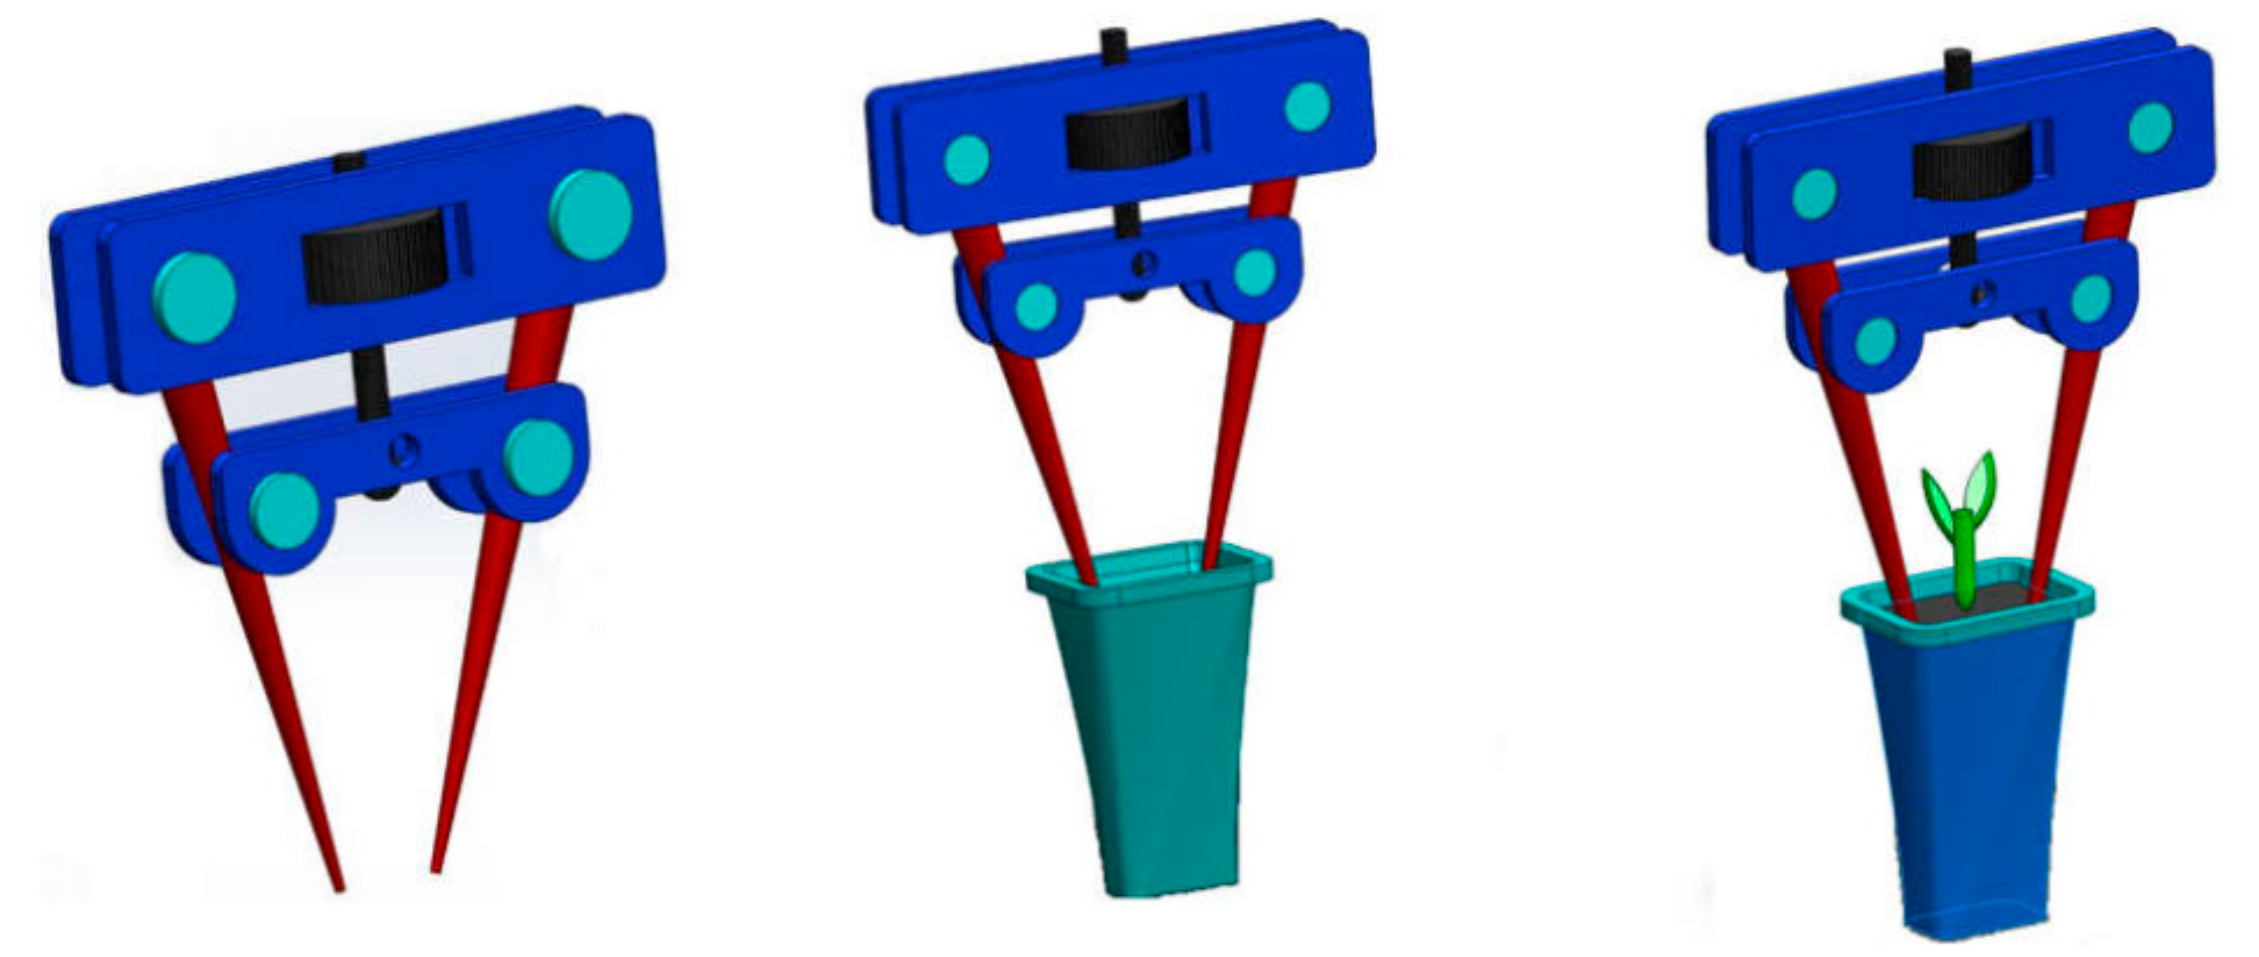
A manual device was employed in the application of force on the seedling soil lump (Figure 1). The force was manually applied by turning the round knob at the top of the device, which equally distributes the force effect on the soil via the two pins. Strain gauge load-cell sensors (Hungyan Juxing Testing Instrument Factory, Tai Zhou, China) of 120 ± 0.2 Ω resistors were selected and used with each finger having two fixed on it to form a balanced Wheatstone bridge.
Wires were connected to the strain gauges by soldering and the semi-bridge was subsequently linked with an amplifier that will produce signals (in mV). The system was calibrated using increasing level of known loads (1 N, 2 N, 3 N, 4 N, 5 N, 6 N, and 7 N) and the change in signal tracked accordingly. A relationship between the signal (mV) and load (N) was plotted and established (Supplementary Figure S1).
2.4. The Water Moisture Contents Measurements
The seedlings that lump the moisture content at two levels (air-dried and after watering) were determined gravimetrically. Ten soil samples were randomly selected from each group, samples of each group were mixed, then divided and placed into a pre-labeled Petri dish, weighed, then dried in a DZF-6050 vacuum oven (Shanghai, China) for 8 h at 105 °C. The two groups of dishes were re-weighed on a Sartorius electronic balance (range of 0–200 g, accuracy of 0.1 mg) until a constant weight was achieved. The average moisture content of the wet group was 75.69% whereas that of the dry group was found to be 38.09%. The levels of the two groups can represent the changes of water before and after watering.
2.5. Test of Seedling Lump Resistance Using the Texture Analyzer Test
The seedling lump samples were firstly fixed on the seedling platform of the texture analyzer (Stable Micro Systems Ltd., Godalming, Surrey, UK). When starting the test, a test rod was pushed in a vertical motion into the seedling soil lump sample, the loading test was set to “Return to Start” and the loading depth was 40 mm. The loading test was carried out at different speeds of 0.5 mm/s, 5 mm/s and 10 mm/s, respectively for the determination of soil lump penetration and pick-up resistances, and each test repeated 20 times.
2.6. Test of the Simulated Picking up Seedlings Using an End-Effector
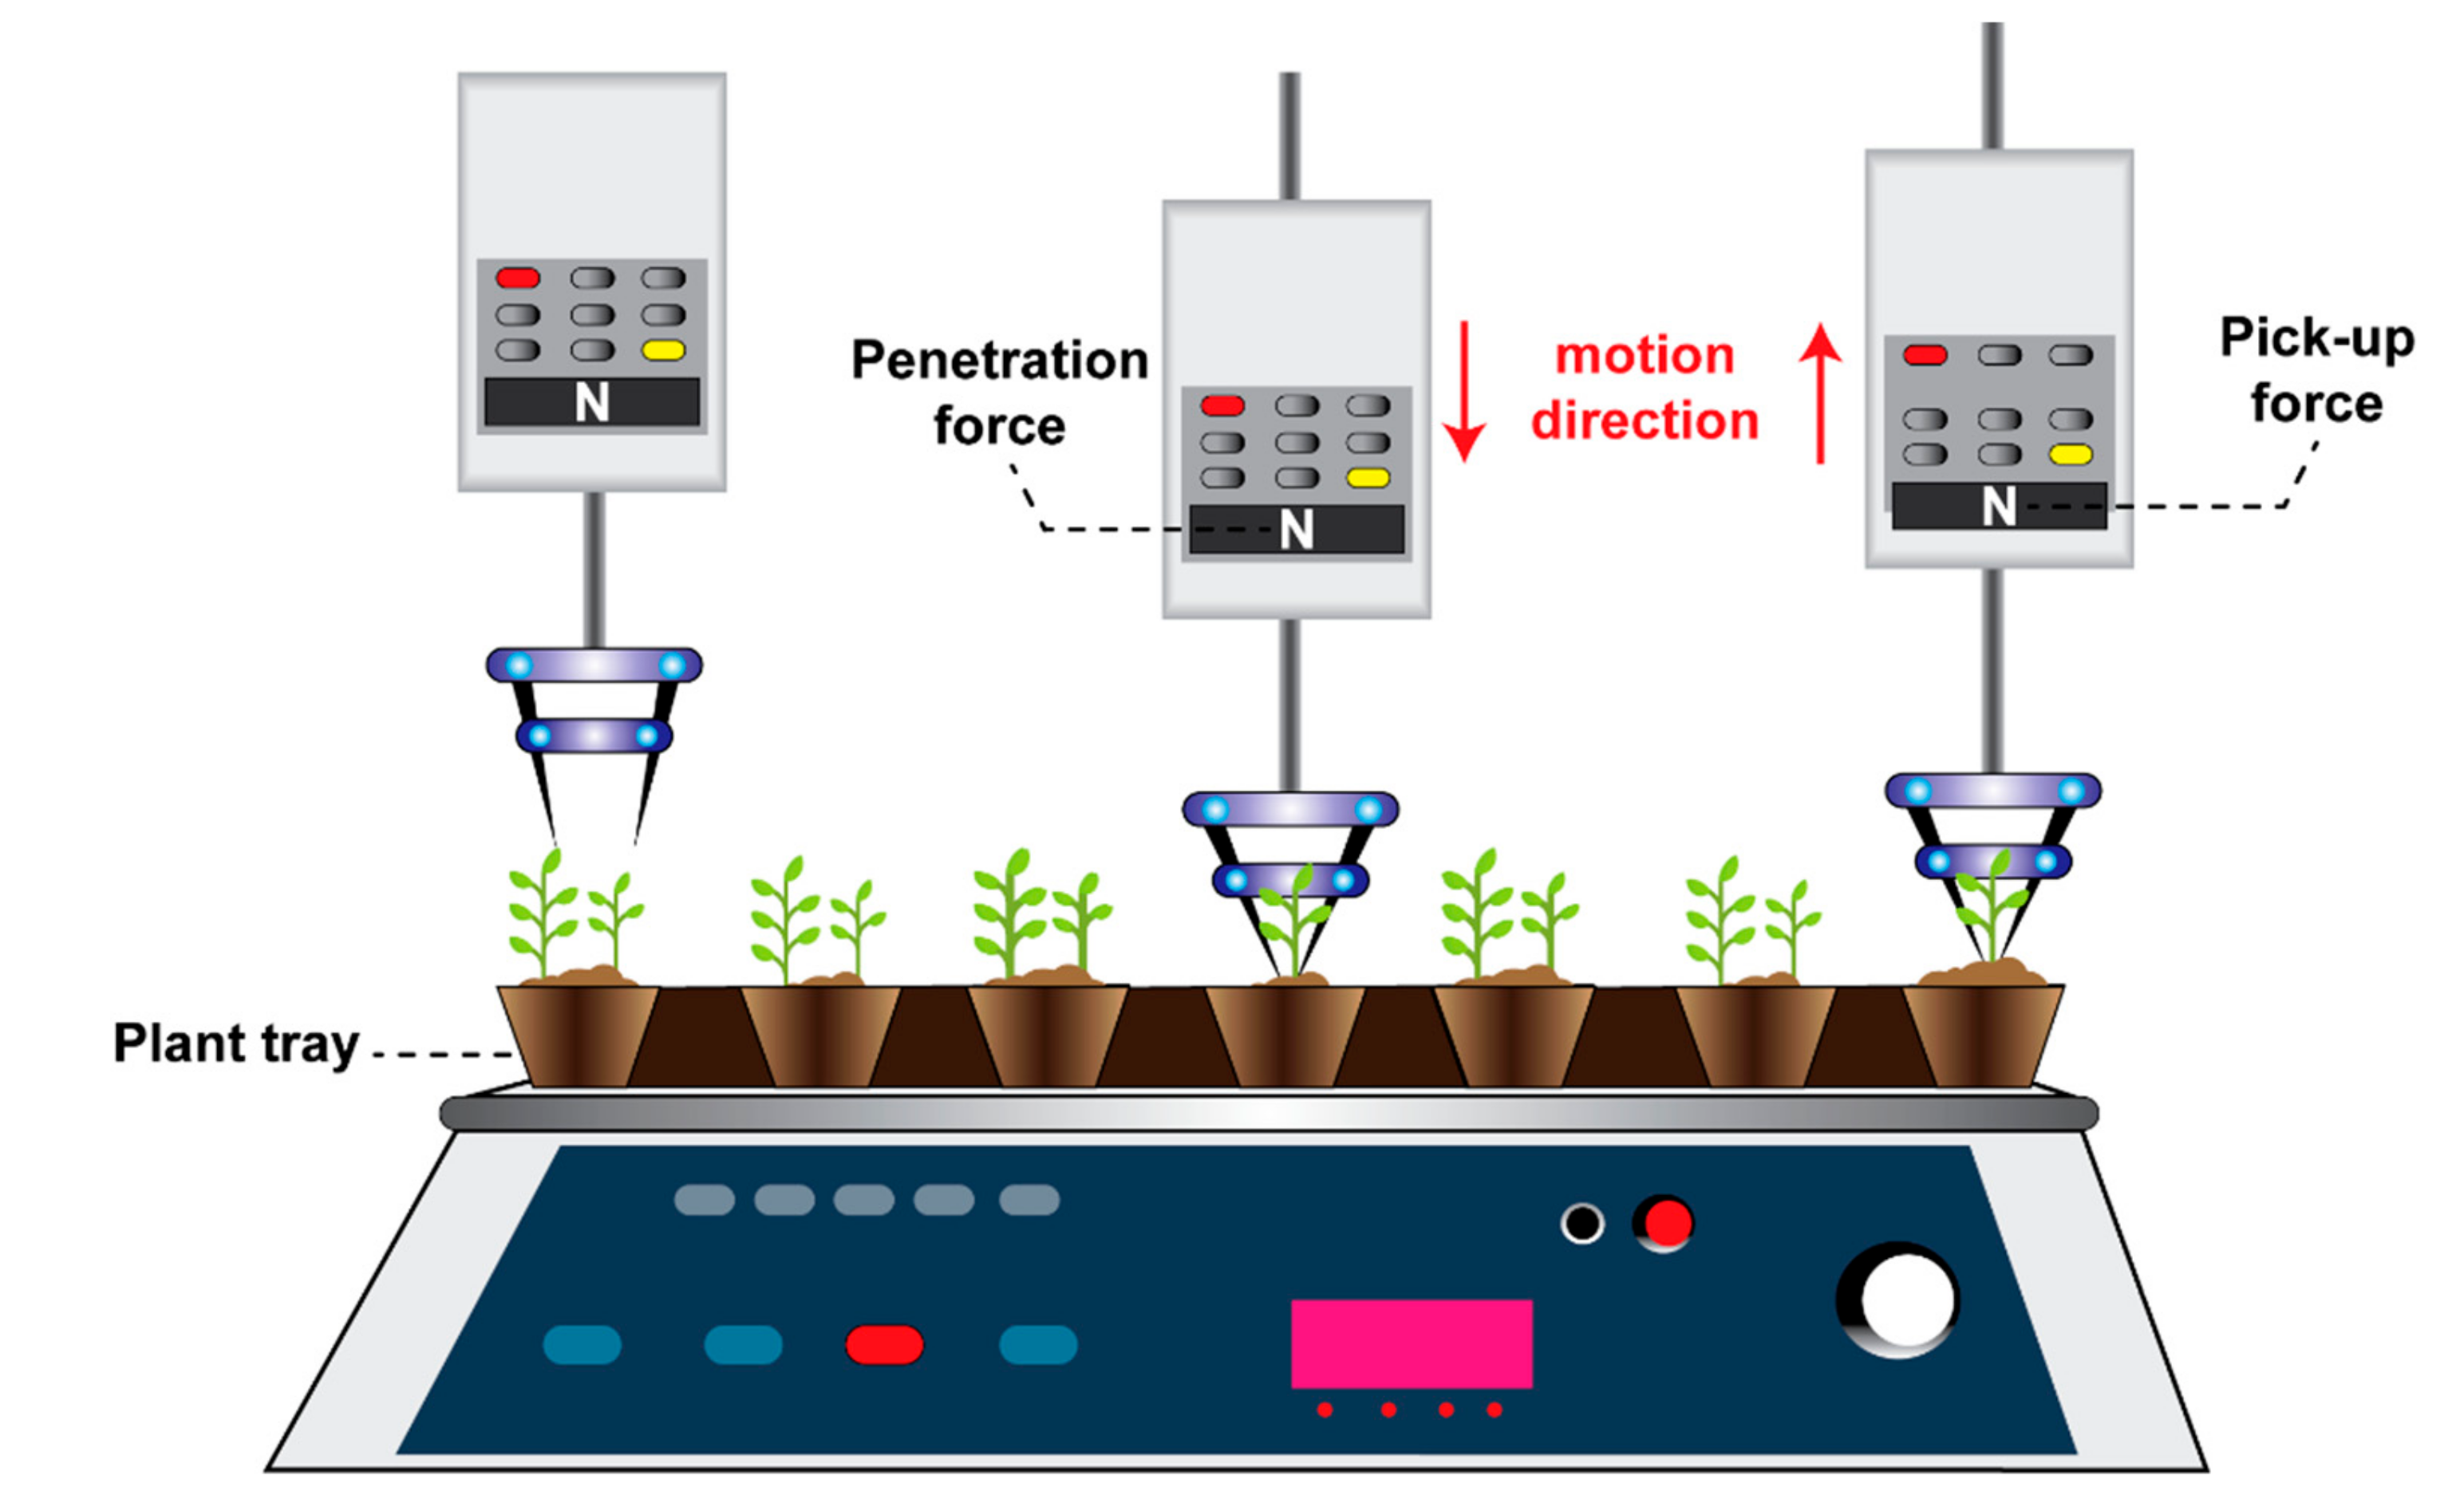
As illustrated in Figure 2, the seedlings were set fixed on a stage of a vertical single-column test bench. The plug seedling equipped with a DESIK digital display force gauge was attached to the vertical single-column test through the electric single column test. When starting the measurement to investigate the penetrating and picking forces, all initial pre-adjustments were arranged, producing an oblique angle at the two fingers of the end-effector. The DESIK digital push–pull force gauge (range of 100 N, with a precision of 0.1 N) was mounted on the moving plate of the test bench. The test rod of DESIK was connected to the end effector through a screw hole. Upon starting the simulated soil entry test the end-effector was inserted by a 15° oblique angle, test speed was 10 mm/s, with a depth of 40 mm, the force required for the rod was measured in three different speeds (10, 5 and 0.5 mm/s), within two different moisture content levels of the seedling soil-lump, these three different speeds were applied and the trial was replicated nine times (each speed repeated three times).
2.7. SCANCO X-ray Tomography Facility Experiment
Scanning experiments were conducted with SCANCO X-ray machine tomography (Supplementary Figure S2). Using tomato seedling samples with the manual force instrument for applying different average forces of 6 N, 7.5 N and 9 N, strain gauge sensors were used to estimate the forces on the finger of the instrument. In scanning the seedling soil, a resolution of 51.3 μm was used. In order to reduce errors associated with the detection and visualization of small artifacts, the scans for each level of force application was conducted on three samples and each sample was scanned in triplicates. Scanning configurations used in this experiment are listed in Supplementary Table S1.
2.8. Damage Investigation
For damage evaluation, a total of nine samples seedlings lump with three replicates for each condition were investigated under different pick-up compression forces. The manual pick-up end-effector force instrument (described in Figure 1) was configured for different forces and tested with the CT to monitor the position, size, direction of the primary gap and possible cracks in the process of gripping. Prior to imaging, the manual pick-up end-effector could fit into the 100 mm diameter sample holder for the X-ray scanning system. The process of clamping the pins effects on the compression deformation by X-ray CT scanning was conducted on the samples before and after the application of 6, 7.5 N and 9 N forces to the seedling soil system.
The internal structure image series at various depths of visualization were used to analyze the form and degree of damage as well as the internal structure. Since it was challenging to show the damage present in 3D view, the visualization of the crack was presented by sub-volumes of the predicted damaged area. Hence, upon obtaining the sub-volumes by the SCANCO X-ray machine software using a setting of different color values to distinguish the crack from the uncracked areas the cracks/pores are indicated with the blue areas in the sub-volume as shown in the Supplementary Figure S3. The images were then imported into freeware ImageJ software for crack area quantification. Upon converting the images into 8 bits in the software, the thresholding command was used to segment the cracked area from the uncracked area. After this, the area was estimated using the ‘analyze particle’ command in the software.
2.9. Statistical Analysis
The experimental data were analyzed using the Minitab statistical analysis software (Minitab 17). The general linear model procedure was used to perform an analysis of variance. When F values were significant, mean values were compared by applying the least significant difference (LSD) test at the 0.05 level of significance.
3. Results
3.1. The Penetration Force Resistance as a Function of SMC, Penetration Speed S and Force F
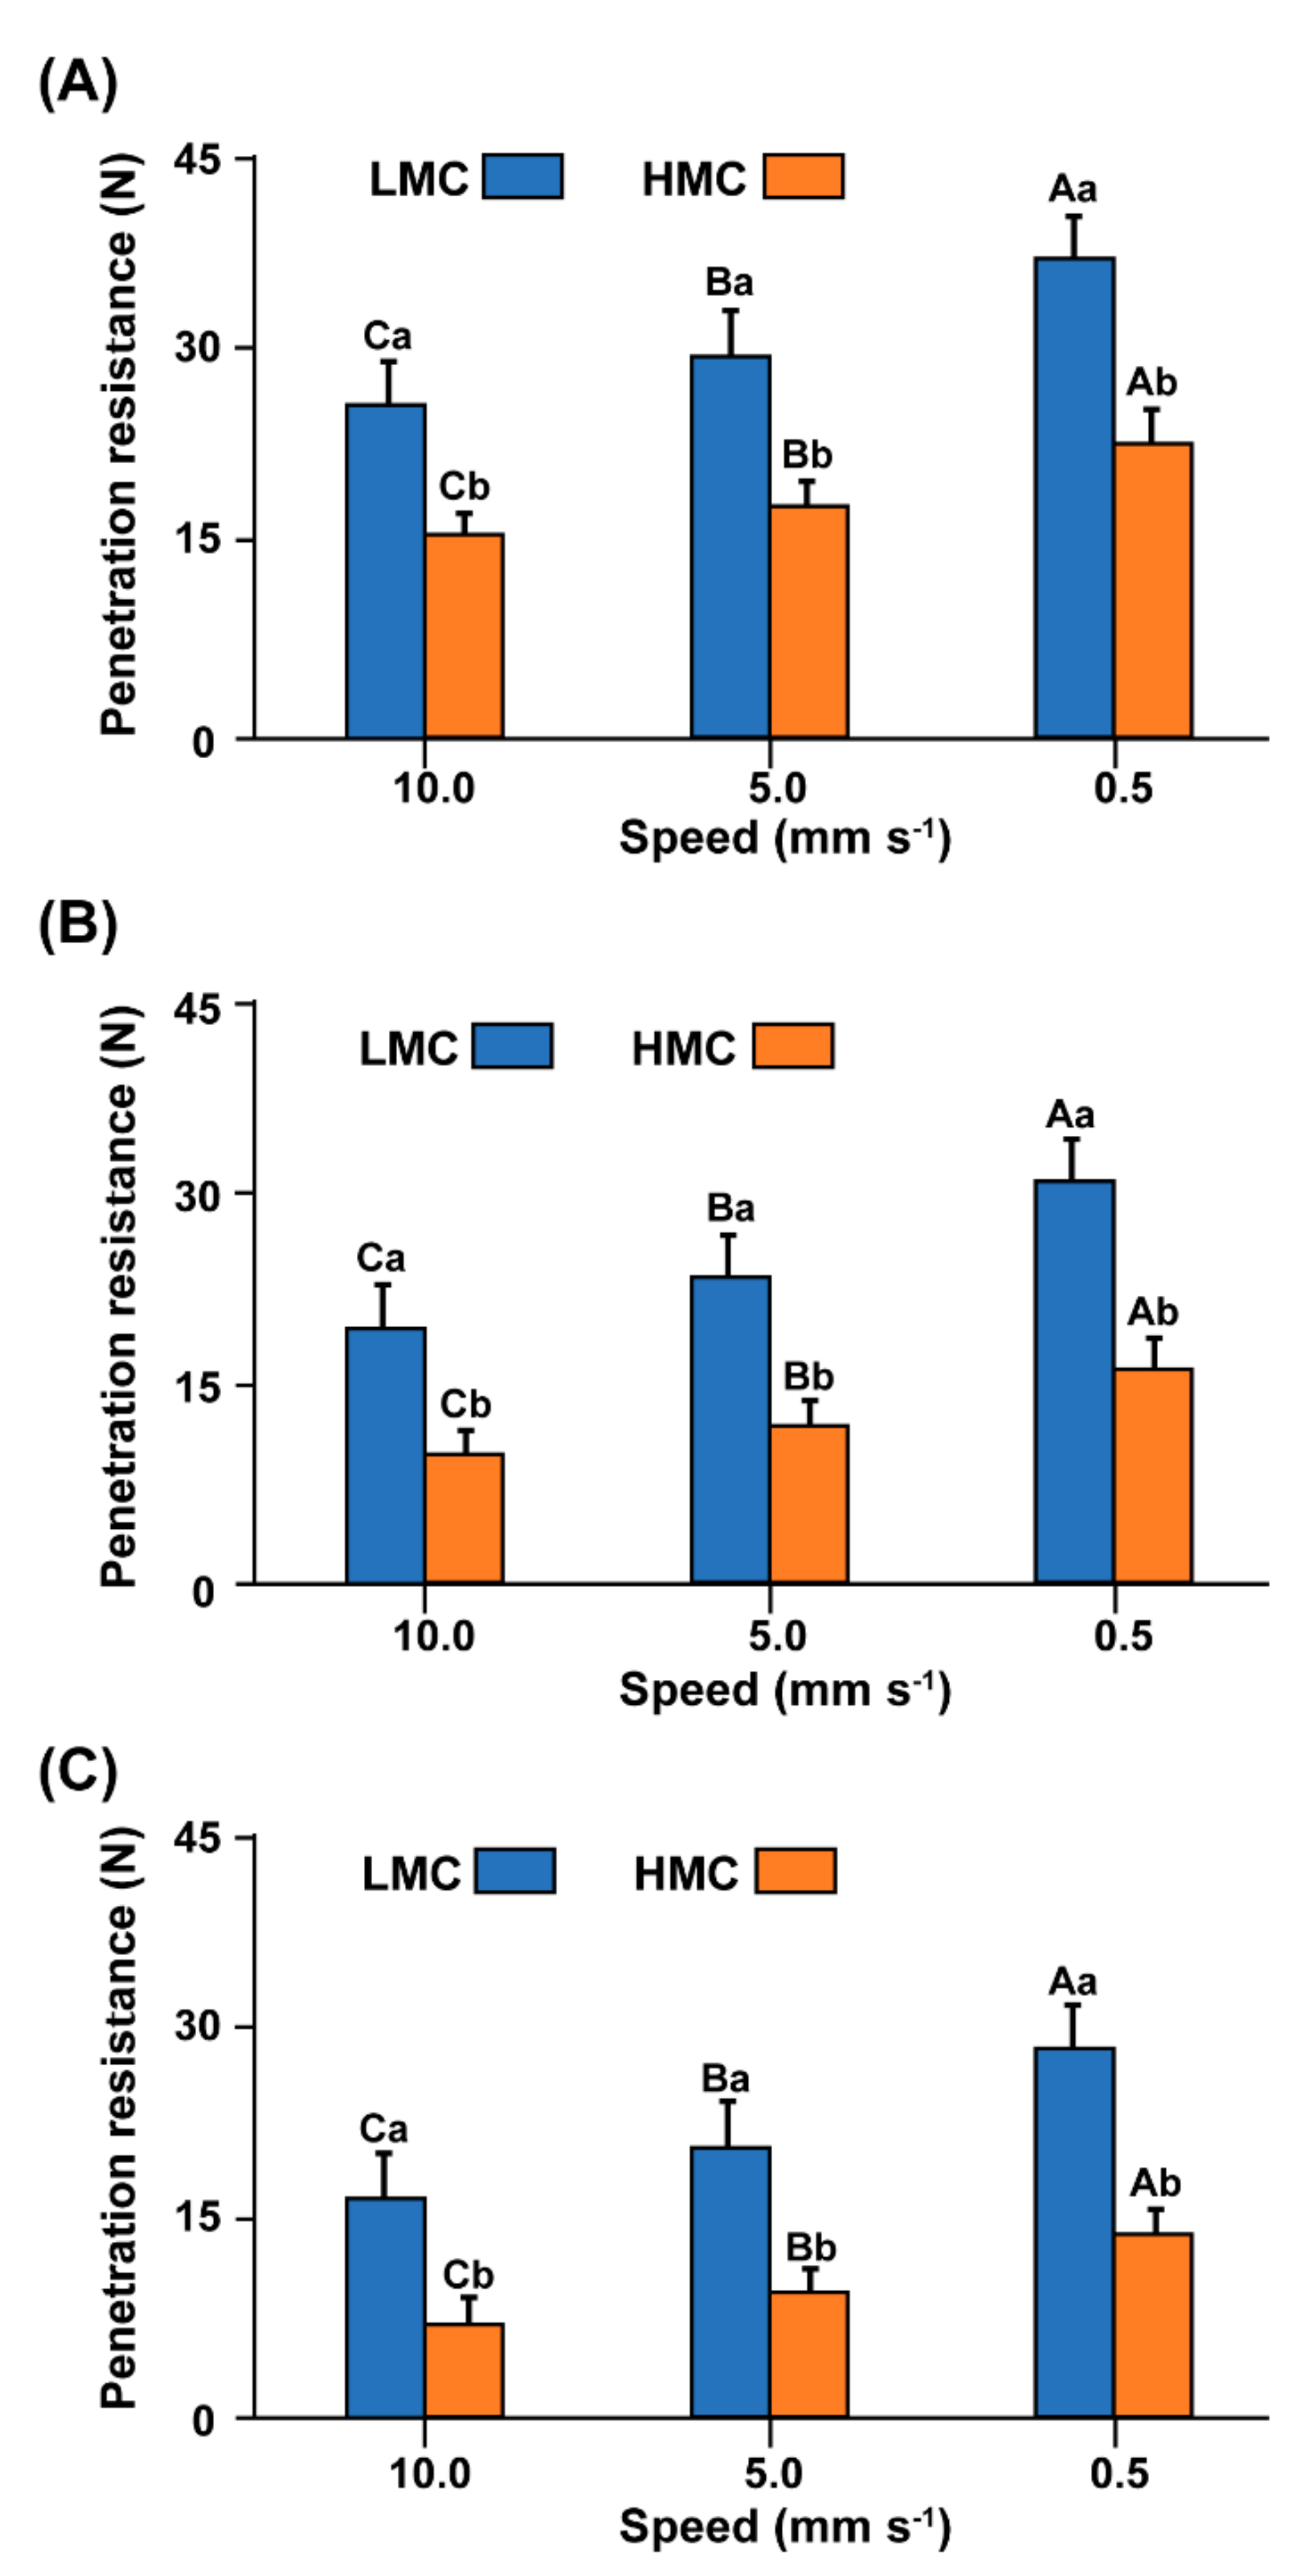
As shown in Figure 3, the penetration resistance was significantly (p ≤ 0.05) affected by the pick-up force, pick-up speed and the moisture content of the soil as high and low moisture content HMC and LMC, respectively. The penetration resistance increased with a decreasing pick-up speed but decreased with increasing moisture content. The highest penetration resistance values were recorded under the lowest speed of 0.5 mm/s at the lower moisture content; whereas, the lowest penetration resistance was obtained at the highest pick-up speed of 10 mm/s under the high moisture content. The increase in the penetration force led to a decrease in the penetration resistance, so the lowest penetration resistance was recorded under 9 N. At all the respective pick-up speeds, which corresponded to the highest penetration force applied.
3.2. The Pick-up Force Resistance as a Function of SMC, S and F
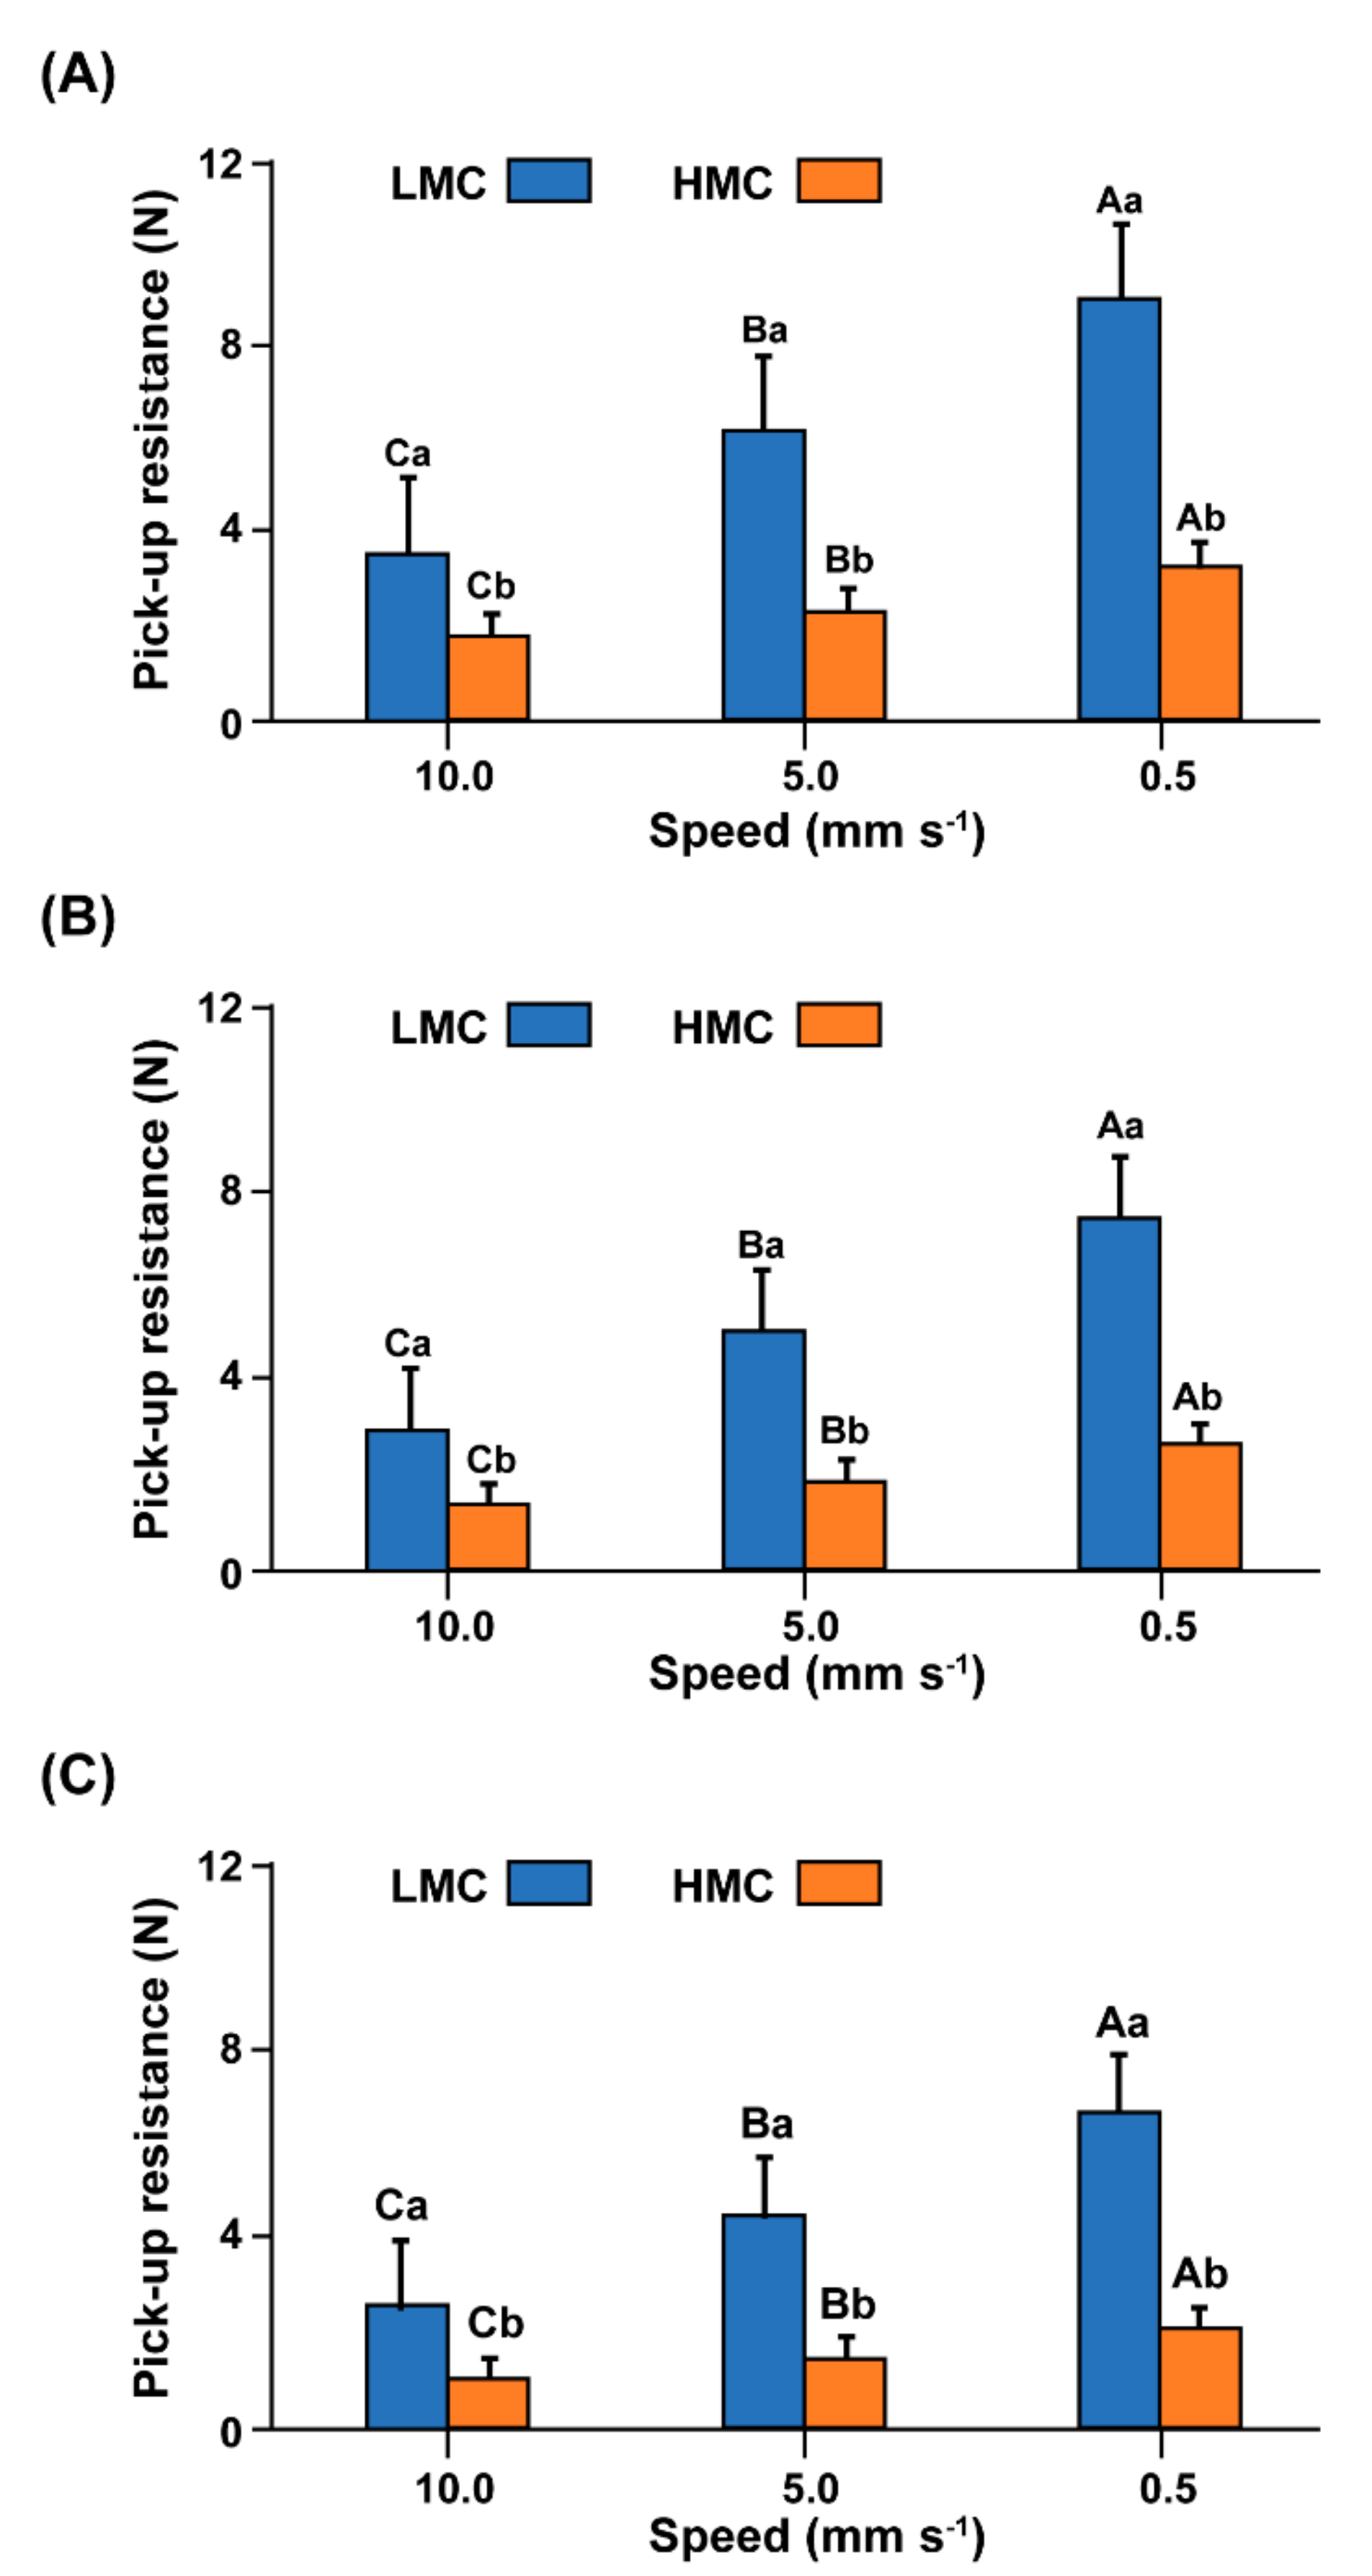
In Figure 4, the pick-up force resistance was significantly (p ≤ 0.05) affected by the pick-up force, pick–up speed and the SMC. The general trend was that the pick-up force resistance increased with a reduction in the pick-up speed. Moreover, it reduced with increased SMC. However, the highest pick-up force resistance values were recorded under the lowest speed (0.5 mm/s) at the low moisture content (LMC); whereas, the lowest pick-up resistance was obtained at 10 mm/s under the high moisture content HMC. On the other hand, the increase of the pick-up force led to a decrease in the pick-up force resistance at the highest force, 9 N, applied.
3.3. The Pick-up Force and Pick-up Resistance
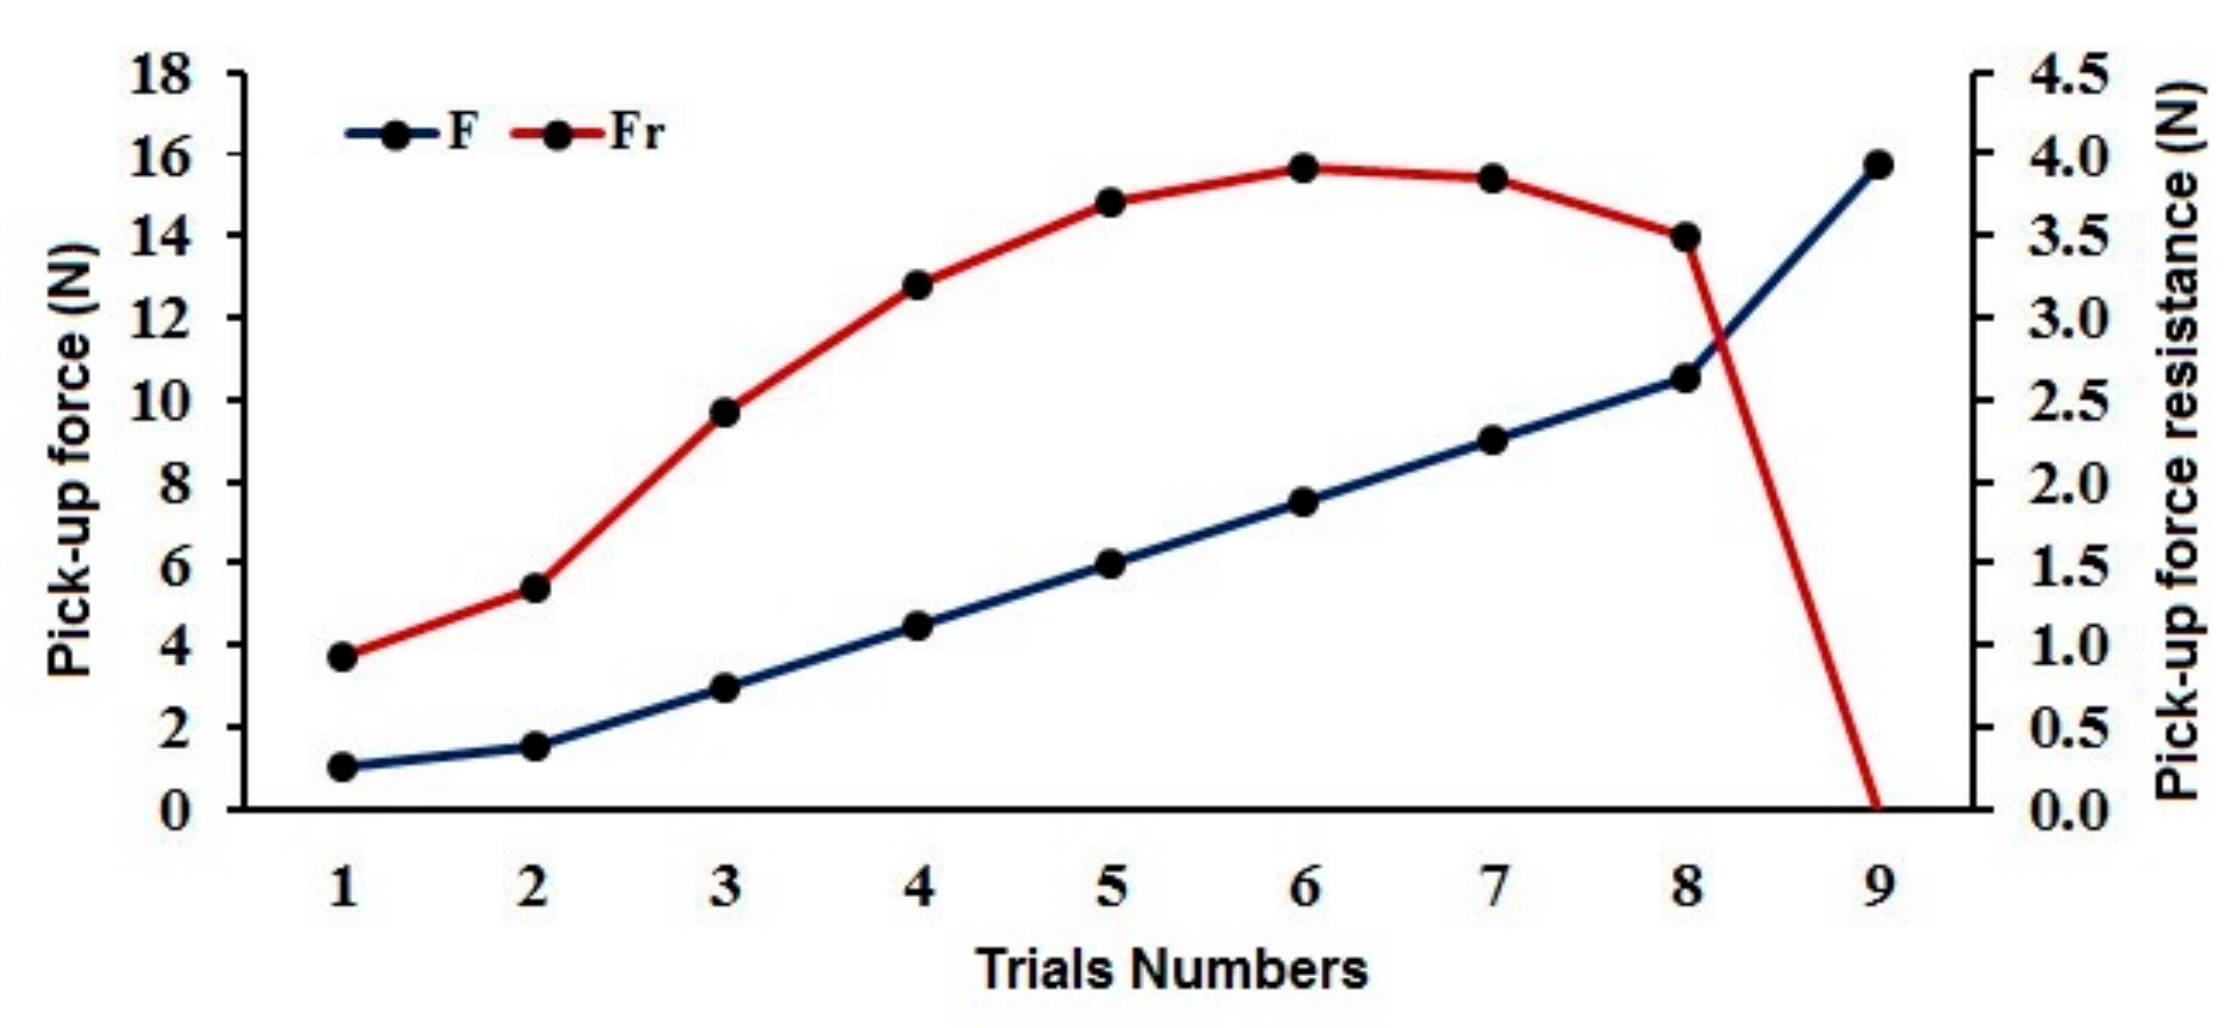
The relationship between the pick-up force and pick-up force resistance is given in Figure 5. By gradually increasing the pick-up force in nine trails, the values of the pick-up force resistance linearly increased with an increasing pick-up force reaching a highest pick-up force resistance value of 4 N, which was corresponding to the pick-up force of approximately 7.8 N, whereas the further increase of the pick-up force (15.75 N) led to a drastic fall in the corresponding resistance down to 0 N.
3.4. The Pick-up Damage as a Function of SMC, S and F
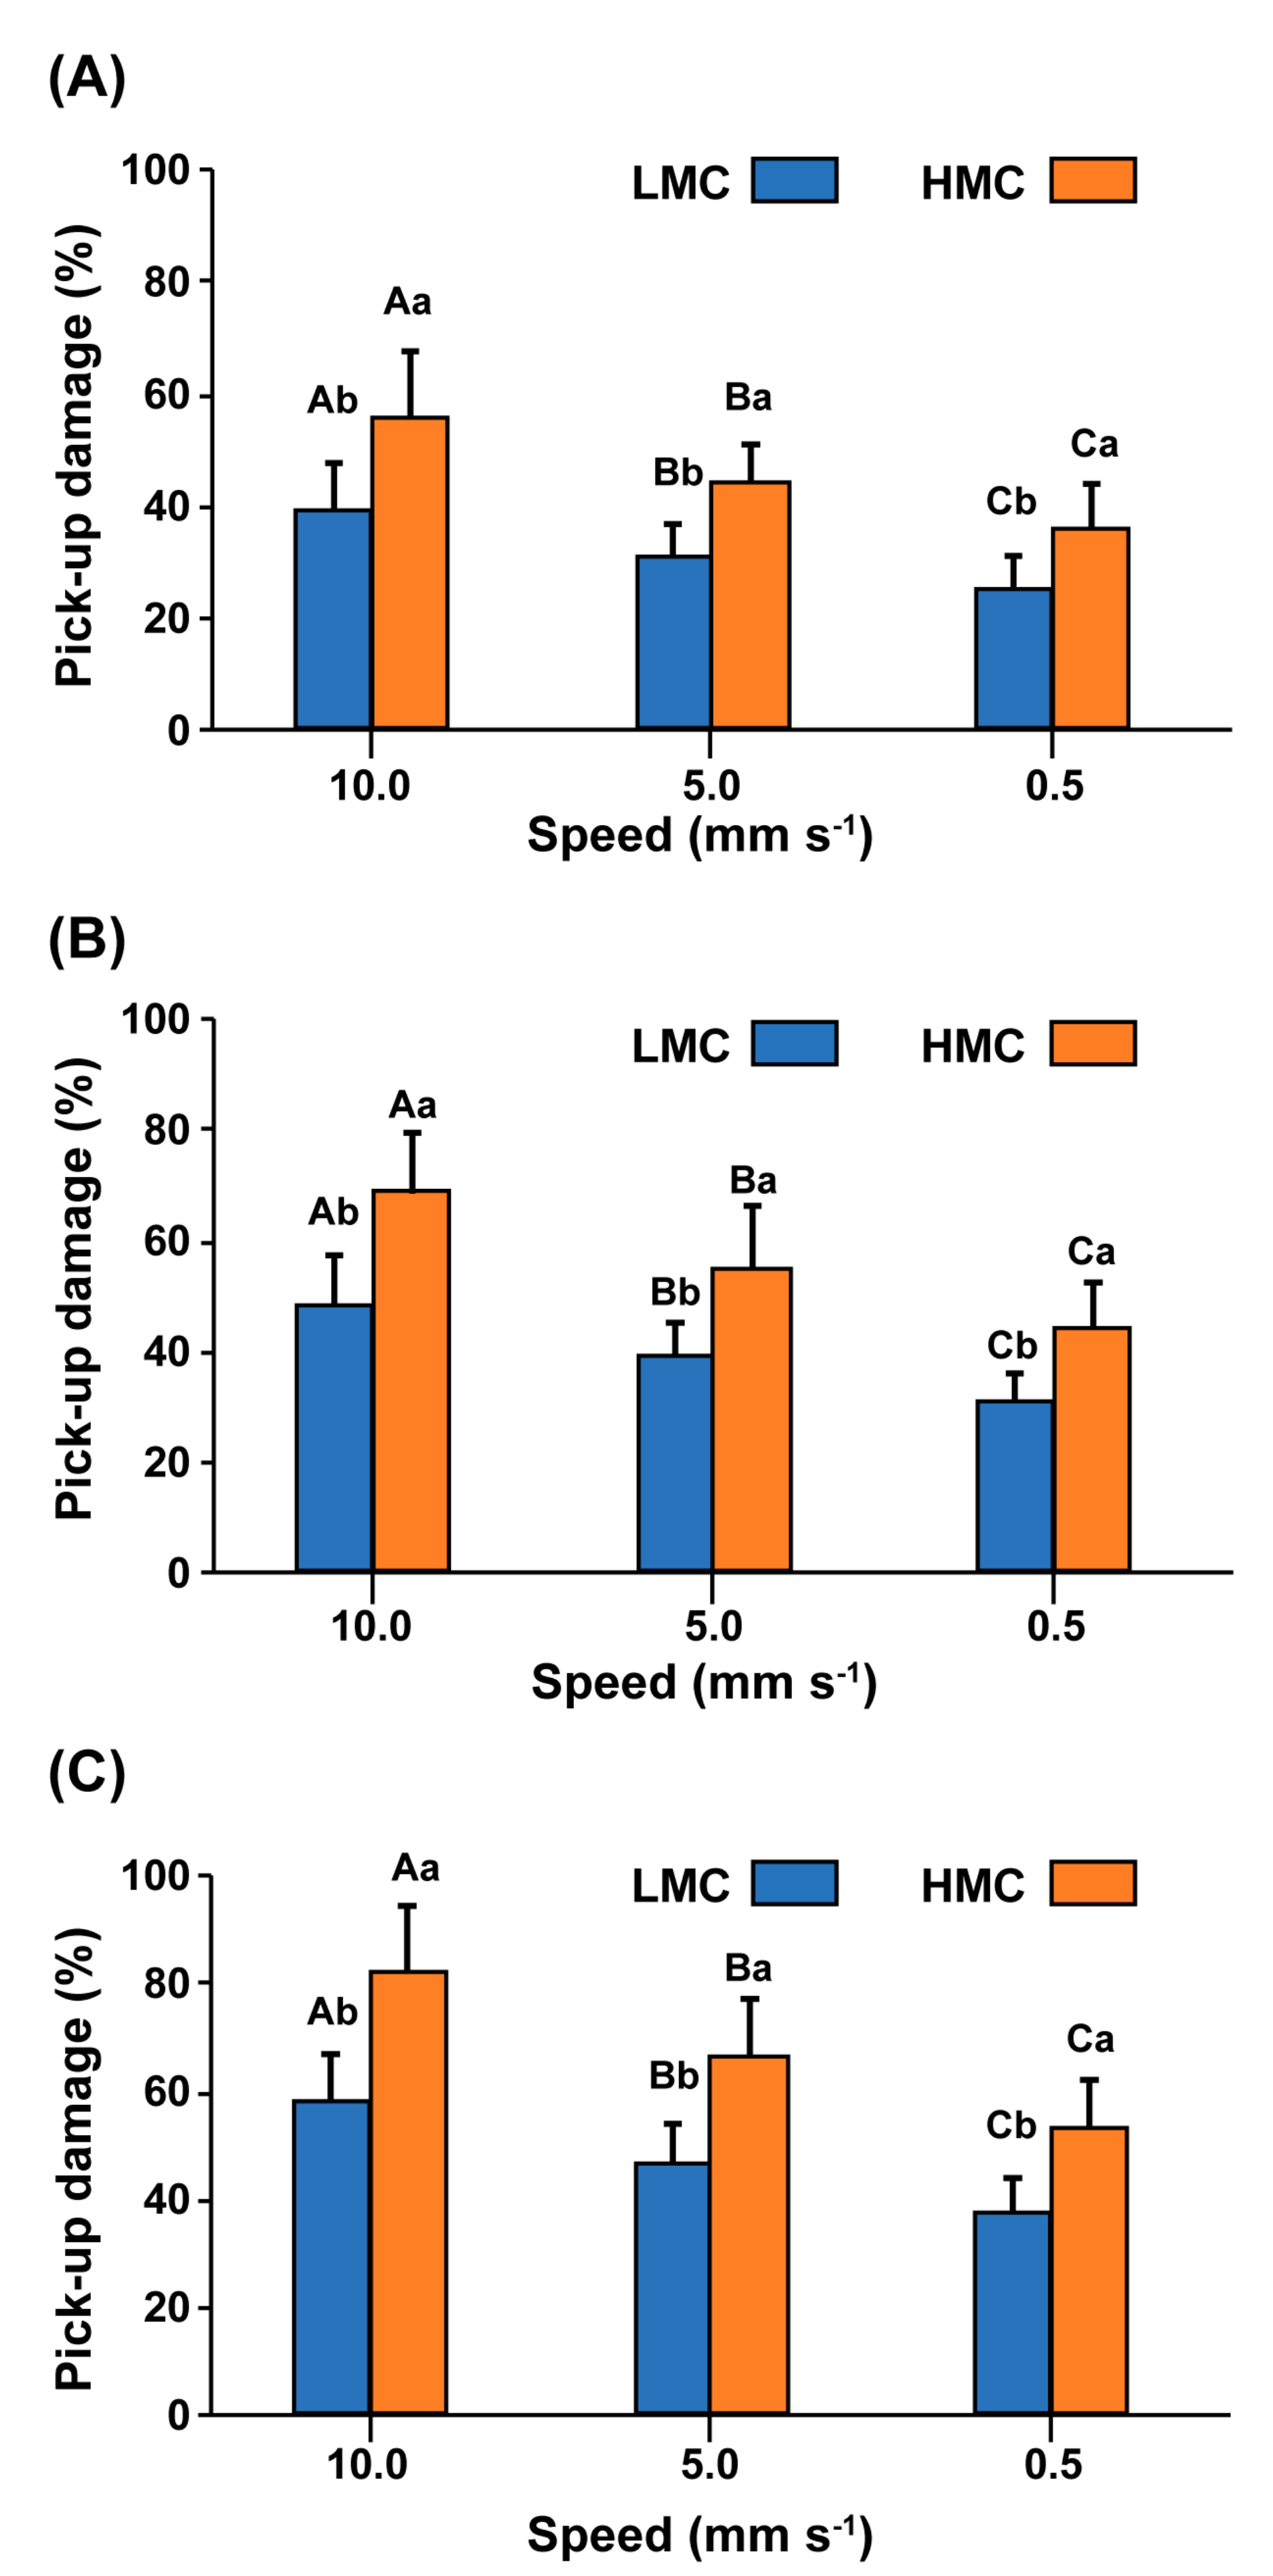
The percentage of pick-up damage was significantly (p ≤ 0.05) affected by the pick-up force, pick-up speed and the SMC (HMC and LMC, Figure 6). The results obtained indicated that the pick-up damage decreased with the decrease in the pick-up speed but increased with the decrease in SMC. The highest pick-up damage values were observed under the most top speed (10 mm/s) at HMC, whereas, 0.5 mm/s obtained the lowest pick-up damage under the LMC. On the other hand, the increase of the pick-up force led to the rise in the pick-up damage hence the highest pick-up damage values were obtained by the most top force applied of 9 N.
3.5. The Damage as a Function of the Force Balance
Force balance is the ratio between the pick-up force resistance and the pick-up force. The seedling lump damage increased with the decrease of the force balance (Figure 7). The mutual values of the damage (D) and the force balance (FFR−1) pattern are inversely proportional to one another. When the value of the force balance ratio is at the high level the corresponding value of the damage is at the lowest level and vice versa. That means the maximum level of the 100% damage happened at the least force balance, corresponding to the zero-force balance, and the minimum damage level happened at the peak of force balance ratio approximately at 0.83%.
3.6. The Force Balance Ratio as a Function of SMC, S and F
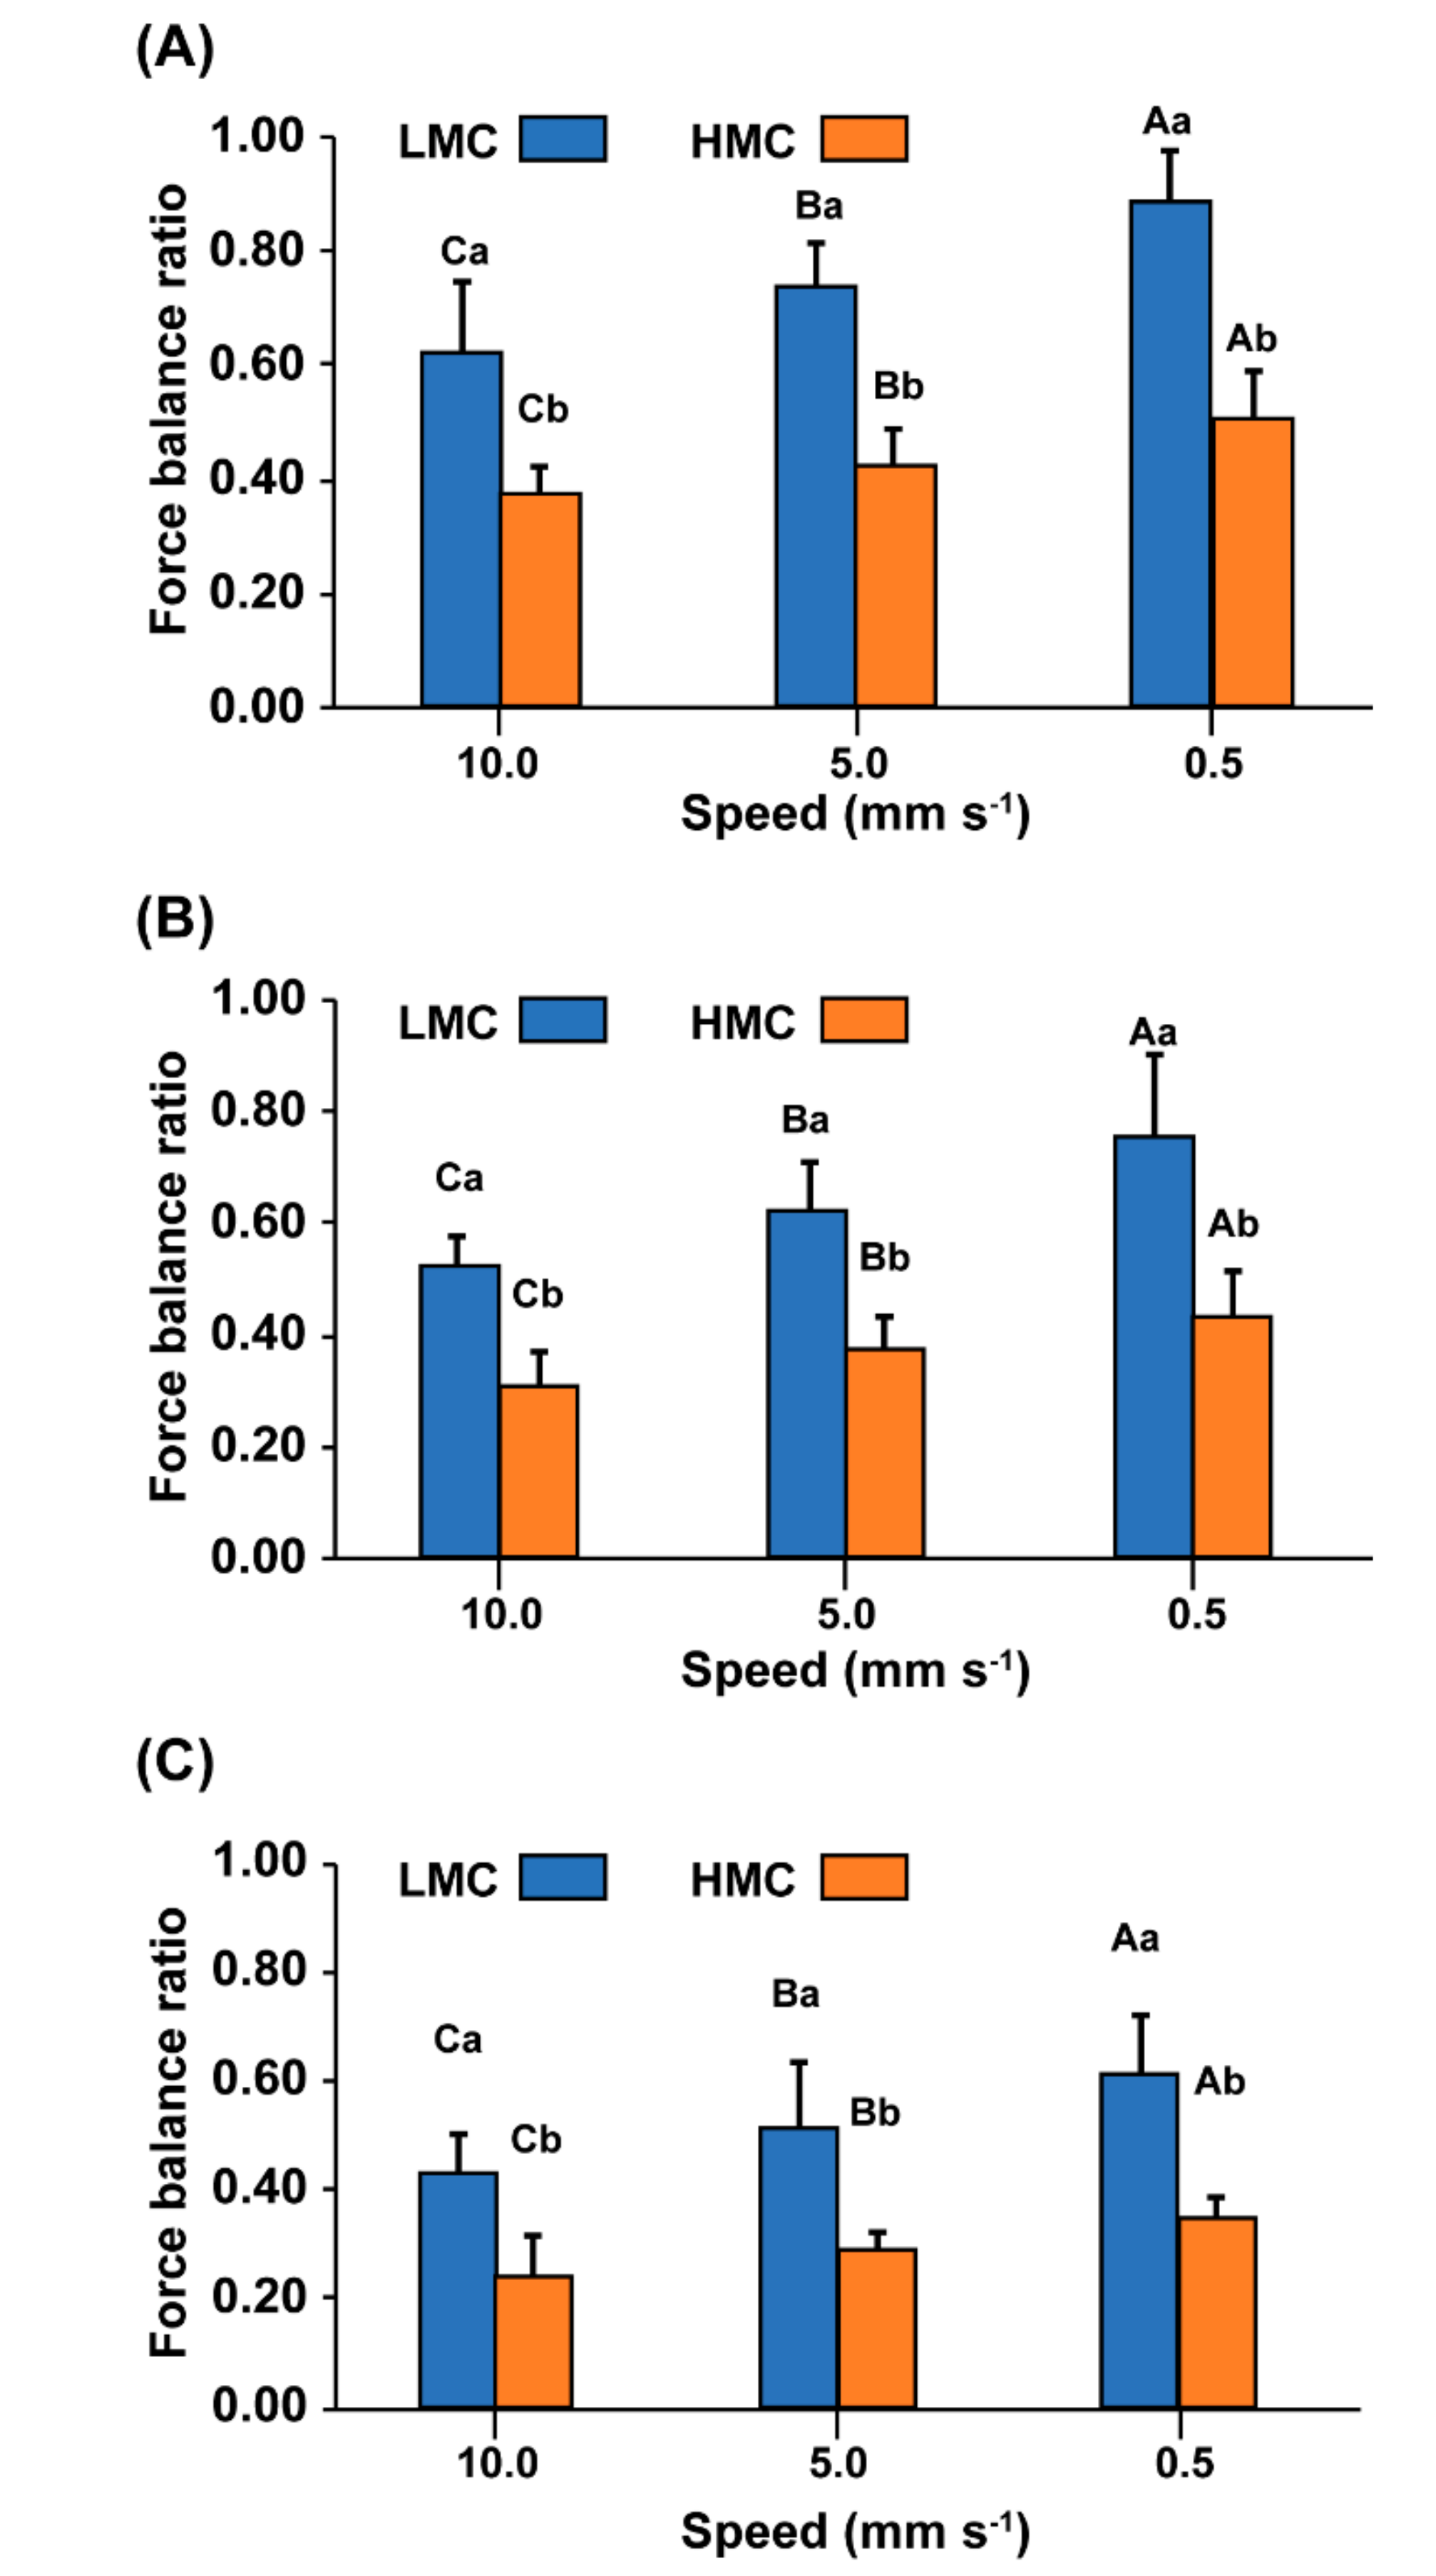
As shown in Figure 8, the force balance ratio was significantly (p ≤ 0.05) affected by the pick-up force, pick-up speed and the SMC. The general trend was that the force balance ratio increased with the decrease in the pick-up speed. Moreover, it decreased with the increase in SMC. Additionally, the highest force balance ratio values were recorded under the lowest speed (0.5 mm/s) at the LMC; meanwhile, the lowest force balance ratio was obtained by (10 mm/s) under the HMC. Likewise, the increase of the pick-up force led to a decrease in the force balance ratio, so the maximum force balance ratio recorded under a 9 N force.
3.7. The Damage as a Function of the Pick-up Force
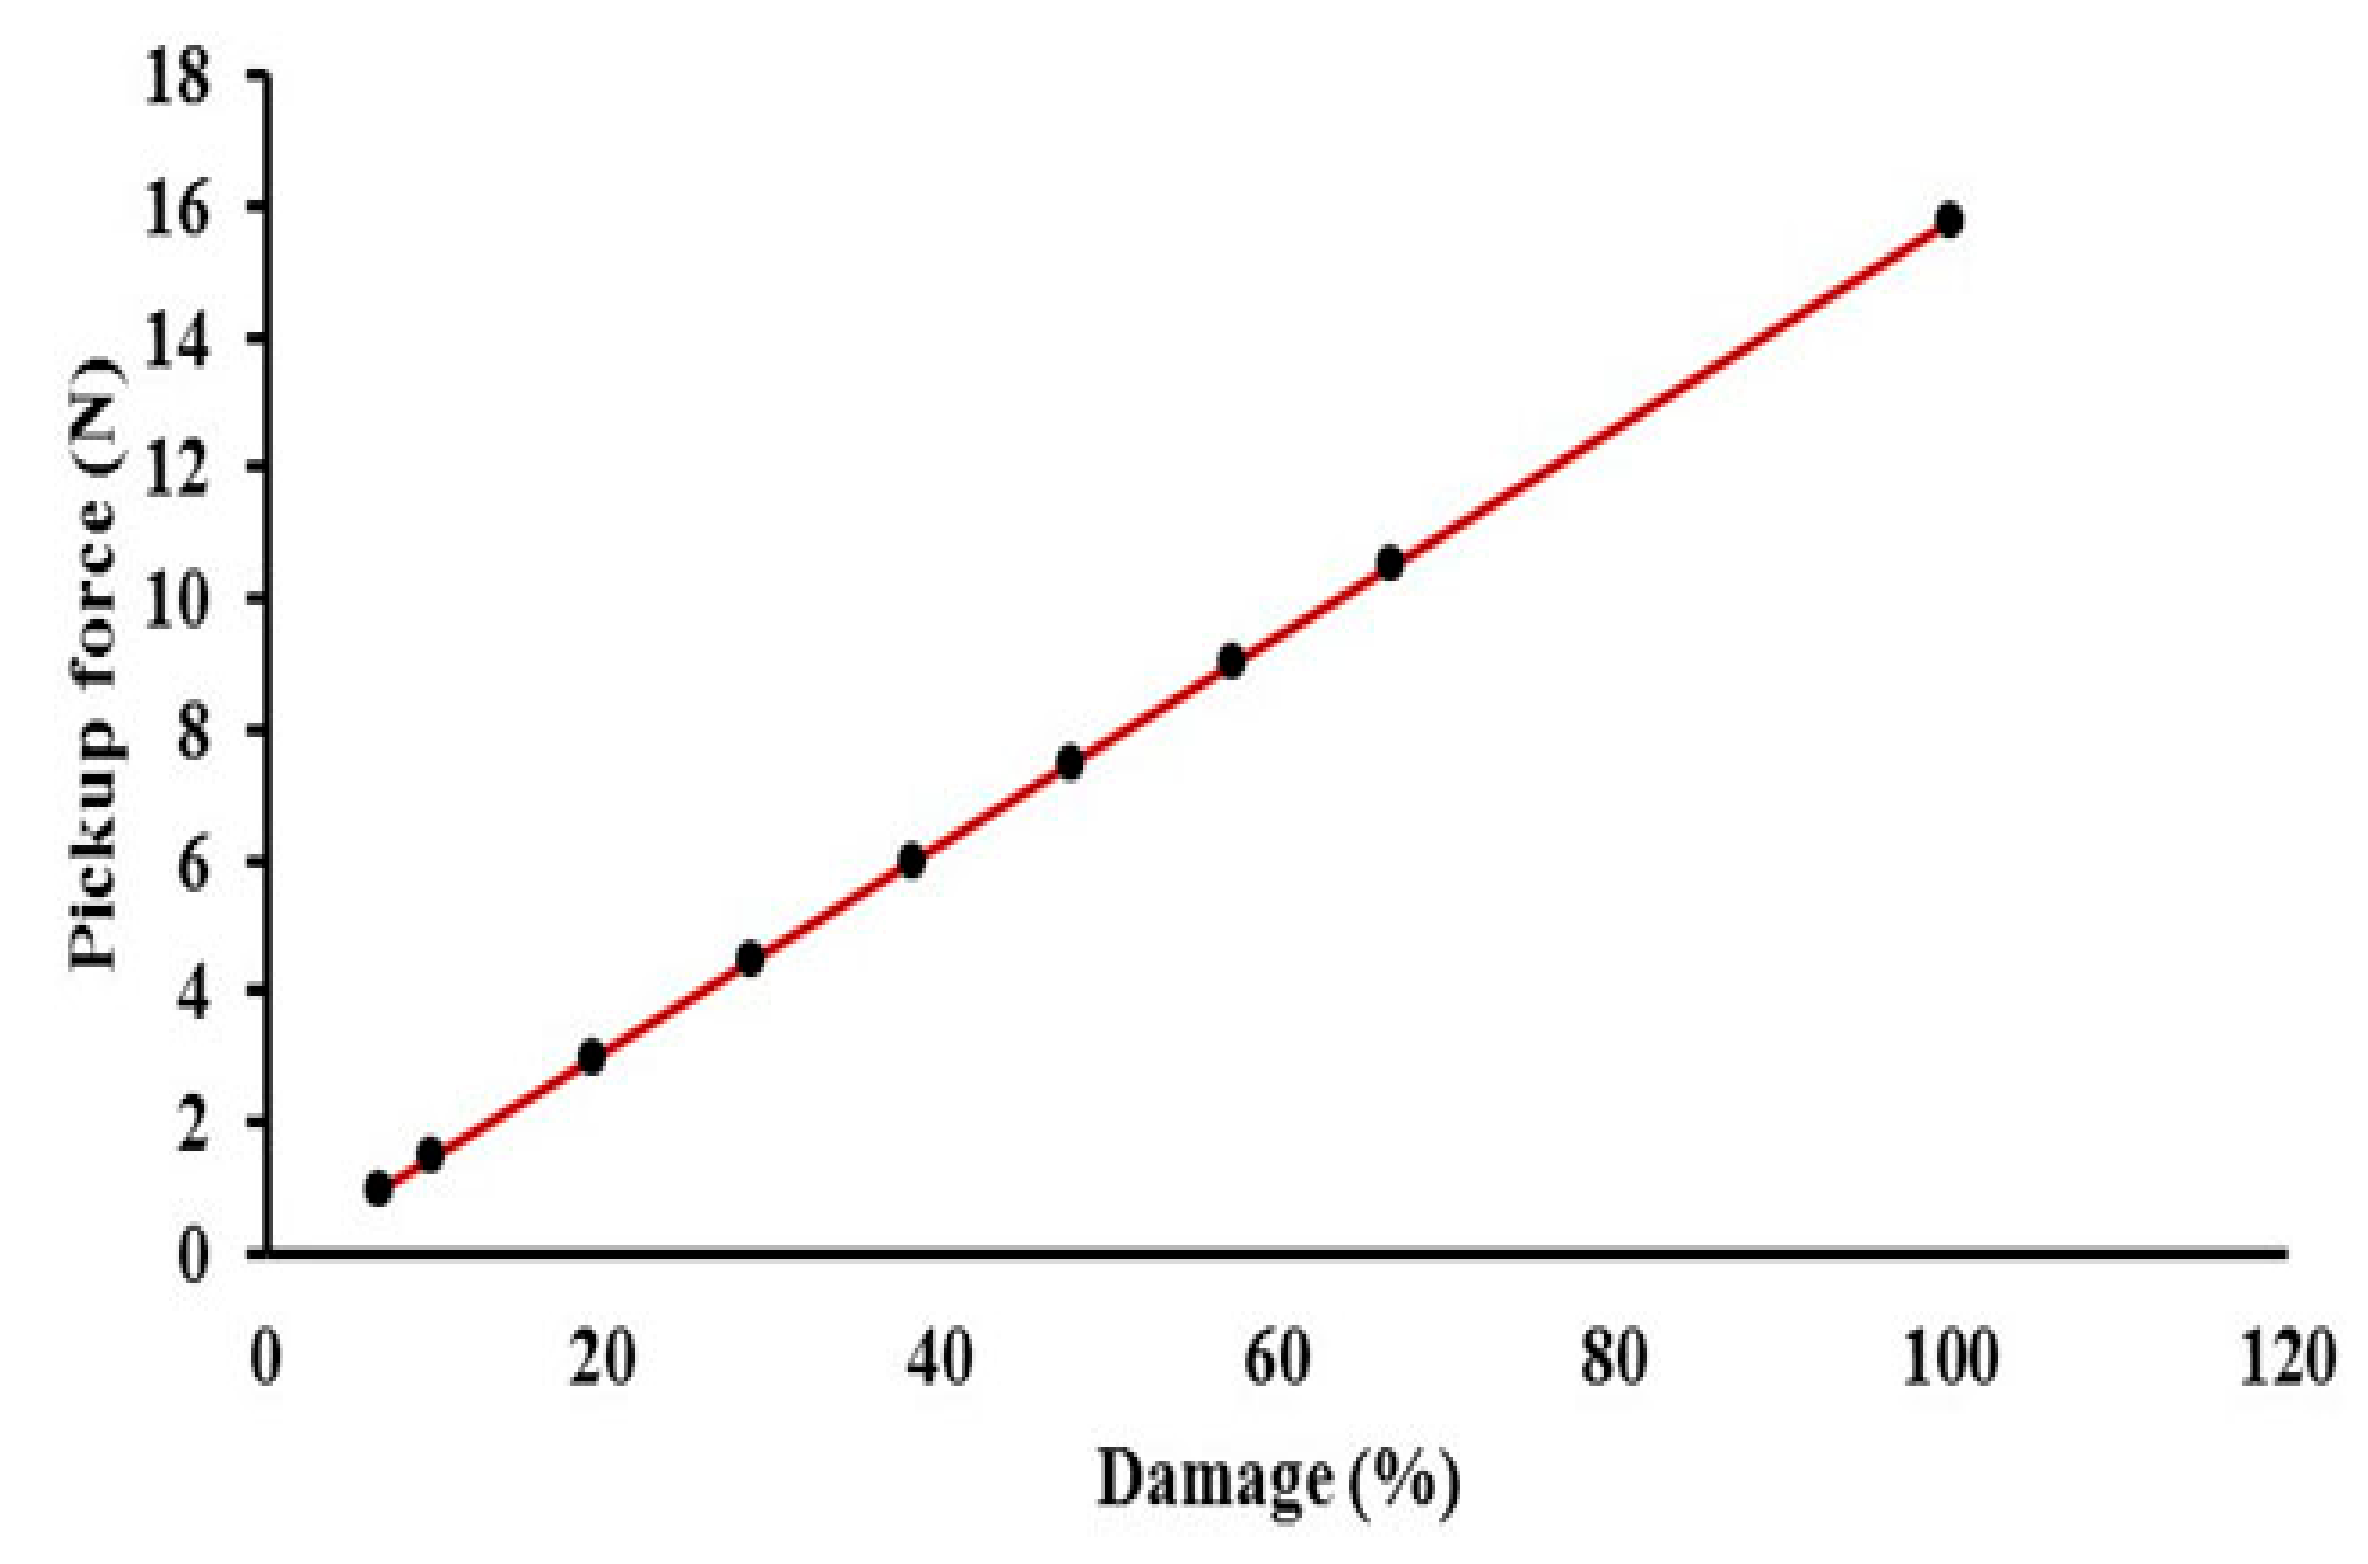
From Figure 9, the pick-up damage was directly correlated to the pick-up force, as that pick-up damage intensifies with the increase of the pick-up force (F). The top pick-up damage percentage of 100% was recorded under the pick-up force of approximately 15.75 N; Importantly the least pick-up damage was obtained under the lowest pick-up force (approximately 1 N).
3.8. Damage Investigation by the X-ray CT System
The cross-section of the 3D images of the soils under 6.0 N, 7.5 N and 9.0 N respectively is exemplified in Supplementary Figure S3. It can be observed that the pick-up force has an effect on the structure of the soil having the same composition of peat moss, perlite and vermiculite. For better understanding of the damage in the medium, the pore or cracks were identified with blue colors and from this, it could be seen that there was a general increase in the area of pore/cracks as the force application increased. The lowest area by visual inspection was seen with a 6.0 N force application while that of the 9.0 N was having the highest area of pores/cracks.
4. Discussion
At high pick-up speed, the end-effector penetrates into the soil-lump easier than the low pick-up speed [16]. Such a phenomenon is possible due to the low moisture content of the soil [17]. The pick-up force resistance increased when the speed of the end-effector that penetrated the seedling soil lump was slow [18]; meanwhile, it decreased when the end-effector speed was fast, and perhaps there would not be any resistance at the peak of the speed. These results might be due to the energy that was associated with the speed, which is in line with findings of Luhua et al. (2013) [19] who found that the high speed decreases with penetration resistance. However, at higher SMC content, it is observed that, the pick-up force resistance is reduced to enable the end-effector to quickly pick-up the lump of the seedling without any known resistance especially in the highest level [20]. The process of the seedling pick-up is difficult when the moisture content of the lump soil is low. The output might be due to the difficulty of extraction of the seedling lump as against the principle of increasing the pick-up resistance at the lacking of SMC [21]. These results are supported by the findings of Xin et al., (2013) who used two different SMC and proposed that higher moisture content decreases the resistance due to the reduced soil cohesion [22]. Upon a certain amount of the pick-up force, the end-effector trying to grasp the seedling soil lump meets a reaction to cause a balance. As the pick-up force increases, the pick-up resistance decreases until it reaches a level where the soil-lump would be picked-up undamaged or damaged [23]. The undamaged situation refers to another factor in addition to the applied force. It also depends on the speed of the end-effector when grasping the seedling soil-lump, which affected the pick-up force resistance, because the resistance increases with slow speed and the opposite is real to damage the seedling soil-lump at high speed [24].
The damage situation perhaps depends on the condition of the soil, as the moisture content is the main factor affecting the relationship between the force and the force resistance, which led to a decrease or increase in the pick-up resistance force. Hence, it can affect the level of the damage of the seedling soil-lump beside the two factors of the force and speed of the transplanting operation [25].
The seedling soil-lump pick-up damage increased as a result of increasing the seedling soil-lump pick-up force [26].
Upon the highest movement of the seedling soil-lump, the probability of corresponding damage happened more than the reverse situation of the slow motion. This is due to the perspective of the speed of end-effector penetration movement to the transplanting pick-up force [27,28]. It is observed that the SMC is inversely correlated to the damage [29]. The force balance is the primary indicator of the seedling soil-lump damage, which means the force balance may specify the quantity and the size of the damage; likewise, the final damage ratio shows how far the balance between the lump-soil pick-up force and the faced pick-up resistance is [30]. The force balance ratio is regarded as the main dependent parameter during the transplanting system, although it followed the effect of the speed of the end-effector [31,32]. SMC is considered as another factor affecting the force balance of the seedling soil-lump. It is inversely proportional to the highest value for the force balance ratio at the lowest moisture content [33]. The relationship between the force balance and force pick-up is inextricability, the transplanting system based on how far the stability between both of them, which indicates the successfulness of the transplanting operation, [34].
The most dominant factors that affect the seedling transplanting are; the pick-up force used by the grasp fingers, followed by the pick-up damage [35]. The study suggests that the actual cracks starts close to the application of 7.5 N upwards since the area observed in 6.0 N sub-volume could be equally be estimated as the normal soil pore areas in the soil. In fact, different objects have different material properties and these tend to influence their resistances to deformation when subjected to forces [36,37]. The significance of this current study lay on the emphasis linking the physical and morphological arrangements of the elements to other properties such as the water content and the pick-up speed and indicating they significantly influence the strength of the substance [38,39].
5. Conclusions
From the obtained results it is clear that the damage caused by the different forces are affected by various factors such as the pick-up forces and speeds as well as soil moisture status. The damage was found to increase with the increase of pick-up forces and speeds. Moreover, the moisture status of the soil plays a critical role concerning lump damage during the process of seedlings transplanting. The highest SMC was found to cause little damage and vice versa. Therefore, the speeds of pick-up, apply force, as well as SMC, should be taken into consideration when designing end-effectors. Our study also recommended that the cohesion and adhesion force should be determined in further work since it also has a secondary effect on the damage caused during the pickup process. We compared our work with prior methods, which were used for a seedling substrate for assessing damage investigation. The tests applied a variety of mechanical properties, interpreting most of the seedling lump damage, through extensive relations. These included different factors and parameters, which displayed most of the possibility of quantifying the damage in the seedling soil, which is shown to have a limitation in this field. This could be considered as a valuable contribution to the implementation of effective seedling transplanting/picking performance and basis for the optimal design of the end-effector for future work.
Supplementary Materials
The following are available online at https://0-www-mdpi-com.brum.beds.ac.uk/2624-7402/1/3/26/s1, Figure S1: Force versus excitation voltage plot. The correlation between the signal (mV) and load (N). calibrated using 1N, 2N, 3N, 4N, 5N, 6N, and 7N loads, Figure S2: Illustration of the general principle of CT in imaging (top) and specific application in plant- soil (bottom), Figure S3: CT image of seedling soil (right) with its sub-volumes (left) under gripping force application of (A) 6 N, (B) 7.5 N and (C) 9 N. (sub-volumes cracks are shown in blue color), Table S1: Ct Scanning configuration/parameters used in this study.
Author Contributions
S.M. designed and performed the experiments, analyzed the data and prepared the manuscript draft. J.L. conceived the study and supervised the research.
Funding
This work was supported by the Agricultural Independent Innovation Project in Jiangsu Province (CX (16) 1044), Category A of Major Natural Science Research Projects in Colleges and Universities of Jiangsu Province (16KJA210002), the Project of Six Talent Peaks in Jiangsu Province (JXQC-008) and Priority Academic Program Development of Jiangsu Higher Education Institutions (PAPD).
Conflicts of Interest
The authors declare no conflict of interest.
References
- Nye, P.H.; Tinker, P.B. Solute Movement in the Soil-Root System; Univ of California Press: Burkley, CA, USA, 1977; Volume 4. [Google Scholar]
- Xiaoliang, L.; Qiyun, L. Development tendency of bowl-rear transplanting mechanization. J. Shandong Univ. Technol. Nat. Sci. Ed. 2003, 17, 108–110. [Google Scholar]
- Choi, W.C.; Kim, D.C.; Ryu, I.H.; Kim, K.U. Development of a seedling pick–up device for vegetable transplanters. Trans. ASAE 2002, 45, 1–13. [Google Scholar]
- Jin, X.; Li, D.; Ma, H.; Ji, J.; Zhao, K.; Pang, J. Development of single row automatic transplanting device for potted vegetable seedlings. Int. J. Agric. Biol. Eng. 2018, 11, 67–75. [Google Scholar] [CrossRef] [Green Version]
- Wei, L.; Jizhan, L. Review of end-effectors in tray seedlings transplanting robot. J. Agric. Mech. Res. 2013, 7, 6–10. [Google Scholar]
- Han, L.; Mao, H.; Hu, J.; Miao, X.; Tian, K.; Yang, X. Experiment on mechanical property of seedling pot for automatic transplanter. Trans. Chin. Soc. Agric. Eng. 2013, 29, 24–29. [Google Scholar]
- Xiaohua, M.; Hanping, M.; Lühua, H. Analysis of influencing factors on force of picking plug seedlings and pressure resistance of plug seedlings. Trans. Chin. Soc. Agric. Mach. 2013, 44, 27–32. [Google Scholar]
- Jiannong, S.; Ping, W.; Wenjun, W.; Lichen, W. Experimental research on tensile strength of rice seedlings and force of pulling out seedlings from trays. Trans. Chin. Soc. Agric. Eng. 2003, 6, 10–13. [Google Scholar]
- Ren, W.; Che, Z.; Liu, J. Experiment on effect of paddy mud on adhesion property of farm paper mulch. Trans. Chin. Soc. Agric. Eng. 2011, 27, 129–133. [Google Scholar]
- Yang, Y.; Ting, K.C.; Giacomelli, G.A. Factors Affecting Performance of Sliding-Needles Gripper During Robotic Transplanting of Seedlings. Appl. Eng. Agric. 1991, 7, 493–498. [Google Scholar] [CrossRef]
- Hadjian, A.; Luco, J.; Tsai, N. Soil-structure interaction: continuum or finite element? Nucl. Eng. Des. 1974, 31, 151–167. [Google Scholar] [CrossRef]
- Kumar, G.P.; Raheman, H. Development of a walk-behind type hand tractor powered vegetable transplanter for paper pot seedlings. Biosyst. Eng. 2011, 110, 189–197. [Google Scholar] [CrossRef]
- Thomas, E.V. Development of a mechanism for transplanting rice seedlings. Mech. Mach. Theory 2002, 37, 395–410. [Google Scholar] [CrossRef]
- Dupuy, L.; Gregory, P.J.; Bengough, A.G. Root growth models: towards a new generation of continuous approaches. J. Exp. Bot. 2010, 61, 2131–2143. [Google Scholar] [CrossRef] [Green Version]
- Zhang, W.; Cai, Y. Continuum Damage Mechanics and Numerical Applications; Springer Science & Business Media: Berlin, Germany, 2010. [Google Scholar]
- Ji, W.; Luo, D.; Li, J.; Yang, J.; Zhao, D. Compliance grasp force control for end-effector of fruit-vegetable picking robot. Trans. Chin. Soc. Agric. Eng. 2014, 30, 19–26. [Google Scholar]
- Abel, J. In-FieldRobotic Leaf Grasping and Automated Crop Spectroscopy; Carnegie Mellon University: Pittsburgh, PA, USA, 2018. [Google Scholar]
- Yang, Q.; Jin, Y.; Qian, S.; Bao, G. Research on end-effector of apple picking based on new flexible pneumatic actuator. Nongye Jixie Xuebao/Trans. Chin. Soc. Agric. Mach. 2010, 41, 154–204. [Google Scholar]
- Luhua, S.; Hegie, A.; Suzuki, N.; Shulaev, E.; Luo, X.; Cenariu, D.; Ma, V.; Kao, S.; Lim, J.; Gunay, M.B.; et al. Linking genes of unknown function with abiotic stress responses by high-throughput phenotype screening. Physiol. Plant. 2013, 148, 322–333. [Google Scholar] [CrossRef]
- Zhang, Z.; Wang, J.; Zhang, W.; Zhao, X.; Liu, W. Kinematic analysis and performance experiment of cantilever cup vegetable transplanter. Trans. Chin. Soc. Agric. Eng. 2011, 27, 21–25. [Google Scholar]
- Wang, W.; Dou, W.; Wang, C.; Zhao, S.; Zhao, M. Parameter analysis of the planting process of 2ZT-2 beet transplanter. Nongye Jixie Xuebao/Trans. Chin. Soc. Agric. Mach. 2009, 40, 69–73. [Google Scholar]
- Xin, L.; Lv, Z.; Wang, W.; Zhou, M.; Zhao, Y. Optimal Design and Development of a Double-Crank Potted Rice Seedling Transplanting Mechanism. Trans. ASABE 2017, 60, 31–40. [Google Scholar] [CrossRef]
- Gui-wen1a, L.; La-zhen1a, Q.; Yun-mei1a, Z.; Jin-xiang1b, C.; Chao-long1a, Z.; Zhen-wei1a, D. Experiment and analysis on mechanic properties in pulling of floating seedlings of cotton. J. Hunan Agric. Univ. (Nat. Sci.) 2013, 2, 217–220. [Google Scholar]
- Choi, W.C.; Kim, D.C.; Ryu, I.; Kim, K.U. Development of a seedling pick–up device for vegetable transplanters. Trans. ASAE 2002, 45, 13–19. [Google Scholar] [CrossRef]
- Heinrichs, E.; Medrano, F.; Rapusas, H. Genetic Evaluation for Insect Resistance in Rice; International Rice Research Institute: Manila, Philippines, 1985. [Google Scholar]
- Kang, D.H.; Kim, D.E.; Lee, G.I.; Kim, Y.H.; Lee, H.J.; Min, Y.B. Development of a vegetable transplanting robot. J. Biosyst. Eng. 2012, 37, 201–208. [Google Scholar] [CrossRef]
- Simonton, W. Robotic end effector for handling greenhouse plant material. Trans. ASAE 1991, 34, 2615–2621. [Google Scholar] [CrossRef]
- Hu, J.; Yan, X.; Ma, J.; Qi, C.; Francis, K.; Mao, H. Dimensional synthesis and kinematics simulation of a high-speed plug seedling transplanting robot. Comput. Electron. Agric. 2014, 107, 64–72. [Google Scholar] [CrossRef]
- Mao, H.; Han, L.; Hu, J.; Kumi, F. Development of a pincette-type pick-up device for automatic transplanting of greenhouse seedlings. Appl. Eng. Agric. 2014, 30, 547–556. [Google Scholar]
- Guomin, S.G.W.X.H.; Xiaojun, Z.T.W.C.Q. Design of the End-effector for Plug Seedlings Transplanter and Analysis on Virtual Prototype. Trans. Chin. Soc. Agric. Mach. 2010, 10, 48–53. [Google Scholar]
- Ting, K.; Giacomelli, G.; Ling, P. Workability and productivity of robotic plug transplanting workcell. In Vitro Cell. Dev. Biol.-Plant 1992, 28, 5–10. [Google Scholar] [CrossRef]
- Xin, J.; Kaixuan, Z.; Jiangtao, J.; Hao, M.; Jing, P.; Zhaomei, Q. Design and experiment of automatic transplanting device for potted tomato seedlings. Proc. Inst. Mech. Eng. Part C J. Mech. Eng. Sci. 2018, 233, 1045–1054. [Google Scholar] [CrossRef]
- Liang, X.; Cai, Y. Design and Analysis on a Scalability Mechanism for Plug Seedling Transplanting and Separating. In Computer Science and Engineering Technology (CSET2015), Medical Science and Biological Engineering (MSBE2015): Proceedings of the 2015 International Conference on CSET & MSBE; World Scientific Publishing Company: Singapore, 2015; pp. 41–46. [Google Scholar] [CrossRef]
- Wang, Y.; Yu, H. Experiment and analysis of impact factors for soil matrix intact rate of manipulator for picking-up plug seedlings. Trans. Chin. Soc. Agric. Eng. 2015, 31, 65–71. [Google Scholar]
- Jin, X.; Li, S.J.; Yang, X.J.; Wu, J.M.; Liu, Z.J.; Liu, H.K. Developments in research on seedling auto-picking device of vegetable transplanter. Appl. Mech. Mater. 2013, 375–379. [Google Scholar] [CrossRef]
- Souch, C.; Martin, P.J.; Stephens, W.; Spoor, G. Effects of soil compaction and mechanical damage at harvest on growth and biomass production of short rotation coppice willow. Plant Soil 2004, 263, 173–182. [Google Scholar] [CrossRef] [Green Version]
- Chancellor, W.J. Advances in soil-plant dynamics. In Advances in Soil Dynamics Volume 1; American Society of Agricultural and Biological Engineers: St. Joseph, MI, USA, 1994; pp. 255–280. [Google Scholar]
- Perret, J.; Al-Belushi, M.; Deadman, M. Non-destructive visualization and quantification of roots using computed tomography. Soil Biol. Biochem. 2007, 39, 391–399. [Google Scholar] [CrossRef]
- Mairhofer, S.; Zappala, S.; Tracy, S.R.; Sturrock, C.; Bennett, M.; Mooney, S.J.; Pridmore, T. RooTrak: Automated recovery of three-dimensional plant root architecture in soil from X-ray microcomputed tomography images using visual tracking. Plant Physiol. 2012, 158, 561–569. [Google Scholar] [CrossRef]
Figure 1.
Measurement of seedling pick-up force from cell tray using a developed pick-up end-effector force instrument.
Figure 1.
Measurement of seedling pick-up force from cell tray using a developed pick-up end-effector force instrument.

Figure 2.
Scheme showing the measurement of penetration and pick-up forces.

Figure 3.
Effect of the soil moisture content and pick-up speed on the penetration force resistance. (A) Under the pick-up force of 6 N, (B) under the pick-up force of 7.5 N and (C) under the pick-up force of 9 N. A, B and C capitalized letters indicate the difference between speed groups; a, b and c small letters indicate the difference between moisture content groups.

Figure 4.
Effect of the soil moisture content and pick-up speed on the pick-up force resistance. (A) Under the pick-up force of 6 N, (B) under the pick-up force of 7.5 N and (C) under the pick-up force of 9 N. A, B and C capitalized letters indicate the difference between speed groups; a, b and c small letters indicate the difference between moisture content groups.

Figure 5.
Pick-up force (F) and pick-up resistance (Fr). A graph showing the response of pick-up resistance to the increase of pick-up force.
Figure 5.
Pick-up force (F) and pick-up resistance (Fr). A graph showing the response of pick-up resistance to the increase of pick-up force.

Figure 6.
Effect of soil moisture content and pick-up speed on the pick-up damage. (A) Under the pick-up force of 6 N, (B) under the pick-up force of 7.5 N and (C) under the pick-up force of 9 N. A, B and C capitalized letters indicate the difference between speed groups; a, b and c small letters indicate the difference between moisture content groups.

Figure 7.
The damage as a function of the force balance. A graph showing the response of the damage (D) percentage to the decreasing force balance (FFr−1).
Figure 7.
The damage as a function of the force balance. A graph showing the response of the damage (D) percentage to the decreasing force balance (FFr−1).

Figure 8.
Effect of soil moisture content and pick-up speed on the force balance ratio. (A) Under the pick-up force of 6 N, (B) under the pick-up force of 7.5 N and (C) under the pick-up force of 9 N. A, B and C capitalized letters indicate the difference between speed groups; a, b and c small letters indicate the difference between moisture content groups.

Figure 9.
The damage as a function of the pick-up force. A correlation graph between the damage percentage and pick-up force.
Figure 9.
The damage as a function of the pick-up force. A correlation graph between the damage percentage and pick-up force.

© 2019 by the authors. Licensee MDPI, Basel, Switzerland. This article is an open access article distributed under the terms and conditions of the Creative Commons Attribution (CC BY) license (http://creativecommons.org/licenses/by/4.0/).
Share and Cite
MDPI and ACS Style
Mohamed, S.; Liu, J. Effect of Soil Moisture Content and End-Effector Speed on Pick-up Force and Lump Damage for Seedling Transplanting. AgriEngineering 2019, 1, 343-355. https://0-doi-org.brum.beds.ac.uk/10.3390/agriengineering1030026
AMA Style
Mohamed S, Liu J. Effect of Soil Moisture Content and End-Effector Speed on Pick-up Force and Lump Damage for Seedling Transplanting. AgriEngineering. 2019; 1(3):343-355. https://0-doi-org.brum.beds.ac.uk/10.3390/agriengineering1030026
Chicago/Turabian StyleMohamed, Sami, and Jizhan Liu. 2019. "Effect of Soil Moisture Content and End-Effector Speed on Pick-up Force and Lump Damage for Seedling Transplanting" AgriEngineering 1, no. 3: 343-355. https://0-doi-org.brum.beds.ac.uk/10.3390/agriengineering1030026