Embedded Micro-Controller Software Design of a Cotton Harvester Yield Monitor Calibration System


Agricultural Research Services, United States Department of Agriculture USDA, Lubbock, TX 79403, USA
*
Author to whom correspondence should be addressed.
AgriEngineering 2019, 1(4), 485-495; https://0-doi-org.brum.beds.ac.uk/10.3390/agriengineering1040035
Submission received: 6 September 2019
/
Revised: 27 September 2019
/
Accepted: 1 October 2019
/
Published: 10 October 2019
(This article belongs to the Special Issue Robotics and Automation Engineering in Agriculture)
Abstract
:Several yield monitors are available for use on cotton harvesters, but none are able to maintain yield measurement accuracy across cultivars and field conditions that vary spatially and/or temporally. Thus, the utility of yield monitors as tools for on-farm research is limited unless steps are taken to calibrate the systems as cultivars and conditions change. This technical note details the embedded micro-controller software system design portion of a harvester-based yield monitor calibration system for basket-type cotton strippers. The system was based upon the use of pressure sensors to measure the weight of the basket by monitoring the static pressure in the hydraulic lift cylinder circuit. To ensure accurate weighing, the system automatically lifted the basket to a target lift height, allowed the basket time to settle, and then weighed the contents of the basket. The software running the system was split into two parts, which were run on an embedded low-level micro-controller and a mobile computer located in the harvester cab. The system was field tested under commercial conditions and found to measure basket load weights within 2.5% of the reference scale. As such, the system was proven to be capable of providing an on-board auto-correction to a yield monitor for use in multi-variety field trials.
1. Introduction
Several yield monitors are available for use on cotton harvesters, but none are able to maintain yield measurement accuracy across cultivars and field conditions that vary spatially and/or temporally. Thus, the utility of yield monitors as tools for on-farm research is limited unless steps are taken to calibrate the systems as cultivars and conditions change. This technical note details the man-machine interface software design for a harvester-based yield monitor calibration system for basket-type cotton strippers and is one of three technical notes that are in support of a master research paper covering the development and design of the calibration system. This material is presented, along with requisite supporting software source-code files, for the purpose of transferring the technology to the research community and general public. In addition to the source-code files, the technical notes provide documentation describing key strategies and methodology utilized in the design as well as background summary on the research.
In the process of evaluating the effects of production inputs and practices on crop yield and farm revenue, large-scale field experiments are needed to investigate treatment effects across varying field conditions. Normally, these investigations require the use of additional labor and expensive ancillary equipment to weigh the crop harvested from a given area. The time required to collect these data reduces harvest productivity and efficiency. In order to reduce the dependence on ancillary equipment and labor, and increase the efficiency of data collection, yield monitors used on grain combines have proven to be reliable tools in on-farm research efforts due to their consistent accuracy and lack of need for variety-specific calibration. However, yield monitors used on cotton harvesters do not exhibit the same utility for on-farm research as they require frequent calibration when varieties or crop conditions change [1,2,3,4,5,6,7].
Cotton yield monitors sense the flow of seed cotton inside conveying ducts or as the material passes into the basket or accumulator on the harvester. Yield flow sensors are generally of two designs: (1) light attenuation [8,9,10] or (2) microwave reflectance [11]. In either case, the flow of material is related to the amount of light attenuated or microwave energy reflected by the flowing material. Material properties such as boll size, seed size, foreign matter content, lint turnout, fiber quality, and seed cotton moisture content are related to the accuracy of cotton yield monitors; all of which, except seed cotton moisture content, are cultivar-specific properties [2,6,7,12]. Setup and operation factors, such as sensor alignment, stray light, temperature, and dust/foreign matter accumulation, also affect cotton yield monitor performance [13,14,15]. While uncalibrated systems can realistically reflect in-field variability [16], the calibration of cotton yield monitors is of the utmost importance in producing accurate yield data.
Previous work by Wanjura et al. (2015 and 2016) [17,18] described the development and testing of a system for use on cotton harvesters that measures accumulated cotton weight inside a harvester basket, thus facilitating the frequent calibration of cotton yield monitors without the need for expensive, time-consuming, and often unavailable ancillary mobile scale equipment. The design of the system described in [17,18] is briefly detailed herein, with the main focus of this report being relegated to the final version of the electronic design of the system.
The harvester-based yield monitor calibration system [17,18] measures accumulated cotton weight in a harvester basket based on measurements of hydraulic pressure in the basket lift cylinder circuit. The system was designed and implemented on a John Deere 7460 (John Deere, Moline, IL) basket-type cotton stripper. A model relating hydraulic pressure in the lift cylinder circuit at a single basket position in the dump cycle was developed for basket weights ranging from 27 to 1633 kg (60 to 3600 lb). The linear calibration model (R2 = 0.998) was developed from 161 basket loads and exhibited a RMSE of 9.9 kg (21.8 lb) with a mean absolute error of 0.44% (span). Hydraulic pressure was measured using a pressure transducer with 0–17,237 kPa (0–2500 psi) pressure range (Omega Engineering, Norwalk, CT, USA) (PX409-2.5KG5V-EH, error specification ±0.05% FS = ±8.62 kPa). A pulse-width modulated, proportional directional control valve (model SP08-47C, HydraForce Inc., Lincolnshire, IL, USA) and solenoid operated check valves (model SV10-29, HydraForce Inc., Lincolnshire, IL, USA) were used in parallel with the harvester hydraulic system to raise the basket to the desired measurement position (13.7 degrees up from fully down reference position) and hold it there once motion stopped. Two limit switches mounted at the rear of the harvester basket slowed and stopped the motion of the basket as it approached the target position. During the development of the linear calibration model, a magnetostrictive linear position sensor (MHC1400MN10E3V11, MTS Sensors, Cary, NC; error specification ±0.04% FS = 0.56 mm, repeatability ±0.005% FS = 0.07 mm) measured the extension of the lift cylinders to confirm that the limit switches could repeatably stop the basket at the desired position. The average lift cylinder extension during calibration model development was 160.53 mm (6.32 in) with a standard deviation of 0.898 mm (0.035 in), which corresponded to a basket rotation angle of 13.7° ± 0.2° from the down position.
Control of the calibration system hydraulic valves and data acquisition were accomplished with custom designed electronics [19], which was driven by custom embedded micro-controller software, described herein. A low-level micro-controller, with supporting circuitry [19], was mounted to a specially designed printed circuit board [19] that controlled the hydraulic valves during basket positioning and recorded pressure data once the basket was properly positioned. The hydraulic control algorithm raised the basket into position through a two-step process whereby the pulse-width-modulated (PWM) hydraulic directional-control-valve (DCV) raised the basket at 100% duty cycle until the basket passed the first limit switch. The PWM DCV duty cycle was lowered, slowing the basket to about 25% of the original lifting speed as it approached the target position. The DCV was closed and the basket stopped when the basket passed the second limit switch. Simultaneously, the control algorithm closed the check valves on the lift cylinder circuit to isolate the static pressure in the lift cylinders and recorded the pressure after a brief stabilization period (2 s). A 22-bit analog to digital converter was used to capture the pressure transducer analog-signal, with help from custom designed circuitry to minimize the influence of electrical noise and improve accuracy [19]. A serial communication protocol was implemented between the embedded micro-controller software, described herein, and the human-machine-interface (HMI) software [20] running on a mobile computer in the harvester cab. The HMI software [20] was programmed to calculate and display the weight of cotton in the basket using the pressure measured in the lift cylinder circuit and the initial calibration model. GPS position data were collected from a Greenstar 3000 receiver (John Deere, Moline, IL, USA) on the harvester and processed by the HMI software [20], which used the GPS position data along with user input of harvester width to calculate the area from which the cotton in the basket was harvested. Seed cotton yield was calculated using the measured cotton weight and harvested area. Cotton ownership information (client, farm, and field) and machine header width (number and spacing of harvesting units) were recorded by the HMI software for each load measured.
The harvester-based yield monitor calibration system was field tested under commercial conditions on four producer-owned and operated cotton strippers. Weight measurement accuracy observed for the system during field testing was characterized by a RMSE between 1.7% and 2.3% of the span. Thus, it was concluded that the on-harvester calibration system would provide producers and researchers an accurate tool for use in (1) conducting on-farm research in which total plot yield is the evaluation metric, and (2) in calibrating cotton yield monitors without the need for costly and labor-intensive mobile scale systems.
The objective of this article is to describe the design of the embedded software that provides the driver for the electronic design [19,21] as well as providing the interface between the hardware and man-machine-interface software [20], which all together in combination forms the cotton harvester yield monitor calibration system. This material is presented, along with requisite supporting software source-code files, for the purpose of transferring the technology to the research community and general public. In addition to the source-code files, the technical notes provide documentation describing key strategies and methodology utilized in the design as well as background summary on the research.
2. Embedded Micro-Controller Software Design
The embedded micro-controller software design was planned around a generic scan loop that allows for the client industrial PC to dynamically call functions from a list of pre-programmed routines. The routines implemented and utilized in testing and experimentation are shown below:
- Read Switch 1 and Return Switch State via Serial Communication, COMM {SW1}
- Read Switch 2 and Return Switch State via Serial Communication, COMM {SW1}
- Set Pre-defined General Digital Output 1 {LV_OUT1}
- Run Pulse-width-modulation on Output Channel 1 {PWM1}
- Run Pulse-width-modulation on Output Channel 2 {PWM2}
- Read Precision 22-bit Analog to Digital Converter Channel x and Return Value via COMM {PADC1}
- Read Triple-Axis Accelerometer Tilt-XY and Return Value via COMM {TILT_XY}
- Read Triple-Axis Accelerometer Tilt-XZ and Return Value via COMM {TILT_XZ}
- Read Triple-Axis Accelerometer Tilt-YZ and Return Value via COMM {TILT_YZ}
- Read Triple-Axis Accelerometer X-Axis Angle and Return Value via COMM {ANGLE_X}
- Read Triple-Axis Accelerometer Y-Axis Angle and Return Value via COMM {ANGLE_Y}
- Read Triple-Axis Accelerometer Z-Axis Angle and Return Value via COMM {ANGLE_Z}
- Execute Pre-Programmed Custom Operation Program 1 {PROGRAM1}
- Execute Pre-Programmed Custom Operation Program 2 {PROGRAM2}
- Set Duty-Cycle for PWM1 {DUTY_CYCLE1}
- Set Duty-Cycle for PWM2 {DUTY_CYCLE2}
- Set Time-Out Maximum Duration (ms) that PROGRAM1 should run {DURATION_1_ms}
- Set Time-Out Maximum Duration (ms) that PROGRAM2 should run {DURATION_2_ms}
The corresponding location in software files, along with the line number where the functions are defined, is detailed in Table 1:
The designed role of the embedded micro-controller was to execute control outputs, such as actuating the harvester’s hydraulic basket-lift cylinders, as well as to obtain basic raw measurements from the system’s electronic instrumentation. For ease of programming development, the high-level calibration portion of the instrumentation was delegated to be executed on the client calling industrial PC, rather than on the micro-controller by the embedded micro-controller software described herein. The exception was the Accelerometer and Tilt functionality, which was configured to output the angle in degrees of rotation about the axis of the custom micro-controller/data-acquisition printed-circuit-board, PCB, [19] where the accelerometer was mounted. The other exception was the precision analog-to-digital converter (PADC), where the design took an intermediate position of having the output calibrated on-board the micro-controller PCB, to the input Voltage to the PADC unit [19], so that the digital calibrated output was in matching Volts. These exceptions to calibration location in the design were to facilitate field troubleshooting, allowing for easy comparison of a Volt-meter reading of the input Voltage to the PADC with the micro-controller reported PADC reading. In all other instances, such as basket weight measurement and hydraulic-cylinder pressure reading, the design philosophy was to off-load as much of the configuration from the micro-controller onto the industrial PC as possible.
The next major design decision for embedded software design was between two options:
- Planned linear operation (PLO), which entails the running a series of routines that are constructed so that no single routine ever takes control of the micro-controller for longer than a pre-defined time-span (PDT), which ensures that that routine will not interfere with any of the other routines that also need to respond to time-sensitive periodic control routines required by the micro-controller. This style of operation typically requires each routine to be developed such that it runs, collects pertinent information, saves the current state and then suspends itself before the PDT is exceeded. In most cases, this requires breaking the routines into multiple parts and adding some mechanism by which the routines can save state between suspensions of operation or stepping from one state routine to the next.
- Real-Time-Operating System (RTOS), an approach that utilizes a task-switching controller to time-slice the code. This enables the programmer to write routines as if they were running completely stand-alone and instead differs the underlying complexity to the RTOS interrupt service routines to save state between time-slices. The RTOS also ensures that no single task takes control beyond the allotted PDT, thereby easing the burden of profiling off the software developer.
- In examining the two options, the trade-offs were as follows:
- From a code writing perspective, the RTOS approach is simplest as each task can be written in its entirety and hence provides the cleanest code and simplest code construction. However, when it comes to debugging the code, as the RTOS code is constantly switching tasks due to the RTOS time-slicing feature, debugging becomes a difficult, convoluted and time-consuming undertaking.
- Conversely, in the PLO approach, debugging is straightforward as there are no interrupts to sort through. However, due to the need not to exceed the PDT for any one individual task, each task must be designed so that it only performs short-duration simple operations and then quickly returns control to the main scan-loop control function. Hence, each function must be designed in such a way as to be able to perform, or trigger, a quick operation, then immediately store its current state before relinquishing control. Hence, the function cannot perform any blocking operations. For example, a serial string receive function is not allowed to wait in a loop to receive the next byte to be received during the serial communication. The PLO approach avoids this delay till finish approach by designing the functions so that upon re-engagement on the next Scan-Loop cycle, the function will be able to rapidly restore its previous state and continue as if it was never interrupted. In the previous serial string reception example, this would entail the function to only check if a byte was received, process the byte and then immediately return control.
Of the two options, RTOS versus PLO, of note is the typical development time for each process. At the time of development of this software, for the micro-controller of choice, the PIC32 (Microchip, Chandler, AZ, USA), there was limited availability of open-source RTOS operating systems, and those that did exist were predominantly the type you wrote yourself or implemented yourself from someone else’s templated code. Further, these micro-controller RTOS’s had little if any support from the developers, and there was an absence of full-featured debugging environments supporting them. The other alternatives were very expensive commercial RTOS operating systems that while well supported, also had a steep learning curve. As such, it was felt that pursuit of the RTOS approach would add to the development time and increase costs rather than reduce it; hence for this development, the first PLO software design approach was selected for this embedded micro-controller software design.
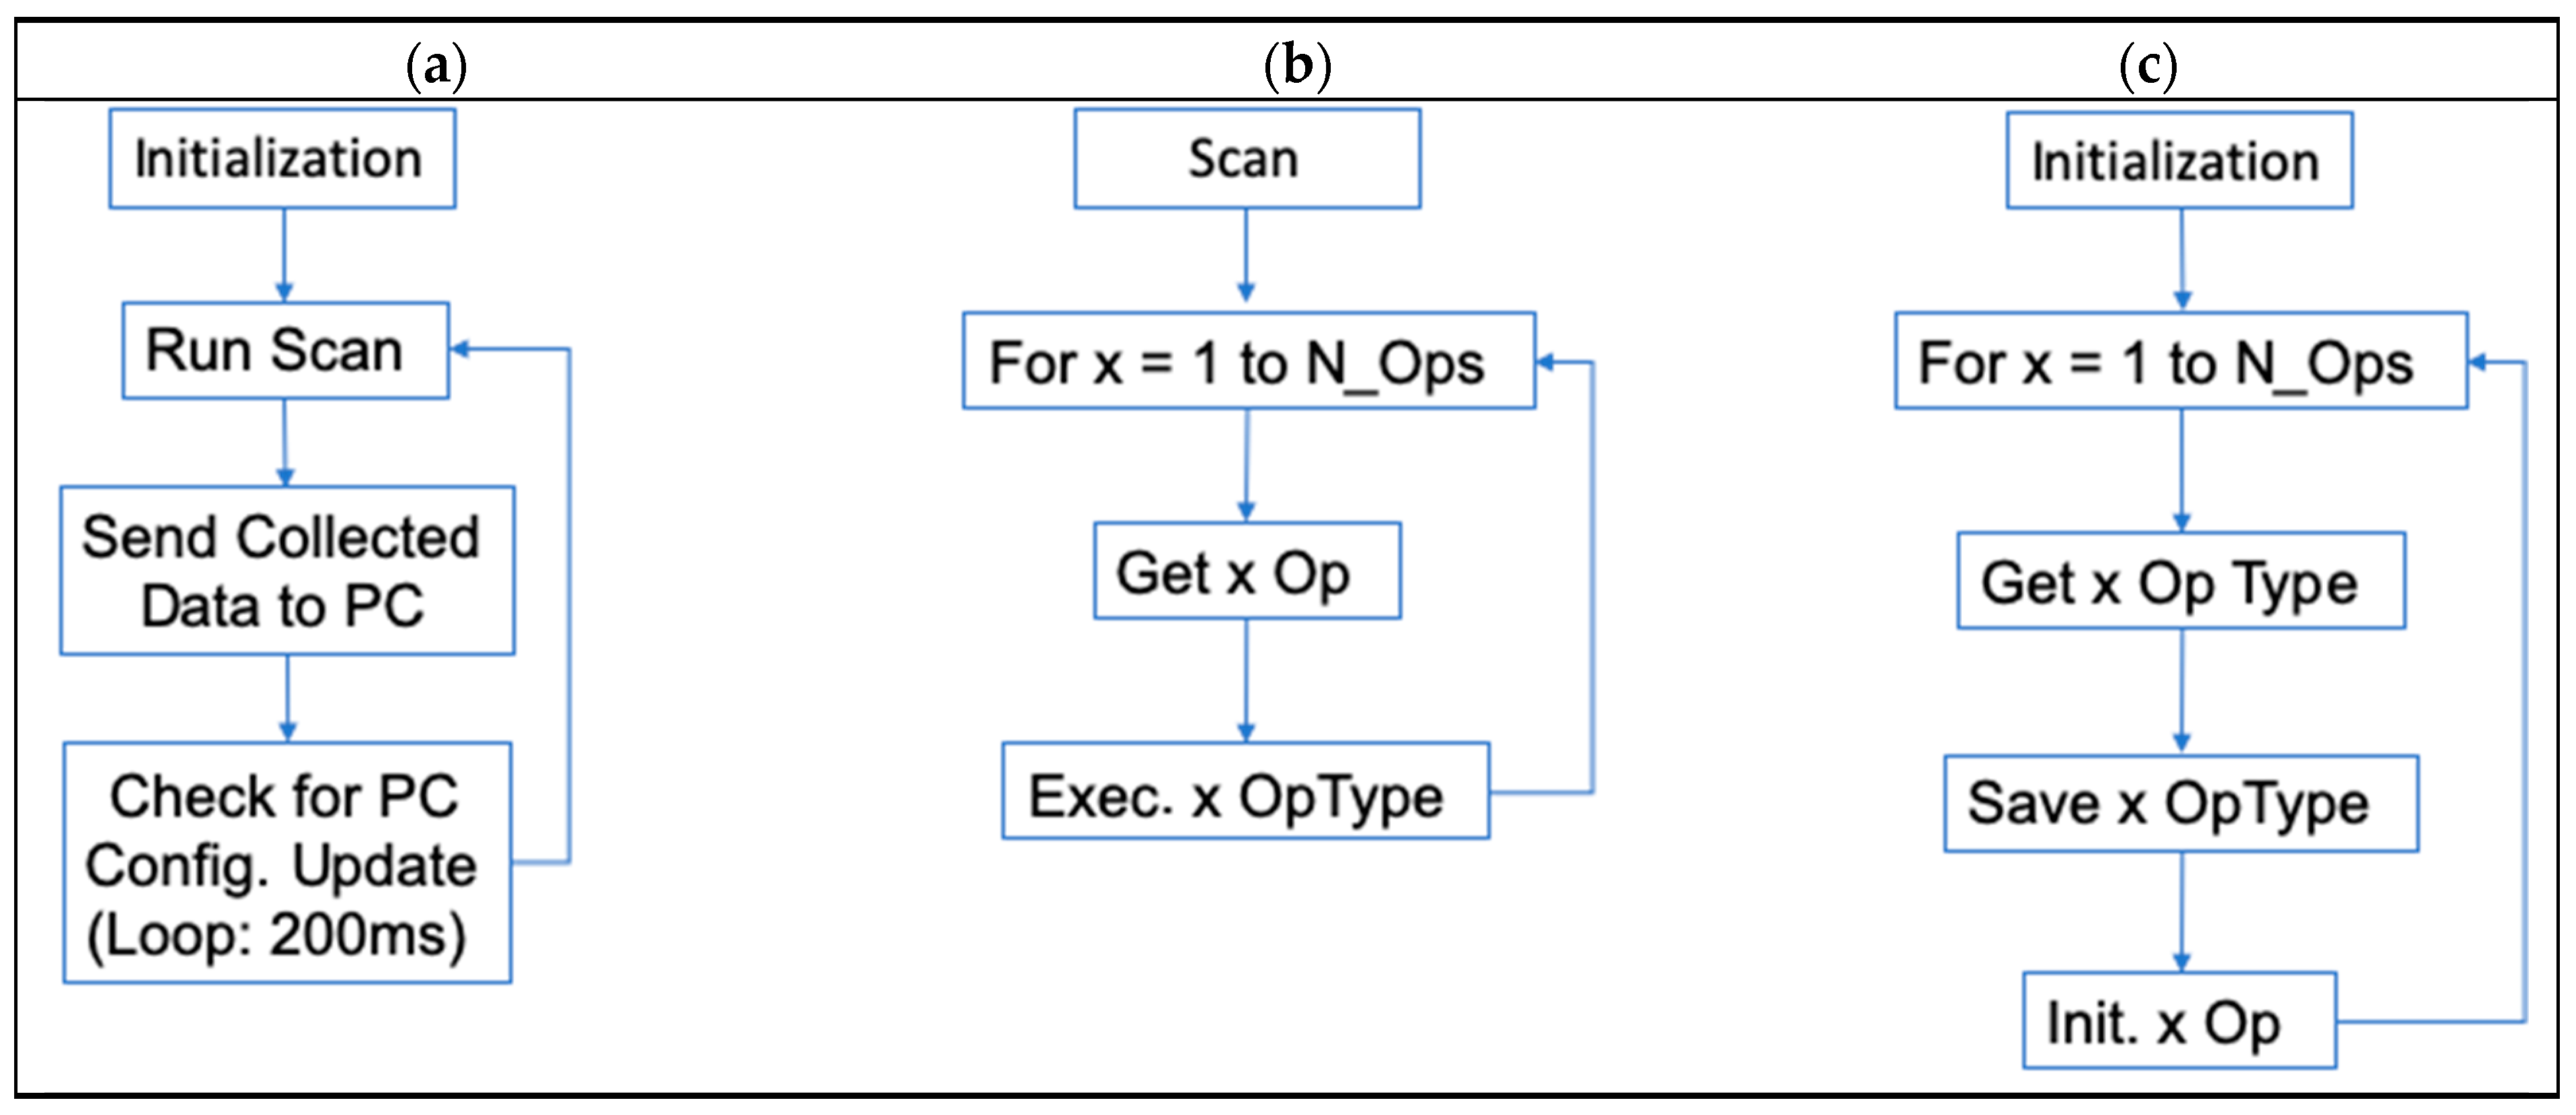
The implementation of the primary PLO-style micro-controller codes are detailed in Figure 1, which shows the three main loops the software is performing.
The main loop, Figure 1(a), and the main COMM operations are implemented in the files:
- Main_5_9_14.c, Main_5_9_14.h (software source-code found in supplementary material with this report).
The “Scan-Loop” and the Initialization routines that pertain to specific operations are implemented in the following files:
- dataLog.c, dataLog.h (software source-code found in supplementary material with this report), with the Scan-Loop performed in the function “runDataLoopOp” that starts on line 1776.
The hardware operation-specific driver code is broken out and relegated to individual files that cover each specific hardware operation. Many of the simpler micro-controller functions are embedded directly into dataLog.c, such as the readSwitch1() function, which performs the reading of the limit switch-1 and includes a PLO-compatible implementation of software-based switch-debouncing. Similarly, the setPWM1() code that turns on the PWM output firing the hydraulic lift solenoid is also included in the dataLog.c file. Most of the high-level code for each of the Scan-Loop “Operation” codes are put here as well. Noting the need to adhere to PLO-style writing, all of the driver code that could not be completed in a few milli-seconds was implanted in a manner that is supportive of being recallable by a PLO Scan-Loop. As such, the design of all of the driver code prohibits the use of blocking code, requires each function for the driver code to save state between calls and in many cases provides an input for a time-out in milli-seconds that the function must adhere to. As an example, in interfacing with the PIC32 universal asynchronous serial unit, UART, the get character function, getChar_uart1(), is non-blocking and simply goes to the micro-controller’s UART buffer and tests if it holds a char; if so, it reads it and then returns that char in a pointer variable that is passed to the function. As such, this code executes in well under a milli-second and is non-blocking, so no special features need to be addressed as it is already PLO-compatible. On the other hand, when reading in more than one character, such as reading in a string of character bytes, as this can only occur after multiple reads of the getChar_uart1() call and by nature of how UART communication takes place over numerous milli-seconds, special care must be taken to make the code PLO-adherent. The conversion to PLO compatibility requires addition of special tests, time-outs and saving of state (characters stored in a buffer) to enable this code to reliably be able to handle dropped communication. It must also keep track of the bytes already received and processed and recognize when a new string has begun or when it has terminated and is ready to be returned back to the main- loop calling program. The timeout feature is implemented by utilizing the main core timer on the PIC32 as a time-clock to be utilized solely for PLO synchronization and timing of time-out functionality. This allows the UART function to detect breaks in communication by implementing a simple time-out by resetting the core timer to 0, with the code WriteCoreTimer(0), then in the next Scan-Loop cycle it can determine how much time has passed by simply reading the main Core timer. This allows the UART function to determine if 1) there has been a break in the communication or 2) if it is another byte in the same string. For more details on this particular example, see the documented code in the file “uart.h” (software source-code found in supplementary material with this report).
In a similar manner, all the driver code is stored in function-specific files. For example, the driver code for the PADC is placed into the file that is named for the integrated circuit that provides the PADC functionality to the system. MCP3553_driver.c provides the code for initialization, controlling and reading the MCP3553 (Microchip, Chandler, AZ) 22-bit precision analog-to-digital converter that is used to read the hydraulic pressure sensor. In a similar manner the following list of descriptions, followed by the file names in “{…}”, provides the source code (also found in the supplementary files to this report) on where to find the detailed implementation hardware driver code for all of these hardware-specific operations, OP_TYPE, driver code where the following purposes are to:
- Initialize, Control and Read the PIC32’s On-board ADC {adc.h}
- Initialize, Control and Read the Thermocouple Interface IC {max31855.c; max31855.h}
- Initialize, Control and Read the PADC {mcp3553.c; mcp3553.h{
- Initialize, Control and Read the 9-Degree-of-Freedom Motion-Sensor {mpu9150.c; mpu9150.h}
- Initialize and run PID Control Algorithm {PID_Controller.c; PID_Controller.h}
- Initialize, Read-Write the PIC32 I2C bus {i2c.c; i2c.h}
- Initialize, Read-Write the PIC32 SPI bus { SPI.h}
- Initialize, Read-Write the PIC32 UART {uart.h}
- Perform general routines for COMM {stringUtils.h}
- Perform general PIC32 and Application-Specific Setup routines {setup.h}
- Set the PIC32 fuse settings and PIC32 Hardware Specific Configurations {config.h}
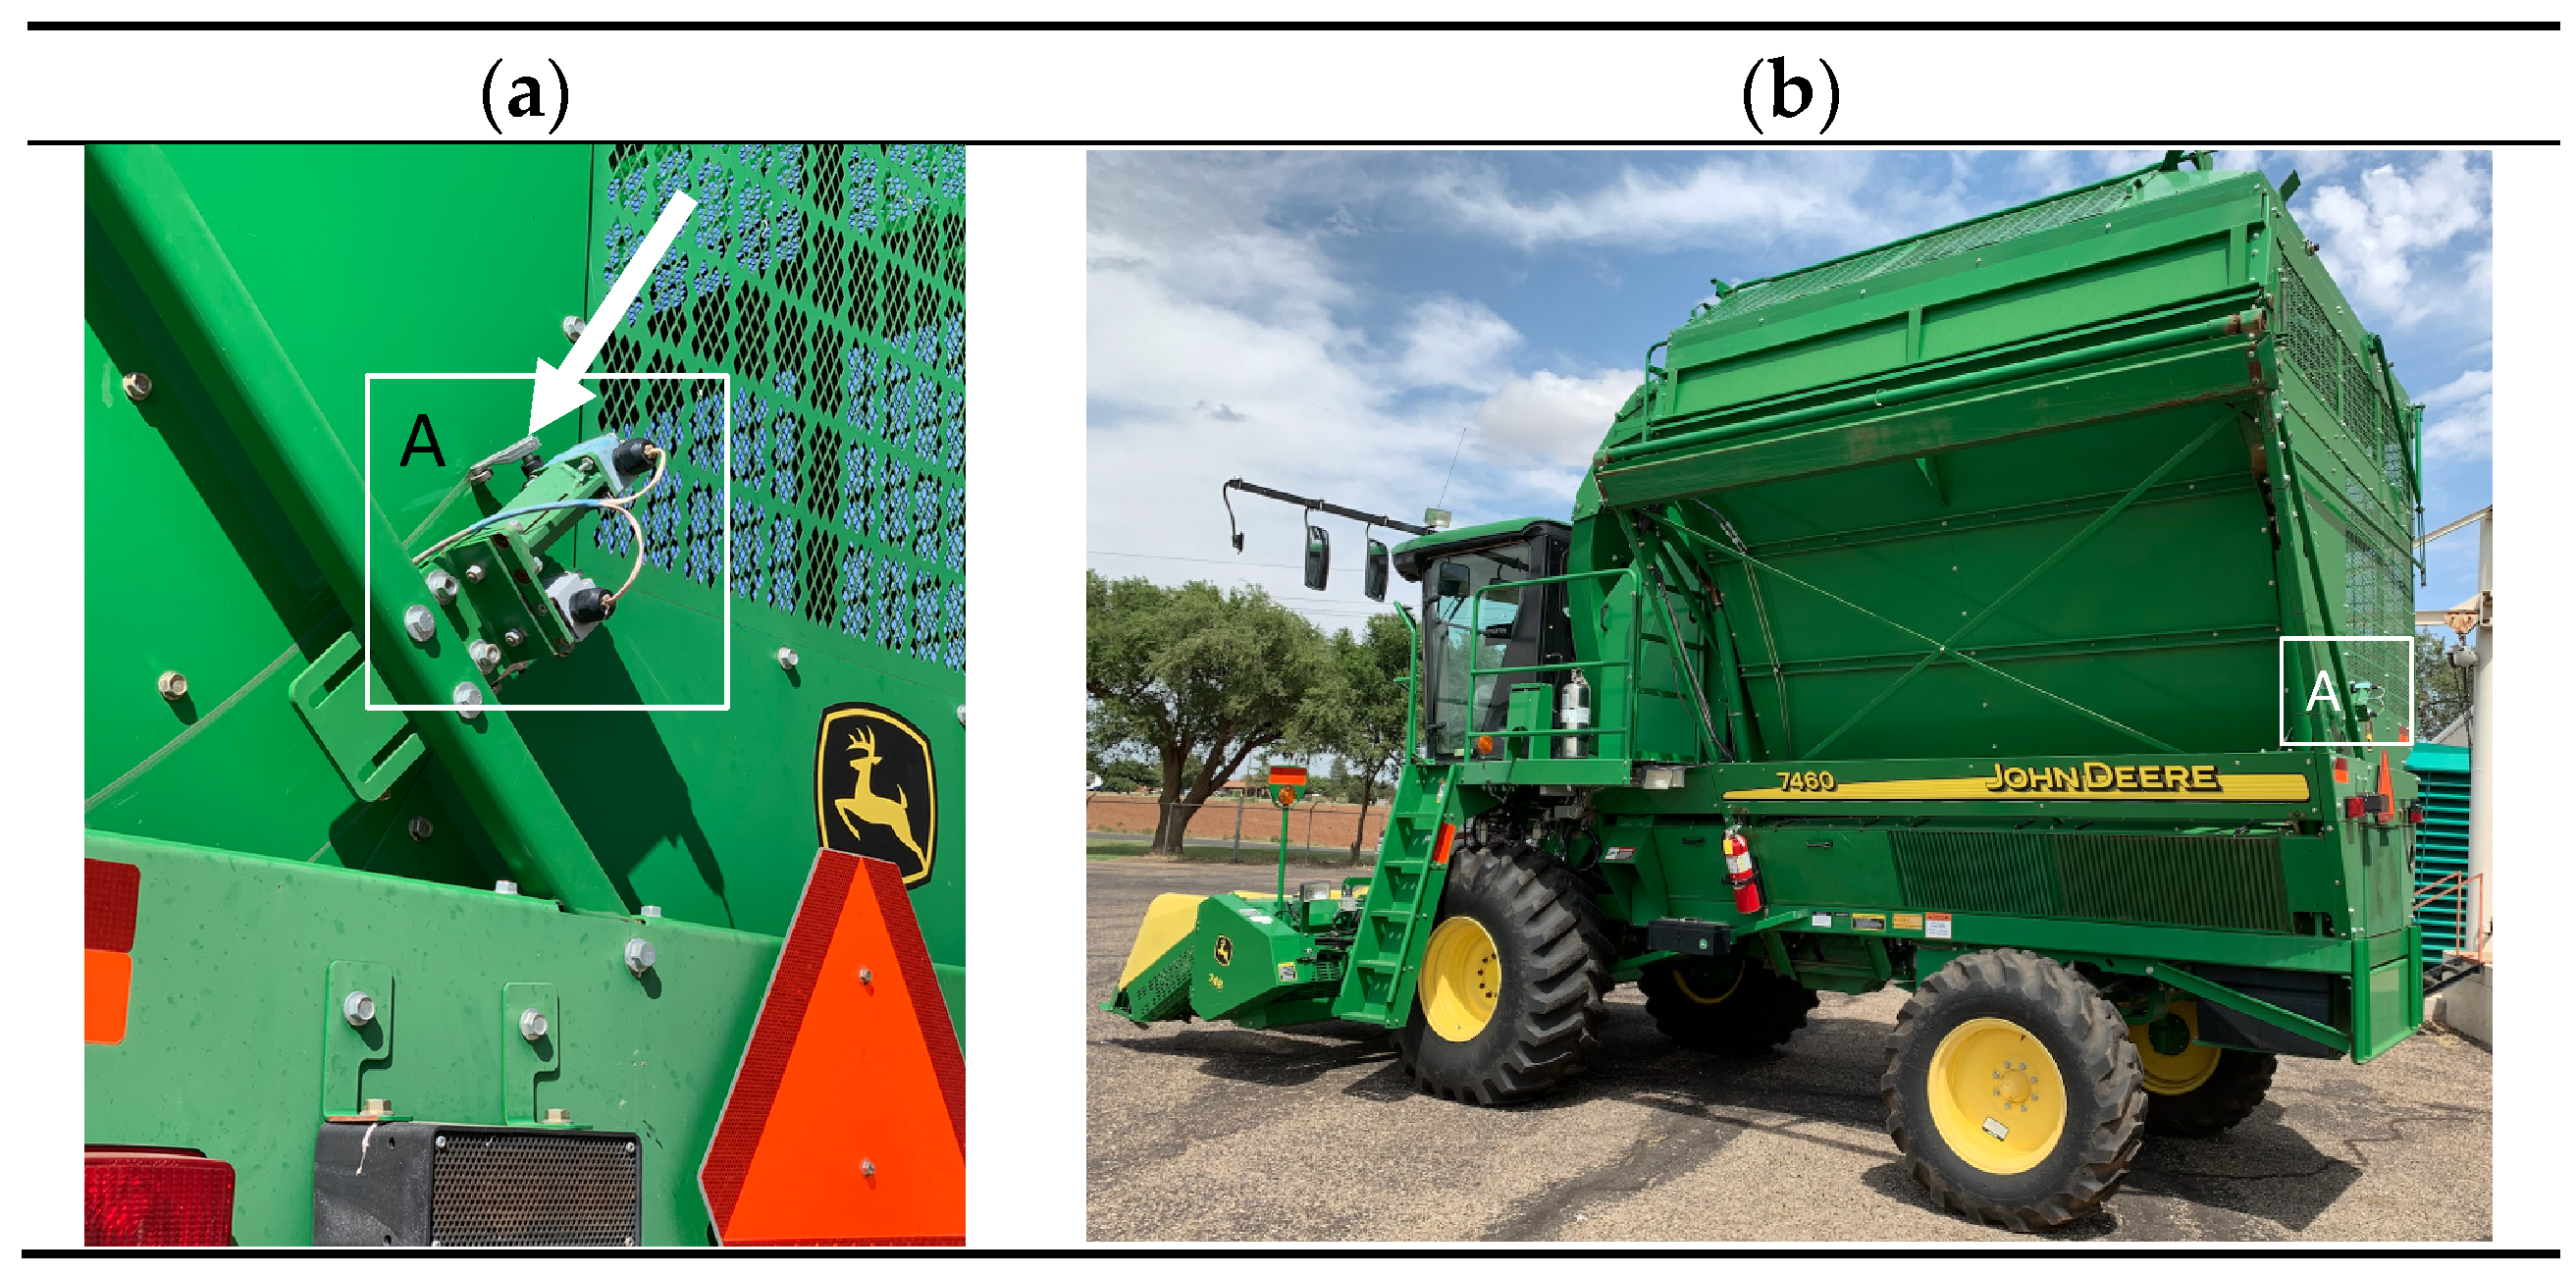
Of note is the basket weighing operation that utilizes a hydraulic feedback control system that consists of the PIC32 micro-controller that turns on the hydraulic solenoid, which provides flow to the harvester-basket’s hydraulic lift cylinders. The micro-controller was designed to drive the hydraulic control valves utilizing a solid-state relay circuit [19]. To achieve a repeatable and precision positioning at which to weigh the cotton, several methods were assessed (harvester basket tilt angle utilizing a three-axis accelerometer; linear distance sensor; pair of limit switches). The simplest and most accurate of these methods turned out to be the paired limit switch approach, which in the final design was utilized to provide an accurate repeatable location for the weighing operation. The system in use actuated the harvester’s hydraulic cylinders to lift the basket, while the micro-controller monitored a set of limit switches that were mounted at 1/4 of the lift height (Figure 2).
During the lift operation, the micro-controller monitors the first limit switch signal to tell when the basket is close to the target destination. Once the basket passes the first limit switch position, the micro-controller slows the basket speed by lowering the duty cycle on the pulse-width modulated (PWM) control provided to the solid-state relay driving the hydraulic solenoid connected to the harvester’s lift cylinders. The lower PWM control affords flexibility in the basket lift velocity, allowing the software to have full control over how slowly it approaches the final target destination. Utilizing this two-stage limit switch configuration, the system was able to park the harvester basket at the same point to within 1 cm every weigh cycle, thereby enabling the instrumentation to obtain a high accuracy estimation of the basket’s total weight. A tare cycle was implemented to allow for extraction of the seed-cotton load from this total weight measurement.
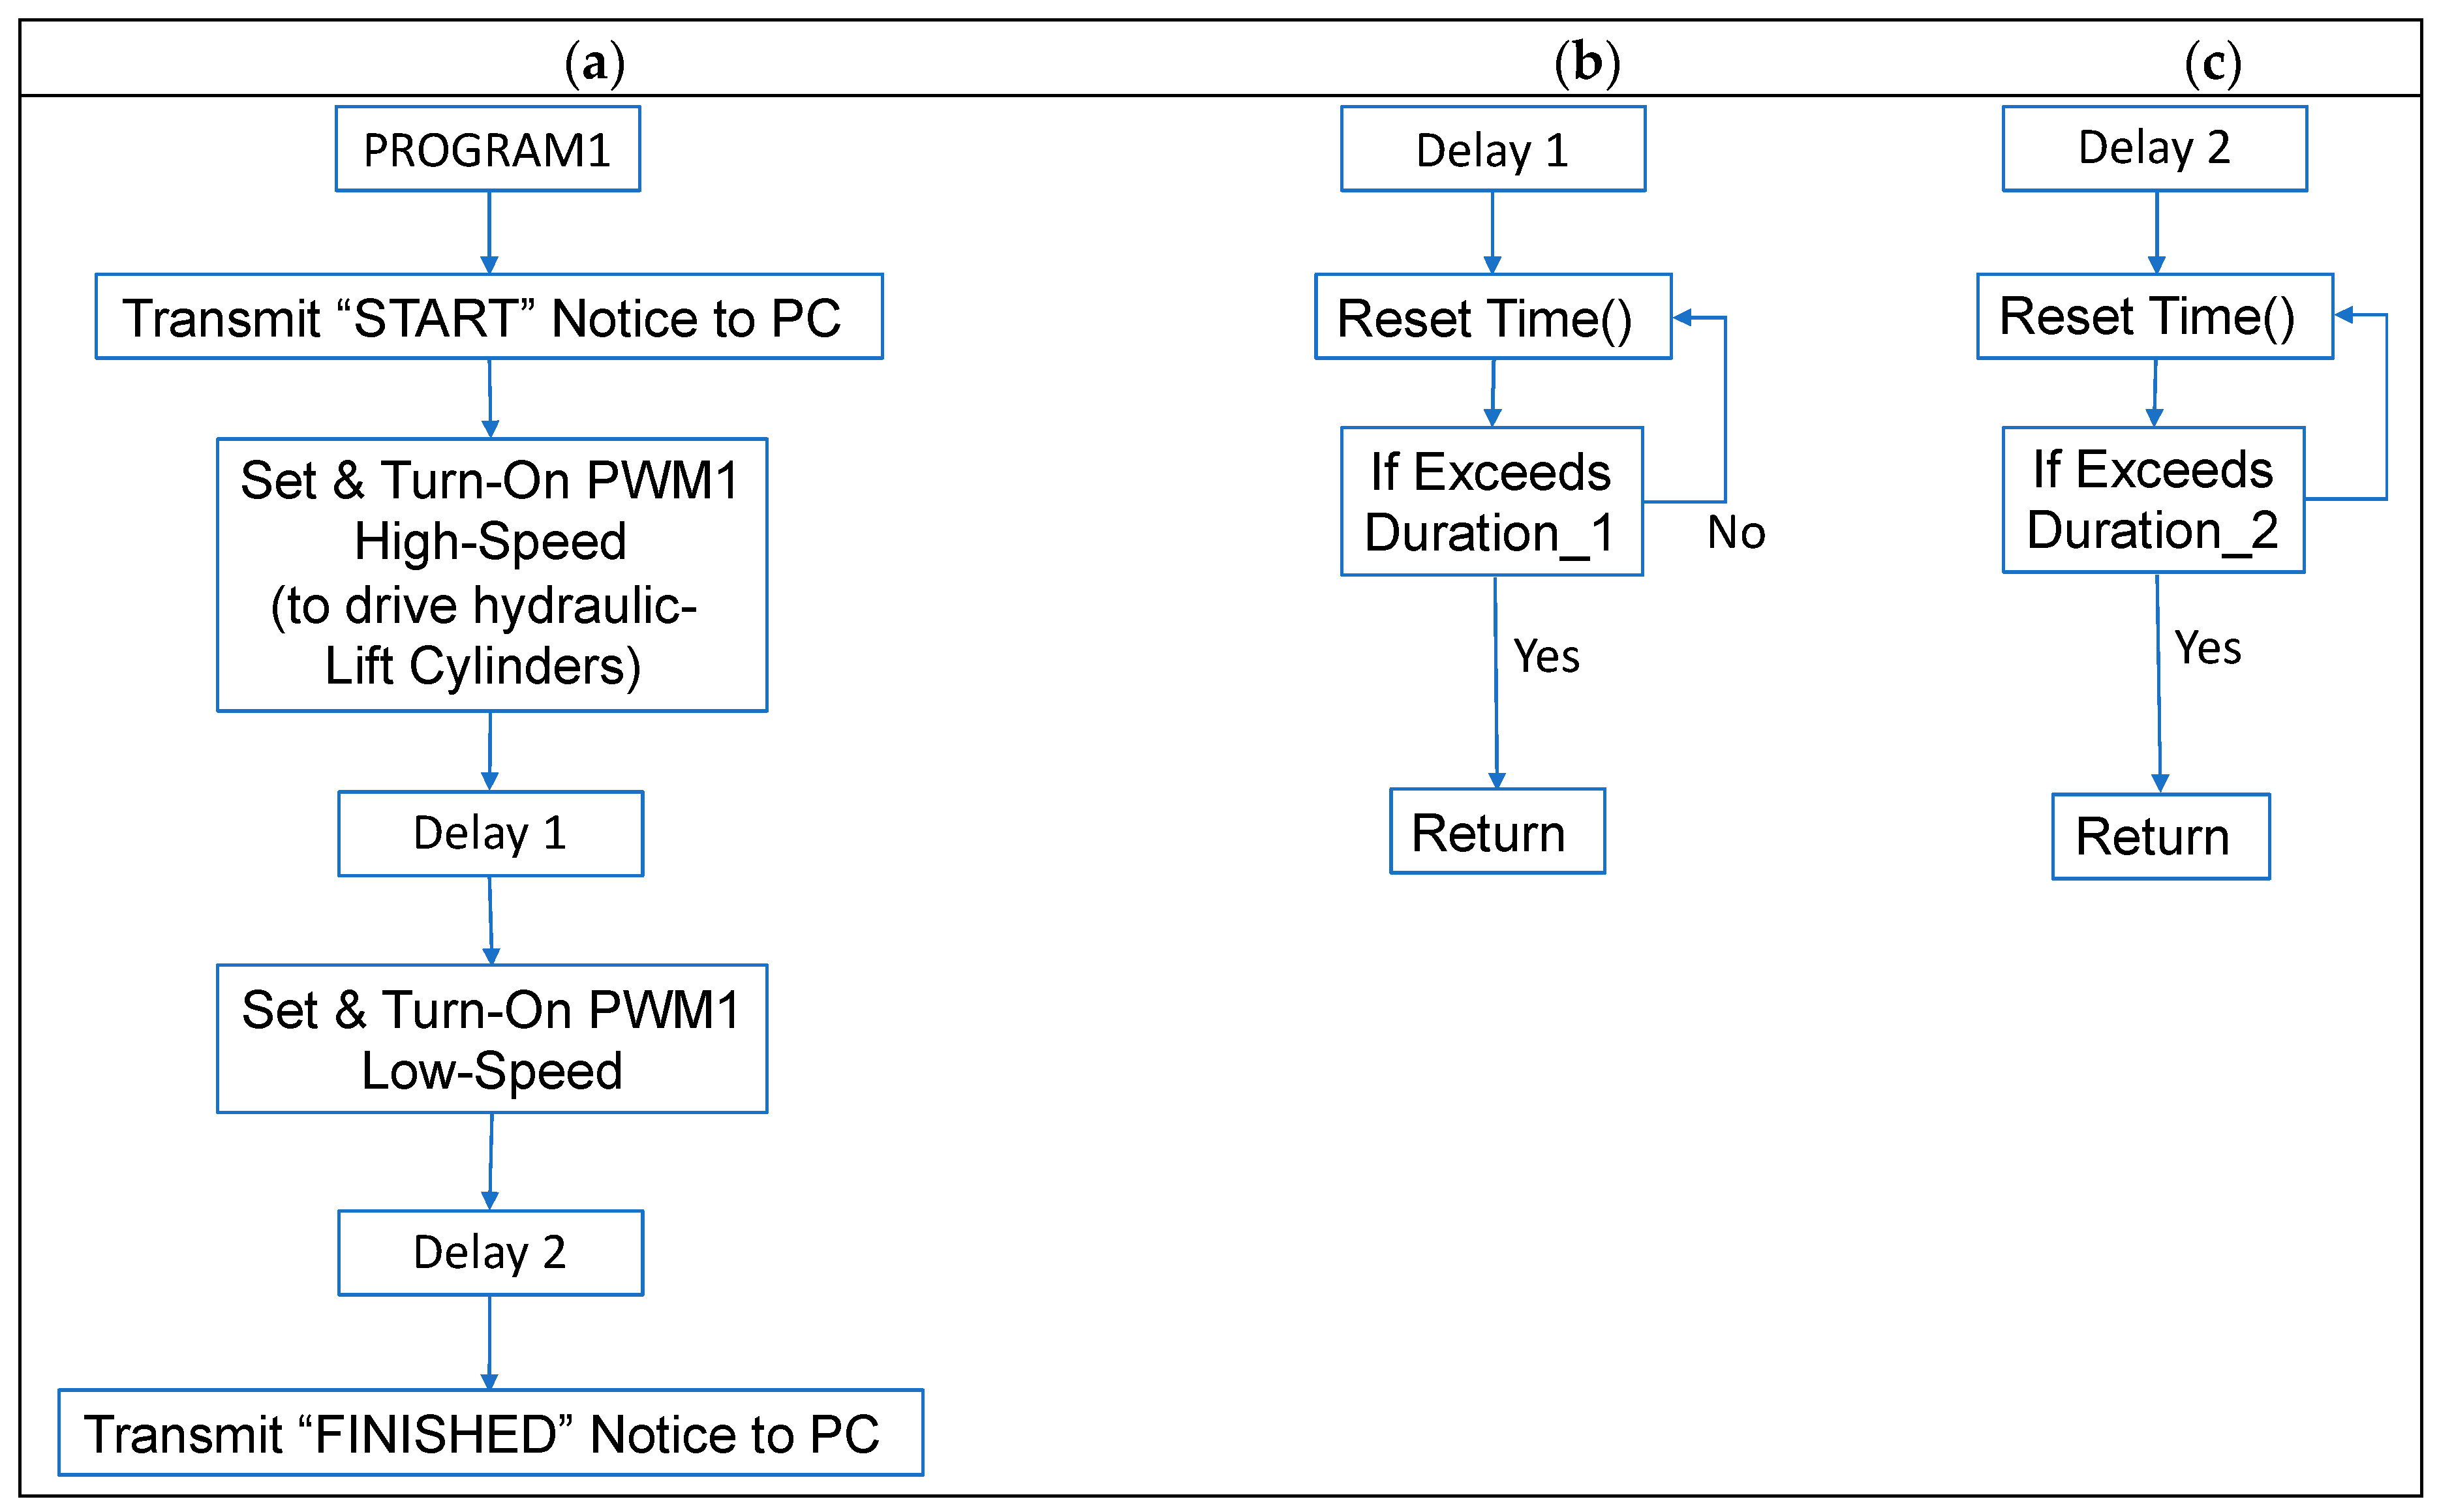
The software source-code to achieve basket positioning was placed into the two custom operations. The first was utilized for system troubleshooting, PROGRAM1, which avoided the use of the limit switches by utilizing a timing-only delay-loop along with the code to fire hydraulic solenoids to lift the basket into position for weighing. By using a timing only loop, PROGRAM1 provides the harvest operator a quick means to test and verify the system and, if a fault in the system is present, to isolate if the fault is due to the limit switch or with the hydraulic solenoid or micro-controller firing circuit. The next custom operation, PROGRAM2, provides the operational code to lift the basket into position for weighing utilizing positional feed-back from on-board limit-switches, Figure 2, which tell the micro-controller where the basket is and allows it to precisely position the basket control for the weighing cycle. In operation, the limit switches open when the trailing edge of the basket passes by the limit switch. The offset distance between the two limit switches provides an early warning feature to the micro-controller to allow it to slow down. The basic flow-chart for PROGRAM1 is detailed in Figure 3. Of note is that the reason Delay1 is different from Delay2 is that they use different client loaded delay times. This allows the operator interface program, implemented on the client calling industrial PC, to control the duration of these two delay cycles.
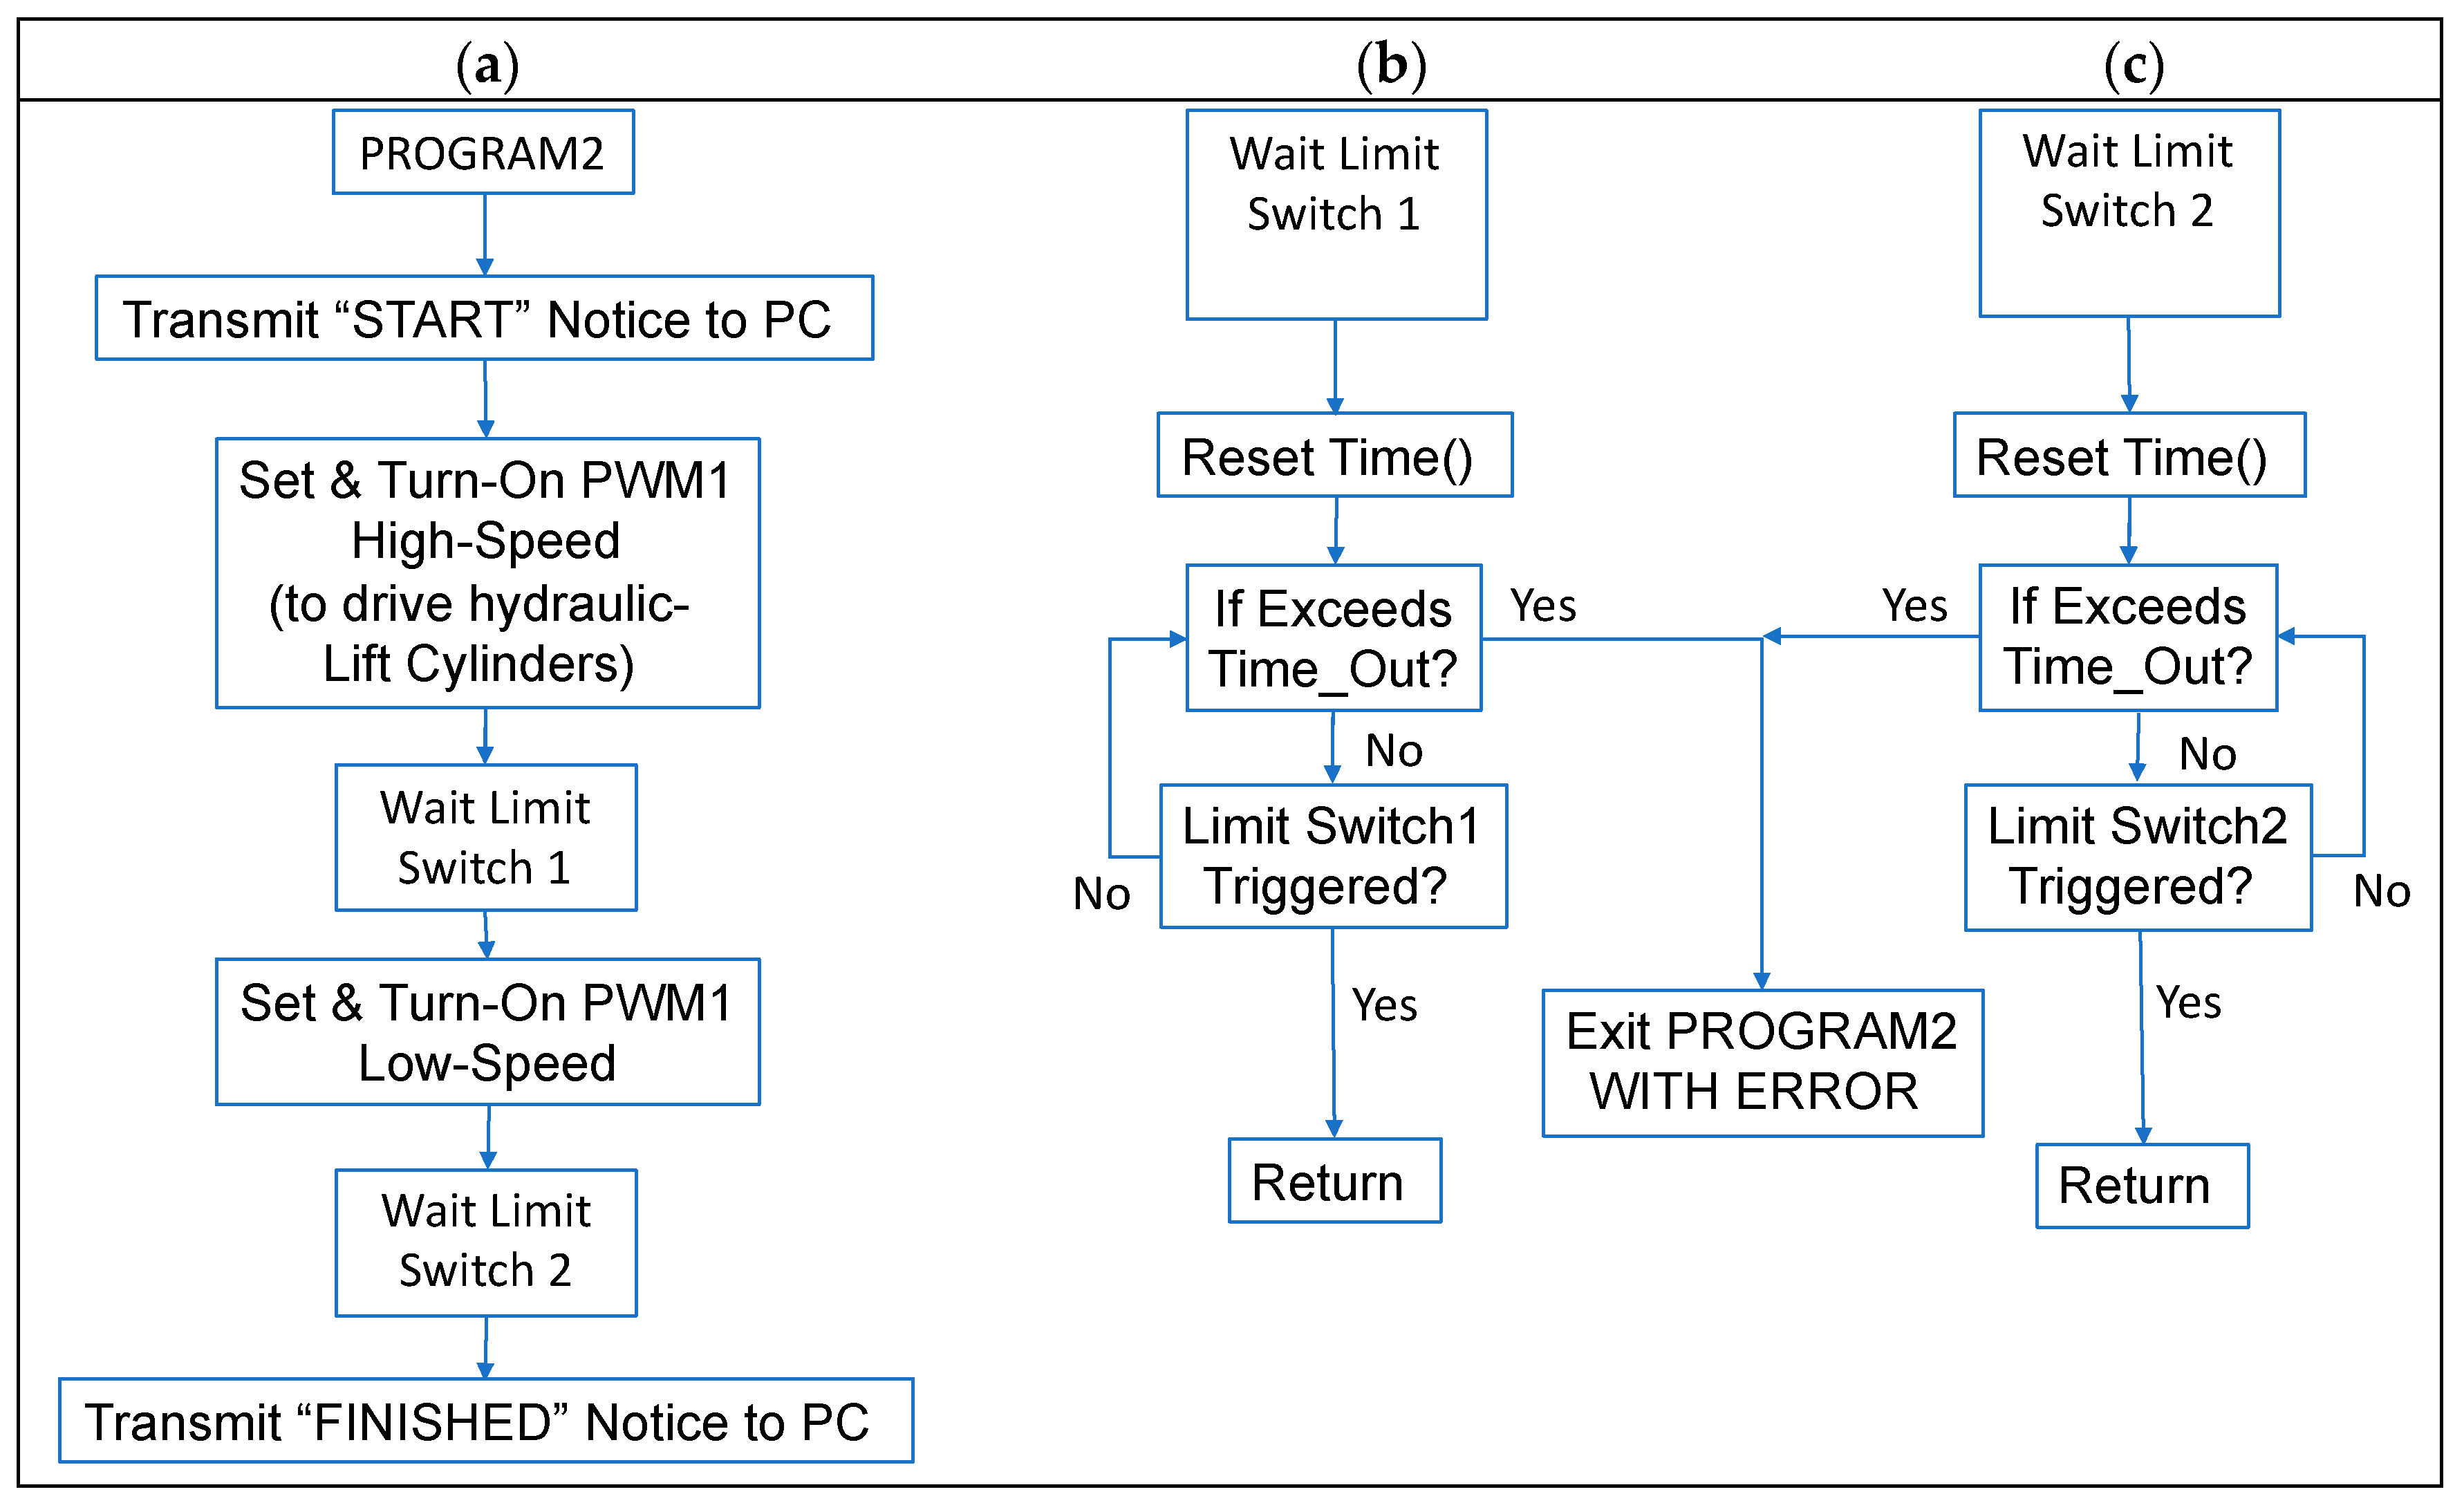
The basic flow-chart for the feed-back controlled basket lift cycle utilizing the two limited switches, stored in software source-code PROGRAM2, is detailed in flow-charts shown in Figure 4.
The rest of the code in the source code is too numerous to discuss in detail in this technical note and is largely self-explanatory, well-documented in the attached supplementary files and left to the reader to peruse.
3. Conclusions
The embedded PIC32 micro-controller software design covered in this technical note was tested in combination with the electronic design [19], HMI client software [20] and vehicle transient surge protection circuitry [21]. The system was proven both on the laboratory bench as well as in the field in harvester operation, was validated against truck weigh scales, and was found to be stable, robust and capable of providing a high-accuracy weigh system suitable for use in field trials as well as for use in the post-processing of field plot data. With some minor software modifications, the system could be easily extended to dynamically correct yield monitor data as well. Future notes are planned to cover both the hydraulic circuit design as well as the companion software implementation that provides the industrial PC operator interface code.
In summary, the system design worked well, and splitting the functionality into separate sections (HMI software as separate from the electronic control system) allowed for a modular design that was easily expandable. The electronic protection systems provided clean uninterrupted power and resulted in a robust dependable system. This effort was the culmination of three generations in which several organizational structures were explored and, in all, this version was the most compact and easy to deal with. For the purposes of expansion, it is easy to simply add another identical electronic sub-system and interface to it via an additional serial port that is easily added via the USB bus using a USB to serial converter. Future work is planned to extend this system to include an optical cotton yield monitor that counts cotton bolls in the pneumatic air ducts.
Supplementary Materials
The software source code files are available along with this technical note online at https://0-www-mdpi-com.brum.beds.ac.uk/2624-7402/1/4/35/s1 and are released into the public domain as Open-Source Software under MIT Open-source license. The code is written for a pic32 micro-controller (Microchip) and was compiled using MPLab IDE (Microchip).
Author Contributions
Conceptualization, M.G.P., J.D.W.; methodology, M.G.P., J.D.W.; software, M.G.P.; validation, J.D.W., M.G.P.; formal analysis, M.G.P., J.D.W.; investigation, M.G.P., J.D.W.; project administration, G.A.H.
Funding
This research received no external funding.
Conflicts of Interest
Mention of a product or trade-name in this article does not constitute an endorsement by the USDA-ARS over other compatible products. Products or trade names are listed for reference only. USDA is an equal opportunity provider and employer.
Abbreviations
| ADC | analog to digital converter |
| COMM | serial communication hardware |
| configDataLogger | software routine that is designed to setup the data-logger |
| DCV | hydraulic human-machine-interface |
| GPS | global positioning satellite navigation system |
| HMI | human machine interface (also known as man-machine interface) |
| LV_OUT | low-Voltage digital output |
| PADC | precision analog to digital converter |
| PC | personal computer |
| PDT | pre-defined time-span (ms) |
| PIC32 | 32 bit micro-controller (Microchip, Chandler, AZ) |
| PID | proportional-integral-derivative control |
| PLO | planned linear operation |
| PWM | pulse-width-modulated |
| RSME | root mean-squared error |
| RTOS | real-time operating system |
| SW | switch |
| TILT | sensor to measure the angle with respect to gravity |
| UART | asynchronous serial communications |
| USB | universal serial bus |
References
- Rains, G.C.; Perry, C.D.; Vellidis, G.; Thomas, D.L.; Wells, N.; Kvien, C.K.; Dales, H.D. Cotton yield monitor performance in changing varieties. ASAE 2002, 1, 021160. [Google Scholar]
- Wilkerson, J.B.; Moody, F.H.; Hart, W.E. Implementation and field evaluation of a cotton yield monitor. Appl. Eng. Agric. 2002, 18, 153–159. [Google Scholar] [CrossRef]
- Robertson, B.; Cordell, M.; Matthews, S.; Groves, F. Utility of Yield Monitors for On-farm Research. In Proceedings of the Beltwide Cotton Conference, San Antonio, TX, USA, 6–12 January 2006; pp. 1756–1758. [Google Scholar]
- Stewart, A.M.; Wright, I.R.; Deville, S.F.; Woolam, B.W. Comparison of On-Farm Cotton Variety Trial Results when Using Yield Monitors vs. Weigh Wagons. In Proceedings of the Beltwide Cotton Conference, Nashville, TN, USA, 7–11 January 2008; pp. 69–71. [Google Scholar]
- Taylor, R.; Porter, W.; Boman, R.; Osborne, S.; Henderson, W.; Buschermohle, M.; Barnes, E. Using yield monitors to evaluate cotton variety tests. In Proceedings of the Beltwide Cotton Conference, New Orleans, LA, USA, 6–8 January 2014; pp. 494–498. [Google Scholar]
- Wanjura, J.D.; Kelley, M.S.; Taylor, R.K.; Porter, W.M.; Barnes, E.M.; Pelletier, M.G.; Holt, G.A. Evaluation of a cotton stripper yield monitor. In Proceedings of the Beltwide Cotton Conference, New Orleans, LA, USA, 6–8 January 2014; pp. 481–493. [Google Scholar]
- Vories, E.D.; Jones, A.S.; Meeks, C.D.; Stevens, W.E. Variety effects on cotton yield monitor calibration. Appl. Eng. Agric. 2019, 35, 345–354. [Google Scholar] [CrossRef]
- Gvili, M. Cotton yield sensor produces yield maps. In Proceedings of the Beltwide Cotton Conference, San Diego, CA, USA, 5–9 January 1998; pp. 1655–1657. [Google Scholar]
- Wilkerson, J.B.; Moody, F.H.; Hart, W.E.; Funk, P.A. Design and evaluation of a cotton flow rate sensor. Trans. ASAE 2001, 44, 1415–1420. [Google Scholar] [CrossRef]
- Thomasson, J.A.; Sui, R. Advanced optical cotton yield monitor. In Proceedings of the Beltwide Cotton Conference, San Antonio, TX, USA, 4–8 January 2000; pp. 408–410. [Google Scholar]
- Deere & Company. Cotton Mass-Flow Sensor. Deere & Company: Moline, IL, USA. Available online: http://salesmanual.deere.com/sales/salesmanual/en_NA/cotton_harvesters/2011/feature/pickers/ams/cotton_mass_flow_sensor.html (accessed on 8 August 2019).
- Head, J.C.; Wilkerson, J.B.; Hart, W.E.; Allen, P.B. Identification and quantification of cotton yield monitor errors. In Proceedings of the Beltwide Cotton Conference, San Antonio, TX, USA, 8–10 January 2009; pp. 374–377. [Google Scholar]
- Walak, F.J.; Khalilian, A.; Dodd, R.B.; Han, Y.J.; Keshlkin, M.; Lippert, R.M.; Hair, W. Cotton yield monitor evaluation, South Carolina—Year 2. In Proceedings of the Beltwide Cotton Conference, Orlando, FL, USA, 3–7 January 1999; pp. 361–364. [Google Scholar]
- Sassenrath-Cole, G.F.; Thomson, S.J.; Williford, J.R.; Hood, K.B.; Thomasson, J.A.; Williams, J.; Woodard, D. Field testing of cotton yield monitors. In Proceedings of the Beltwide Cotton Conference, Orlando, FL, USA, 3–7 January 1999; pp. 364–366. [Google Scholar]
- Sui, R.; Thomasson, J.A. Test of temperature and stray-light effects on mass-flow sensor for cotton yield monitor. Appl. Eng. Agric. 2002, 18, 429–434. [Google Scholar]
- Thomasson, J.A.; Sui, R. Mississippi cotton yield monitor: Three years of field-test results. Appl. Eng. Agric. 2003, 19, 631–636. [Google Scholar] [CrossRef]
- Wanjura, J.D.; Pelletier, M.G.; Holt, G.A.; Kelley, M.S. A harvester-based calibration system for cotton yield monitors. In Proceedings of the Beltwide Cotton Conference, San Antonio, TX, USA, 5–7 January 2015; pp. 635–647. [Google Scholar]
- Wanjura, J.; Pelletier, M.; Holt, G.; Kelley, M. Reliability testing of an on-harvester cotton weight measurement system. In Proceedings of the Beltwide Cotton Conference, New Orleans, LA, USA, 5–6 January 2016; pp. 658–670. [Google Scholar]
- Pelletier, M.G.; Wanjura, J.D.; Holt, G.A. Electronic Design of a Cotton Harvester Yield Monitor Calibration System. AgriEngineering 2019. forthcoming. [Google Scholar]
- Pelletier, M.G.; Wanjura, J.D.; Holt, G.A. Man-machine-interface Software Design of a Cotton Harvester Yield Monitor Calibration System. AgriEngineering 2019. forthcoming. [Google Scholar]
- Pelletier, M.G.; Wanjura, J.D.; Holt, G.A.; Funk, P.A. Methods for Protecting a Personal Computer and Data Acquisition Electronics Installed on Mobile Equipment. AgriEngineering 2019, 1, 4–16. [Google Scholar] [CrossRef]
Figure 1.
The left-pane figure (a) of the picture shows the main loop that the micro-controller is performing. The “Run Scan” box in the left-pane is detailed in figure (b), where the system basically iterates through a custom list of possible operations that are provided by the calling client industrial computer. The figure (c) loop shows how the software builds up the custom Scan-List of operations that will be executed during the “Scan” phase portion of operation, which includes the pre-programmed initialization routines for the particular operation that was called into play.

Figure 2.
Pictures showing the mounting location of the two limit switches, inset box A in both images, that let the micro-controller know when the basket is in the weigh position. The arrow in image (a) is pointing to the roller arm on the second, final destination, limit switch that senses when the basket passes this location and has arrived at its target weighing height. (b) harvester.

Figure 3.
Picture detailing the flow-charts of the troubleshooting, delay only, basket lift routine. Figure pane (a) shows the high-level routine, pane (b) shows the Delay1 sub-routine, and pane (c) shows the Delay2 sub-routine.
Figure 3.
Picture detailing the flow-charts of the troubleshooting, delay only, basket lift routine. Figure pane (a) shows the high-level routine, pane (b) shows the Delay1 sub-routine, and pane (c) shows the Delay2 sub-routine.

Figure 4.
Picture detailing flow-charts of the feed-back controlled precise-placement basket lift routine. The figure pane (a) shows the main high-level loop of the function. Figure panes (b,c) depict the limit-switch wait sub-functions.
Figure 4.
Picture detailing flow-charts of the feed-back controlled precise-placement basket lift routine. The figure pane (a) shows the main high-level loop of the function. Figure panes (b,c) depict the limit-switch wait sub-functions.


Table 1.
Detail location of the previous list’s functions within the file datalog.c.
| Function # | File Line # | Function Name |
|---|---|---|
| 1 | 539 | run_SW1 |
| 2 | 556 | run_SW2 |
| 3 | 574 | run_LV_OUT1 |
| 4 | 596 | run_PWM1 |
| 5 | 611 | run_PWM1 |
| 6 | 771 | run_PADC |
| 7 | 711 | run_TILT_XY |
| 8 | 724 | run_TILT_XZ |
| 9 | 736 | run_TILT_YZ |
| 10 | 665 | run_ANGLE_X |
| 11 | 676 | run_ANGLE_Y |
| 12 | 687 | run_ANGLE_Z |
| 13 | 925 | run_PROGRAM1 |
| 14 | 976 | run_PROGRAM2 |
| 15 | 1656 | configDataLogger |
| 16 | 1662 | configDataLogger |
| 17 | 1666 | configDataLogger |
| 18 | 1670 | configDataLogger |
© 2019 by the authors. Licensee MDPI, Basel, Switzerland. This article is an open access article distributed under the terms and conditions of the Creative Commons Attribution (CC BY) license (http://creativecommons.org/licenses/by/4.0/).
Share and Cite
MDPI and ACS Style
Pelletier, M.G.; Wanjura, J.D.; Holt, G.A. Embedded Micro-Controller Software Design of a Cotton Harvester Yield Monitor Calibration System. AgriEngineering 2019, 1, 485-495. https://0-doi-org.brum.beds.ac.uk/10.3390/agriengineering1040035
AMA Style
Pelletier MG, Wanjura JD, Holt GA. Embedded Micro-Controller Software Design of a Cotton Harvester Yield Monitor Calibration System. AgriEngineering. 2019; 1(4):485-495. https://0-doi-org.brum.beds.ac.uk/10.3390/agriengineering1040035
Chicago/Turabian StylePelletier, Mathew G., John D. Wanjura, and Greg A. Holt. 2019. "Embedded Micro-Controller Software Design of a Cotton Harvester Yield Monitor Calibration System" AgriEngineering 1, no. 4: 485-495. https://0-doi-org.brum.beds.ac.uk/10.3390/agriengineering1040035