1. Introduction
Agricultural machinery and postharvest technologies are crucial factors in farming [
1,
2]. Apple and citrus are among the most popular fruits all over the world with an essential role in international global trade. Apples’ world production is estimated at about 75 million tons with China, European Union countries, and the United States as the largest producers. These countries in the last few years exported around 1 million tons of product [
3]. Orange production is globally around 50 million tons with Brazil, Mexico, and China as the largest producers [
4].
Grading and sorting have significant effects on how the products are presented, directly affecting trade and the ability to compete in global trading [
5]. Most of the fruit and products are sorted and graded before storage and preparation for presentation in the markets. These operations are one of the most significant costs in the fruit value chain, representing up to 40% of the costs in apple production [
6].
Sorting is a comprehensive operation that consists of grading products in terms of quality on the basis of some essential features such as color, maturity, damages, and size, where properties like length, width, height, composition, and mass are taken into account [
7]. Fruits are mostly sized based on their diameter because it is the most significant factor [
8]. The operation can be carried out by hand or mechanically. Shortage and cost of the labor force, together with the improvement of postharvest technologies, have contributed to the development and adoption of grading and sorting machines for many fruit and vegetables.
Several studies investigated cost-effective machines based on a simple mechanism for fruit and vegetable sizing. Mostafa and Bahnasawy [
9] built and evaluated a belt-and-roller sorting machine for sizing about 1.7 ton per hour of onion. They studied the effects of speed and angle of the belt on the machine efficiency, reporting the best efficiency for a belt speed of 0.23 m/s and a belt angle of 20 degrees [
9]. Kermani and Koravand [
10] developed a sorting machine based on a diverging belt for sizing hazelnut. Results indicated that linear velocity had a significant effect on separation and that the best results were obtained at 0.8 m/s of the belt [
10]. The same mechanism was investigated by Treeamnuk et al. [
11] for sizing java apples.
Tabatabaekloor and Hashemi [
12] investigated the efficiency of a rotary semi-conical disc for citrus sizing, and they reported the best performance of the machine at a speed of 40 rpm.
2. Objective
The paper aims at investigating the efficiency of a prototype of a sizing machine based on the belt-and-roller mechanism for sizing spherical and semicircular fruit. In particular, the study investigates the effects of the speed of transport belts and conveyors and evaluates the damages on the fruit.
3. Materials and Method
3.1. Sorter Machine
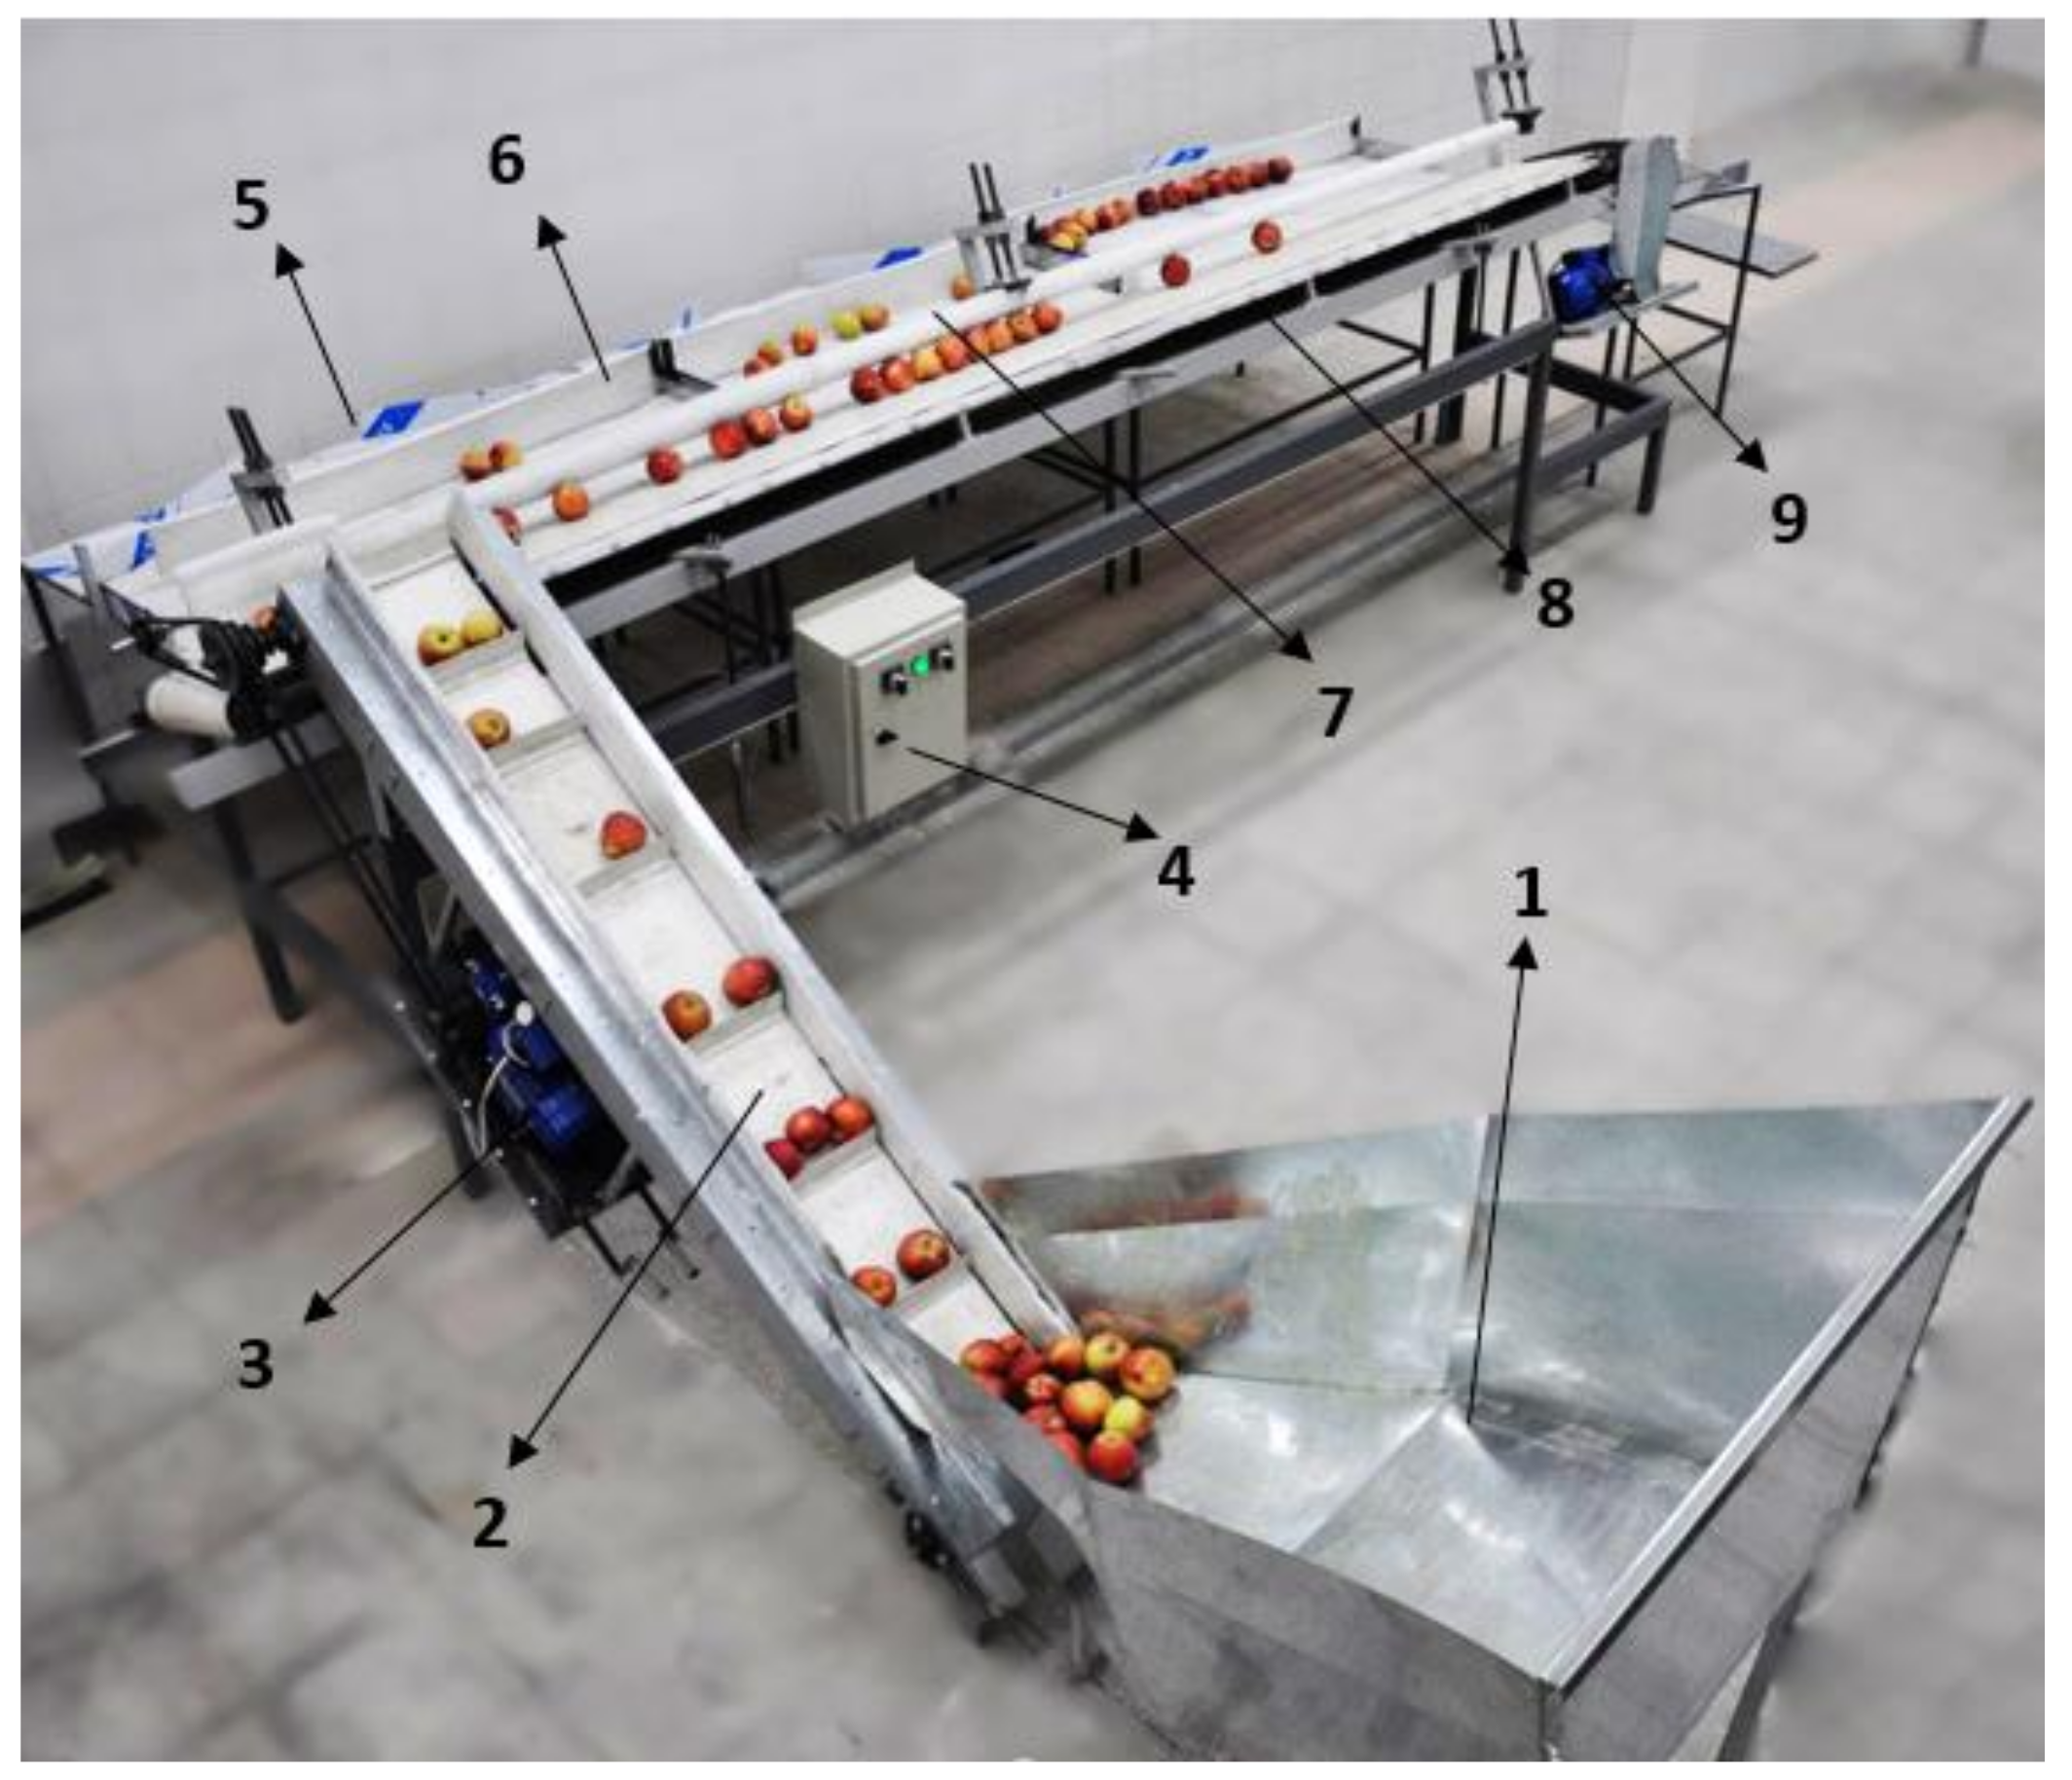
A prototype of a sorter was built at the workshop of the State University of Tabriz, Iran, in September 2017. It is composed of 3 main parts: feeding, sizing, and collecting units (see
Figure 1 for the complete view of the prototype of the machine).
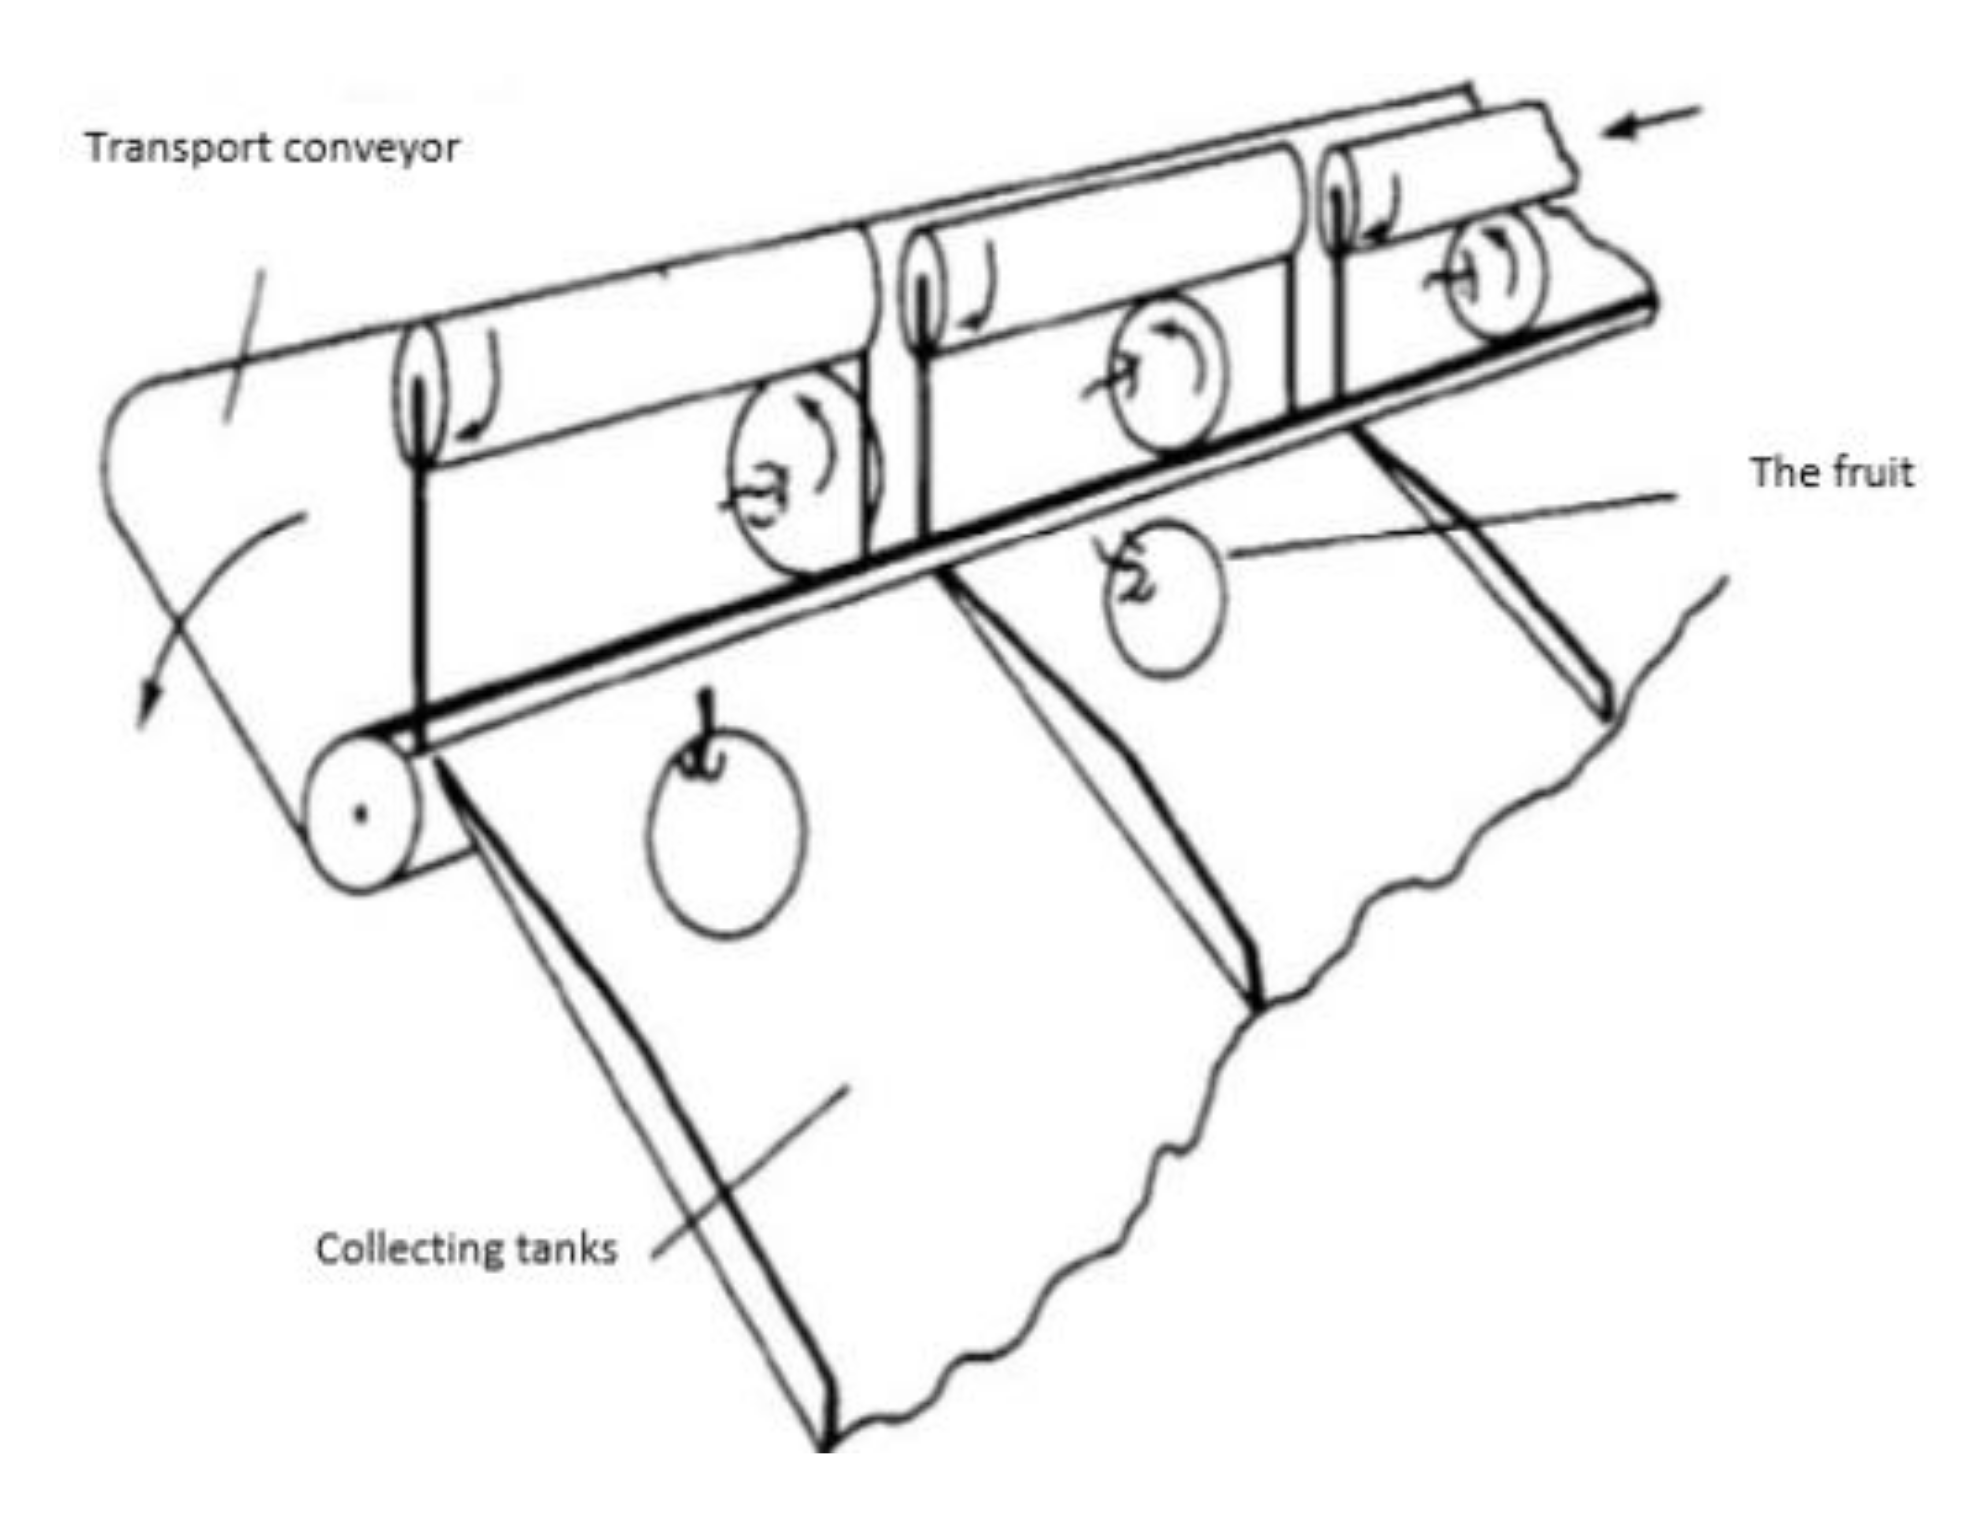
Fruits are moved up from a container by a feeding conveyor belt to the sizing mechanism made of a belt and a roller. The belt is angled toward the roller and makes the fruit move from the feeding point to the opposite direction. The diameter of the rollers decreases all along its length. The fruit moves from the feeding point to the opposite direction, and when the diameter of the fruit is lower than the distance between the roller and the belt, it goes through and drops in one of the collecting units corresponding to the size of the opening set on the belt-and-roller mechanism. Otherwise, fruit continue to move on the belt until achieving a larger opening (see
Figure 2 for the scheme of the mechanism).
The feeding conveyor and the sizing mechanism are powered by two 0.37 kW electrical motors. A gearbox is fitted on the engine powering the belt and the roller to have three different rotating speeds on the sizing roller and forward speeds for the belt (
Table 1). The speed of the feeding conveyor is adjusted by an inverter.
Polyethene curtains were used as barriers to reduce the speed of the products and decrease fruit impact intensity and avoid damages on them.
3.2. Preparation of Samples
In this research, two varieties of apples (Red Delicious and Golden Delicious) and a variety of orange (Thomson navel) were examined. Fruits were obtained from local markets and then coded and classified into grades based on the size. Due to both the physical properties of the fruits in some studies and the US standard for packing fruit, apples are classified into four grades according to the diameter: smaller than 60 mm, from 60 to 70 mm, from 70 to 80 mm, and bigger than 80 mm [
13], while oranges are classified into smaller than 70 mm, from 70 to 80 mm, from 80 to 90 mm, and bigger than 90 mm [
14,
15]. These classifications were adopted for this study.
The spherical coefficient of 20 samples of fruit was calculated for the two varieties of apple and for the orange. The spherical coefficient was calculated according to Equation (1) [
16].
where
Sp is the Spherical coefficient;
b is the smallest diameter of the sample (cm);
a is the biggest diameter of the sample (cm);
c is the height (cm).
4. Evaluation of Sorter’s Performance
The sorter performances were evaluated based on the following criteria: the percentage of purity, the percentage of error, the efficiency index, and the sorting error [
7,
11,
17].
The percentage of error
Cw refers to all inaccurate-dimension fruits for any of the selected range of the diameter set on the sorting machine compared to all fruits in that range. It is calculated as the total error percentages of all degrees (
j) in the discharge flow of degree
i.
Cw is calculated according to Equation (2):
where
Cw is the percentage of error (%);
Ci,j is the percentage of inaccurate sorted products of degrees j in the discharge of degree i (i ≠ j);
Wi is the ratio of degree i weight to total weight of products in the feeding tank.
Wi is calculated according to Equation (3)
For example, if we have 3 degrees, then
Ci,j for degree 1 will be
and
therefore
Since we separate fruits to 4 degrees, Equation (2) becomes
The percentage of purity
Pw represents the percentage of fruits of the correct dimension for any of the selected range of diameter set on the sorting machine compared to all fruits in that range. It is computed as the ratio of the number of correctly sorted fruit in output
i to the total number of fruit in output
i.
Pw is calculated according to Equation (8), after the following steps:
where
Pi is the percentage of the number of degrees i inflow rate Q;
Ni is the number of degrees i in flow rate;
NT is the total number of products in flow rate.
The purity index
Pg,i is calculated according to Equation (7)
where
Pg,i is the purity index in degree i;
Ngi is the number of accurate-sized products;
NgT is the total number of products in degree i.
Since these criteria were independent of the feeding rate, we used an efficiency index and sorting error to investigate the effect of the feeding rate on machine performance.
The efficiency index
Ew represents the correct-dimension flow rate for any of the selected range of diameter set on the sorting machine compared to all fruit flow rate in that range. It is the correct flow rate of grade
i in the discharge rate of grade
i. The efficiency index
Ew is calculated according to Equation (9):
where
Ew is the machine efficiency;
Ei is the efficiency index in grade i;
Gi is the flow rate in grade i discharge container (kg/h);
Q is the fruit feeding discharge (flow rate) (kg/h).
The sorting error
Sw represents the inaccurate-dimension flow rate for any of the selected range of diameter that is set on the sorting machine compared to all fruit flow rate in that range. It is calculated as the flow rate of all fruits except the correct one in any selected range to the total flow rate on that range.
Sw is calculated according to Equation (10).
In other words, the sum of efficiency index E
w and sorting error S
w is 1, as shown in Equation (11):
where
Efficiency index Ew and sorting error Sw represent the pure flow rate of grade i in the discharge rate of grade i and the percentage of inaccurate sizing in grade i, respectively.
5. Damage Assessment
After each test, we randomly picked 20 fruits from the 4 grades of size (smaller than 60 mm, from 60 to 70 mm, from 70 to 80 mm, and bigger than 80 mm) to assess the damages; this was done for both Golden Delicious and Red Delicious. Each apple was tested separately to determine the effect of size in damage. Oranges were not damaged during the test because of their particular rheological properties [
18], so the damage assessment was carried out.
According to the standards for assessing damages on apples, we stored them after the test at 0–1 °C temperature for two weeks [
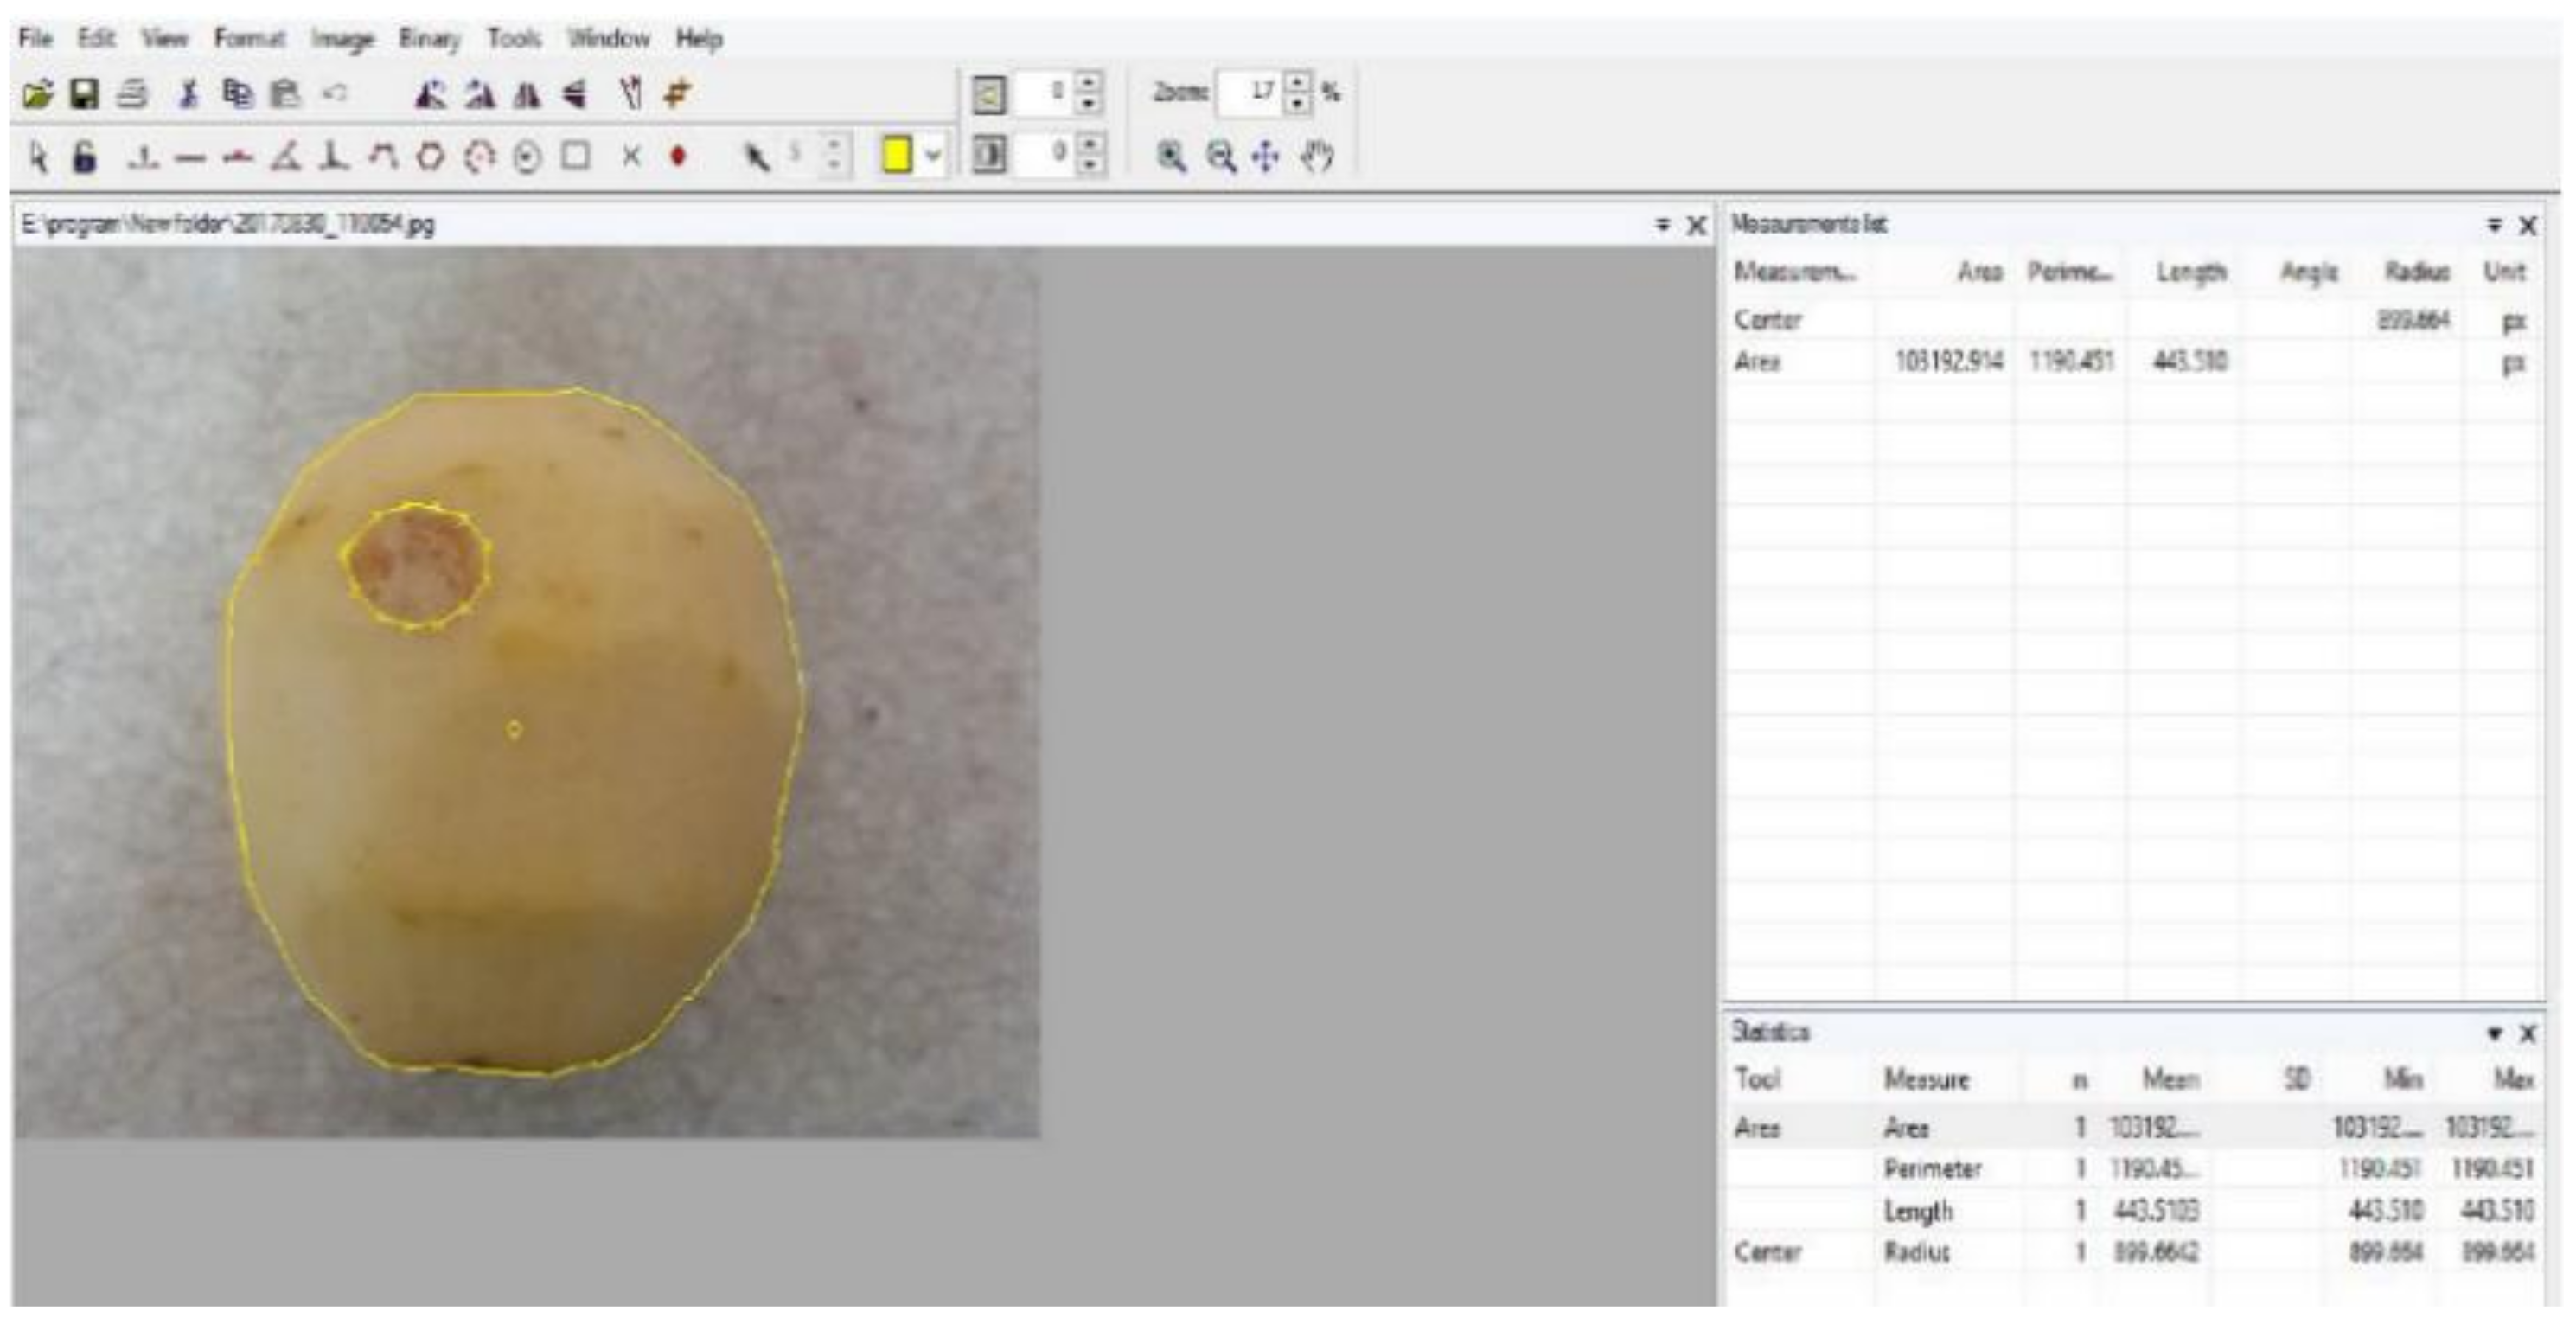
14]. Mechanical damages in apples sorting appear as bruising and browning on the injured surface. Fruits were peeled, and the damaged surface areas (2 mm
2) on whole individual apples were computed by digitizer software (MATLAB R2019b) on photos taken from 20 cm high (see
Figure 3 for an example of the computation of damaged area). Thus, the damage on any single apple was classified according to the damaged area on different sizes of fruit [
19,
20,
21].
6. Statistical Analysis
The effects of the working parameters on machine performance on the 3 products types (Golden Delicious, Red Delicious, and oranges) were analyzed with a factorial ANOVA test [
22] with 2 factors. in a completely randomized block and 3 replications. The first factor is the speed of the feed belt with its corresponding discharge rate with three levels, i.e., 0.26, 0.21, and 0.17 m/s, while the second factor is the speed of the transporting belt with two levels, i.e., 0.25 and 0.182 m/s. The dependent variables included efficiency, sorting error, purity index, error index, and the amount of damage on products.
The mean difference was computed with Duncan’s multiple range test at a 0.01 significant level. Statistics were performed with SPSS 26.0.0.1 software.
7. Results
The spherical coefficient calculated for the Golden Delicious, Red Delicious, and the Thomson navel was respectively 92, 93, and 95.
7.1. Results of Golden Delicious Apple
The results of the tests on the Golden Delicious (
Table 2) indicate that the feeding belt speed, the transport belt speed, and the effect of the interaction of these two factors have significant effects on the purity index and error index at a 1% probability. The results show that the efficiency and purity decrease when the speeds of the feeding belt increase (
Table 3). When the feeding belt speed increases, the efficiency and purity index decrease while the efficiency and purity index rise when the transport belt speed increases. These results confirm what was reported by Mostafa and Bahnasawy [
9] and Treeamnuk et al. [
11].
The increase in the feeding rate causes an aggregation of the products on the transport belt and ultimately decreases efficiency [
17]. Sorting error and error index have similar behavior. In addition to this, the purity index and sorting efficiency decrease with the sorting error while the error index increases. According to results of the evaluation test on the Golden Delicious, the highest purity index and maximum efficiency is achieved by the prototype of the sorting machine when the feeding belt speed is set at 0.17 m/s, and the transport belt speed is set at 0.25 m/s.
7.2. Results of Red Delicious Apples
The feeding belt speed significantly affects all parameters evaluated. The results of the tests report that when the feeding belt speed increases, the efficiency and purity index decrease while the sorting error and error index increase. These results confirm the outcome of the trials on the Golden Delicious apples and those from the study of Nieoczcym et al. [
23] that pointed out that accelerating the sorting process had a crucial effect on the apple sorting efficiency.
On Red Delicious, unlike on Golden Delicious, the interaction of treatments has no significant effect on the investigated indexes. This may have happened because of the different spherical coefficients and size distribution of the two varieties of fruit. Indeed, by increasing the spherical coefficient and wide proportional distribution of all sizes, the effect of the variables decreases. This is in accordance with results from Treeamnuk et al. [
11] about the effect of the feeding belt speed on performance in a similar study.
7.3. Results on Evaluation of Orange (Thompson Navel)
The tests on oranges indicate that only the feeding belt speed affects the purity and error index while the interaction between the feeding belt speed and transport belt speed has a significant effect on sorting efficiency and sorting error (
Table 6).
The best efficiency of the machine for orange sorting is attained at a feeding belt speed of 0.17 m/s. For oranges, the purity index decreases when the feeding belt speed increases while the error index increases. These results are similar to results obtained on apple sorting, and they show that when the spherical coefficient in fruit increases, the effect of the feeding belt speed on evaluation indexes decreases. The results obtained on oranges are in accordance with those reported by Markovic et al. [
24] in their study on a rotating sizing machine for fruit sorting.
7.4. Investigation on Damages
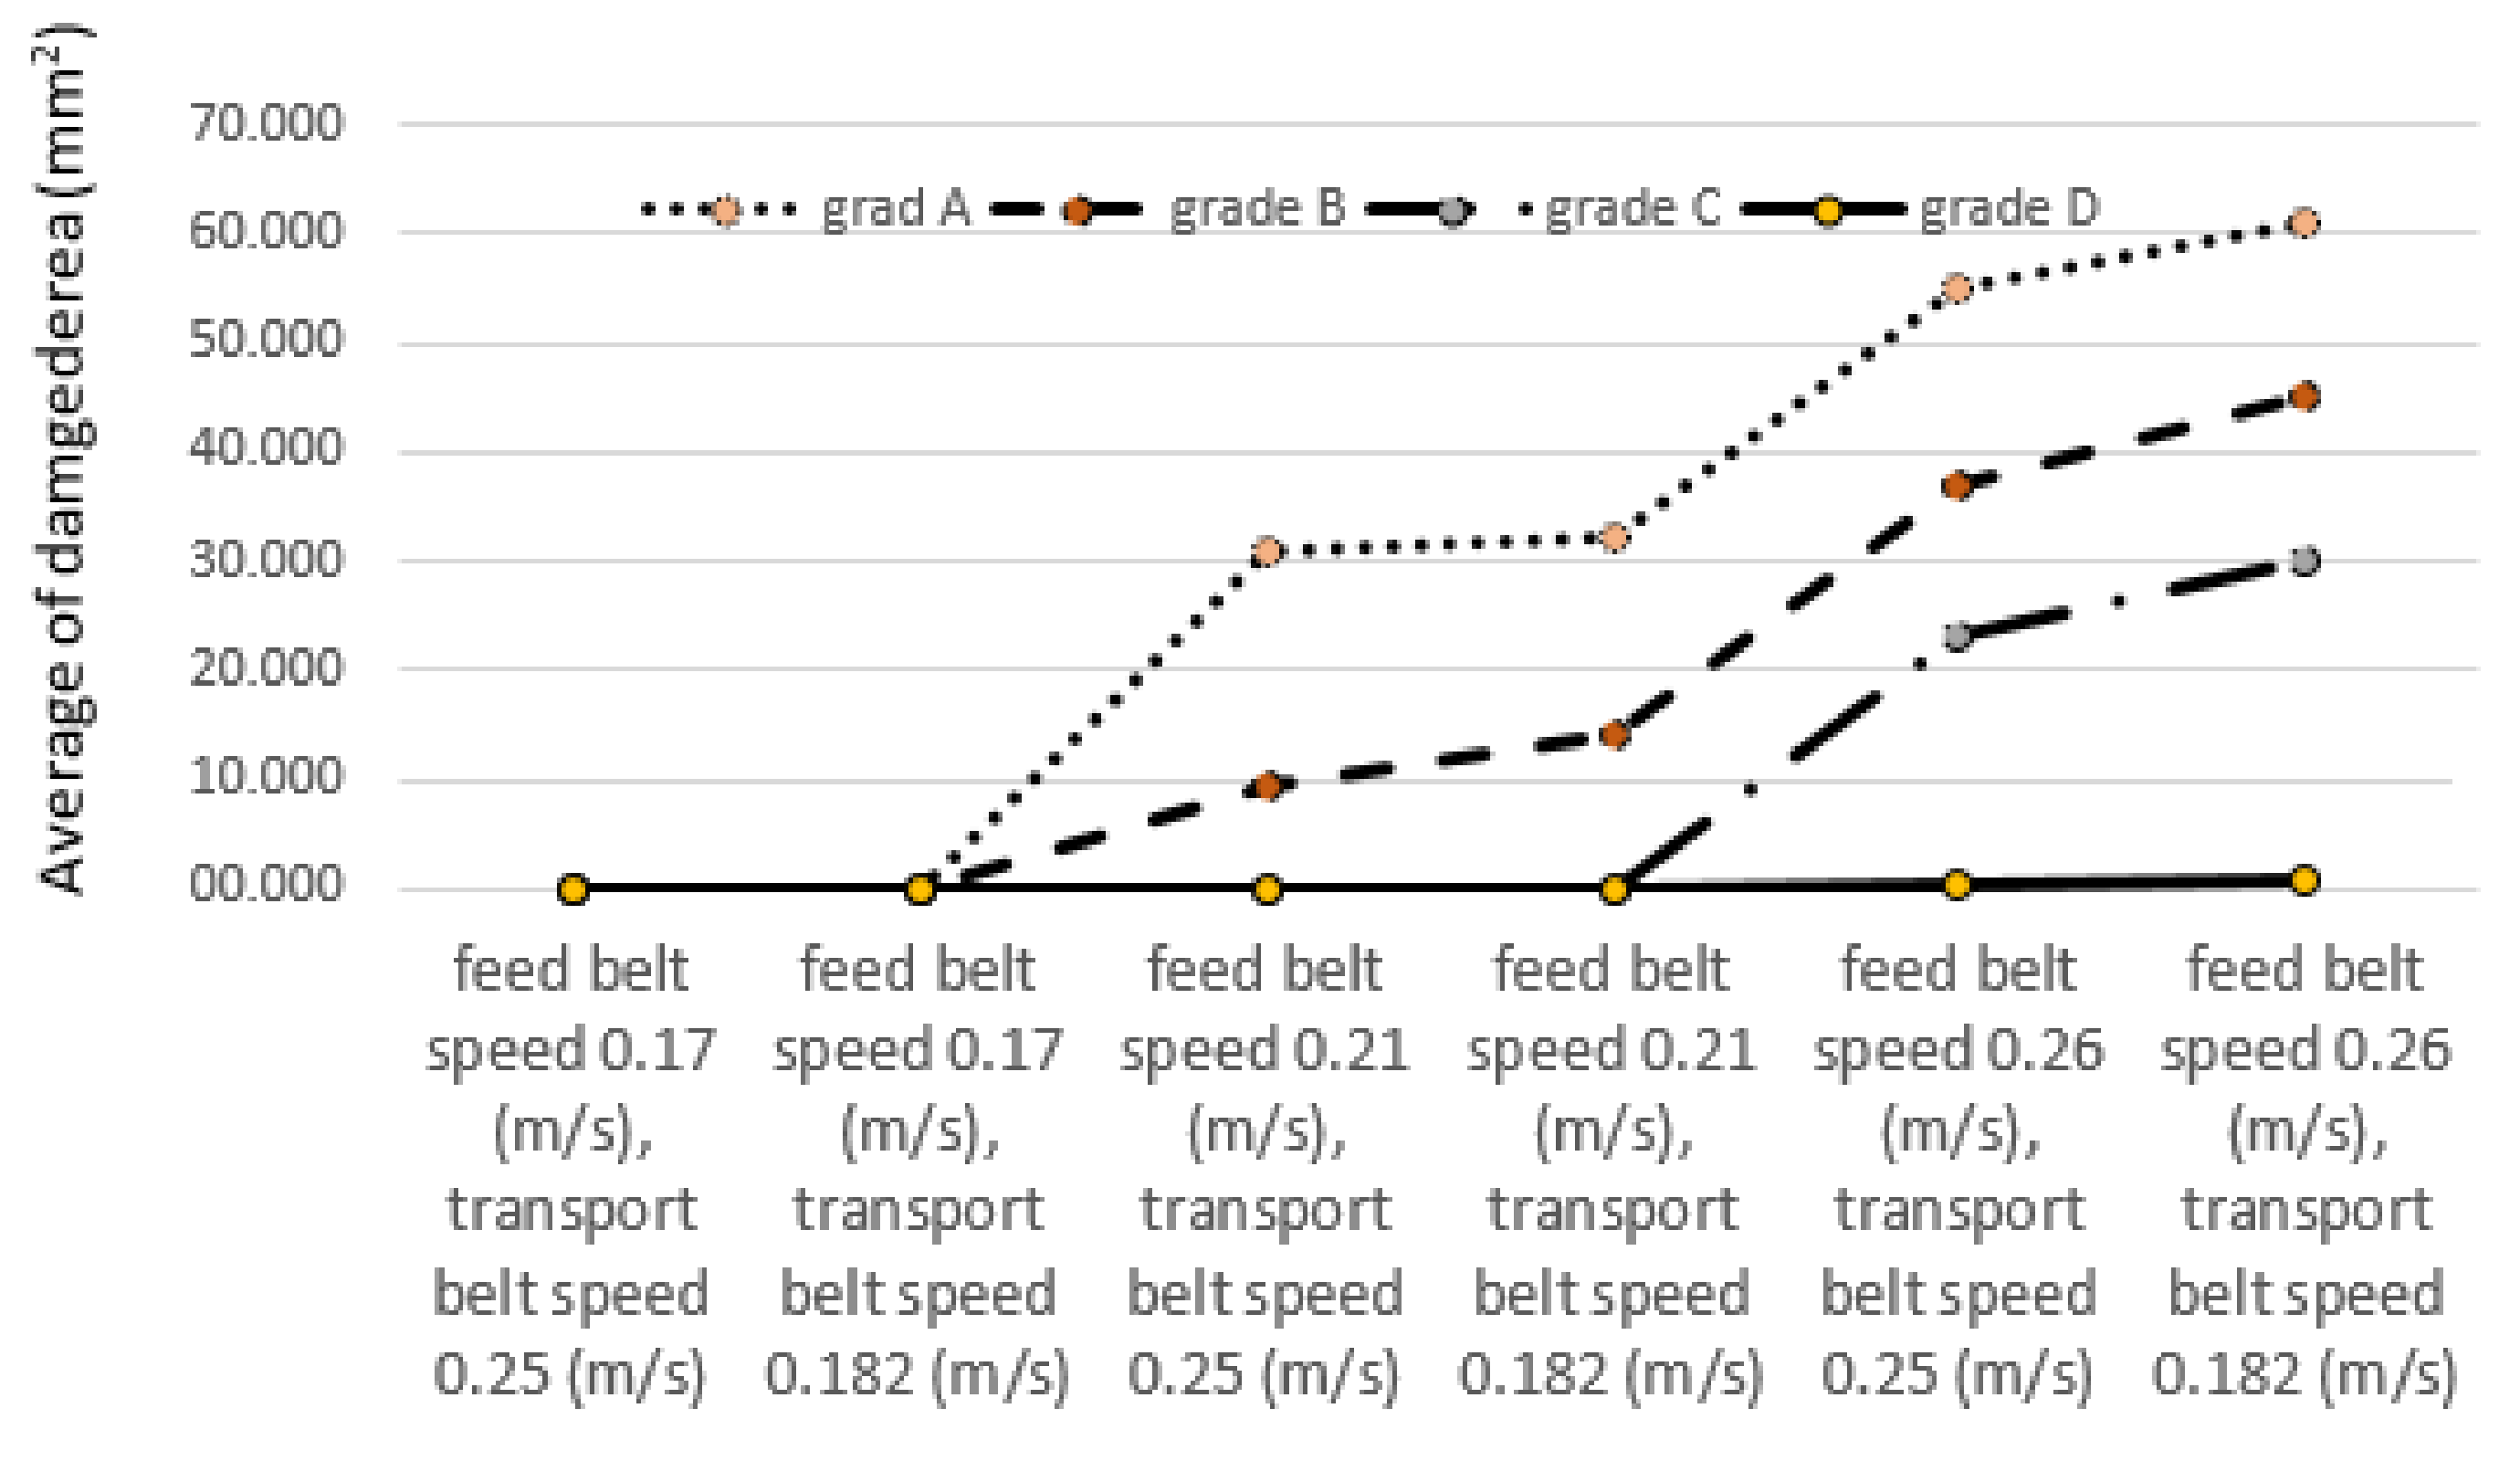
The results of the investigation on the effects of the different treatments on the damage of both apple varieties are very similar, and they show that the rate of damage in the samples at the lowest feeding belt and transport belt speeds is almost zero. However, as shown for Golden Delicious in
Figure 4, the damages increase when the speed increases, as well as the size (grade) of apples.
8. Conclusions
The tests performed on the prototype of the sorting machine show that in increasing the feeding belt speed and decreasing the transport belt speed, the efficiency of sorting of both apple varieties declined. For all products (i.e., orange and apples) the purity index decreases, and the error index increases when the feeding belt speed increase, and vice versa. The results from the study confirm that the belts speed is the most critical factor that affects machine performance, confirming results from previous studies [
11,
12,
17]. Furthermore, the feeding belt speed effect on the indexes adopted for this study decreases when the spherical coefficient increases.
According to results of the tests, generally, the best performance of the prototype of the sorter is achieved at the minimum feed belt speed (0.17 m/s) and maximum transport belt speed (0.25 m/s). The best sorting efficiency of the prototype of the sorting machine in the conditions above is 95.28%, 92.48%, and 94.28% for the Golden Delicious, Red Delicious apple, and orange, respectively. The capacity is about 1 ton/h; it is an acceptable value, and comparable to those reported in other studies [
11,
12,
17] on similar machines.
The study shows that the least damage is achieved with the lowest feed belt speed and maximum transport belt speed and that when the feeding belt speed increases, damages increase remarkably.
In conclusion, we can state that the prototype of the low-cost mechanical sorter can be used for all types of spherical products with acceptable efficiency and damage. According to Rasekhi and Raoufat [
25], the machine vision and the artificial neural network techniques have dramatically increased the speed and accuracy of fruit sorting. The costs of such machines have acceptable costs, but they require highly specialized maintenance service that is not always available in all countries and regions; for this reason, mechanical sorters are still competitive and adopted in many circumstances. Thus, the prototype of the tested machine can have room for future development and application.
Author Contributions
Conceptualization, Vahid Farzand Ahmadi and Pourya Bazyar.; Methodology Vahid Farzand Ahmadi; Software, Peyman Ziyaee; Validation, Vahid Farzand Ahmadi, Peyman Ziyaee, and Pourya Bazyar; Formal Analysis, Vahid Farzand Ahmadi; Investigation, Vahid Farzand Ahmadi, Peyman Ziyaee and Pourya Bazyar; Resources, Pourya Bazyar.; Data Curation, Vahid Farzand Ahmadi; Writing—Original Draft Preparation, Vahid Farzand Ahmadi.; Writing—Review & Editing, Eugenio Cavallo; Supervision, Pourya Bazyar.; Project Administration, Pourya Bazyar. All authors have read and agreed to the published version of the manuscript.
Funding
This research received no external funding.
Conflicts of Interest
The authors declare no conflict of interest.
References
- Bazyar, P.; Jafari, A.; Alimardani, R.; Mohammadi, V. Small-scale head of combine for harvesting sesame. EJPAU 2019, 22. [Google Scholar] [CrossRef]
- Sheydayi, E.; Bazyar, P. A Review of the applications of non-visible X-ray imaging and infrared spectroscopy in the non-destructive evaluation of pomegranate quality. 11th National Congress of Biosystem and Mechanization Engineering in Iran, University of Bu Ali Sina, Hamadan, Iran, 7 September 2018. [Google Scholar] [CrossRef]
- USDA. Fresh apple, grape and pears: World markets trade. United State Department of Agriculture, Foreign Agricultural Service. December 2019. Available online: https://www.fas.usda.gov/data/fresh-apples-grapes-and-pears-world-markets-and-trade (accessed on 28 October 2020).
- USDA. Citrus: World markets and trade. United State Department of Agriculture, Foreign Agricultural Service. July 2020 report. Available online: https://www.fas.usda.gov/data/citrus-world-markets-and-trade (accessed on 28 October 2020).
- Londhe, D.H.; Nalawade, S.M.; Pawar, G.S.; Atkari, V.T.; Wandkar, S.V. Grader: A review of different methods of grading for fruits and vegetables. Agric. Eng. Int. CIGR J. 2013, 15, 217–230. [Google Scholar]
- Wunderlich, L.; Klonsky, K.M.; DeMoura, R.L. Sample Costs to Establish and Produce Apples: Fuji Variety. Cost and Return Study Report AP-IR-07. University of California Cooperative Extension, University of California. 2007. Available online: http://cecentralsierra.ucanr.edu/files/60510.pdf (accessed on 28 October 2020).
- Saravacos, G.; Kostaropoulos, A. Handbook of Food Processing Equipment, 2nd ed.; Springer International Publishing: Berlin/Heidelberg, Germany, 2016. [Google Scholar]
- Lu, R.; Pothula, A.K.; Mizushima, A.; van Dyke, M.; Zhang, Z. System for sorting fruit. U.S. Patent No. 9,919,345, 2018. [Google Scholar]
- Mostafa, H.M.; Bahnasawy, A.H. Development of affordable machine for sizing Egyptian onion. Agric. Eng. Int. CIGR J. 2009, 11, 1–10. [Google Scholar]
- Kermani, A.M.; Koravand, S.H. Design, built, and evaluation of hotel sorter machine. Iran Biosyst. Eng. J. 2017, 2, 375–381. [Google Scholar]
- Treeamnuk, K.; Pathhaeerat, S.; Terdowongworakul, A.; Bupata, C. Design of machine to size java apple fruit with minimal damage. Biosyst. Eng. 2010, 107, 140–148. [Google Scholar] [CrossRef]
- Tabatabaekloor, R.; Hashemi, J. Development and evaluation of citrus sorting machine with a rotary semi-conical disc. J. Agric. Mach. Sci. 2008, 4, 371–374. [Google Scholar]
- Kheiralipour, K.; Tabatabaeefar, A.; Mobli, H.; Rafiee, S.; Sahraroo, A.; Rajabipour, A.; Jafari, A. Some physical properties of apple. Pak. J. Nutr. 2008, 7, 667–672. [Google Scholar] [CrossRef] [Green Version]
- Anonymous. United States Standards for Grades of Apples, United States Department of Agriculture. In Agriculture Marketing Service 2002. Available online: https://www.ams.usda.gov/grades-standards/apple-grades-standards (accessed on 31 October 2019).
- Anonymous. Citrus California and Arizona Shipping Point and Market Inspection Instruction; United States Department of Agriculture (USDA), 2005. Available online: https://www.ams.usda.gov/sites/default/files/media/Citrus_CA_and_AZ_Inspection_Instructions%5B1%5D.pdf (accessed on 28 October 2020).
- Mohsenin, N.N. Physical Properties of Plant and Animal Materials; Gordon and Breach: New York, NY, USA, 1986. [Google Scholar]
- Jarimpos, B.; Toomsaentong, S.; Inparasit, C. Design and testing of a mangosteen fruit sizing machine. J. Food Eng. 2007, 79, 745–751. [Google Scholar] [CrossRef]
- Sharifi, M.; Rafiee, S.; Keyhani, A.; Jafari, A.; Mobli, H.; Rajabipour, A.; Akram, A. Some physical properties of orange. Int. Agrophysics 2007, 21, 391–397. [Google Scholar]
- Grandison, A.S.; Lewis, M.J. Separation Processes in the Food and Biotechnology Industries; Technomic: Lancaster, UK, 1996. [Google Scholar]
- Paine, F.A. The Packaging User’s Handbook; Blackie Academic and Professional: London, UK, 1996. [Google Scholar]
- Walas, S. Chemical Processing Equipment. Butterworths: London, UK, 1988. [Google Scholar]
- Baayen, R.H. A real experiment is a factorial experiment. Mental Lex. 2010, 5, 149–157. [Google Scholar] [CrossRef] [Green Version]
- Nieoczym, A.; Caban, J.; Marczuk, A.; Brumerčik, F. Construction design of apple sorter. BIO Web Conf. 2018, 10. Article #02025. [Google Scholar] [CrossRef] [Green Version]
- Markovic, D.; Mladenovic, N.; Simonovic, V.; Markovic, I.; Stevanovic, M.S. Fruit flow calculation on the rotating sizing machines. Tech. Gaz. 2014, 21, 645–650. [Google Scholar]
- Rasekhi, R.; Raoufat, M. Design, Development and Evaluation of an Orange Sorter Based on Machine Vision and Artificial Neural Network Techniques. Iran Agric. Res. 2015, 32, 21–38. [Google Scholar]
Figure 1.
Prototype of the sorter: (1) storage, (2) feed conveyor belt, (3) electromotor of feed conveyor, (4) inverter, (5) storage tank, (6) polyethene curtains, (7) sizing roller, (8) transport conveyor belt, (9) electromotor of transport conveyor.
Figure 1.
Prototype of the sorter: (1) storage, (2) feed conveyor belt, (3) electromotor of feed conveyor, (4) inverter, (5) storage tank, (6) polyethene curtains, (7) sizing roller, (8) transport conveyor belt, (9) electromotor of transport conveyor.
Figure 2.
Schematic diagram of belt-and-roller sorting machine.
Figure 2.
Schematic diagram of belt-and-roller sorting machine.
Figure 3.
Example of the computation of damaged areas.
Figure 3.
Example of the computation of damaged areas.
Figure 4.
Average damage surface (mm2) on Golden Delicious in function of the feeding belt and transport belt speeds and fruit size grades (A > 80 mm, 70 < B ≤ 80 m, 60 < C ≤ 70 mm and D ≤ 60 mm).
Figure 4.
Average damage surface (mm2) on Golden Delicious in function of the feeding belt and transport belt speeds and fruit size grades (A > 80 mm, 70 < B ≤ 80 m, 60 < C ≤ 70 mm and D ≤ 60 mm).
Table 1.
Linear speeds of conveyor belt feeding unit.
Table 1.
Linear speeds of conveyor belt feeding unit.
| Output Revolution per Minute from Gearbox (rpm) | Ratio of Pulleys | Revolution of Rollers (rpm) | Linear Speed of Belt (m/s) |
|---|
| 67.5 | 6.12 | 33.75 | 0.17 |
| 6.10 | 40.5 | 0.21 |
| 6.8 | 50.6 | 0.26 |
Table 2.
Results of the factorial ANOVA for Golden Delicious.
Table 2.
Results of the factorial ANOVA for Golden Delicious.
| Source | Df | Mean Square |
|---|
| Efficiency (%) | Sorting Error (%) | Purity Index (%) | Error Index (%) |
|---|
| Block | 2 | 0.00 ns | 0.001 ns | 12.198 ns | 12.198 ns |
| Feeding belt speed | 2 | 0.01 ** | 0.009 ** | 25.800 ** | 25.800 ** |
| Transport belt speed | 1 | 0.001 ns | 0.00 ns | 142.03 ** | 142.03 ** |
| Feeding belt speed × transport belt speed | 2 | 0.006 ** | 0.006 ** | 13.918 ** | 13.198 ** |
| Test error | 10 | 0.001 ns | 0.001 ns | 0.392 ns | 0.392 ns |
Table 3.
Results of Duncan’s multiple range test for the mean comparisons of feeding belt speed on efficiency, sorting error, purity index, and error index for a transport belt speed of 0.182 m/s (Golden Delicious).
Table 3.
Results of Duncan’s multiple range test for the mean comparisons of feeding belt speed on efficiency, sorting error, purity index, and error index for a transport belt speed of 0.182 m/s (Golden Delicious).
| Feeding Belt Speed (m/s) | Mean |
|---|
| Efficiency (%) | Sorting error (%) | Purity Index (%) | Error Index (%) |
|---|
| 0.17 | 92.48 a | 7.62 a | 92.33 a | 7.67 a |
| 0.21 | 87.83 ab | 12.17 ab | 87.83 ab | 12.17 ab |
| 0.26 | 84.41 b | 15.59 b | 84.41 b | 15.59 b |
Table 4.
Results of factorial ANOVA for Red Delicious variety.
Table 4.
Results of factorial ANOVA for Red Delicious variety.
| Source | df | Mean Square |
|---|
| Efficiency (%) | Sorting Error (%) | Purity Index (%) | Error Index (%) |
|---|
| Block | 2 | 0.001 ns | 0.001 ns | 12.872 ns | 13.041 ns |
| Feeding belt speed | 2 | 0.008 ** | 0.008 ** | 78.022 ** | 18.809 ** |
| Transport belt speed | 1 | 0.00 ns | 0.00 ns | 19.014 ns | 19.014 ns |
| Feeding belt speed × transport belt speed | 2 | 0.001 ns | 0.001 ns | 8.709 ns | 8.684 ns |
| Test error | 10 | 0.001 ns | 0.001 ns | 8.709 ns | 8.684 ns |
Table 5.
Results of Duncan’s multiple range test for mean comparisons of the feeding belt speed on efficiency, sorting error, purity index, and error index for a transport belt speed of 0.182 m/s (Red delicious).
Table 5.
Results of Duncan’s multiple range test for mean comparisons of the feeding belt speed on efficiency, sorting error, purity index, and error index for a transport belt speed of 0.182 m/s (Red delicious).
| Mean |
|---|
| Feeding Belt Speed (m/s) | Efficiency (%) | Sorting Error (%) | Purity Index (%) | Error Index (%) |
|---|
| 0.17 | 93.245 a | 6.755 a | 91.33 a | 8.67 a |
| 0.21 | 88.35 ab | 11.65 ab | 88.45 ab | 11.55 ab |
| 0.26 | 83.87 b | 16.13 b | 84.17 b | 15.82 b |
Table 6.
Results of the factorial ANOVA for orange (Thompson navel).
Table 6.
Results of the factorial ANOVA for orange (Thompson navel).
| Source | df | Mean Square |
|---|
| Efficiency (%) | Sorting Error (%) | Purity Index (%) | Error Index (%) |
|---|
| Block | 2 | 0.005 ns | 0.005 ns | 19.772 ns | 39.722 ns |
| Feeding belt speed | 2 | 0.008 ns | 0.008 ns | 35.18 ** | 34.35 ** |
| Transport belt speed | 1 | 0.00 ns | 0.00 ns | 0.014 ns | 5.014 ns |
| Feeding belt speed × transport belt speed | 2 | 0.026 ** | 0.025 ** | 1.091 ns | 3.841 ns |
| Test error | 10 | 0.002 ns | 0.002 ns | 10.778 ns | 20.588 ns |
Table 7.
Results of Duncan’s multiple range test for mean comparisons of feeding belt speed on purity index and error index for a transport belt speed of 0.182 m/s (Thompson navel).
Table 7.
Results of Duncan’s multiple range test for mean comparisons of feeding belt speed on purity index and error index for a transport belt speed of 0.182 m/s (Thompson navel).
| Feeding Belt Speed (m/s) | Mean |
|---|
| Purity Index (%) | Error Index (%) |
|---|
| 0.17 | 95.18 a | 4.817 a |
| 0.21 | 87.00 ab | 13.00 ab |
| 0.26 | 80.07 b | 19.93 b |
| Publisher’s Note: MDPI stays neutral with regard to jurisdictional claims in published maps and institutional affiliations. |
© 2020 by the authors. Licensee MDPI, Basel, Switzerland. This article is an open access article distributed under the terms and conditions of the Creative Commons Attribution (CC BY) license (http://creativecommons.org/licenses/by/4.0/).


