


Optimization of Black Tea Drying Temperature in an Endless Chain Pressure (ECP) Dryer

1
Department of Export Agriculture, Faculty of Animal Science and Export Agriculture, Uva Wellassa University, Badulla 90000, Sri Lanka
2
Environmental Sciences, School of Agriculture & Environment, Massey University, Palmerston North 4442, New Zealand
3
Department of Agronomy, Faculty of Agriculture, University of Jaffna, Ariviyal Nagar, Kilinochchi 44000, Sri Lanka
*
Authors to whom correspondence should be addressed.
AgriEngineering 2023, 5(4), 1989-1999; https://0-doi-org.brum.beds.ac.uk/10.3390/agriengineering5040122
Submission received: 1 September 2023
/
Revised: 2 October 2023
/
Accepted: 24 October 2023
/
Published: 1 November 2023
(This article belongs to the Topic Emerging Agricultural Engineering Sciences, Technologies, and Applications)
Abstract
:Drying is a crucial and energy-consuming process in black tea manufacturing that is aimed at reducing moisture content and terminating enzymatic reactions in tea leaves. In Sri Lanka, an endless chain pressure (ECP) dryer is commonly used for drying, but it consumes a significant amount of energy, necessitating the optimization of drying conditions. The current drying temperature at the Houpe tea factory in Ratnapura, Sri Lanka is 121 °C (250 °F), and it has not been optimized for a considerable period. As a result, energy consumption and wastage are high, leading to an inferior quality of black tea. To optimize factory conditions, tea leaves were dried under different temperatures: 115 (T1), 118 (T2), 121 (T3), 124 (T4), and 127 (T5) °C. Energy consumption, energy wastage, and specific energy consumption (SEC) for tea drying were calculated. Additionally, chemical and sensory analyses of samples of made tea were performed. SEC and energy wastage were significantly (p < 0.05) lower for treatments T1 and T2 than for other treatments. The theaflavin and thearubigin contents were significantly (p < 0.05) higher while total phenolic content was moderate for treatment T2. The sensory parameters of T2 outperformed other treatments. Based on these results, the optimum drying temperature for the ECP dryer was determined to be 118 °C and this temperature has been recommended for this factory.
1. Introduction
The tea industry plays a vital role in Sri Lanka’s economy, contributing significantly to foreign exchange earnings and domestic employment [1]. Tea represents a significant portion of Sri Lanka’s agricultural revenue, contributing approximately 65% to the sector. It also plays a crucial role in the country’s export revenue, accounting for around 13.5% [2]. Moreover, tea contributed approximately 2% of Sri Lanka’s gross domestic product (GDP) in 2021, at over USD 1.3 billion. The tea is mainly grown in the central hills of the island and its southern foothills, with varying qualities from different elevations [3]. According to Basnayake, et al. [4], smallholders contribute to 60% of tea production, while the estate sector contributes to the rest. The country currently produces three main types of tea, namely, Ceylon black tea, Ceylon green tea, and Ceylon white tea, with higher production of orthodox black tea [5].
Drying is a unit operation in tea manufacturing that follows withering and rolling. This process aims to reduce the moisture content of the tea leaves below 7% to extend their shelf life. Furthermore, drying is an essential step to arrest enzymatic reactions in tea leaves to obtain the desired taste and color in the made tea. The method of drying and the drying temperature and drying time have a significant influence on the chemical composition and organoleptic properties of tea [6]. The under- or over-drying of tea leaves minimizes the sensory properties of the made tea. Under-dried tea increases in astringency, which creates a dry and puckering mouthfeel when consuming the tea. Furthermore, under-dried tea cannot be stored for an extended period due to its high moisture content, which promotes microbial growth, whereas over-dried tea has a brittle texture and yields an unpleasant aroma, high bitterness, and low brewing ability. Therefore, optimum drying conditions are essential to produce high-quality tea and to obtain a high auction price.
Endless chain pressure (ECP) dryers and fluidized bed dryers are commonly used to dry tea leaves at the industrial scale [7]. Meanwhile, infrared drying, microwave drying, solar drying, air–radio frequencies, etc., have been tested to produce better-quality tea in terms of volatile and flavor compounds [6,7]. However, these drying methods are still under development and are not widely used for industrial applications. In the ECP dryer, an endless chain conveyor system is used to transport the tea leaves from top to bottom while the hot air is sent through a blower from bottom to top. This design creates a temperature gradient within the tea dryer, with higher temperatures at the bottom and lower temperatures at the top. Therefore, the low-moisture tea leaves come into contact with high-temperature air, whereas high-moisture tea leaves meet low-temperature air. As a result, tea leaves with low moisture content encounter the hotter air, facilitating the removal of tightly bound moisture and preventing case hardening, where the outer layer of tea particles becomes excessively dry while the inner portion retains higher moisture levels.
Tea manufacturing is an energy-intensive process because major processes such as the withering, rolling, and drying stages consume a substantial portion of energy. The energy consumption associated with these processes corresponds to 48.9%, 21.3%, and 7.4% of the total energy consumption in tea manufacturing, respectively [8]. It has been reported that the drying process consumes around 3.5–6 kWh of thermal energy per kg of made tea [7].
In Sri Lanka, endless chain pressure (ECP) dryers and fluidized bed dryers (FBD) are predominantly used for black tea manufacturing. The high energy consumption observed in the drying process can be attributed to various factors, including the utilization of outdated dryers, inadequate maintenance practices, suboptimal drying conditions, and manual operational adjustments. These factors collectively contribute to the inefficient use of energy during the drying process. The performance of these dryers declines over time; thus, periodical optimization of the processing parameters is essential. The optimization of energy use would also help to reduce the carbon emissions of the tea sector from its current level of 2.49 kg of CO2 per kg of tea produced in Sri Lanka, thus mitigating global warming and climate change [7].
To this end, the ECP dryer at Houpe tea factory in Ratnapura, Sri Lanka has experienced a decline in performance for about a one-month period, as indicated by several observable factors. These include the production of low-quality tea, increased energy consumption during the drying process, a higher percentage of energy wastage, and a noticeable decrease in the flavor of the dried tea. Additionally, there has been an increase in the proportion of low-grade tea being produced. Therefore, the management has requested immediate action to optimize the drying temperature, to ensure the quality of the made tea. Hence, this research was designed to optimize the drying temperature of the existing ECP dryer, with the objectives of increasing the quality of the made tea and reducing energy consumption.
2. Materials and Methods
2.1. The Experimental Setup of the ECP Dryer
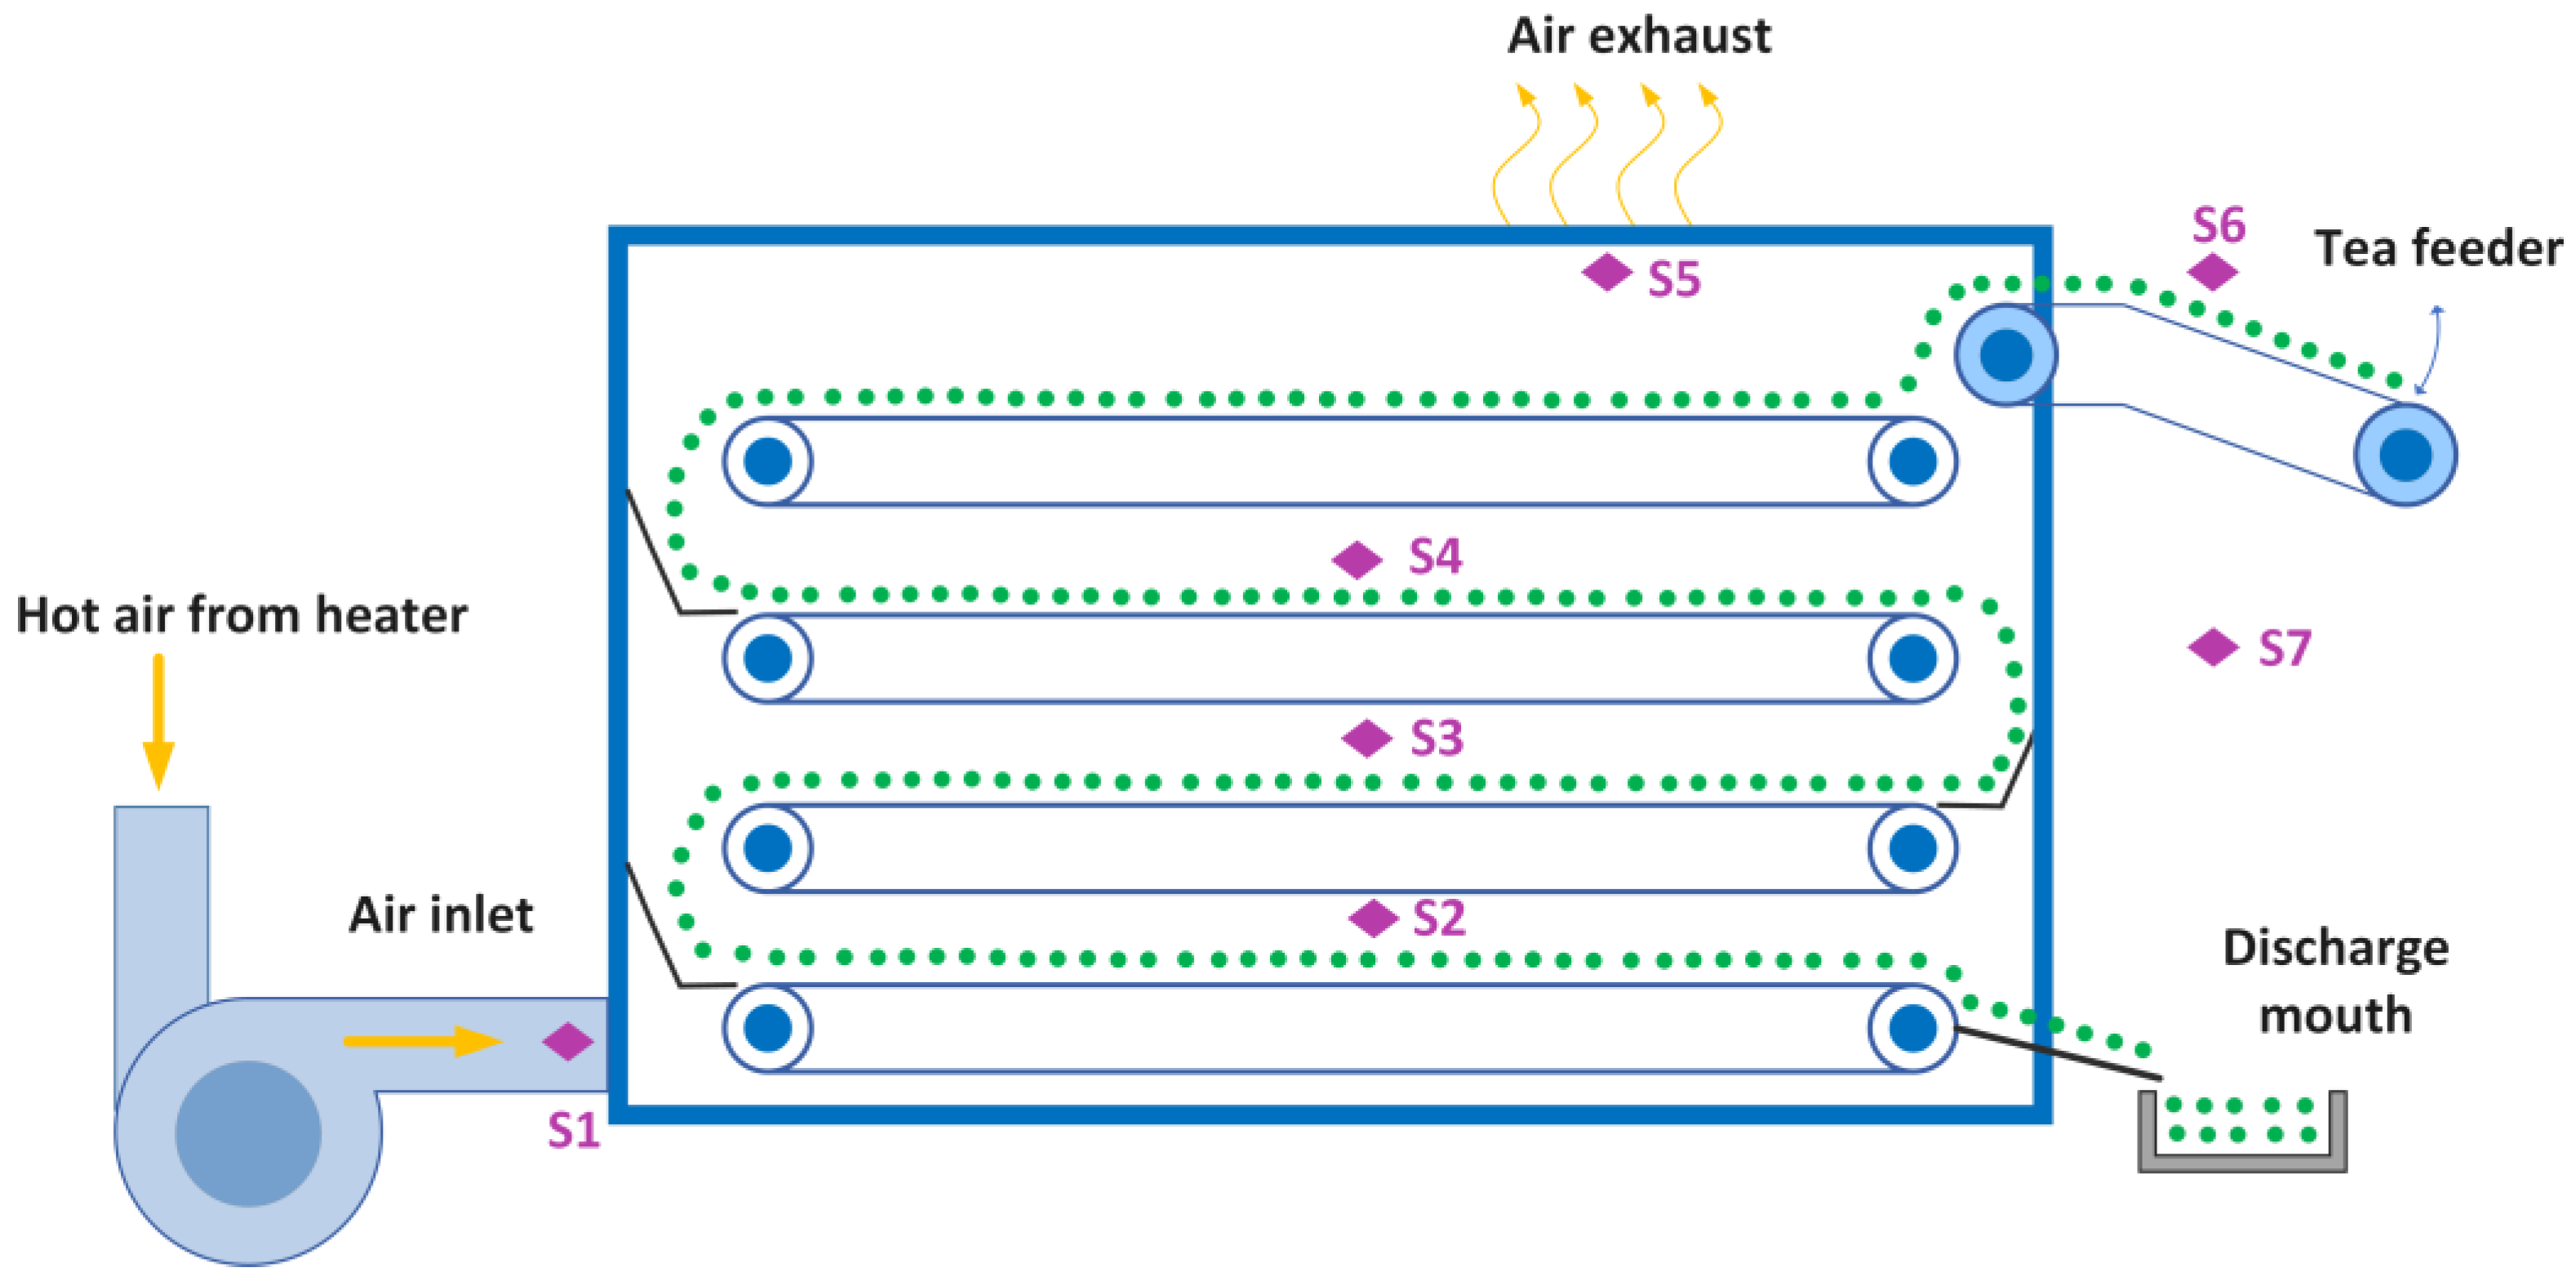
An old ECP dryer with a capacity of 200 kg h−1 was selected for this study. This ECP dryer consists of 4 perforated trays and the average drying time at the beginning of this research was 23 min. The hot air from the furnace is fed into the dryers using a blower. The air is then released from the dryer through the top vent. There are seven temperature sensors (DS18B20, Adafruit (New York, NY, USA)) mounted at different locations to measure the inlet hot air temperature, tea drying temperature, inlet tea temperature, and ambient air temperature (Figure 1). The specifications of this temperature sensor are a temperature range of −55 °C to +130 °C, with ±0.5 °C accuracy and a 5 V excitation voltage. In order to confirm the temperature readings from sensors S2–S4, monitoring the temperature of the tea leaves, the following special care was taken: a rubber piece was glued to the bottom part of the sensor to avoid direct contact with the perforated metal drying trays and the sensors were fully immersed into the tea leaves and fixed in a set position to prevent any movement. The sensor readings were recorded on a computer with the support of an Arduino microcontroller (Adafruit) at 1-minute intervals.
2.2. Drying Tea Leaves
The factory employs a drying temperature of 121 °C and, for the purposes of optimizing this temperature, temperatures were chosen that were two levels above and two levels below this temperature. In pursuit of this objective, the drying temperatures (i.e., treatments) selected were 115 °C (T1), 118 °C (T2), 121 °C (T3), 124 °C (T4), and 127 °C (T5). The corresponding drying temperatures in Fahrenheit were 240, 245, 250, 255, and 260 °F, respectively. To uphold the desired point temperature, adjustments were made to the feeding rate of firewood to the furnace and the position of the damper in the air inlet. Continuous monitoring of the inlet air temperature readings was carried out to facilitate the aforementioned operations. The ambient temperature during the experiment was 34.3 ± 1.2 °C and the relative humidity was 69.2 ± 3.4%. The airflow rate was 2.4 m3 s−1. For each temperature level, the experiment was repeated, and tea samples were collected. The collected samples were stored in a zip-lock bag at ambient conditions until used for analysis. The initial and final moisture contents of the tea leaves were measured using a moisture meter (MB27, OHAUS, NY, USA).
2.3. Energy Analysis
2.3.1. Energy Consumed by the Dryer
The energy of the hot air into the dryer and out of the dryer was calculated using Equations (1) and (2). To measure air velocity, anemometers were used. These were kept at 5 different points across the cross-sectional area of the air-feeding tube and the values were averaged.
Here, Hin and Hout are hot air energy into and out of the system (MJ), respectively, is the density of air (kg m−3), A is the cross-sectional area of the air inlet port (m2), VAir is the velocity of hot air (ms−1), CairTin and CairTout are the specific heat capacity (KJ kg−1 K−1) of hot air at Tin and Tout, respectively, Tin is the air inlet temperature (K), Tout is the air exhaust temperature (K), Tamb is the ambient air temperature (K), and DT is the drying time (s).
The energy consumed by the dryer (EDryer) was calculated using Equation (3).
2.3.2. Energy Consumed by Tea Leaves
The energy consumed by the tea leaves during the drying process was calculated using Equation (4). In this calculation, the average tea leaf temperature was established using the average values for temperature sensors S2–S4:
where ETea is the heat energy consumed by the tea (MJ), and MTea is the dry weight of fermented tea leaves (kg). CTea is the specific heat capacity of tea (KJ kg−1 K−1), and Ttea and Tamb are the temperatures (K) of tea leaves and ambient air, respectively. The specific heat capacity (CTea) of black tea is 3.57 kJ kg−1 K−1 [9].
2.3.3. Energy to Heat and Evaporate the Moisture
The energy used to heat water molecules from room temperature to the average drying temperature and to evaporate the moisture from the tea leaves was calculated using Equations (5) and (6), respectively:
where EH is the energy (MJ) used to heat the water molecules, mw is the weight (kg) of moisture in the tea leaves, Cw is the specific heat capacity of water (KJ kg−1 K−1), and Tw and Tamb are the temperature (K) of water molecules and ambient air, respectively. The temperature of the tea leaves is nearly equal to the temperature of the water in the tea leaves; therefore, it was assumed that the tea temperature is equal to the temperature of the water:
where Ee is the energy (MJ) used to evaporate the water molecules, mw is the weight (kg) of moisture in the tea leaves and L is the latent heat of water evaporation (kJ kg−1).
2.3.4. Specific Energy Consumption
The specific energy consumption (SEC) represents the energy needed to dry 1 kilogram of moisture from the tea leaves, and this was calculated using Equation (7).
2.3.5. Energy Wastage in Drying
The energy wastage of tea leaves drying was calculated using Equation (8).
2.4. Chemical Analysis of Dried Tea Leaves
2.4.1. Theaflavin (TF) and Thearubigin (TR) Content
The methodology outlined in the study by Abhiram et al. [10] was employed to measure the total TF and TR in tea infusions from triplicate samples. The ratio between TF and TR was then calculated.
2.4.2. Total Phenolic Content
The total phenolic content (TPC) of the dried tea leaf samples was measured using the Folin–Ciocalteu method, as described in [10]. Briefly, a 10% solution of Folin–Ciocalteu reagent was prepared, then 5 mL of this solution was mixed with 0.05 mL of tea infusion. After a few minutes, a saturated sodium carbonate solution (0.4 mL) was added and the mixture was incubated for 30 min. Similarly, a blank was prepared using water in place of the tea infusion. Then, the absorbance of the sample and blank was measured at 765 nm using a UV-Vis spectrophotometer (SHIMADZU, Kyoto, Japan). Gallic acid (0.1 g L−1) was used as the standard and the TPC was expressed as the gallic acid equivalent (g GAE) per liter of infusion.
2.5. Sensory Analysis
Sensory evaluation was performed by trained tea tasters. All tea samples were evaluated for the color, flavor, and aroma of the liquor, and the appearance and color of the dried tea were rated by the tasters.
2.6. Statistical Analysis
A one-way analysis of variance (ANOVA) was performed at a 5% significance level. The mean separation was performed with the Tukey honest significant difference (HSD) post hoc test at a 5% significance level. The values were presented as the mean ± standard deviation of triplicate samples. The sensory data were subjected to analysis using the Friedman test at a significance level of 5%. To construct the radar diagram for sensory parameters, the estimated median values were utilized. All statistical analyses were performed using Minitab 18 software (Minitab, LLC., State College, PA, USA).
3. Results and Discussion
3.1. Temperature Changes throughout the Drying Time
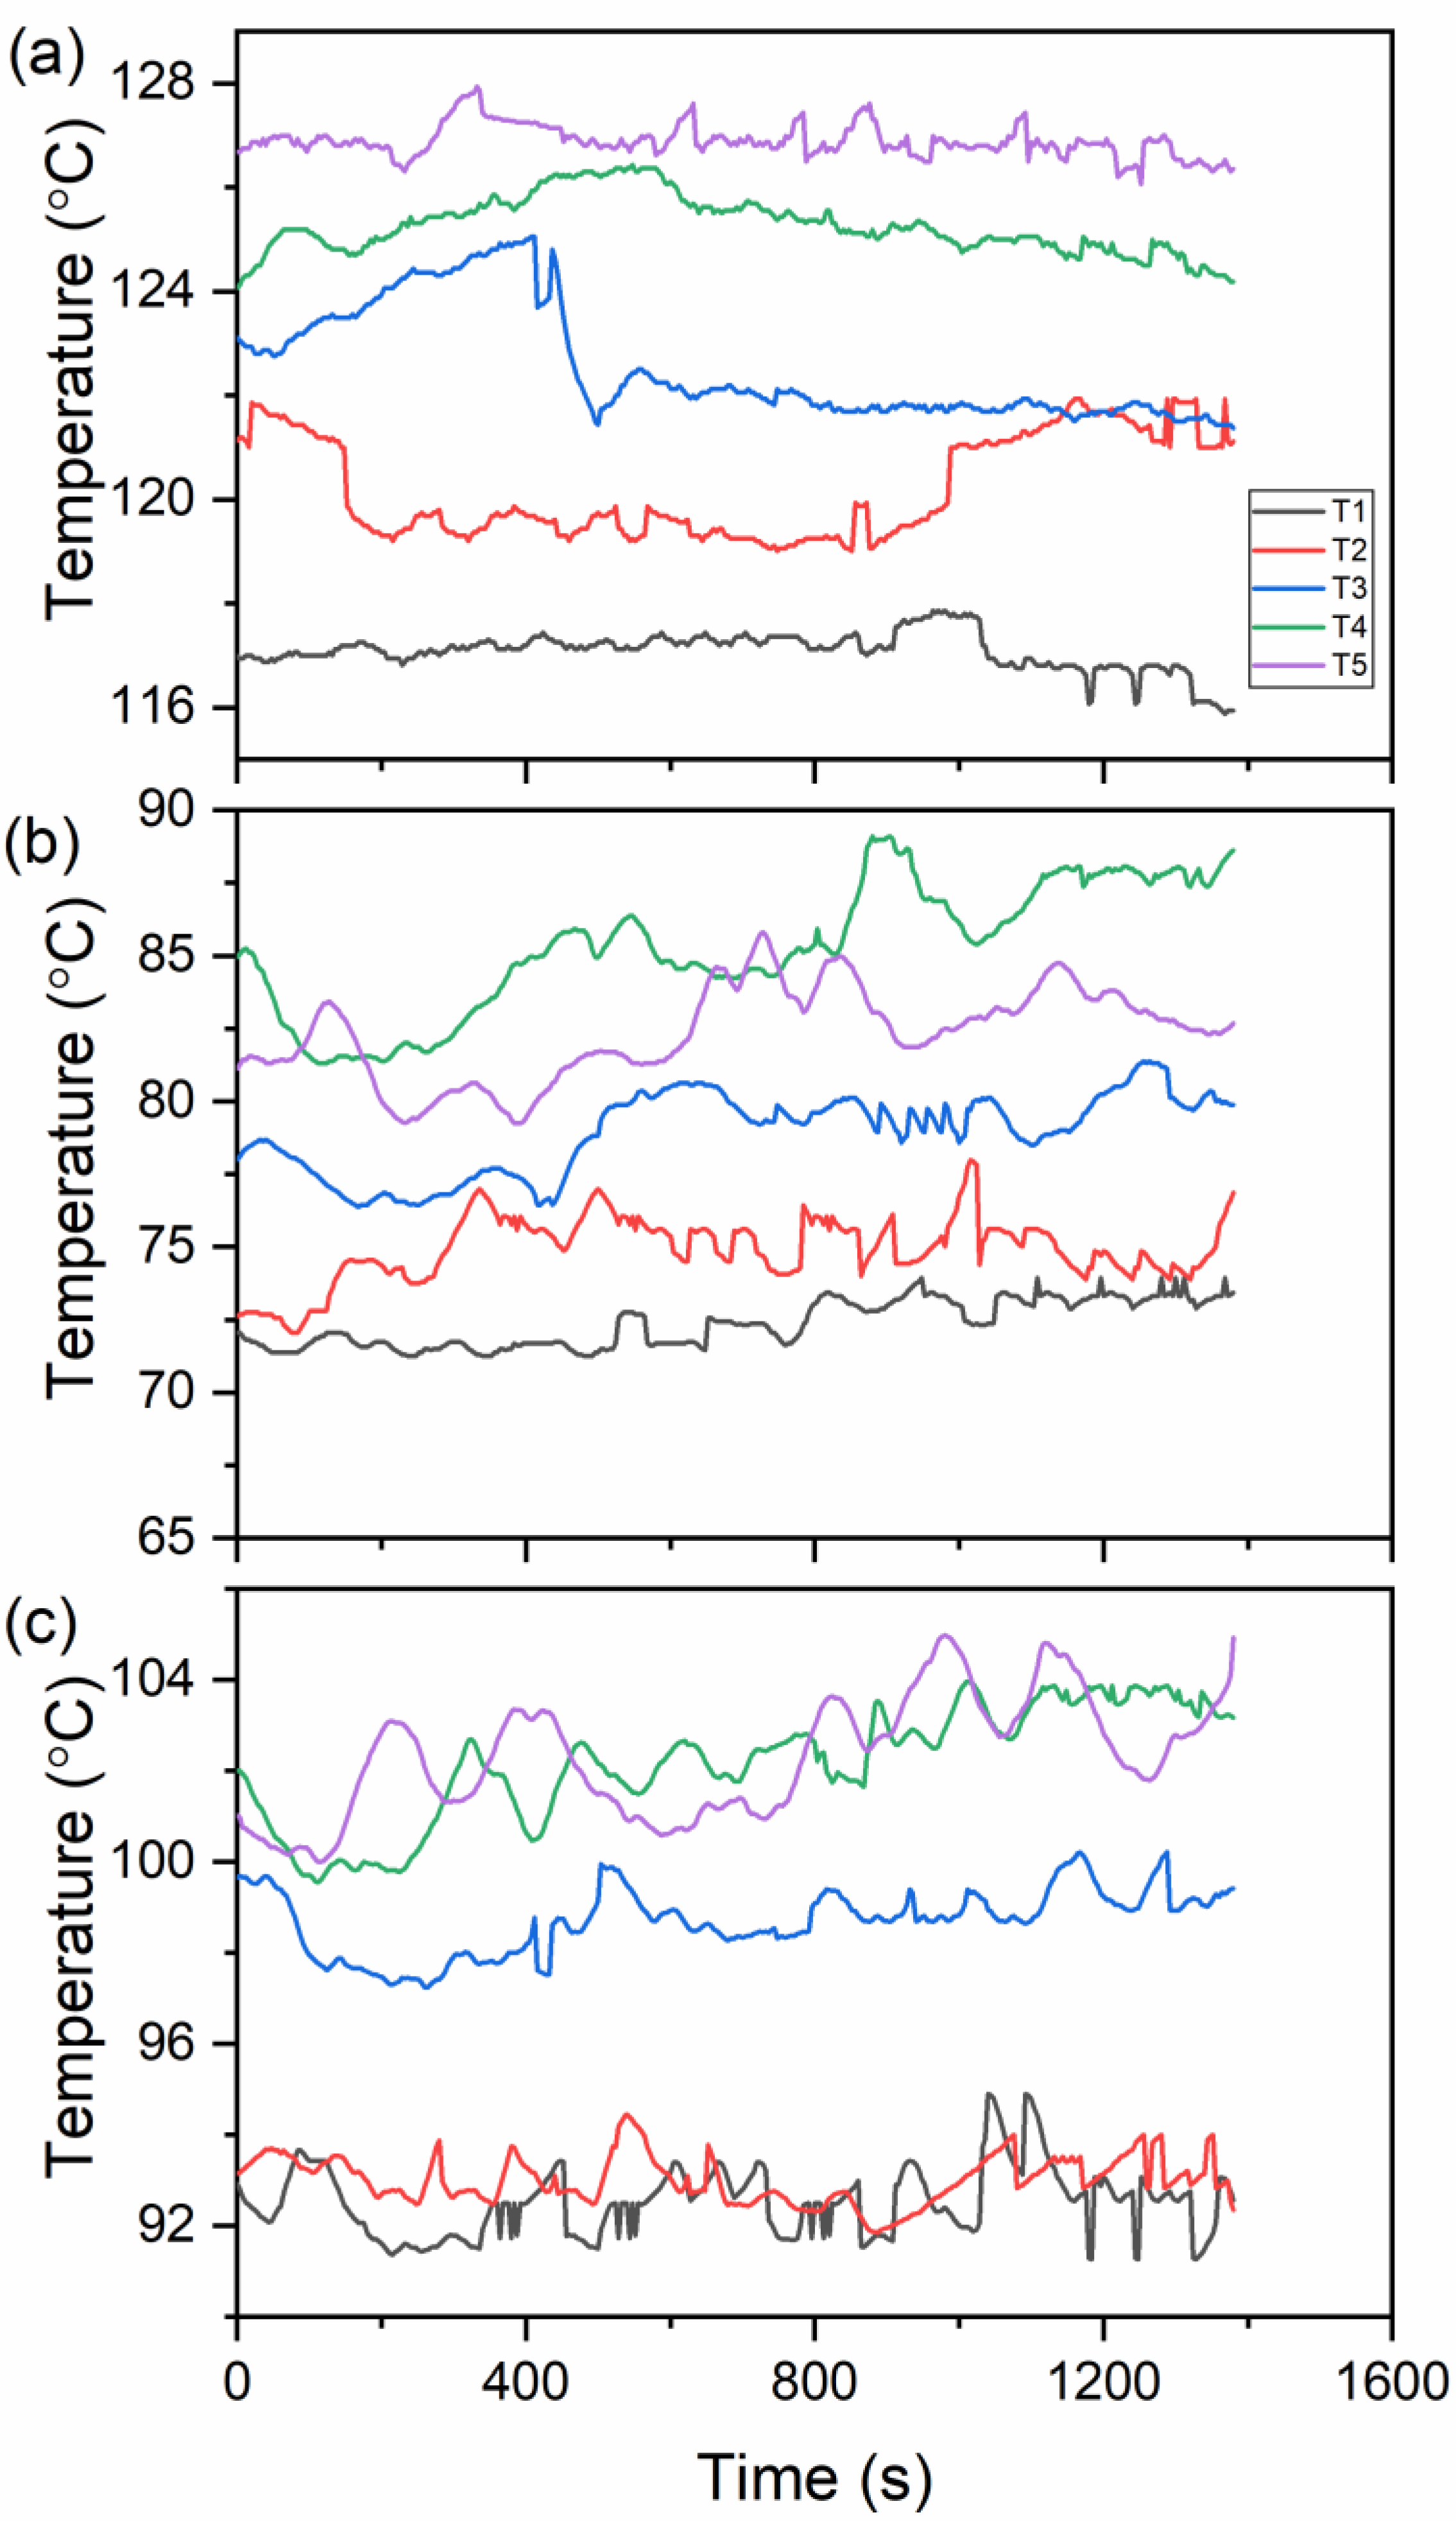
The temperature of hot air at the inlet, hot air at the exhaust, and average tea leaf temperatures are presented in Figure 2. The average hot air inlet temperatures were 115.1 ± 0.4, 118.2 ± 0.8, 121.5 ± 0.9, 124.3 ± 0.5 and 127.7 ± 0.5 °C for treatments T1, T2, T3, T4, and T5, respectively (Figure 2a). The highest variation was observed for T3, whereas the lowest variation was observed for T1. The hot air inlet temperatures for all treatments were successfully maintained within an acceptable range of ±1 °C. However, it should be noted that maintaining a consistent temperature was challenging in this experiment, due to the absence of automatic temperature controllers for the dryer. Hence, the wood stock feeding rate and hot air damper positions were adjusted to achieve the desired temperature level. These measures were undertaken to ensure that the required temperature was maintained throughout the drying process. Average hot air temperatures at exhaust were 74.9 ± 1.1, 74.7 ± 4.3, 78.9 ± 1.4, 85.3 ± 2.2, and 82.3 ± 1.6 °C for T1, T2, T3, T4, and T5, respectively (Figure 2b). The highest variation was observed for T4 and the lowest was found for the T1 treatment. The average tea leaf temperatures were 92.5 ± 0.75, 93.0 ± 0.5, 98.7 ± 0.7, 102.2 ± 1.2, and 102.3 ± 1.2 °C for T1, T2, T3, T4, and T5, respectively (Figure 2c). Moreover, the initial moisture content of the tea leaves was 32.5 ± 2.3%. The final moisture contents were 6.5 ± 0.2, 5.6 ± 0.1, 4.8 ± 0.2, 4.3 ± 0.1, and 3.5 ± 0.3 for treatments T1, T2, T3, T4, and T5, respectively.
3.2. Energy Analysis
3.2.1. Energy Consumed by Dryer
The energy consumed by the dryer (EDryer) was calculated using the difference between the energy of the hot air moving into and that out of the dryer. It was significantly (p < 0.05) higher for treatment T2 (126.47 MJ) compared to other treatments (Table 1). The EDryer value did not significantly differ for other treatments. This showed that during tea drying under treatment T2, a high level of energy was utilized for drying. This energy demand was 9–16% higher than for other treatments. Despite the drying temperature increase from treatment T1 to T5, the E-dryer value did not increase accordingly.
3.2.2. Energy Consumed by the Tea Leaves
The energy consumed by the tea leaves was within the range of 4.2–4.8 MJ (Table 1). Only a small portion of the energy that entered the dryer was consumed by the tea leaves, ranging from 1.7 to 1.9%. As the drying temperature increased, there was a corresponding increase in the energy absorbed by the tea leaves. The T4 and T5 treatments exhibited the highest energy absorption, while the lowest absorption was observed in treatments T1 and T2. Treatment T3 demonstrated an intermediate level of energy consumption.
3.2.3. Energy to Heat and Evaporate the Moisture
Energy used to heat the moisture in tea leaves from the atmospheric temperature to the average temperature of drying was referred to as energy to heat the moisture. Treatments T4 and T5 consumed significantly (p < 0.05) more energy than other treatments (Table 1). The corresponding energy consumptions were 1.58 and 1.61 MJ, respectively. Treatments T1 and T2 consumed significantly (p < 0.05) less energy among all treatments, the values for which were 1.27 and 1.31 MJ, respectively.
The energy required to evaporate moisture (Ee) refers to the energy that water molecules consume in order to undergo the process of evaporation. The Ee significantly (p < 0.05) and continuously increased with drying temperature (Table 1). Ee was within the range of 11.73 to 13.12 MJ. The lowest energy was recorded for treatment T1, whereas the highest was recorded for treatment T5.
3.2.4. Specific Energy Consumption
The specific energy consumption (SEC) showed a decreasing trend with increasing drying temperature (Table 1). Similar findings have been reported in previous studies on drying tea [11] and herbal leaves [10]. The SEC of treatment T1 was 48.24 MJ/kg of moisture, which was significantly higher (p < 0.05) compared to T3 and T5. The SEC of treatments T2 and T4 were not significant (p < 0.05) when compared with other treatments. The observed SEC values for tea drying in this study fall within the range reported by other researchers [12,13].
3.2.5. Energy Wastage
Energy wastage when drying tea leaves refers to the portion of energy that remains unabsorbed by the leaves, despite being introduced into the dryer. This unabsorbed energy is considered to be a waste of energy. This energy wastage was significantly (p < 0.05) higher for treatment T4 and T5, while it was significantly (p < 0.05) lower for T1 and T2 (Table 1). The higher the drying temperature, the greater the energy wastage. The high percentage of energy wastage can be attributed to the higher specific heat capacity of a biological substance, including tea leaves.
3.3. Chemical Analysis
3.3.1. Theaflavins (TF), Thearubigins (TR), and the TF:TR Ratio
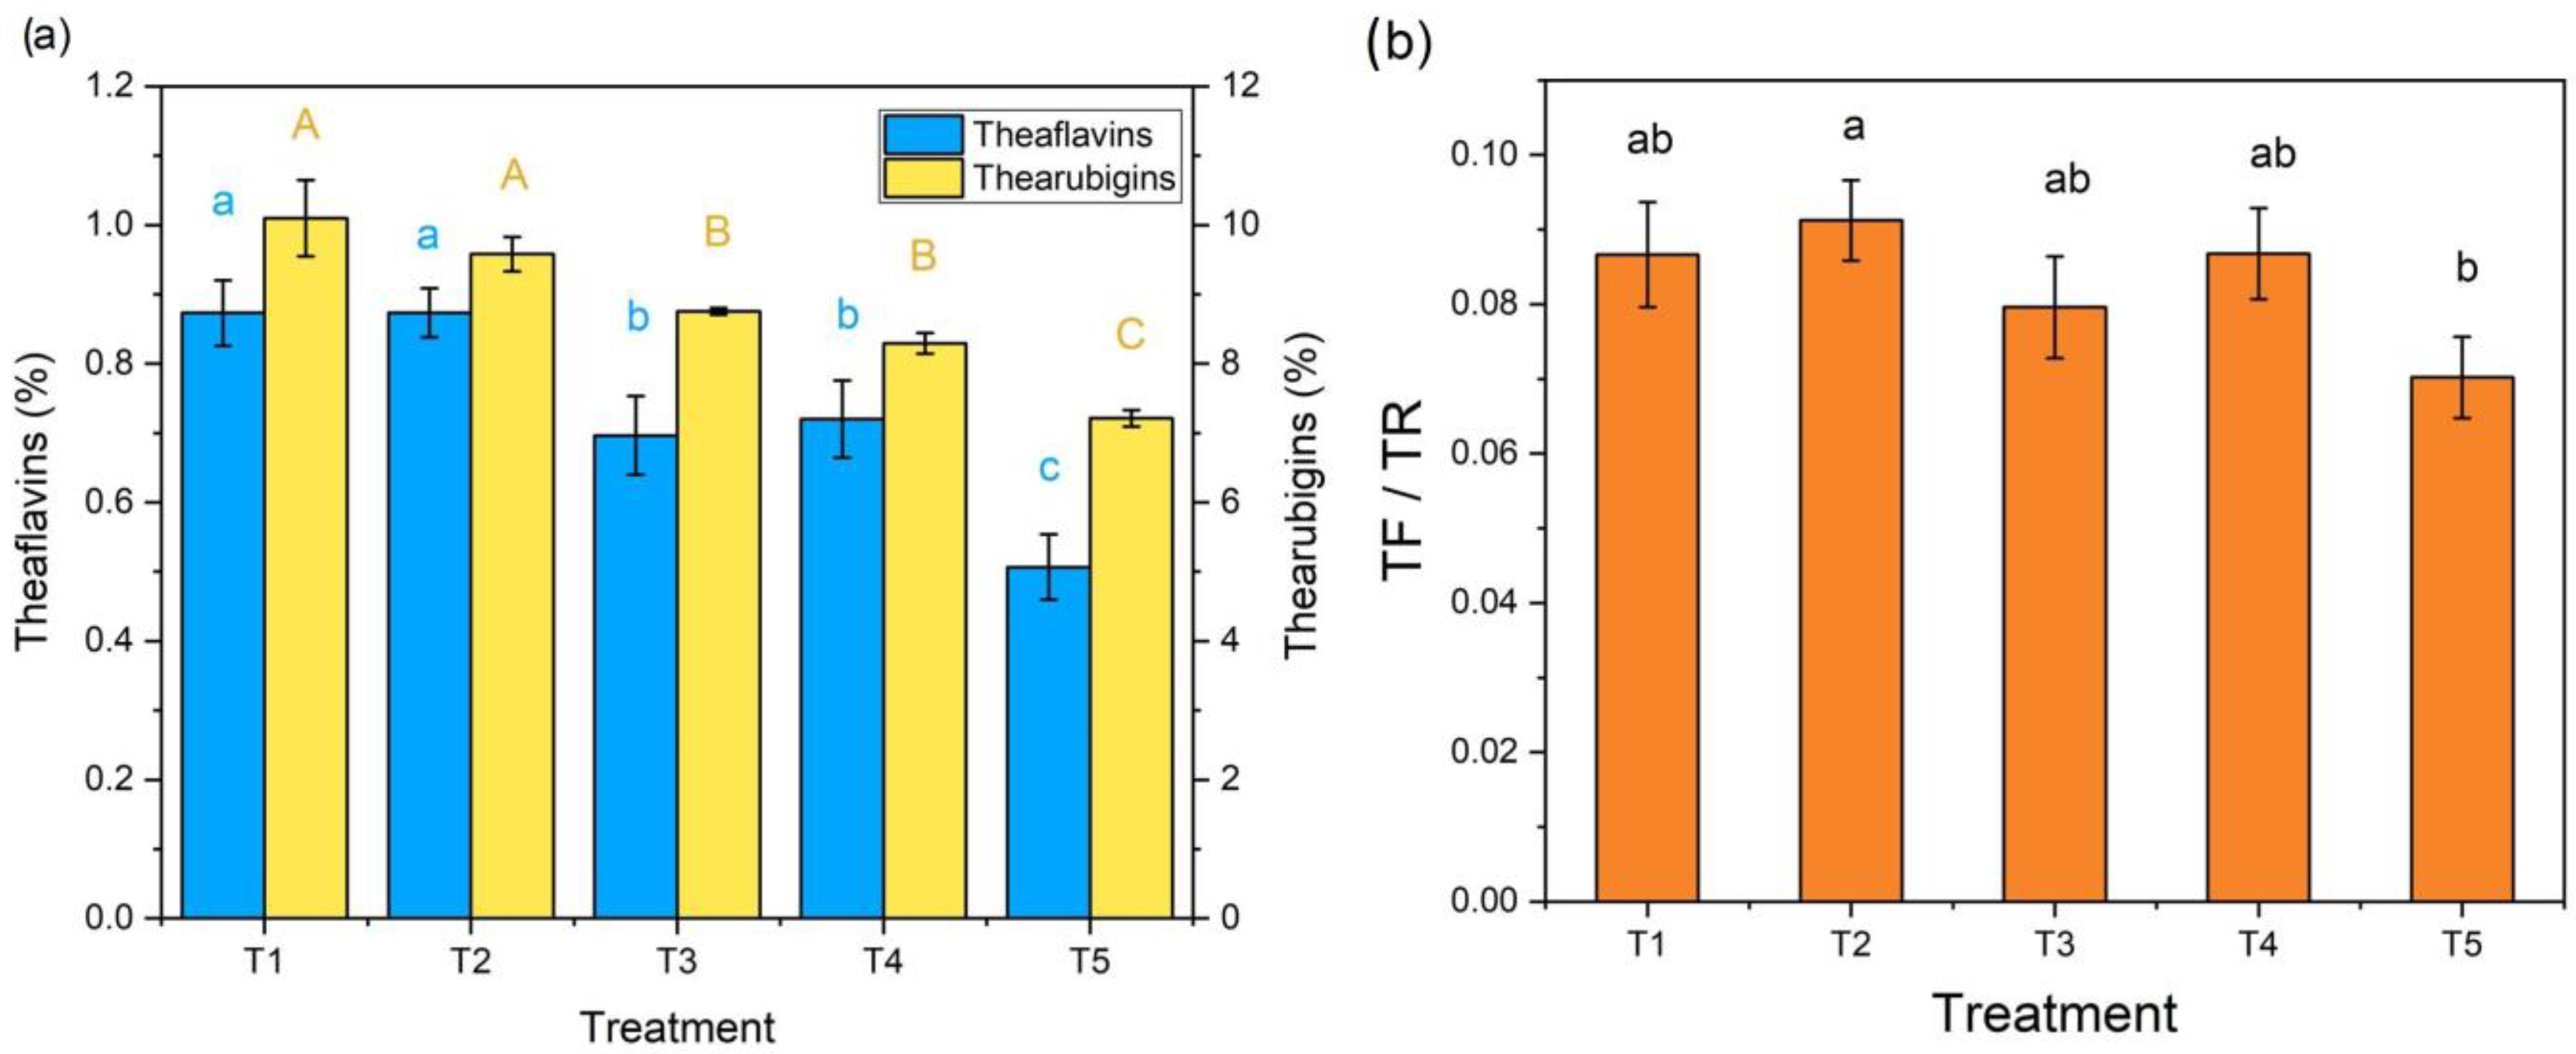
Theaflavins and thearubigins form during the fermentation process involved in the manufacturing of black tea. This process involves allowing the tea leaves to undergo oxidation, which initiates a sequence of chemical reactions, leading to the formation of these compounds [14]. Theaflavins are responsible for the distinctive flavor and aroma of black tea [15], whereas thearubigins are responsible for the color and mouthfeel [16]. Both of these chemicals possess several health benefits, such as anti-inflammatory, antioxidant, anticancer, and anti-obesity activity in humans [15]. Treatments T1 and T2 showed significantly (p < 0.05) higher TF and TR contents than other treatments, whereas T5 showed significantly (p < 0.05) lower TF and TR contents than other treatments (Figure 3a). In this study, the theaflavin and thearubigin contents significantly decreased with increasing temperature, which is in agreement with the results of other studies [17,18]. The possible hindrance of high temperature on the formation of TF and TR could explain this observation. However, it was found that the TF/TR ratio did not significantly differ among treatments T1, T2, T3, and T4 (Figure 3b). In contrast, the TF/TR ratio of treatment T5 was lower than that of the other treatments. These findings indicate that a high drying temperature can reduce the presence of chemical compounds such as TF and TR, thereby compromising the organoleptic properties of the made tea and its health benefits.
3.3.2. Total Phenolic Content
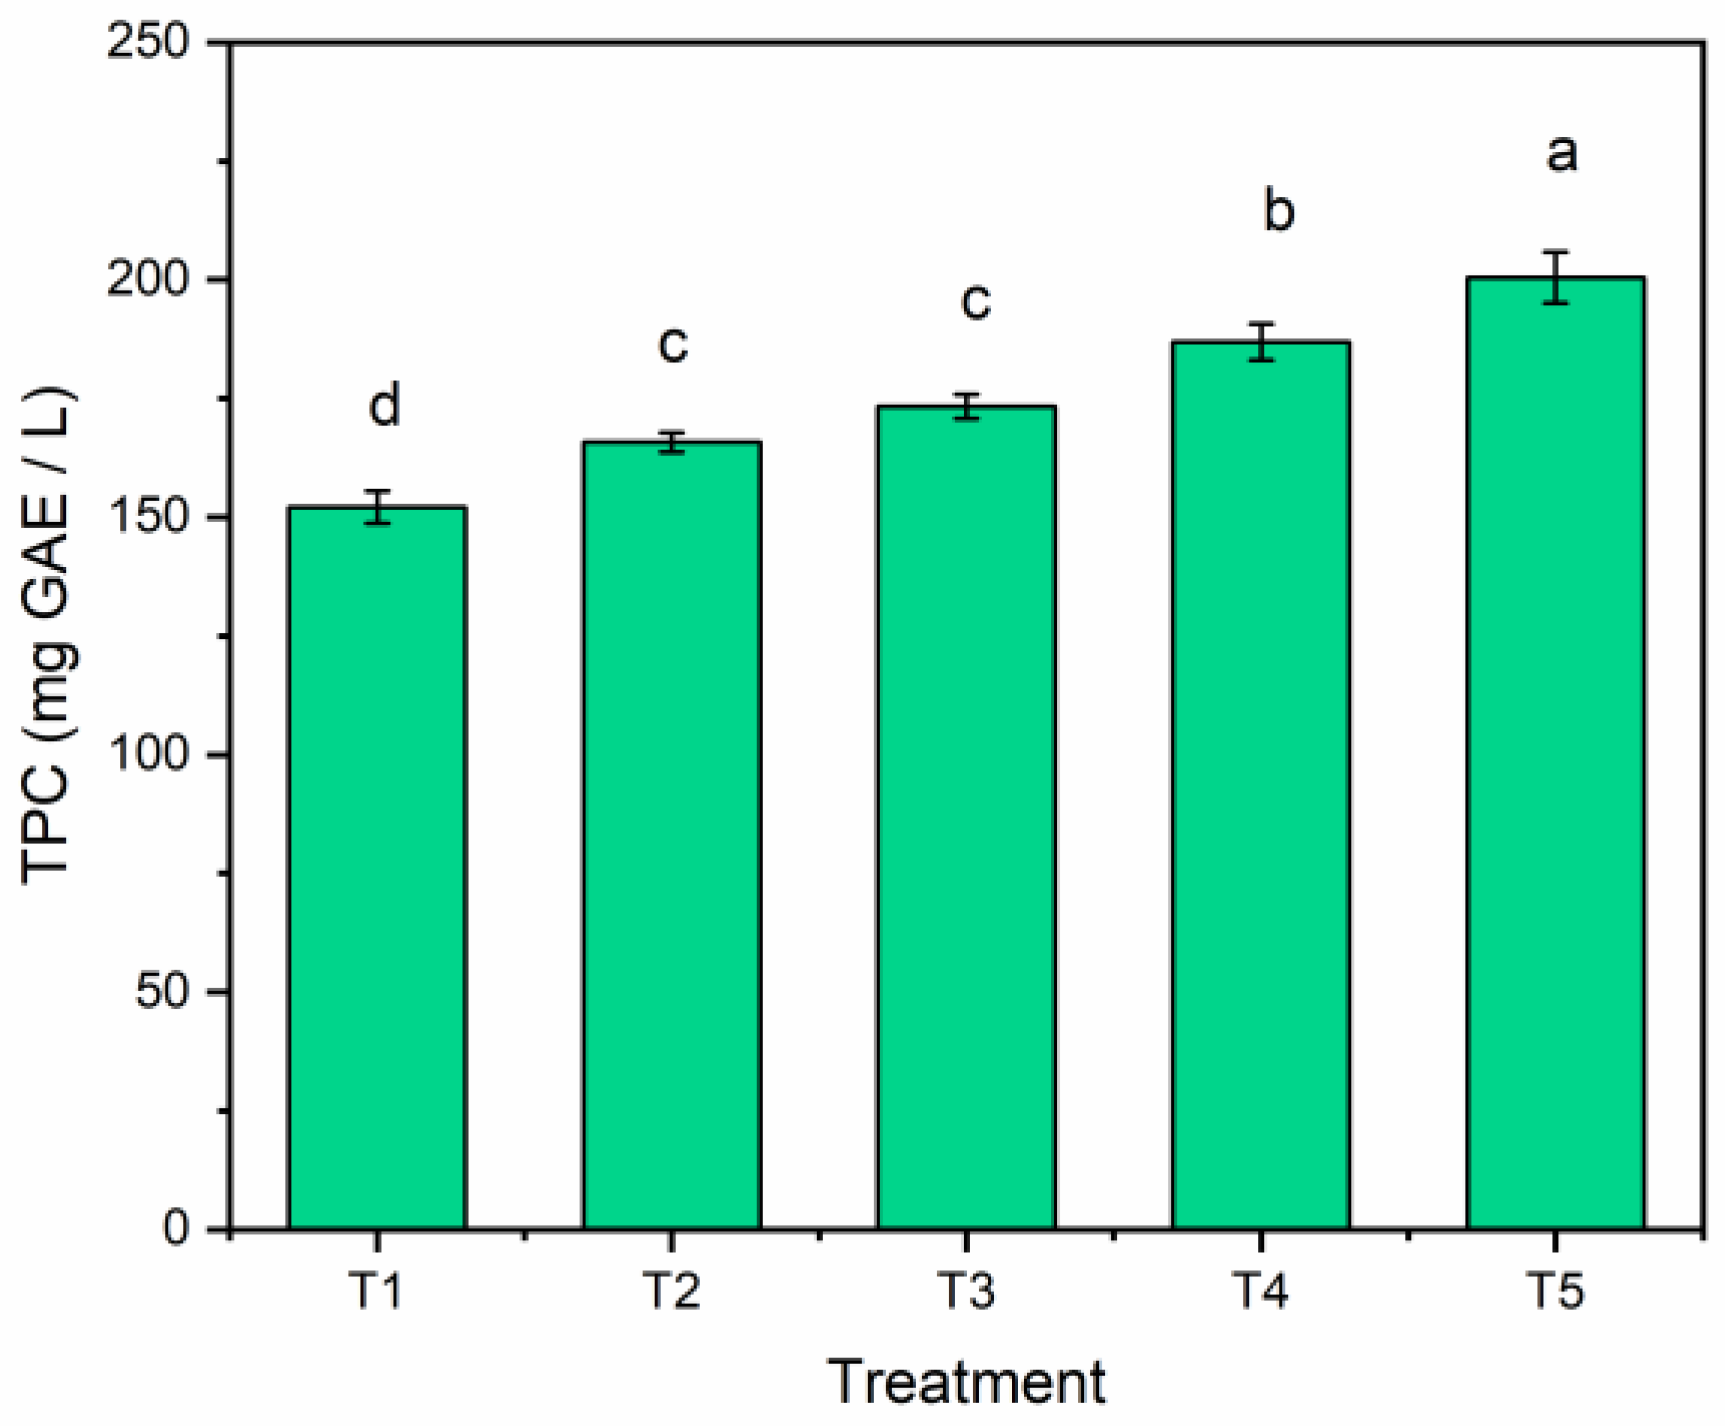
The total phenolic content (TPC) is responsible for made tea’s antioxidant activity, anti-inflammatory, and anti-cancer properties [19]. The TPC of the dried tea leaves was between 152.1 and 200.5 mg GAE L−1 (Figure 4). These values are comparable with those in other studies [20]. Treatment T5 exhibited a significantly higher TPC compared to the other treatments (p < 0.05). Conversely, treatment T1 displayed the lowest TPC among all the treatments (p < 0.05). The TPC values of tea from treatments T2 and T3 were found to be comparable. The TPC values showed an increasing trend with the drying temperature, which is widely reported in the literature [10,21]. This observation could be attributed to the breakdown of extractable TPC from complex phenolic compounds [10]. However, increasing the temperature beyond a threshold level could degrade the TPC [10].
3.4. Sensory Analysis
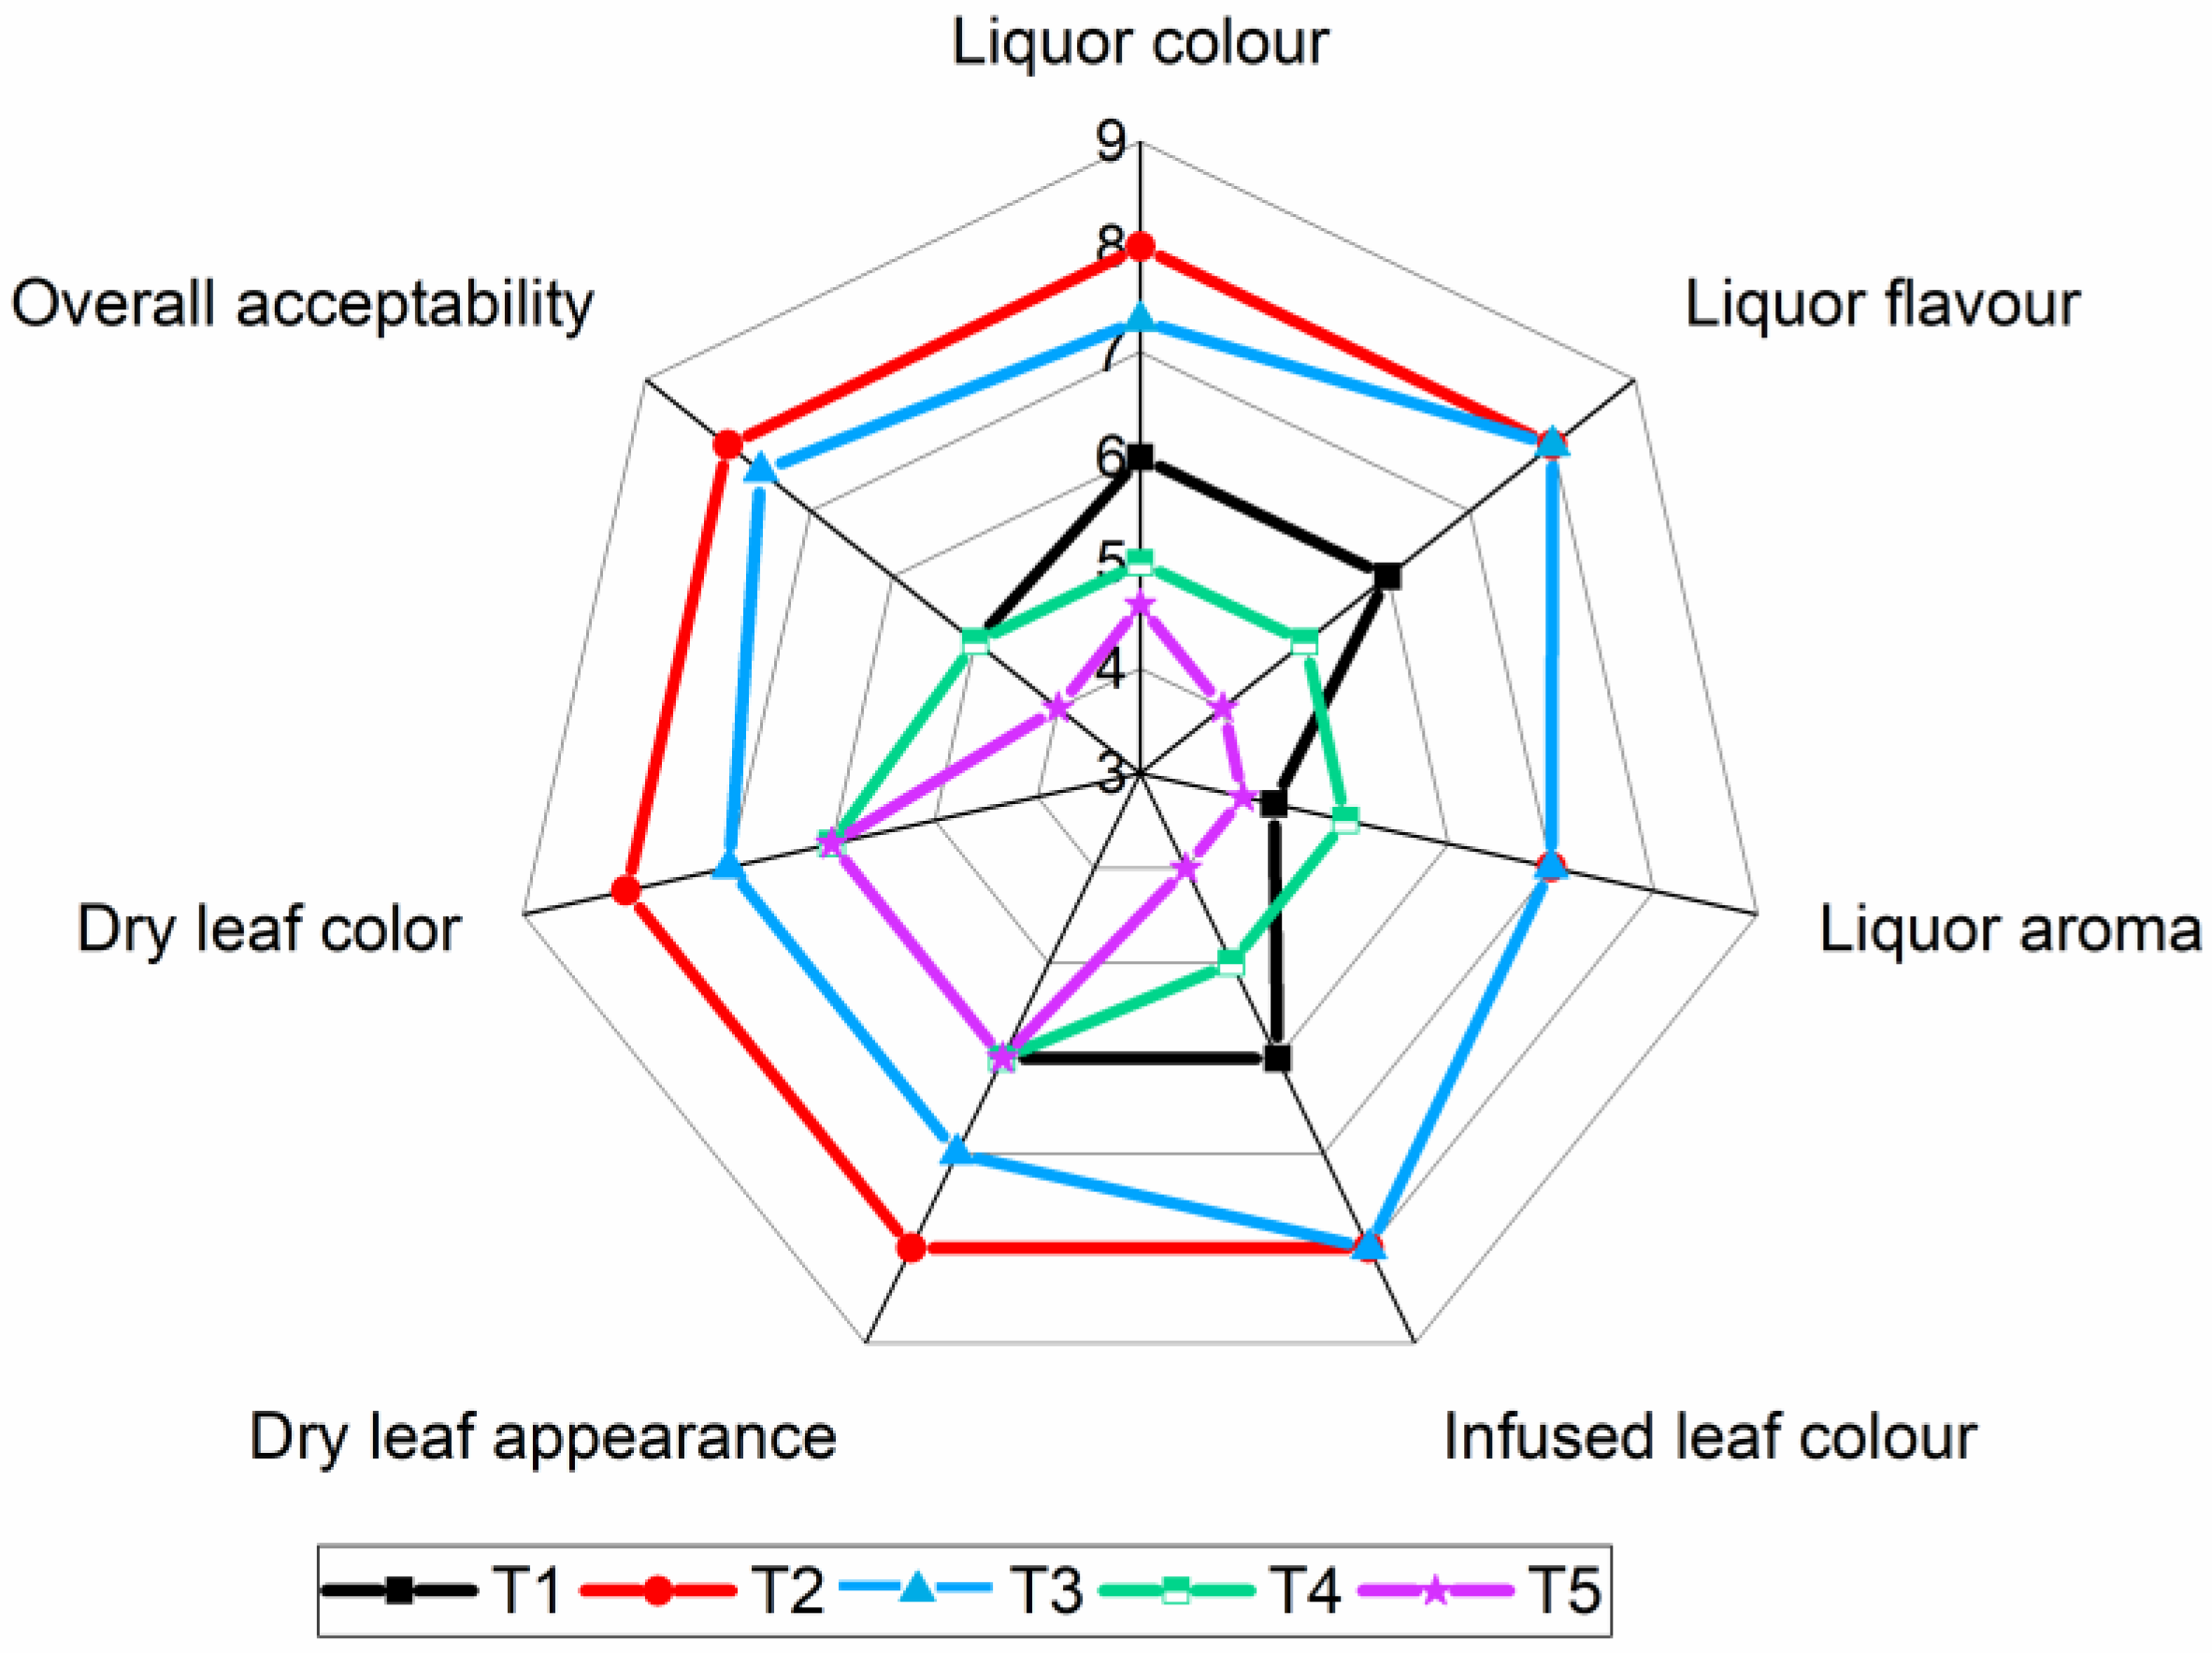
Sensory properties determine the price of tea at auction and directly influence its appeal and suitability for consumption by customers. The tea leaves that were dried under treatment T2 showed better characteristics for liquor color, dry leaf appearance, dry leaf color, and overall acceptability than other treatments (Figure 5). The color and appearance of made tea hold significant importance from a customer’s perspective when purchasing tea [20]. These visual qualities contribute to the initial impression and appeal of the product. On the other hand, when it comes to prepared tea, the liquor’s properties, including its color, aroma, and flavor, become crucial factors. These sensory attributes greatly influence the overall sensory experience and quality of the tea when consumed. The results revealed that although tea leaves exposed to T2 and T3 exhibited similar liquor flavor, liquor aroma, and infused leaf color, they were considered better than other treatments. Tea leaves dried under T1 and T5 conditions showed the characteristics of under- and over-dried tea, respectively. Overall, tea leaves dried with treatments T2 and T3 exhibited more favorable sensory characteristics.
4. Conclusions
In order to optimize the drying temperature of an old endless chain pressure (ECP) dryer, tea leaves were dried under different temperatures (115, 118, 121, 124, and 127 °C). This study involved analyzing the energy consumption, conducting chemical analyses, and evaluating the sensory attributes of the dried tea leaves. It was found that drying temperature significantly (p < 0.05) influenced all the measured parameters. Specific energy consumption (SEC) increased with increasing temperature. The contents of theaflavins and thearubigins in the dried tea leaves decreased as the temperature increased, whereas the total phenolic content showed an increase with increasing temperatures during the drying process. The overall acceptability of the tea dried under T2 treatment was superior to other treatments in terms of the organoleptic properties. After considering all the analyzed parameters, T2 was determined to be the optimal drying temperature. It exhibited lower specific energy consumption (SEC) values and demonstrated superior chemical and sensory attributes compared to the other treatments. By adopting a drying temperature of 118 °C instead of the current temperature of 121 °C, it is estimated that a saving of 95 kJ of energy per kilogram of processed tea could be achieved. Based on the findings of this study, it is recommended to implement a drying temperature of 118 °C at the Houpe tea factory in Ratnapura, Sri Lanka. It is worth mentioning that this recommendation is currently being practiced at this factory, following this research outcome. Further research by altering both drying temperature and air-flow rate is beneficial for further optimizing the SEC. Given the high energy wastage in ECP dryers, reusing the waste energy by using a loop system after dehumidifying the moisture from the air can minimize energy consumption and carbon emissions. Therefore, the design and study of such systems on reusing energy will be instrumental for the tea industry.
Author Contributions
G.A.: Conceptualization, methodology, data curation, formal analysis and investigation, resources, supervision, software, and writing—original draft preparation. R.D.: Data curation, methodology, formal analysis, investigation, and writing—review and editing. R.E.: Methodology, formal analysis, and writing—review and editing. All authors have read and agreed to the published version of the manuscript.
Funding
No special funding was received for this study.
Data Availability Statement
Not applicable.
Acknowledgments
We express our sincere appreciation to Senaka Dayananda, Deputy General Manager (Engineering) of Houpe Tea Factory in Sri Lanka, as well as all the workers at the factory who provided their valuable support for this study.
Conflicts of Interest
The authors affirm that they have no known competing interests that could have influenced the work reported in this manuscript.
References
- Abhiram, G.; Manathunga, M.; Raveendran, K.; Withanage, N. Performance Analysis of High-Efficiency Motor and Variable Speed Drive in Black Tea Processing Machinery. J. Biosyst. Eng. 2020, 45, 310–317. [Google Scholar] [CrossRef]
- Munasinghe, M.; Deraniyagala, Y.; Dassanayake, N.; Karunarathna, H. Economic, social and environmental impacts and overall sustainability of the tea sector in Sri Lanka. Sustain. Prod. Consum. 2017, 12, 155–169. [Google Scholar] [CrossRef]
- Wijeratne, M. Vulnerability of Sri Lanka tea production to global climate change. Water Air Soil Pollut. 1996, 92, 87–94. [Google Scholar] [CrossRef]
- Basnayake, B.; Gunaratne, L. Estimation of technical efficiency and it’s determinants in the tea small holding sector in the Mid Country Wet Zone of Sri Lanka. Sri Lankan J. Agric. Econ. 2002, 4, 137–150. [Google Scholar] [CrossRef]
- Jayasinghe, S.L.; Kumar, L. Climate change may imperil tea production in the four major tea producers according to climate prediction models. Agronomy 2020, 10, 1536. [Google Scholar] [CrossRef]
- Qu, F.; Zhu, X.; Ai, Z.; Ai, Y.; Qiu, F.; Ni, D. Effect of different drying methods on the sensory quality and chemical components of black tea. LWT 2019, 99, 112–118. [Google Scholar] [CrossRef]
- Kumar, K.R.; Dashora, K.; Kumar, S.; Dharmaraja, S.; Sanyal, S.; Aditya, K.; Kumar, R. A review of drying technology in tea sector of industrial, non-conventional and renewable energy based drying systems. Appl. Therm. Eng. 2023, 224, 120118. [Google Scholar] [CrossRef]
- De Silva, W. Status review of energy utilization by the tea industry in Sri Lanka. Sri Lanka J. Tea Sci. 1994, 63, 46–58. [Google Scholar]
- Lian, G.; Thiru, A.; Parry, A.; Moore, S. CFD simulation of heat transfer and polyphenol oxidation during tea fermentation. Comput. Electron. Agric. 2002, 34, 145–158. [Google Scholar] [CrossRef]
- Abhiram, G.; Briyangari, A.; Eeswaran, R. Drying of Gymnema sylvestre Using Far-Infrared Radiation: Antioxidant Activity and Optimization of Drying Conditions. AgriEngineering 2023, 5, 611–622. [Google Scholar] [CrossRef]
- Zeng, Z.; Li, B.; Han, C.; Wu, W.; Wang, X.; Xu, J.; Zheng, Z.; Ma, B.; Hu, Z. An exergoeconomic analysis of a gas-type industrial drying system of black tea. Entropy 2022, 24, 655. [Google Scholar] [CrossRef] [PubMed]
- Jindarat, W.; Sungsoontorn, S.; Rattanadecho, P. Analysis of energy consumption in drying process of biomaterials using a combined unsymmetrical double-feed microwave and vacuum system (CUMV)—Case study: Tea leaves. Dry. Technol. 2013, 31, 1138–1147. [Google Scholar] [CrossRef]
- Temple, S.; van Boxtel, A. PH—Postharvest Technology: A Comparison of Dryer Types used for Tea Drying. J. Agric. Eng. Res. 2000, 77, 401–407. [Google Scholar] [CrossRef]
- Hazarika, M.; Chakravarty, S.K.; Mahanta, P.K. Studies on thearubigin pigments in black tea manufacturing systems. J. Sci. Food Agric. 1984, 35, 1208–1218. [Google Scholar] [CrossRef]
- Shan, Z.; Nisar, M.F.; Li, M.; Zhang, C.; Wan, C.C. Theaflavin chemistry and its health benefits. Oxidative Med. Cell. Longev. 2021, 2021, 6256618. [Google Scholar] [CrossRef]
- Zhu, K.; Ouyang, J.; Huang, J.; Liu, Z. Research progress of black tea thearubigins: A review. Crit. Rev. Food Sci. Nutr. 2021, 61, 1556–1566. [Google Scholar] [CrossRef]
- Temple, S.J.; Temple, C.M.; Boxtel, A.J.B.v.; Clifford, M.N. The effect of drying on black tea quality. J. Sci. Food Agric. 2001, 81, 764–772. [Google Scholar] [CrossRef]
- Su, Y.L.; Leung, L.K.; Huang, Y.; Chen, Z.-Y. Stability of tea theaflavins and catechins. Food Chem. 2003, 83, 189–195. [Google Scholar]
- Ding, J.; Mei, S.; Gao, L.; Wang, Q.; Ma, H.; Chen, X. Tea processing steps affect chemical compositions, enzyme activities, and antioxidant and anti-inflammatory activities of coffee leaves. Food Front. 2022, 3, 505–516. [Google Scholar] [CrossRef]
- Abhiram, G.; Jinthushayi, S.; Withanage, N. Optimization of feeding rate and pressure of Orthodox Roller in Black Tea production. AGRIEAST J. Agric. Sci. 2018, 12, 16–25. [Google Scholar] [CrossRef]
- Selvi, K.Ç.; Kabutey, A.; Gürdil, G.A.K.; Herak, D.; Kurhan, Ş.; Klouček, P. The effect of infrared drying on color, projected area, drying time, and total phenolic content of rose (Rose electron) petals. Plants 2020, 9, 236. [Google Scholar] [CrossRef] [PubMed]
Figure 1.
The schematic diagram of the experimental setup of the endless chain pressure (ECP) dryer. Temperature sensor locations and the relevant measurements are as follows. S1: inlet air temperature, S2–S4: tea leaf drying temperature, S5: exhaust air temperature, S6: the temperature of inlet tea leaves, and S7: ambient air temperature.

Figure 2.
Temperature changes of tea drying according to time for the different treatments: (a) hot air inlet temperature, (b) hot air exhaust temperature, and (c) average temperature of tea leaves.
Figure 2.
Temperature changes of tea drying according to time for the different treatments: (a) hot air inlet temperature, (b) hot air exhaust temperature, and (c) average temperature of tea leaves.

Figure 3.
(a) Theaflavin (TF) and thearubigin (TR) contents and (b) the TF:TR ratio of tea leaves dried under different treatments. Note: The different alphabetical letters within the same column of the graph are statistically different at a 5% significance level (n = 3).
Figure 3.
(a) Theaflavin (TF) and thearubigin (TR) contents and (b) the TF:TR ratio of tea leaves dried under different treatments. Note: The different alphabetical letters within the same column of the graph are statistically different at a 5% significance level (n = 3).

Figure 4.
The total phenolic content (TPC) in tea leaves, as affected by the different treatments. Note: The different alphabetical letters in the column graph are statistically different at a 5% significance level (n = 3).
Figure 4.
The total phenolic content (TPC) in tea leaves, as affected by the different treatments. Note: The different alphabetical letters in the column graph are statistically different at a 5% significance level (n = 3).

Figure 5.
The sensory evaluation of tea leaves dried under different temperature treatments.


Table 1.
Energy analysis of the tea-drying process under different treatments.
| Treatment | Energy Consumed by Dryer | Energy Consumed by Tea Leaves | Energy to Heat Moisture | Energy to Evaporate Moisture | Specific Energy Consumption (SEC) | Energy Wastage |
|---|---|---|---|---|---|---|
| MJ | MJ | MJ | MJ | MJ/kg H2O | MJ | |
| T1 | 114.66 ± 4.19 b | 4.21 ± 0.04 c | 1.27 ± 0.02 c | 11.73 ± 0.06 e | 48.24 ± 0.22 a | 233.32 ± 0.68 c |
| T2 | 126.47 ± 5.07 a | 4.20 ± 0.04 c | 1.31 ± 0.01 c | 12.15 ± 0.06 d | 47.67 ± 0.36 ab | 238.82 ± 2.17 bc |
| T3 | 114.75 ± 3.70 b | 4.56 ± 0.1 b | 1.47 ± 0.03 b | 12.53 ± 0.07 c | 46.73 ± 0.73 b | 240.67 ± 3.19 b |
| T4 | 106.02 ± 2.91 b | 4.80 ± 0.01 a | 1.58 ± 0.01 a | 12.76 ± 0.05 b | 47.62 ± 0.15 ab | 249.76 ± 1.78 a |
| T5 | 115.62 ± 2.72 b | 4.78 ± 0.03 a | 1.61 ± 0.01 a | 13.12 ± 0.11 a | 46.87 ± 0.34 b | 252.66 ± 0.72 a |
Note: The different alphabetical letters within the same column are statistically different at a 5% significance level (n = 3).
Disclaimer/Publisher’s Note: The statements, opinions and data contained in all publications are solely those of the individual author(s) and contributor(s) and not of MDPI and/or the editor(s). MDPI and/or the editor(s) disclaim responsibility for any injury to people or property resulting from any ideas, methods, instructions or products referred to in the content. |
© 2023 by the authors. Licensee MDPI, Basel, Switzerland. This article is an open access article distributed under the terms and conditions of the Creative Commons Attribution (CC BY) license (https://creativecommons.org/licenses/by/4.0/).
Share and Cite
MDPI and ACS Style
Abhiram, G.; Diraj, R.; Eeswaran, R. Optimization of Black Tea Drying Temperature in an Endless Chain Pressure (ECP) Dryer. AgriEngineering 2023, 5, 1989-1999. https://0-doi-org.brum.beds.ac.uk/10.3390/agriengineering5040122
AMA Style
Abhiram G, Diraj R, Eeswaran R. Optimization of Black Tea Drying Temperature in an Endless Chain Pressure (ECP) Dryer. AgriEngineering. 2023; 5(4):1989-1999. https://0-doi-org.brum.beds.ac.uk/10.3390/agriengineering5040122
Chicago/Turabian StyleAbhiram, Gunaratnam, Rasaiyah Diraj, and Rasu Eeswaran. 2023. "Optimization of Black Tea Drying Temperature in an Endless Chain Pressure (ECP) Dryer" AgriEngineering 5, no. 4: 1989-1999. https://0-doi-org.brum.beds.ac.uk/10.3390/agriengineering5040122