Article

The Influencing Factors Analysis of Aquaculture Mechanization Development in Liaoning, China

1
Key Laboratory of Environment Controlled Aquaculture, Ministry of Education, Dalian Ocean University, Dalian 116023, China
2
College of Marine Technology and Environment, Dalian Ocean University, 52 Heishijiao Street, Dalian 116023, China
3
College of Biosystems Engineering and Food Science, Zhejiang University, Hangzhou 310058, China
*
Author to whom correspondence should be addressed.
These authors contributed equally to this work and should be considered co-first authors.
Submission received: 5 October 2023 / Revised: 15 December 2023 / Accepted: 27 December 2023 / Published: 8 January 2024

Abstract

:
Promoting the mechanization of aquaculture is one of the most important supporting measures to ensure the high-quality development of the aquaculture industry in China. In order to solve the problems of predominantly manual work and to decrease the costs of aquaculture, the influencing factors of China’s aquaculture mechanization were systematically analyzed. The triple bottom theory was selected, and three aspects were identified, including environmental, economic, and social aspects. Through the literature review, the Delphi method, and the analytic hierarchy process, the comprehensive evaluation indicator system, including 18 influencing factors, was proposed. Moreover, the fuzzy comprehensive evaluation method was combined with the model to solve the evaluation results. A case study in Liaoning Province was offered and, according to the analysis results, the economic aspect at the first level was the most critical factor; the financial subsidy for the purchase of aquaculture machinery, the energy consumption of the machinery and equipment, and the promotion and use of aquaculture technology were the most important factors and had the greatest impact on the development of aquaculture mechanization in China. The effective implementation paths and countermeasures were proposed, such as the promotion of mechanized equipment and the enhancement of the machinery purchase subsidies, in order to provide an important decision-making basis for the improvement of the level of aquaculture mechanization.

1. Introduction

China is a major aquaculture country in the world, with aquaculture production accounting for two-thirds of the world’s total aquaculture output. Since 2002, it has maintained a position as a major exporter of aquatic products [1]. In 2020, China’s aquaculture output was about 52.24 million tons, accounting for approximately 46.4% of the world’s aquaculture production; the per capita share of aquatic products was 46.39 kg [2]. Based on the 2022 China Fisheries Statistical Yearbook, the national freshwater aquaculture production in 2021 was 31.83 million tons, accounting for 59% of the total output [3]. In 2020, the production of marine aquaculture accounted for approximately 41% of the total production of aquatic products in China [4]. As one of the important supply channels, aquaculture can provide an important guarantee for China’s food security [5].
Mechanization is an important component, support, and symbol of aquaculture modernization [6]. Since 1960, a variety of agricultural machinery has been extensively utilized in overseas nations. For instance, pneumatic feeders have been employed in the United States and Denmark. Countries such as Sweden and Denmark used narrow gauge transport feeding vehicles for feeding. In Japan, water wheel aerators were used to aerate fish ponds, rail electric vehicles were used to transport fish ponds, and fish were classified and transferred through fish lifters and fish separators [7]. However, the mechanization of China’s aquaculture industry was still in its early stages. With ongoing advancements in science and technology, automated and information-based equipment, such as that for water quality monitoring, feed distribution, harvesting, etc., has gained widespread recognition internationally [8]. Compared with other countries, despite the fact that China has a relatively high aquaculture production, its low production efficiency has led to a low level of aquaculture machinery and equipment [9]. The mechanization level of Chinese aquaculture started relatively late compared with other food production industries, which was a weak link in the application and development of mechanized agriculture [10]. Since 1970, fishery machinery and equipment has been used in China. In the early 1990s, the aerators and feeders were developed and popularized and were gradually applied in practical production. But it did not fully cover all the areas of aquaculture in China [11]. The major portion of freshwater aquaculture production in India was occupied by carp species such as Labeo rohita, Catla catla and Cirrihinus mrigala, accounting for approximately 87% of the overall freshwater yield [12]. Given their significant commercial value, it is essential to transition from small-scale farms to larger aquaculture enterprises. Therefore, it is necessary to invest in a mechanized system for the entire production process to ensure sustainable industrial development [13]. The marine fishery sector was highly mechanized; “Industrialization and mechanization were prominent features of the marine fishery department in the context of “big agriculture” [14]. Conventional aquaculture encompasses integrated agriculture–aquaculture systems (IAAS), utilizing on-farm or local agriculture by-products, manures, and vegetation; integrated peri-urban aquaculture systems (IPAS) using domestic sewage and by-products from the local agri-industry; and integrated fisheries–aquaculture systems (IFAS) with carnivorous fish fed with trash and low-value fish [15]. By the beginning of the 21st century, aerators and feeding machines had been widely applied. China’s aquaculture industry had basically achieved the mechanization of its main operations. However, the degree of mechanization in the dredging, harvesting, grading, waste collection, and treatment of aquaculture was generally minimal. Some aquaculture equipment, such as the aquaculture tail water treatment equipment, fish pond dredging machines, harvesting devices, etc., was not widely applied [16]. Traditional extensive agriculture was still the main mode of production for most farmers. The mechanization and standardization levels of aquaculture were comparatively lower [17]. Therefore, promoting the transformation and upgrading the industry towards green and highly efficient production, accelerating the pace of modernization construction, and meeting the green and high-efficiency development of the aquaculture industry can be achieved by promoting the development of aquaculture mechanization in China [18]. The “Opinions on Accelerating the Development of Aquaculture Mechanization” issued by the Ministry of Agriculture and Rural Affairs in 2020 has set a clear target of reaching a mechanization level of over 50% in the aquaculture industry by 2025 [19]. However, the mechanization level of aquaculture in China was only about 32% in 2020, which was far from the goal of 50% in 2025 [20]. There were some issues in the development of aquaculture mechanization in China, such as relatively weak basic research and backward facilities and equipment. It was driven by the financial subsidies for the purchase of aquaculture machinery, the energy consumption of the machinery and equipment, and the promotion and utilization of aquaculture technology. At present, the lack of research on the implementation path and the decision-making recommendations for aquaculture mechanization was not conducive to the rapid development of aquaculture mechanization in China.
The Delphi method was a method of simulating a market that utilizes its knowledge, experience, and ability in analysis and judgment to verify problems [21]. Lucia et al. [22] employed the Delphi method to establish priorities for potential welfare issues associated with Europe’s aquaculture industry, focusing specifically on Atlantic salmon and rainbow trout. The severity, duration, and prevalence of each issue were rated by experts, who also put forward interventions to address the most significant concerns. Anna et al. [23] employed the Delphi method to leverage the pan-European expertise to identify the key factors in site selection for European native oyster (Ostrea edulis) habitat restoration projects. This study established a strong foundation for future site selection efforts to build upon. The questionnaire survey was a widely used method in domestic and international social research. This controlled measurement was used by researchers to measure the problems being studied and to collect reliable data [24].
The analytic hierarchy process (AHP) was used to decompose a complex problem into various components and to group those factors according to the dominant relationship and thereby create a systematic hierarchical framework. This methodology was first introduced by American operations researcher Professor T. L. Saaty in the 1970s. By means of a pairwise comparison analysis, the relative importance of each factor in the hierarchy was determined; then, the overall ranking of the relative importance of the decision-making factors’ relative importance was established by synthesizing the individuals’ evaluations [25]. Francisco et al. [26] employed AHP technology to construct a multi-criteria decision-making problem, in which they assigned weights and rankings to factors such as mechanical properties, material quality characteristics, and manufacturing considerations. Du et al. [27] proposed a method that utilized the AHP to determine the importance of each evaluation indicator. Combined with a remanufacturing example of a heavy horizontal lathe, the proposed decision-making method was verified and analyzed. According to Du et al. [28], the weight of each indicator in the remanufacturing process of the waste planner was determined using the AHP method, which validated the feasibility and effectiveness of this approach. The combination of the AHP and fuzzy comprehensive evaluation (FCE) methods in this study resulted in more scientific and credible evaluation results. Therefore, they more objectively determine the factors and indicator systems that affect the current development status of aquaculture mechanization in China.
FCE was a scientific and reasonable evaluation method to quantify qualitative indicators; it was first put forward by Zadeh [29]. Its basic theory was to determine the value of the components of the evaluation indicator through the membership matrix and factor weight. It enabled a comprehensive assessment of factors that were challenging to analyze quantitatively and produced clear results and strong system suitability, and it could better solve various uncertainty problems [30]. Shi et al. [31] adopted membership degree conversion in the FCE method. The redundant data in the target classification indicator memberships were eliminated. The target membership degree of effective value was extracted. The new algorithm was applied to the FCE of the sustainable development of the equipment manufacturing industry. Zhao et al. [32] employed the FCE method to estimate the quality level of the dispensing process. The dispensing indicator and quality level mapping model based on a support vector machine was established. This allowed the online intelligent evaluation of drug dispensing quality. The experimental findings indicated the effectiveness of the method.
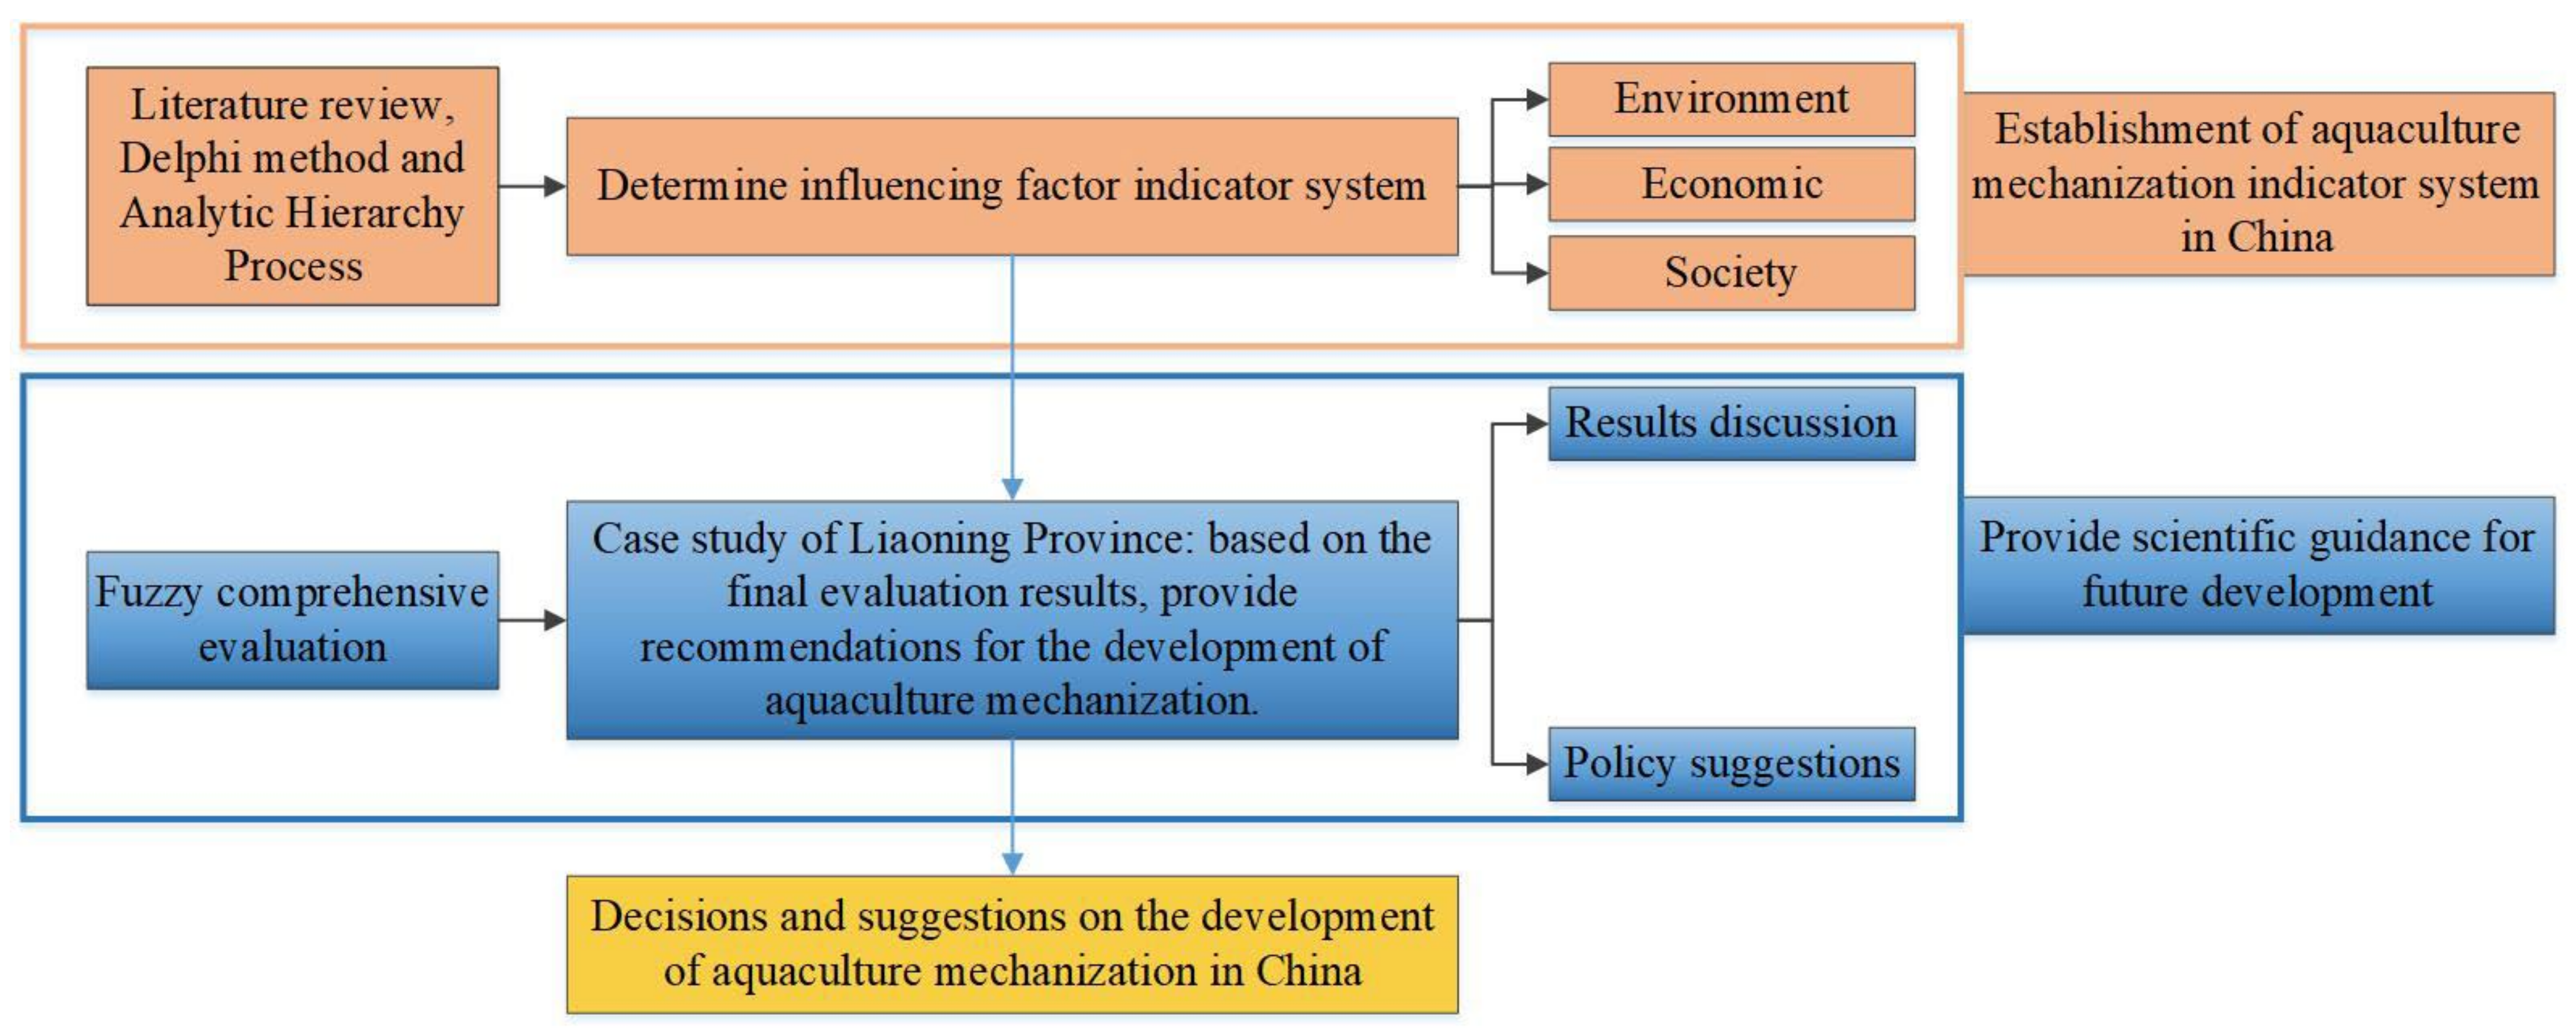
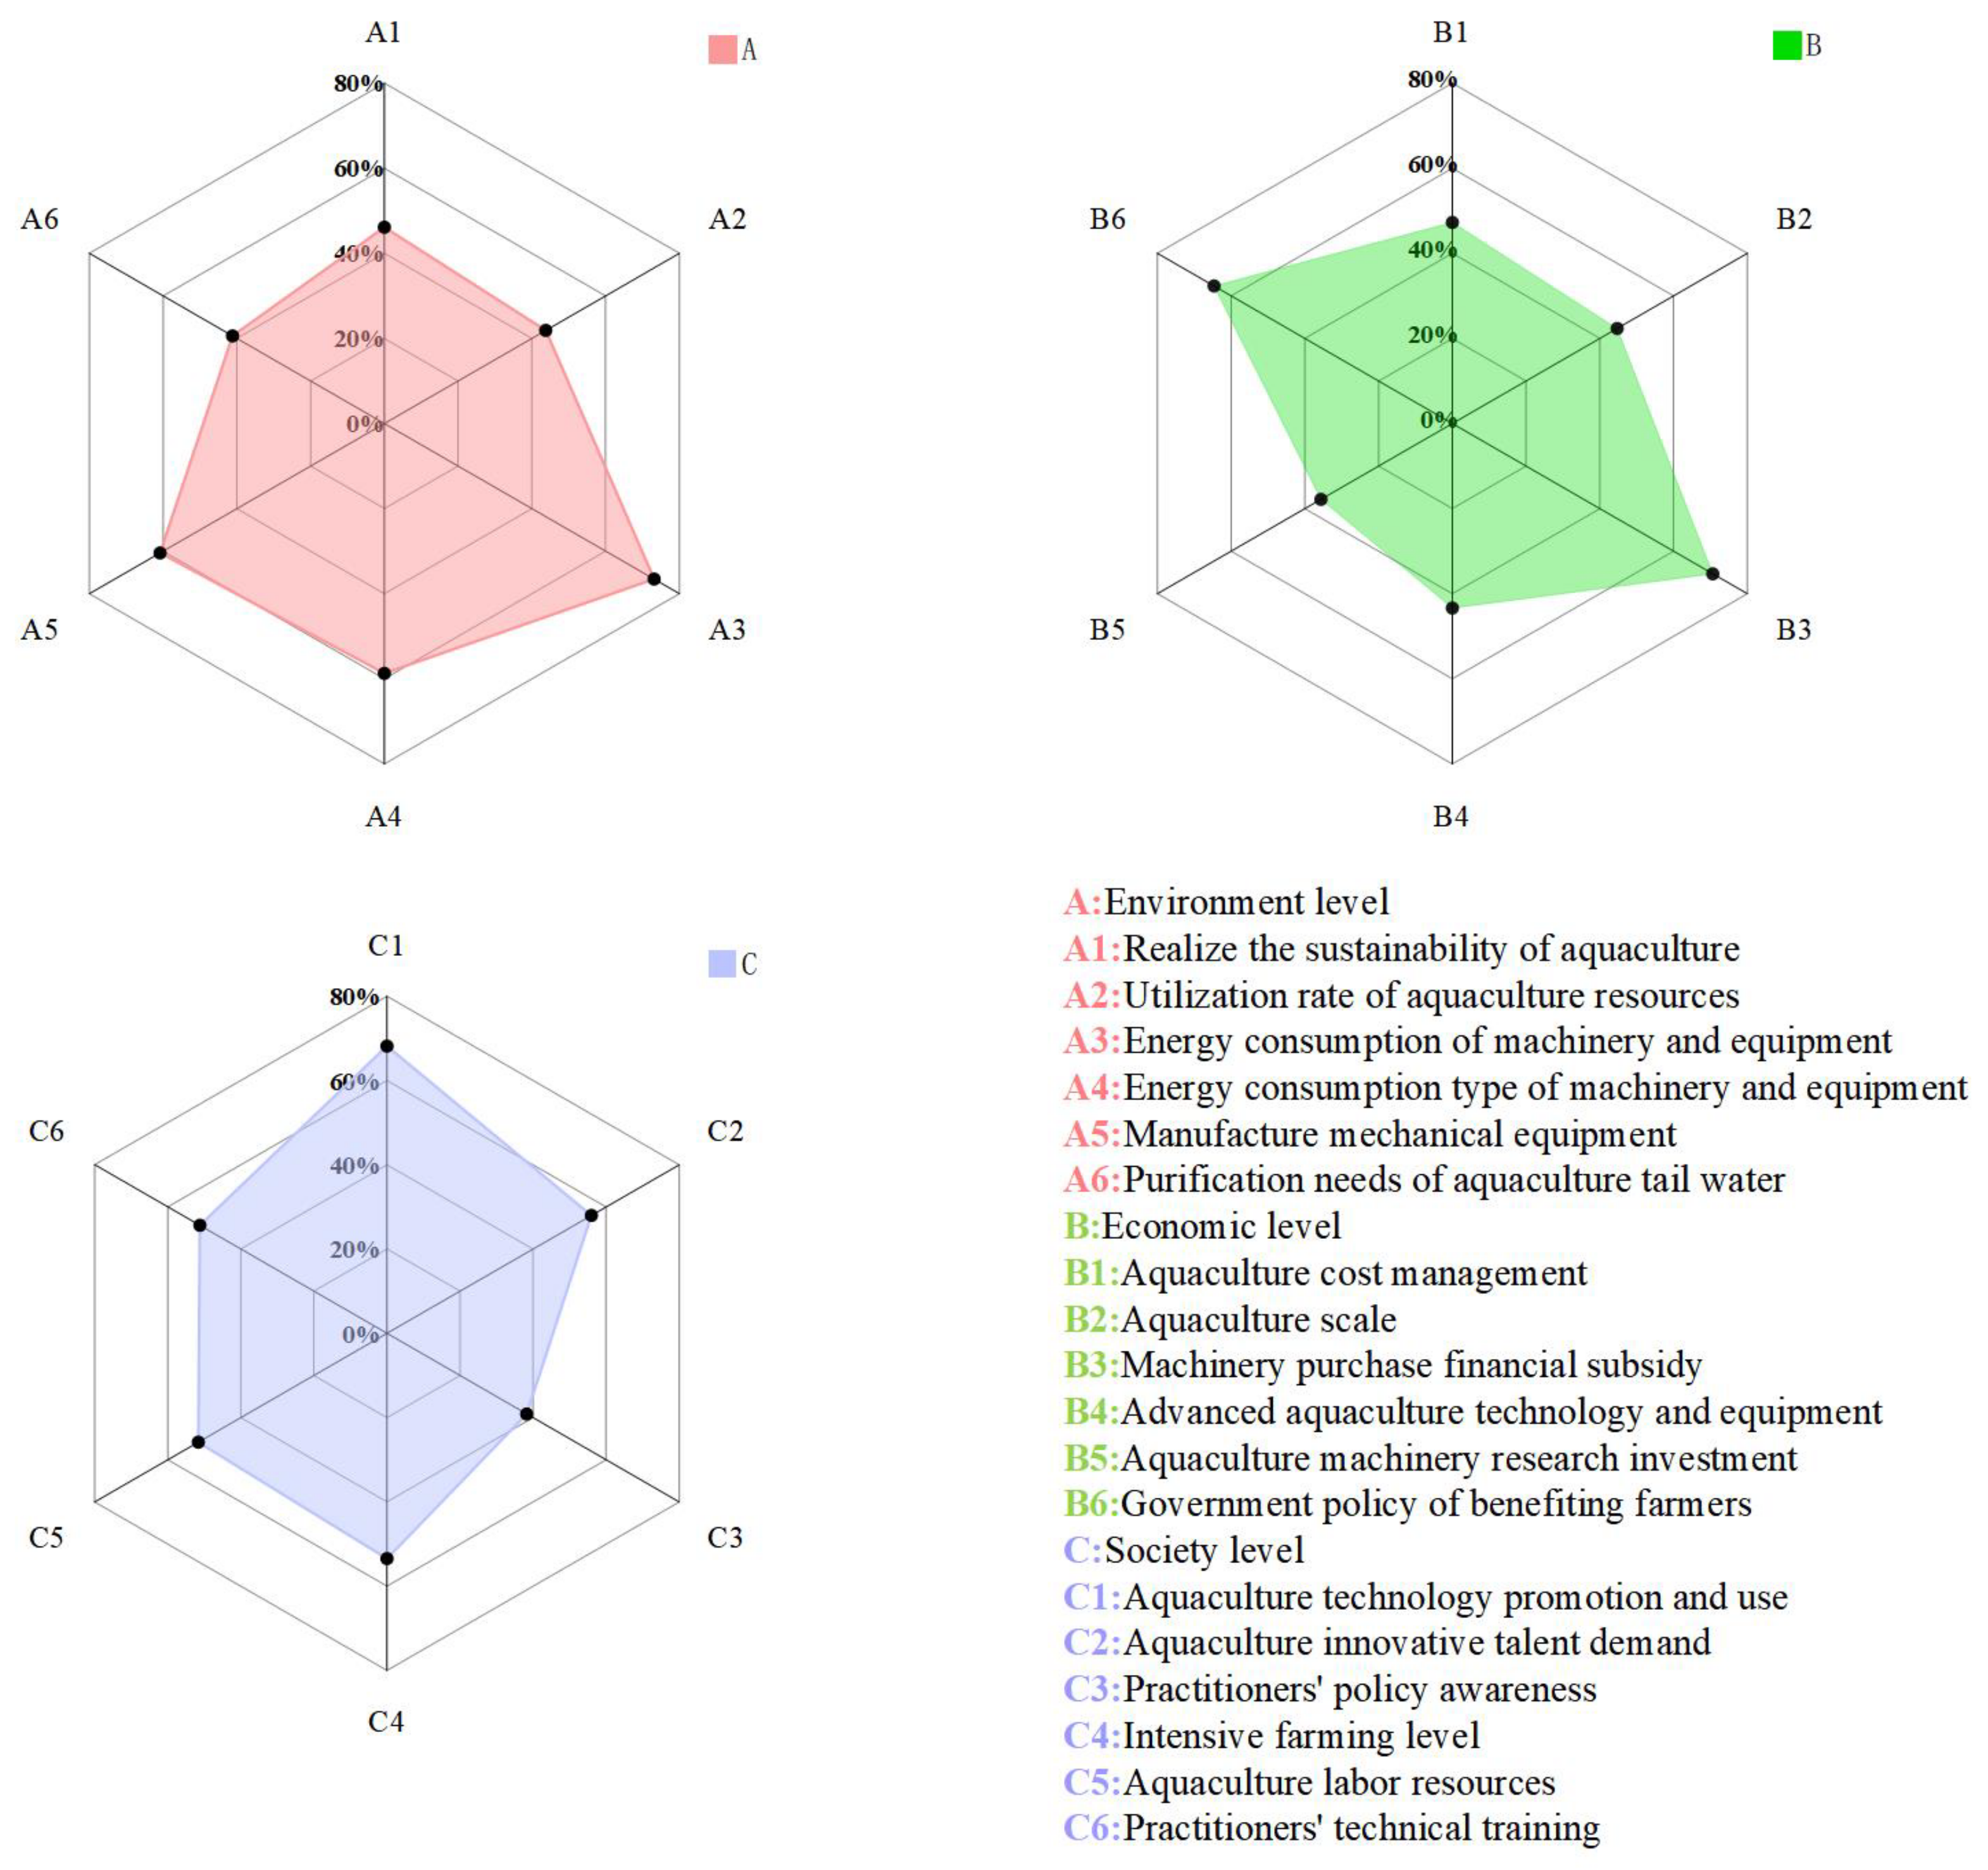
Therefore, in this paper, the influencing factors of aquaculture mechanization development were systematically analyzed based on the triple bottom theory. Through the literature review, the Delphi method and AHP were used to analyze and determine the environmental, economic, and social influencing factor indicator system, which including 18 indicators, such as financial subsidies for the purchase of aquaculture machinery, the energy consumption of machinery and equipment application, and the promotion and application of aquaculture technology. Subsequently, the FCE method was employed to develop the assessment framework, with Liaoning Province serving as a case study for the evaluation analysis. The qualitative and quantitative indicators were scientifically and rationally evaluated quantitatively to obtain various indicators, and the results were analyzed to propose effective implementation paths and countermeasures. In this way, the effective implementation path and countermeasures were proposed, and they will provide an important decision-making basis for the promotion of the high-efficiency mechanization of aquaculture in China, improving production efficiency, reducing labor intensity, reducing disaster losses, and improving the aquaculture mechanization level.
This paper’s study considers the following aspects, which are also given in Figure 1.
(1)
Determination of the influencing factors evaluation indicator system. Through the method of the literature review, an analysis of the factors impacting the trajectory of aquaculture mechanization in China was conducted. This study adopts the model of expert scoring and the survey questionnaire, using experts to determine and screen indicators that can effectively reflect the current status of China’s aquaculture mechanization. Based on the triple bottom theory, a research framework for an evaluation indicator system was ultimately derived using the Delphi method and AHP; the framework consists of 3 tiers and 18 influential factors.
(2)
Evaluation method and case study. In this research, the FCE method was applied to construct the evaluation model. A scientific and rational quantitative evaluation of the qualitative and quantitative indicators was carried out. The analysis results of each indicator were obtained. Liaoning Province, China, was selected as the case study to carry out the evaluation and analysis. Discussion and policy recommendations. According to the final evaluation results, effective implementation paths and decision-making suggestions for the development of aquaculture mechanization were put forward, and beneficial reference and insights for China’s aquaculture industry were provided.

2. Materials and Methods

2.1. Indicator Construction

Through the literature search, the Delphi method, and the consultation and interviews with experts, the obstacles and driving factors in the development direction of aquaculture mechanization in China were summarized, the important influencing factors were identified, and 33 influencing factors were retrieved. Then, through initial communication with 10 experts and scholars in the field of aquaculture, they were categorized based on the three levels of environment, economy, and society, resulting in the elimination of factors and the consolidation of 33 influencing factors into 25 factors. Then, a second interview was conducted for the “problem factors”, and through this cycle, until the experts reached a consensus, they did not revise their views to obtain the final result. If the opinions of each expert were inconsistent, the Delphi questionnaire had to be modified until the questionnaire results converged. Finally, a questionnaire regarding the influencing factors of public participation in the development of aquaculture mechanization was formed; it included 3 levels and an indicator system with 18 influencing factors. A total of 1000 valid questionnaires were obtained through the online survey of “Sojump”, and the effective rate reached 100%.

Evaluation Indicator System

Through the literature search, Delphi method, and AHP, the influencing factors of the aquaculture mechanization development in China were summarized. Finally, a comprehensive evaluation indicator system for the development of aquaculture mechanization, consisting of 3 levels and 18 influencing factors, was established, as depicted in Table 1.

2.2. Analytic Hierarchy Process

The analytic hierarchy process (AHP), as a systematic analysis method that combines quantitative and qualitative analysis, was suitable for the calculation of the factor weights. Its steps mainly include the establishment of a hierarchical organizational structure, the construction of a judgment matrix, the comparison of the importance of the factors, and the checking of the consistency. Ren et al. [33] employed the AHP to determine the weights of the indicators and the FCE method to evaluate the importance of each indicator, and they established a green supplier assessment indicator system for sea cucumber processing enterprises, verifying the effectiveness and practicality of this method. Hou et al. [34] developed a synthetic assessment model for the evaluation of the cleaner production indicator system of the sea cucumber aquaculture industry using the Delphi method, AHP, and FCE method. The pairwise comparisons matrix and membership degrees of the indicators were determined, and in order to reduce subjectivity in the subsequent quantitative calculation process, the AHP and the FCE method were also utilized. Finally, expert interviews were carried out to mitigate the subjective nature of pairwise comparison matrices and membership levels in future research. Chen et al. [35] proposed a safety performance measurement approach utilizing safety performance indicators to oversee the safety management process of civil aviation units using the AHP and the Delphi method. This method was successfully validated using actual data from a regional civil aviation bureau in China, and it could quantitatively reflect the safety management status of the bureau in a timely manner. Therefore, the construction of the model is realistic and effective.

2.2.1. Establish a Hierarchical Organizational Structure

An independent hierarchical organization structure that can describe the relationship of the contents of the system was established according to the requirements of the research questions.

2.2.2. Construct Judgment Matrix

Nine scales ranging from 1 to 9, along with their inverses, were employed to assess and balance the relative significance of each evaluation factor within the influencing factor set.

2.2.3. Consistency Test of Judgment Matrix

There were two parts to the consistency test.
(1)
Hierarchical single sorting and consistency test
To assess the discrepancy of the error of the eigenvalue ( λ m a x ) and the incompatibility-induced error in W caused by matrix incompatibility, the consistency of the judgment matrix was evaluated through calculation. The formula for determining the consistency indicator is as follows:
C . I . = λ m a x n n 1
Type, C . I . was the consistency indicator, λ m a x was the maximum value of judgment matrix, and n was for judging the matrix order. C . I . = 0 means that the judgment matrix is completely consistent. The larger the C . I . , the more serious the inconsistency of the judgment matrix.
The random consistency ratio calculation formula can be expressed as:
C . R . = C . I . R . I .
Type, C . R . was the random consistency ratio, C . I . was the consistency indicator, and R . I . was the average random consistency indicator.
When C . R . < 0.1 , the judgment matrix was considered to meet the consistency requirements. Otherwise, the judgment matrix should be modified. Its consistency result is made to meet C . R . < 0.1 to ensure satisfactory consistency.
(2)
Overall hierarchical ordering and consistency test
The overall hierarchical ordering and consistency test is based on the results of the single sorting and consistency test. The consistency ratio calculation formula of the total hierarchical ranking can be expressed as:
C . R . = a 1 C . I . 1 + a 2 C . I . 2 + + a m C . I . m a 1 R . I . 1 + a 2 R . I . 2 + + a m R . I . m = C . I . R . I .
When C . R . < 0.1 , it is considered that the total ordering of the hierarchy passes the consistency test, otherwise the element values of the judgment matrix need to be readjusted. At this point, the final decision is made based on the overall ranking of the lowest layer.
In order to determine the difference in comparison with the previous C . R . , another formula for the overall hierarchical consistency ratio is used in this study; it is expressed as:
C . R . H = C . I . H R . I . H
where the C . I . H was the overall hierarchy consistency indicator, the R . I . H was the overall stochastic value, and the C . R . H was the overall hierarchical consistency ratio.

2.3. Fuzzy Comprehensive Evaluation Method

The FCE was a scientific and reasonable evaluation method to quantify the qualitative indicators. The FCE method has been validated as a scientific and rational assessment approach for quantifying qualitative metrics; it utilizes the concept of fuzzy relationship synthesis and can comprehensively and quantitatively evaluate factors that were difficult to quantitatively analyze. Its characteristic feature is its clear and systematic results, which provide better methods for solving various uncertainty problems. In 1965, Professor Chard et al. [36] proposed the concept of fuzzy set theory to express the uncertainty in the assessment process. Through the utilization of the FCE method, the factors that were difficult to analyze quantitatively were comprehensively and quantitatively evaluated, and various uncertainty problems could be better solved. With this method, the qualitative indicators can be quantified effectively, and the quantitative evaluation results can be obtained. The specific calculation steps are as follows.

2.3.1. Determine the Factor Universe of the Evaluated Content

Firstly, identify the factor universe of the assessed content. Assuming that the evaluated object contains P factors (or factors), the indicator set of the assessed object can be represented as:
U = u 1 , u 2 , u 3 , , u p
Type, p was the number of representative evaluation indicators.

2.3.2. Determine the Domain of Comment Level

This step was to determine the comment level domain of the FCE model. The comment level domain is a collection of comment levels, and each level can correspond to a fuzzy subset. Assuming that the comment level had an M level, the comment level universe of the evaluated object can be expressed as:
L = u 1 , u 2 , u 3 , , L m
Type, m represents the number of comment grades.

2.3.3. Constructing Judgment Matrix Based on Fuzzy Relation

After constructing fuzzy subsets, quantify the assessed content, determine the membership degree of each level of fuzzy subsets for the individual factor, and present the fuzzy relation matrix. The general expression of the fuzzy relation matrix is:
R = r 11 r 1 m r p 1 r p m                 p × m    
Type, r p m represents the p indicator pair number m of the degree of membership of the level.
r p m was calculated by membership function, and the membership degree of the indicators in the different reference values was calculated by the Delphi method. By issuing questionnaires, relevant experts were invited to score the inclusion of each secondary indicator relative to the benchmark value of the indicator. Finally, the membership degree of each secondary indicator was determined, and the fuzzy relation matrix was formed through sorting, summarizing, and normalizing the calculation.

2.3.4. Fuzzy Comprehensive Evaluation

After acquiring the fuzzy relation judgment matrix, multiply the matrix by the weight results of each first-level indicator and second-level indicator to obtain the FCE vector P. This process can be succinctly described as:
P = W × R = p 1 , p 2 , p 3 , , p n , i = 1 P i n = 1
Type, R is the fuzzy relation judgment matrix; W is the indicator weight.
This step was used to deal with each secondary indicator in the indicator system, and the calculation step of the first level was consistent with the secondary indicator. In the calculation process of the first-level indicator, the calculation results of the second-level indicator can be calculated and processed according to the known conditions.

2.3.5. Interpretation of Evaluation Results

The principle of the maximum membership degree principle was widely employed in the interpretation of the FCE results. However, this principle can only be applied to the qualitative analysis of the results, and it also cannot compare the differences between different factors for specific quantitative evaluation and analysis. Fuzzy vector singularization can be used to effectively solve the abovementioned problems with the results interpretation and the calculation method. The specific method was to multiply the membership score of the corresponding grade in fuzzy evaluation vector P by the normalized weight assignment in order to obtain the unified evaluation result.
Finally, through the comparison and analysis of the standardized results of the FCE vectors, the evaluation results of the various indicators and the influencing factors of aquaculture mechanization development were obtained; according to the evaluation results, the concrete improvement measures were put forward.

3. Results

3.1. Evaluation Indicator of Influencing Factors of Aquaculture Mechanization

3.1.1. Indicators Survey Results

The influencing factors of aquaculture mechanization were hierarchical and dynamic. They were affected and restricted by many factors, and finally, 18 effective factors were obtained. The environmental level was set as A: A1 realizes the sustainability of aquaculture (46.13%); A2 is the utilization rate of the aquaculture resources (43.77%); A3 is the energy consumption of the machinery and equipment (73.13%); A4 is the energy consumption type of the machinery and equipment (58.72%); A5 is the manufacture of the mechanical equipment (60.81%); and A6 is the purification needs of the aquaculture tail water (41.15%). On the economic level, it was set as B: B1 is the aquaculture cost management (47.28%); B2 is the aquaculture scale (small but scattered) (44.69%); B3 is the machinery purchase financial subsidy (70.64%); B4 is the advanced aquaculture technology and equipment (43.38%); B5 is the aquaculture machinery research investment (35.65%); and B6 is the government’s policy to benefit farmers (64.61%). At the social level, it was set as C: C1 is the aquaculture technology promotion and use (68.15%); C2 is the aquaculture innovative talent demand (55.96%); C3 is the practitioners’ policy awareness (38.27%); C4 is the intensive farming level (53.47%); C5 is the aquaculture labor resources (51.64%); and C6 is the practitioners’ technical training (51.25%). The image sets are shown in Figure 2.

3.1.2. Weight Calculation and Consistency Test

The weight results of each indicator were calculated, and the judgment matrix of the importance relationship among the indicators was constructed according to the questionnaire results; the normalized results of the indicators are shown in Table 2, Table 3, Table 4 and Table 5. The hierarchical single sorting and consistency test results of the first-level indicators and the second-level indicators are also reported in Table 2, Table 3, Table 4 and Table 5.
Then, the consistency of the judgment matrix results was checked. According to Formulas (1) and (2), the consistency of each matrix was acceptable. This means that it was the effective weight value of each evaluation factor W in the judgment matrix. Therefore, the weight value of the first-level indicators and the second-level indicators of W can be expressed as:
W T = 0.26   0.63   0.11
W T 1 = 0.08   0.05   0.45   0.17   0.21   0.04
W T 2 = 0.12   0.08   0.49   0.08   0.04   0.18
W T 3 = 0.45   0.19   0.04   0.12   0.11   0.09
Moreover, according to Formulas (3) and (4), the overall hierarchical ordering and the consistency test results were performed and can be expressed as:
C . R . H = 0.26 0.071 + 0.63 0.020 + 0.11 0.055 0.26 1.24 + 0.63 1.24 + 0.11 1.24 = 0.029
where the C . R . H < 0.1; the overall hierarchical consistency was acceptable. The weights of other the indicators were calculated according to the above methods, and all the outcomes passed the consistency assessment. Taking into account the aforementioned analysis and computation, the final evaluation indicator system of the influencing factors of Chinese aquaculture mechanization development included 3 first-class indicators and 18 second-class indicators. The reference values of each indicator and the calculation results of each indicator weight are shown in Table 6.

3.2. Case Analysis—Taking Liaoning Province as an Example

Liaoning Province is one of the major provinces in China for aquaculture and is also a major province for the manufacturing of aquaculture machinery. The aquaculture machinery is developed, and the supporting facilities are complete. The overall mechanization level of aquaculture in the province has reached over 50%. There are many large aquaculture enterprises and aquaculture machinery manufacturing enterprises in the province. Therefore, based on the availability of the data, Liaoning Province is taken as an example to evaluate the importance of the influencing factors of aquaculture mechanization development.

Calculation of Fuzzy Comprehensive Evaluation Method

The questionnaire survey method was used to continue to invite the members of the expert group to rate the membership degree of each secondary indicator in the third-level comment grade. All the experts’ scores were standardized to ascertain the overall level of association with each sub-indicator in the three comment grades. The normalized results of the secondary indicator membership degree are shown in Table 7.
According to the results in Table 4 and Formula (5), the fuzzy relation judgment matrix of the first-class indicator can be obtained. Using the example of the first-level indicator of the economic impact factors, the fuzzy relational judgment matrix can be represented as:
R E = 0.3 0.6 0.1 0.3 0.6 0.1 0   1   0 0 1 0 0 0.8 0.2 0 0.8 0.2
Multiply the obtained fuzzy relation judgment matrix of each first-level indicator by the indicator weight. Taking the first-level indicator of the economic factors as a case in point, the weights of its three second-level indicators can be expressed as vectors:
W E = 0.076   0.051   0.45   0.17   0.21   0.037
According to calculation Formula (6), the FCE vector of the first-level indicator of the economic level can be obtained. Taking the economic level indicator P E as an example, its FCE vector is:
P E = 0.038   0.90   0.062
The FCE results of each first-class indicator of the influencing factors of aquaculture mechanization development in China are presented in Table 8.
According to the results in Table 5, Formula (6) is applied to calculate the fuzzy comprehensive evaluation vector P of the influencing factors of aquaculture mechanization development in China, which are:
P = 0.35   0.58   0.07
Assign q 1 = 3, q 2 = 2, and q 3 = 1 to the weights of the three grades. Through the analysis of the assignment, it was concluded that the resulting interval of the fuzzy vector uniformization was between [1,2,3]. According to this interval, the single score range of the third-level evaluation results was evenly divided, and the allocation and scoring range for the third-level evaluation results are presented in Table 9.
According to the normalization calculation of the FCE vector, the comprehensive evaluation outcomes of the factors influencing the development of aquaculture mechanization in China are as outlined:
V = 2.28
Based on the findings presented in Table 5, the FCE vector of the first-class indicator of the influencing factors of aquaculture mechanization in China was calculated in a single way. At the same time, the comparison in Table 3 determined the evaluation grade of the aquaculture mechanization factors of the first-level indicator, and the calculation results and evaluation results are shown in Table 10.
According to the analysis results, the importance of the impacts among the different levels was economic, environmental, and social. In China, the top three influencing factors of aquaculture mechanization were A3: energy consumption of machinery and equipment; B3: financial subsidy for machinery purchase; and C1: promotion and use of aquaculture technology. The evaluation results of this study were largely in line with the existing production practices of the Chinese aquaculture industry, demonstrating the scientific validity of the evaluation system and the influencing factor methods, which were feasible and operable. Therefore, the financial subsidy for the purchase of aquaculture machinery, the energy consumption of the machinery and equipment, and the promotion and use of aquaculture technology were the effective improvement measures for the development of aquaculture mechanization in Liaoning Province at this stage.

4. Discussion

4.1. Domestic and Foreign Aquaculture Financial Policies

At present, the focus of the financial policies related to aquaculture in developed countries has changed from monoculture to diversification. Financial support, technical support, and talent support have been realized, and the scientific development of aquaculture mechanization has been given significant attention. Financial subsidies for aquaculture facilities are highly valued by some developed countries and regional governments. In addition to equipment subsidies for farmers, insurance support, administrative expenses subsidies, and credit support are provided in Japan [37]. Similarly, in the United States, financial subsidies and tax incentives have been provided, and the development and promotion of high-performance marine aquaculture equipment has been supported, such as in the research and development of large-scale storm-resistant cage equipment and deep-sea facilities [38], etc. Zambia has tried out and popularized the inclusive business model. The opportunities for investment, micro-credit, training, and the export of fishery facilities and equipment were increased. In addition, farmers who were interested in aquaculture were given technical training in aquaculture methods and provided with incentives or necessary support [39].
In conclusion, a variety of targeted improvement measures have been proposed for the mechanization of aquaculture, but more horizontal strategies are needed. These strategies will include policies, financing, training, infrastructure, and scientific elements to solve the difficulties faced by fishery farmers. In recent years, Liaoning Province has lacked funds and supporting policies for new machines and tools. In terms of investment in aquaculture technology promotion, about CNY 83.03 million was invested in Liaoning Province in 2020; thus, it ranked 17th in China. The infrastructure of the promotion system was relatively backward. The original value of the experimental equipment was only CNY 61.93 million, which was far lower than that of Jiangsu, Zhejiang, Guangdong and other strong marine fishery provinces [40]. In Liaoning Province, the number of subsidies for new equipment should be increased to guide farmers in using mechanical equipment such as oxygenation, feeding, catching, dredging, and water purification. Preferential policies such as interest discounts, tax reductions, and tax exemptions should be applied to financial institutions supporting the development of fishery mechanization in order to convince financial institutions to issue loans for fishery equipment [41]. At the same time, incentive measures should be formulated by the government; financial institutions that support the development of fishing machines should be rewarded; and modern publicity methods should be used to do a good job in the interpretation of fishing machine purchase subsidy policies and public opinion guidance [42]. For example, professionals should be organized to do a good job in policy consultation, in the application for operation procedures, in the steps of the purchase subsidy policy, etc.

4.2. Innovative Research and Development of Aquaculture Machinery and Equipment

In addition, in order to establish a precise facility and equipment system, such as fry loading and unloading and weighing and placing systems, measures to increase the research and development of new fishing equipment in Liaoning Province should be implemented, and a batch of advanced and applicable mechanical equipment should be developed. At the same time, the ability to fight against disaster risks should be strengthened, and the problems of fry weighing and the loading and unloading of vehicles in the process of breeding and releasing should be solved to achieve a labor-saving, accurate, safe, and efficient mechanization era [43]. By 2025, China’s aquaculture mechanization level needs to reach more than 50%. It is essential to enhance investment in the facilities and equipment for critical areas such as breeding and seedling cultivation, epidemic prevention and treatment, planting and harvesting, and tail water treatment [44]. For example, the research and development of new equipment, such as the precise management and control of pond culture, efficient catching, light and simplified seedling planting and harvesting in raft culture, the counting and sorting of seedlings, and the harmless treatment of sick and dead aquatic products, should be focused on. Complete sets of technical facilities and equipment, such as large-scale intelligent aquaculture in the deep sea, deep-water anti-wind and wave cage aquaculture, factory aquaculture, container aquaculture and pond engineering circulating water aquaculture, should be improved [45]. At present, the scientific and technological level of Liaoning fishery production has been improved, and the cooperation between enterprises and scientific research institutions has brought new impetus to the research and development of new aquaculture equipment [46].
In a word, a marine fishery research base and innovation platform in Liaoning Province should be established. Resources in the field of fishery scientific research, such as marine universities and fishery scientific research institutions, should be integrated so that they can fully cooperate, give full play to their own advantages, and create a fishery science and technology innovation center with domestic and even international influence. Liaoning aquaculture industry will further accelerate the digital transformation of aquaculture modes such as factories, net cages, ponds, rice, and fisheries and promote the application of technologies such as the online monitoring of water quality, intelligent oxygenation, precise feeding, and the intelligent treatment of circulating water [47]. In the future, aquaculture facilities and equipment will transition towards mechanized research and comprehensive application and intelligent, information-based, and efficient aquaculture equipment, and the development of green, efficient, accurate, and intelligent fisheries will become a new development trend.

4.3. Financial Subsidies for the Purchase of Agricultural Machinery

Agricultural mechanization is the key to the comprehensive transition from traditional agriculture to modern agriculture. In order to promote the development of agricultural mechanization, China clearly stipulates that the government should arrange special funds separately to provide subsidies to farmers and agricultural production and operation organizations for purchasing advanced and applicable agricultural machinery supported and promoted by the state. The best cotton subsidy in Xinjiang is the mechanical subsidy. Xinjiang cotton has a large scale and high degree of mechanization, and the efficient utilization of mechanized facilities has a significant impact on cotton production. Therefore, the government established a special fund to strengthen the research and development of machinery, to support farmers in purchasing mechanical equipment, and to accelerate the process of modernization construction [48]. Hence, the implementation of financial subsidies for the purchase of agricultural machinery has significantly increased the investment in agricultural machinery. The substitution of agricultural machinery for labor will also drive enhancements in agricultural production efficiency and greatly stimulate the enthusiasm of farmers to purchase advanced and applicable agricultural machinery. This will improve the level of agricultural machinery equipment in China, drive the advancement of agricultural mechanization, liberate rural labor, promote grain production and farmers’ income, and strengthen the foundation of agricultural mechanization; significant progress has been made in advancing the growth of the agricultural machinery sector and other aspects. The enhancement of agricultural productivity and income is intricately linked to the mechanization of agriculture. The Indian government has considered net agricultural income, household income, and household consumption, and has offered timely subsidies for machinery purchase subsidies to enable small farmers to access agricultural credit. The utilization of machinery has resulted in a 31% increase in agricultural net income, a 19% increase in household income, and a 19% increase in food consumption [49]. The Russian government has driven local farmers’ ability to purchase advanced agricultural machinery through customized financial subsidy plans, increasing their willingness to use and purchase agricultural machinery [50]. Given the significant positive impact of agricultural mechanization, it is necessary to deepen the development of low-cost and suitable agricultural machinery for small farmers.

5. Conclusions

According to the characteristics of aquaculture mechanization in China, the evaluation indicator system of 18 influencing factors at 3 levels was screened out by a literature search, the Delphi method, and the AHP in this study. Through the FCE method, the research found that the economic level was the most critical factor in the development of mechanization in aquaculture. The financial subsidy for the purchase of aquaculture machinery, the energy consumption of machinery and equipment, and the promotion and use of aquaculture technology were the deepest factors and had the greatest impact on the development of aquaculture mechanization in China. In future, the emphasis will be on promoting mechanized equipment, such as high-density recirculating aquaculture for pond farming, factory circulating water aquaculture, deep-sea anti-wind and wave cages, etc.; this equipment occupies a small area, has high unit output, and is environmentally friendly. The technology of fishery equipment and aquaculture efficiency will be further improved, and the effective collection of aquaculture tail water, solid waste, and water resources recycling will be further strengthened to achieve an ecological, mechanized, and intelligent sustainable aquaculture mode.

Author Contributions

Investigation, formal analysis, writing—review and editing, L.Y.; investigation, writing—original Draft, H.W.; investigation, formal analysis, A.R.; investigation, formal analysis, F.H.; investigation, formal analysis, F.J.; writing—review and editing, funding acquisition, H.H.; supervision, Y.L. All authors have read and agreed to the published version of the manuscript.

Funding

This study was supported by the project of the Youth Foundation of the Department of Education of Liaoning Province [LJKQZ2021123], the earmarked fund for the Modern Agro-industry Technology Research System [CARS-49], and the Innovation and Entrepreneurship Project for High-Level Talents of Dalian [2020RQ109].

Institutional Review Board Statement

Not applicable.

Informed Consent Statement

Informed consent was obtained from all subjects involved in the study.

Data Availability Statement

Data are contained within the article.

Acknowledgments

We thank the editors and reviewers for their contributions to the publication of this study.

Conflicts of Interest

The authors declare that they have no known competing financial interests or personal relationships that could have appeared to influence the work reported in this paper; the authors declare the following financial interests/personal relationships which may be considered as potential competing interests; the researcher claims no conflicts of interests.

References

  1. Li, X.; Li, J.; Wang, Y.; Fu, L.; Fu, Y.; Li, B.; Jiao, B. Aquaculture industry in China: Current state, challenges, and outlook. Rev. Fish. Sci. 2011, 19, 187–200. [Google Scholar] [CrossRef]
  2. Newton, R.; Zhang, W.; Xian, Z.; McAdam, B.; Little, D.C. Intensification, regulation and diversification: The changing face of inland aquaculture in China. Ambio 2021, 50, 1739–1756. [Google Scholar] [CrossRef]
  3. FAO. World Fisheries and Aquaculture Status: Sustainable Development in Action; FAO: Rome, Italy, 2020. [Google Scholar] [CrossRef]
  4. Liu, Z.; Li, S.; Sun, L.; Guo, Y.; Zhao, W.; Xu, L.; Wu, F.; Yu, X.; Wang, D. China Fishery Statistical Yearbook; China Agriculture Press: Beijing, China, 2011–2021. [Google Scholar]
  5. Fei, R.; Wang, H.; Wen, Z.; Yuan, Z.; Yuan, K.; Chunga, J. Tracking factor substitution and the rebound effect of China’s agricultural energy consumption: A new research perspective from asymmetric response. Energy 2021, 216, 119307. [Google Scholar] [CrossRef]
  6. Cao, T.; Zhao, X.; Yang, Y.; Zhu, C.; Xu, Z. Adaptive Recognition of Bioacoustic Signals in Smart Aquaculture Engineering Based on r-Sigmoid and Higher-Order Cumulants. Sensors 2022, 22, 2277. [Google Scholar] [CrossRef] [PubMed]
  7. Xu, H.; Zhang, J.H.; Ding, J.L. The review of the research progress of fishery equipment and engineering technology at home and abroad. Fish Mod. 2010, 37, 1–8. [Google Scholar]
  8. Wei, Y.; Wei, Q.; An, D. Intelligent monitoring and control technologies of open sea cage culture: A review. Comput. Electron. Agric. 2020, 169, 105119. [Google Scholar] [CrossRef]
  9. Prem, R.; Tewari, V.K. Development of human-powered fish feeding machine for freshwater aquaculture farms of developing countries. Aquac. Eng. 2020, 88, 102028. [Google Scholar] [CrossRef]
  10. Huang, Y.X.; Xu, H.; Ding, J.L. Situation of China land-based aquaculture engineering equipment and suggestion for its development. Guizhou Agric. Sci. 2016, 44, 87–91. [Google Scholar]
  11. Wang, P.; Ji, J.; Zhang, Y. Aquaculture extension system in China: Development, challenges, and prospects. Aquac. Rep. 2020, 17, 100339. [Google Scholar] [CrossRef]
  12. ICLARM. Genetic Improvement of Carp Species in Asia: Final Report to the Asian Development Bank; Regional Technical Assistance No. 5711; International Centre for Living Aquatic Resources Management: Penang, Malaysia, 2001. [Google Scholar]
  13. Sharma, K.K.; Bikash, S.; Chand, S. A mechanized harvest system for freshwater fishpond. Aquac. Eng. 2009, 41, 147–151. [Google Scholar] [CrossRef]
  14. Liu, S.; Tian, X.; Xiong, Y.; Zhang, Y.; Tanikawa, H. Challenges towards carbon dioxide emissions peak under in-depth socioeconomic transition in China: Insights from shanghai. J. Clean. Prod. 2020, 247, 119083. [Google Scholar] [CrossRef]
  15. Peter, E. Aquaculture environment interactions: Past, present and likely future trends. Aquaculture 2015, 447, 2–14. [Google Scholar]
  16. Simbeye, D.S.; Yang, S.F. Water quality monitoring and control for aquaculture based on wireless sensor networks. J. Netw. 2014, 9, 840. [Google Scholar] [CrossRef]
  17. Li, D.L.; Liu, C. Recent advances and future outlook for artificial intelligence in aquaculture. Smart Agric. 2020, 2, 1. [Google Scholar]
  18. Hu, F.; Zhong, H.; Wu, C.; Wang, S.; Guo, Z.; Tao, M.; Zhang, C.; Gong, D.; Gao, X.; Tang, C.; et al. Development of fisheries in China. Reprod. Breed. 2021, 1, 64–79. [Google Scholar] [CrossRef]
  19. Wang, C.; Li, Z.; Wang, T.; Xu, X.; Zhang, X.; Li, D. Intelligent fish farm—The future of aquaculture. Aquac. Int. 2021, 29, 2681–2711. [Google Scholar] [CrossRef]
  20. Naylor, R.L.; Hardy, R.W.; Buschmann, A.H.; Bush, S.R.; Cao, L.; Klinger, D.H.; Little, D.C.; Lubchenco, J.; Shumway, S.E.; Troell, M. A 20-year retrospective review of global aquaculture. Nature 2021, 591, 551–563. [Google Scholar] [CrossRef]
  21. Landeta, J. Current validity of the Delphi method in social sciences. Technol. Forecast. Soc. 2006, 73, 467–482. [Google Scholar] [CrossRef]
  22. Lucia, B.D.V.; Hans, S.; Laura, S. Prioritization of fish welfare issues in European salmonid aquaculture using the Delphi method. Aquaculture 2023, 572, 739557. [Google Scholar] [CrossRef]
  23. Anna, H.; Kruno, B.; Tom, C.; Collins, K.; da Costa, F.; Debney, A.; van Duren, L.; Elzinga, J.; Fariñas-Franco, J.M.; Gamble, C.; et al. Site selection for European native oyster (Ostrea edulis) habitat restoration projects: An expert-derived consensus. Aquat. Conserv. Mar. Freshw. Ecosyst. 2023, 33, 721–736. [Google Scholar] [CrossRef]
  24. Olson, K. An examination of questionnaire evaluation by expert reviewers. Field Methods 2010, 22, 295–318. [Google Scholar] [CrossRef]
  25. Alphonce, C.B. Application of the analytic hierarchy process in agriculture in developing countries. Agric. Syst. 1997, 53, 97–112. [Google Scholar] [CrossRef]
  26. Francisco, K.; Concepcion, R.; Relano, R.J.; Enriquez, M.L.; Baun, J.J.; Mayol, A.P.; Española, J.; Vicerra, R.R.; Bandala, A.; Dadios, E.; et al. Analytical Hierarchical Process-based Material Selection for Trailer Body Frame of an Underground Imaging System. In Proceedings of the 2021 IEEE 13th International Conference on Humanoid, Nanotechnology, Information Technology, Communication and Control, Environment, and Management (HNICEM), Manila, Philippines, 28–30 November 2021; pp. 1–6. [Google Scholar]
  27. Du, Y.; Zheng, Y.; Wu, G.; Tang, Y. Decision-making method of heavy-duty machine tool remanufacturing based on AHP-entropy weight and extension theory. J. Clean. Prod. 2020, 252, 119607. [Google Scholar] [CrossRef]
  28. Du, Y.; Cao, H.; Liu, F.; Li, C.; Chen, X. An integrated method for evaluating the remanufacturability of used machine tool. J. Clean. Prod. 2012, 20, 82–91. [Google Scholar] [CrossRef]
  29. Zadeh, K.N.; Anderson, S.W. Sensitivity Analysis in Optimal Simultaneous Power Interchange. IEEE Trans. Power Appar. Syst. 1978, 97, 2405–2415. [Google Scholar] [CrossRef]
  30. Wang, X.; Zhang, H.; Li, M.; Li, Y. Research on Interference Optimization Mechanism of Wireless Routing Signal Transmission Based on Fuzzy Comprehensive Evaluation Method. Int. J. Online Eng. 2017, 13, 136–148. [Google Scholar] [CrossRef]
  31. Shi, C.; Zhang, K.; Ruan, J. Fuzzy comprehensive evaluation on the sustainable development of equipment manufacturing industry based on improved algorithm. In Proceedings of the 2009 Third International Symposium on Intelligent Information Technology Application Workshops, Nanchang, China, 21–22 November 2009; pp. 173–177. [Google Scholar]
  32. Zhao, L.; Cheng, X.; Yao, Y. Online Intelligent Evaluation of Dispensing Quality Based on Entropy Weight Fuzzy Comprehensive Evaluation Method and Machine Learning. In Proceedings of the 2020 International Conference on Sensing, Measurement & Data Analytics in the Era of Artificial Intelligence (ICSMD), Xi’an, China, 15–17 October 2020; pp. 491–495. [Google Scholar]
  33. Ren, A.Q.; Zhao, X.T.; Liu, Q.; Yu, L.; Han, F.; Jia, F.; Hou, H.; Liu, Y. Green Supplier Assessment and Selection for Sea Cucumber (Apostichopus japonicus) Processing Enterprise: Case Study in China. Sustainability 2023, 15, 15368. [Google Scholar] [CrossRef]
  34. Hou, H.C.; Shao, S.; Zhang, Y.; Sun, D.; Yang, Q.; Qin, C.; Sun, X. Cleaner Production assessment for sea cucumber aquaculture: Methodology and case studies in Dalian, China. Clean Technol. Environ. Policy 2019, 21, 1751–1763. [Google Scholar] [CrossRef]
  35. Chen, W.S.; Li, J. Safety performance monitoring and measurement of civil aviation unit. J. Air Transp. Manag. 2016, 57, 228–233. [Google Scholar] [CrossRef]
  36. Zhang, K.; Si, B.F. The Application of Fuzzy Comprehensive Evaluation Method Based on AHP on the Distribution of Rail Transport. Appl. Mech. Mater. 2014, 2916, 1379–1382. [Google Scholar] [CrossRef]
  37. Engle, C.R.; Stone, N.M. Competitiveness of US aquaculture within the current US regulatory framework. Aquac. Econ. Manag. 2013, 17, 251–280. [Google Scholar] [CrossRef]
  38. Avadí, A.; Cole, S.M.; Kruijssen, F.; Dabat, M.-H.; Mungule, C.M. How to enhance the sustainability and inclusiveness of smallholder aquaculture production systems in Zambia. Aquaculture 2022, 547, 737494. [Google Scholar] [CrossRef]
  39. Adekola, K.A.; Alabadan, B.A.; Akinyemi, T.A. China Agricultural mechanization development experience for developing countries. Int. J. Agric. Innov. Res. 2014, 3, 655–658. [Google Scholar]
  40. Guan, H.; Sun, Z.; Wang, J. Decoupling Analysis of Net Carbon Emissions and Economic Growth of Marine Aquaculture. Sustainability 2022, 14, 5886. [Google Scholar] [CrossRef]
  41. Spiertz, J.H.J. Nitrogen, sustainable agriculture and food security. A review. Agron. Sustain. Dev. 2010, 30, 43–55. [Google Scholar] [CrossRef]
  42. Tuo, G. How to promote agricultural insurance in China. China Agric. Econ. Rev. 2016, 8, 194–205. [Google Scholar] [CrossRef]
  43. Huang, J.; Yang, G. Understanding recent challenges and new food policy in China. Glob. Food Secur. 2017, 12, 119–126. [Google Scholar] [CrossRef]
  44. Wang, G.; Hu, L.; Long, W.; Jiang, L. Evolution of Intelligent Feeding System for Aquaculture: A Review. In Proceedings of the 2021 3rd International Conference on Artificial Intelligence and Advanced Manufacture (AIAM), Manchester, UK, 23–25 October 2021; pp. 392–397. [Google Scholar]
  45. Lee, P.G. Process control and artificial intelligence software for aquaculture. Aquac. Eng. 2000, 23, 13–36. [Google Scholar] [CrossRef]
  46. Ji, J.; Guo, X.; Zhang, Y. The study of symbiotic relationships between the economic and the ecological system of China’s mariculture industry—An empirical analysis of 10 coastal regions with Lokta–Volterra model. Reg. Stud. Mar. Sci. 2021, 48, 102051. [Google Scholar] [CrossRef]
  47. Jothiswaran, V.V.; Velumani, T.; Jayaraman, R. Application of artificial intelligence in fisheries and aquaculture. Biot. Res. Today 2022, 2, 499–502. [Google Scholar]
  48. Wang, X.Y.; Tan, Y.W.; Li, Y.H. The best choice of cotton subsidy modes based on principal component regression in Xin Jiang, China. In Intelligent Decision Making System; World Scientific: Singapore, 2010; pp. 544–549. [Google Scholar] [CrossRef]
  49. Jena, P.R.; Tanti, P.C. Effect of farm machinery adoption on household income and food security: Evidence from a nationwide household survey in India. Front. Sustain. Food Syst. 2023, 7, 922038. [Google Scholar] [CrossRef]
  50. Boiarskii, B.; Hasegawa, H.; Lioude, A.; Kolesnikova, E.; Sinegovskaia, V. Current Situation and Perspectives for Soybean Production in Amur Region, Russian Federation. AMA Agric. Mech. Asia Afr. Lat. Am. 2020, 51, 33–38. [Google Scholar]
Figure 1. Overall flow chart of aquaculture mechanization development.
Agriengineering 06 00003 g001
Figure 2. Composite structure diagram of influencing factors.
Agriengineering 06 00003 g002
Table 1. The description of influencing indicator system of mechanization development in China.
First-Level IndicatorsSecond-Level IndicatorsImplication
A EnvironmentA1 Realize the sustainability of aquacultureThe key to harmony between man and nature was to achieve green development, low-carbon development, and sustainable development of aquaculture.
A2 Utilization rate of aquaculture resourcesUtilization of aquaculture resources was the maximum recycling.
A3 Energy consumption of machinery and equipmentMechanized and automated farming would produce a large amount of carbon emissions, and the increase in energy consumption would cause certain environmental pollution.
A4 Energy consumption type of machinery and equipmentThere are many types of machinery, which can be classified according to their scope, functions, and functions.
A5 Manufacture mechanical equipmentEquipment will produce certain pollution and energy consumption during processing.
A6 Purification needs of aquaculture tail waterThe pollution problem of aquatic industry was most prominent in tail water discharge, which seriously restricts the harmonious development of ecology and green development.
B EconomyB1 Aquaculture cost managementTraditional aquaculture is characterized by high labor intensity, low efficiency, and high cost.
B2 Aquaculture scale (small but scattered)Traditional aquaculture is small in scale and scattered in the culture, which leads to low output.
B3 Machinery purchase financial subsidyFarmers purchased fishing machines through government subsidies to improve production efficiency.
B4 Aquaculture advanced technology and equipmentAquaculture mechanization technology played an important role in fishery economy and ecology.
B5 Aquaculture machinery research investmentIncrease the investment in scientific research of aquaculture facilities and equipment to promote the high-quality and efficient development of agricultural mechanization.
B6 Government policy to benefit farmersThe government preferential agriculture policy was a convenient policy to promote the development of aquaculture mechanization.
C SocietyC1 Aquaculture technology promotion and useWe should strengthen training, update farming concepts, strengthen technical management, and encourage the application of new technologies.
C2 Aquaculture innovative talent demandThose with innovative spirit, innovative ability, and practical ability are those who discover new problems, solve new problems, invent new things, and open up innovative fields.
C3 Practitioners’ policy awarenessMost of the farmers’ cultural quality was not high, and the ability to accept new things, new technologies, and new achievements was quite different from their own needs.
C4 Intensive farming levelIntensive farming was the maximization of the comprehensive benefits of production increase, energy conservation, and emissions reduction. Guiding farmers to develop intensive farming was an important way to achieve economies of scale.
C5 Aquaculture labor resourcesIn the main production process, traditional aquaculture still needs to be managed by experienced workers, which leads to a labor force shortage.
C6 Practitioners’ technical trainingWe will increase the technical training of aquaculture practitioners, standardize the behavior of aquaculture farmers, improve the quality of aquatic products, and promote the green development of aquatic products.
Table 2. Judgment matrix and normalized results of first-level indicators.
IndicatorsEnvironmentEconomySocietyNormalized Result
Environment11/330.2604
Economy3150.6333
Society1/31/510.1061
λ m a x = 3.0387 R . I . = 0.58 C . I . = 0.019 C . R . = 0.033 < 0.1
Table 3. Judgment matrix and normalized results of second-level indicators (environment).
IndicatorsA1A2A3A4A5A6Normalized Result
A1121/61/41/430.08
A21/211/71/41/520.05
A36714470.45
A4441/411/250.17
A5451/42150.21
A61/31/21/71/51/510.04
λ m a x = 6.3531   R . I . = 1.24   C . I . = 0.071   C . R . = 0.057 < 0.1
Table 4. Judgment matrix and normalized results of second-level indicators (economy).
IndicatorsB1B2B3B4B5B6Normalized Result
B1121/6241/50.12
B21/211/6131/50.08
B36616730.49
B41/211/6131/60.08
B51/41/31/71/311/60.04
B6551/31/61/610.18
λ m a x = 6.1014   R . I . = 1.24   C . I . = 0.020   C . R . = 0.016 < 0.1
Table 5. Judgment matrix and normalized results of second-level (society).
IndicatorsC1C2C3C4C5C6Normalized Result
C11464550.45
C21/4152230.19
C31/61/511/41/41/40.04
C41/41/241120.12
C51/51/241110.11
C61/51/341/2110.09
λ m a x = 6.2747   R . I . = 1.24   C . I . = 0.055   C . R . = 0.044 < 0.1
Table 6. Evaluation indicator system of influencing factors of aquaculture mechanization development in China.
Primary IndicatorWeight ValueSerial NumberSecondary IndicatorWeight Value
Environment0.261Realization of the sustainability of aquaculture0.08
2Utilization rate of aquaculture resources0.05
3Energy consumption of machinery and equipment0.45
4Energy consumption type of machinery and equipment0.17
5Manufacture of mechanical equipment0.21
6Purification needs of aquaculture tail water0.04
Economy0.637Aquaculture cost management0.12
8Aquaculture scale (small but scattered)0.08
9Machinery purchase financial subsidy0.49
10Aquaculture advanced technology and equipment0.08
11Aquaculture machinery research investment0.04
12Government policy to benefit farmers0.18
Society0.1113Aquaculture technology promotion and use0.45
14Aquaculture innovative talent demand0.19
15Practitioners’ policy awareness0.04
16Intensive farming level0.12
17Aquaculture labor resources0.11
18Practitioners’ technical training0.09
Table 7. Normalized results of secondary indicator membership degree of influencing factors of aquaculture mechanization development in China.
Secondary IndicatorMembership Normalization Result
L1L2L3
Realization of the sustainability of aquaculture0.30.60.1
Utilization rate of aquaculture resources0.30.60.1
Energy consumption of machinery and equipment010
Energy consumption type of machinery and equipment010
Manufacture of mechanical equipment00.80.2
Purification needs of aquaculture tail water00.80.2
Aquaculture cost management00.80.2
Aquaculture scale (small but scattered)010
Machinery purchase financial subsidy100
Aquaculture advanced technology and equipment00.80.2
Aquaculture machinery research investment001
Government policy to benefit farmers0.20.80
Aquaculture technology promotion and use010
Aquaculture innovative talent demand010
Practitioners’ policy awareness00.60.4
Intensive farming level00.80.2
Aquaculture labor resources00.80.2
Practitioners’ technical training0.20.80
Table 8. FCE results of first-level indicators.
Primary IndicatorFuzzy Comprehensive Evaluation Vector Result
Environment(0.038 0.90 0.062)
Economy(0.53 0.39 0.08)
Society(0.018 0.921 0.061)
Table 9. Table of fuzzy vector interval between evaluation grade, grade assignment, and uniformization result.
Primary IndicatorFuzzy Comprehensive Evaluation Vector Result
Environment(0.038 0.90 0.062)
Economy(0.53 0.39 0.08)
Society(0.018 0.921 0.061)
Table 10. Comparison table of single-value results and evaluation grades of first-level indicators.
Primary IndicatorCalculation ResultComment Grade
Environmental level1.98L2
Economic level2.45L1
Social level1.96L2
Disclaimer/Publisher’s Note: The statements, opinions and data contained in all publications are solely those of the individual author(s) and contributor(s) and not of MDPI and/or the editor(s). MDPI and/or the editor(s) disclaim responsibility for any injury to people or property resulting from any ideas, methods, instructions or products referred to in the content.

