Article

Post-Harvest Management of Immature (Green and Semi-Green) Soybeans: Effect of Drying and Storage Conditions (Temperature, Light, and Aeration) on Color and Oil Quality

1
Department of Agricultural and Biosystems Engineering, North Dakota State University, Fargo, ND 58102, USA
2
Carrington Research Extension Center, North Dakota State University, Carrington, ND 58421, USA
*
Author to whom correspondence should be addressed.
Submission received: 2 November 2023 / Revised: 29 December 2023 / Accepted: 9 January 2024 / Published: 15 January 2024

Abstract

:
Soybean downgrading due to immature (green and semi-green) color at harvest, caused by frost conditions, poses a significant loss to producers and processors. After harvest, drying and storage are important for preserving the quality of the harvested produce. This study investigated the impact of drying on color change in harvested immature soybeans and the effect of the soybean moisture content, storage environment (temperature, light, and aeration), and storage period on color change and oil quality of immature soybeans. Soybeans were harvested at three different maturity stages: R6 (green) and R7 (semi-green) in pods and R8 (fully matured) in seed. The soybeans in pods were dried, shelled, and conditioned to moisture contents of 12% and 17% (wet basis) prior to storage in 12 storage chamber (box) environments. The chambers were built to have four environments of “light” and “no light” with and without aeration and were stored at temperatures of either 4 °C or 23.5 °C for 24 weeks. Samples were taken every 2 weeks for 2 months and then bimonthly in storage. Soybean color change during drying and their chlorophyll, color, peroxide value (PV), and free fatty acid (FFA) status in storage were determined. Visual observation showed that R6 (green) soybean color faded after 48 h drying, which was supported with a colorimeter reading as the “a” value increased from −8.89 to −3.83 and −8.89 to −1.71 with 37 °C and 27 °C drying temperatures, respectively. The ANOVA analysis showed that light had the greatest contribution (~81%) to the color change compared to the other three storage environment factors of temperature (~9.1%), aeration (~8%), and moisture content (~1.5%) with <10% separate effects. During storage, the R6 green and R7 semi-green soybean color continued to fade with color a-values that exceeded the initial values of the R8 matured (control) by 353% and 350%, respectively, by the end of the storage period. Low amounts of peroxide and free fatty acids (FFA) were recorded throughout the storage period. Only the FFA of 17% M.C. soybeans stored at 23.5 °C exceeded acceptable limits at the end of the storage period. Exposing immature (green and semi-green) soybeans to light resulted in the fading of the green color. Seed producers in regions prone to frost can extend harvest time by allowing immature soybeans to field-dry.

1. Introduction

Revenue generation from the United States (U.S.) soybean [Glycine max (L.) Merr] significantly surpassed other US agricultural export commodities with a value of USD 34.3 billion dollars in the year 2022 [1]. The global demand for this oilseed is based on its versatility as a plant-based protein source for humans and livestock, vegetable oil for food, cosmetics, and the growing biodiesel market.
The U.S. soybean market has been dominant due to its grain quality standards. According to the U.S. Federal Grain Inspection Service (FGIS), market and trade assessment of soybeans is based on the test weight, heat damage, total damage, foreign material, splits, and soybeans of other colors (SBOC) [2]. SBOC include seeds with black or bicolored coats and those with green color both in the cross-section and in the outer coat, which do not meet the requirement of mature yellow soybean color [3]. Environmental conditions such as early frost, cold, and freezing temperatures during late seed maturation result in immature (green and semi-green) seeds at harvest. This happens when soybeans are at the R6 (green) and R7 (semi-green) maturity stages before full maturity is attained at R8 (fully matured). Some studies indicate minimal effects on seed quality provided the soybean plant is at the R7 maturity stage prior to the frost [4,5]. However, when the soybean plant is at the R6 maturity stage, frost has been reported to be detrimental to the seed quality in terms of color and composition; the extent of seed quality damage is highly dependent on the severity of the freeze [6]. The seed weight, moisture content, protein and oil concentration, chlorophyll content, vigor, and germination are also affected [7].
While environmental conditions play a huge role in the outcome of seed color at maturity, seed genetics also affect soybean color at maturity. Recently, a new rule was issued by the United States Department of Agriculture (USDA) officially removing SBOC as an official grain grading factor [8]. This new change was permitted due to genetic factors causing some varieties of soybeans to be characterized with some amount of green and other colors of the soybean seed coat. Despite this new rule, soybeans with green color in the seed coat and the cross-section, caused by a frost, exceeding 10% of total shipment are still undesirable at the point of sale leading to dockage. The dockage of the green soybean seeds is higher when the green discoloration is observed both on the outer seed coat and the inner cut cross-section cotyledon of the seeds [9]. In this case, the seeds are graded as “damaged kernels or immature” by the Canadian Grain Commission [10]. In a scenario where the green color is only superficial, they are labeled as “lacking natural good color” but with very little dockage [11] and it is expected that the green color will disappear in storage [12].
Some of the techniques for color measurement include colorimetrics, the Munsell color notation system, and reflectance spectrophotometry [13]. The color of food materials is denoted by using color models. Common color models used in industries are RGB, XYZ, and L a b. The L a b model separates the component of color into a three-dimensional scale [14,15,16]. It has become the most widely accepted and used coloring model because of the uniformity in the scale of colors. The green color of immature seeds indicates the presence of chlorophyll. The presence of chlorophyll in soybeans increases oil processing costs due to the need for refinement of the green oil. Chlorophyll in the extracted oil makes it susceptible to oxidation and rancidity, thereby reducing the shelf life [17].
Post-harvest management of soybeans is dependent upon the duration and conditions of storage [18]. The factors that affect the storability of soybeans include temperature, seed moisture content, relative humidity, and length of storage [19]. Storage of seeds at high moisture content and higher temperatures leads to faster deterioration. Free fatty acid and peroxide values are the parameters used to evaluate oil quality. Oil deterioration is caused by oxidation, hydrolysis, and other factors. Factors such as light and heat can contribute to the oxidative reaction that speeds up the oil deterioration process [20].
While the goal of storage is to preserve the quality of soybeans in storage, preliminary studies in the United States and Canada have claimed that green soybean or canola seeds will change color in storage during the first five months [9,21]. Some other studies have stated that there is little to no improvement in the seed color, though there might be a slight lightening of the seed coat after some period in storage [22,23,24]. The effect of some of the storage conditions like temperature, moisture content, storage media, and storage period on the color and oil quality of matured grains, such as mature soybean and pinto beans, have also been reported [25,26,27].
Nevertheless, there are still limited scientific data published that assesses the effect of drying and storage conditions on the color and quality changes of immature R6 and R7 maturity-stage soybeans. Since soybean is a major US crop, there is a need to investigate drying and storage conditions that will facilitate the fading of the green color in immature (green and semi-green) soybeans. Therefore, in this study, the physical appearance, primarily the (surface) color, of green and semi-green soybeans over a period of six months at different drying and storage conditions (temperature, moisture content, light, and aeration) was evaluated. Furthermore, the effect of these storage conditions on oil quality, including free fatty acid and peroxide content, was examined. Research findings will help growers improve the market value of their produce and provide processors with a better quality of grain for oil processing.

2. Materials and Methods

2.1. Chemicals and Reagents

To conduct laboratory tests on oil quality, acetic acid (Glacial) was purchased from EMD Chemicals (Gibbstown, NJ, USA), while chloroform was procured from VWR International (Radnor, PA, USA). Potassium iodide (KI) was also acquired from VWR Chemicals (Solon, OH, USA) and soluble starch was purchased from Sigma Chemical Co. (St. Louis, MO, USA). In addition, sodium thiosulphate (Na2S2O3) 0.01 N standardized solution was procured from Alfa Aesar (Ward Mill, MA, USA) and sodium hydroxide (NaOH) 0.01 N standardized solution was acquired from Acros Organics (Fairlawn, NJ, USA). Other reagents such as phenolphthalein powder and 99% Iso-propyl alcohol (IPA) were purchased from J.T. Baker (Center Valley, PA, USA) and Fisher Scientific (Rochester, NY, USA), respectively.

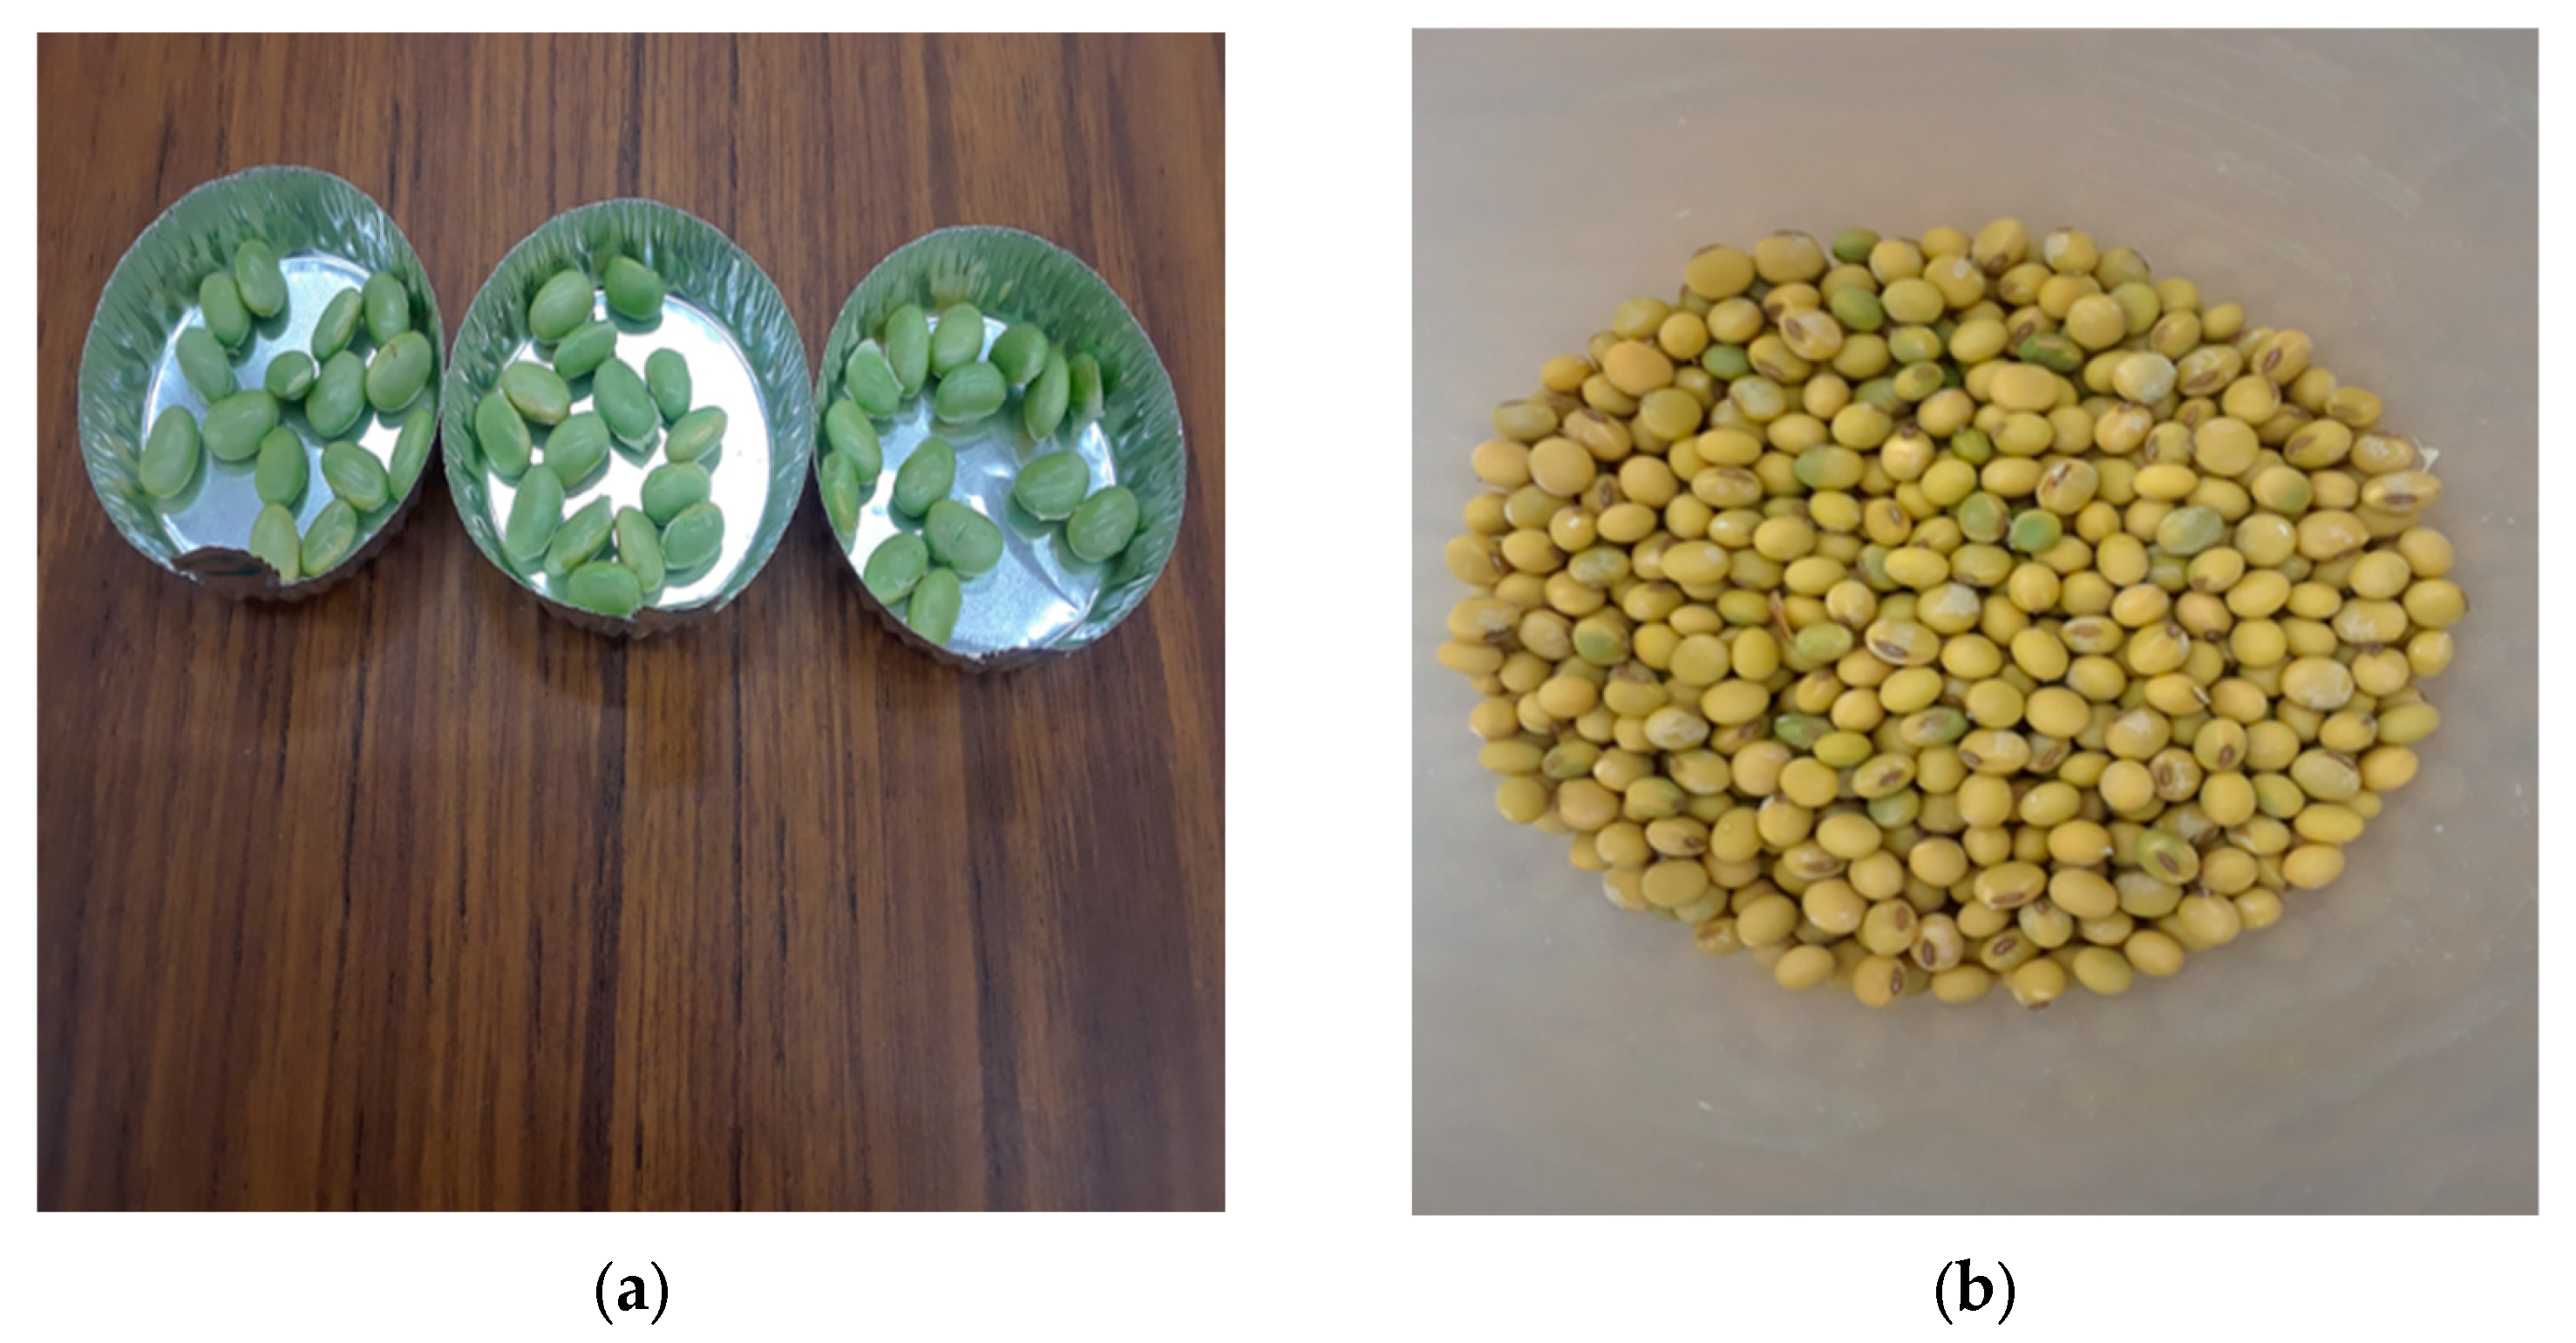
2.2. Soybean Samples Collection and Preparation

The soybean seed “Proseed 30-20” variety was grown at Carrington Research Extension Center (Carrington, ND, USA). The soybeans were planted on 20 May 2018 and grew under normal weather conditions (average of 68° F) during the summer months of June, July, and August until harvest.

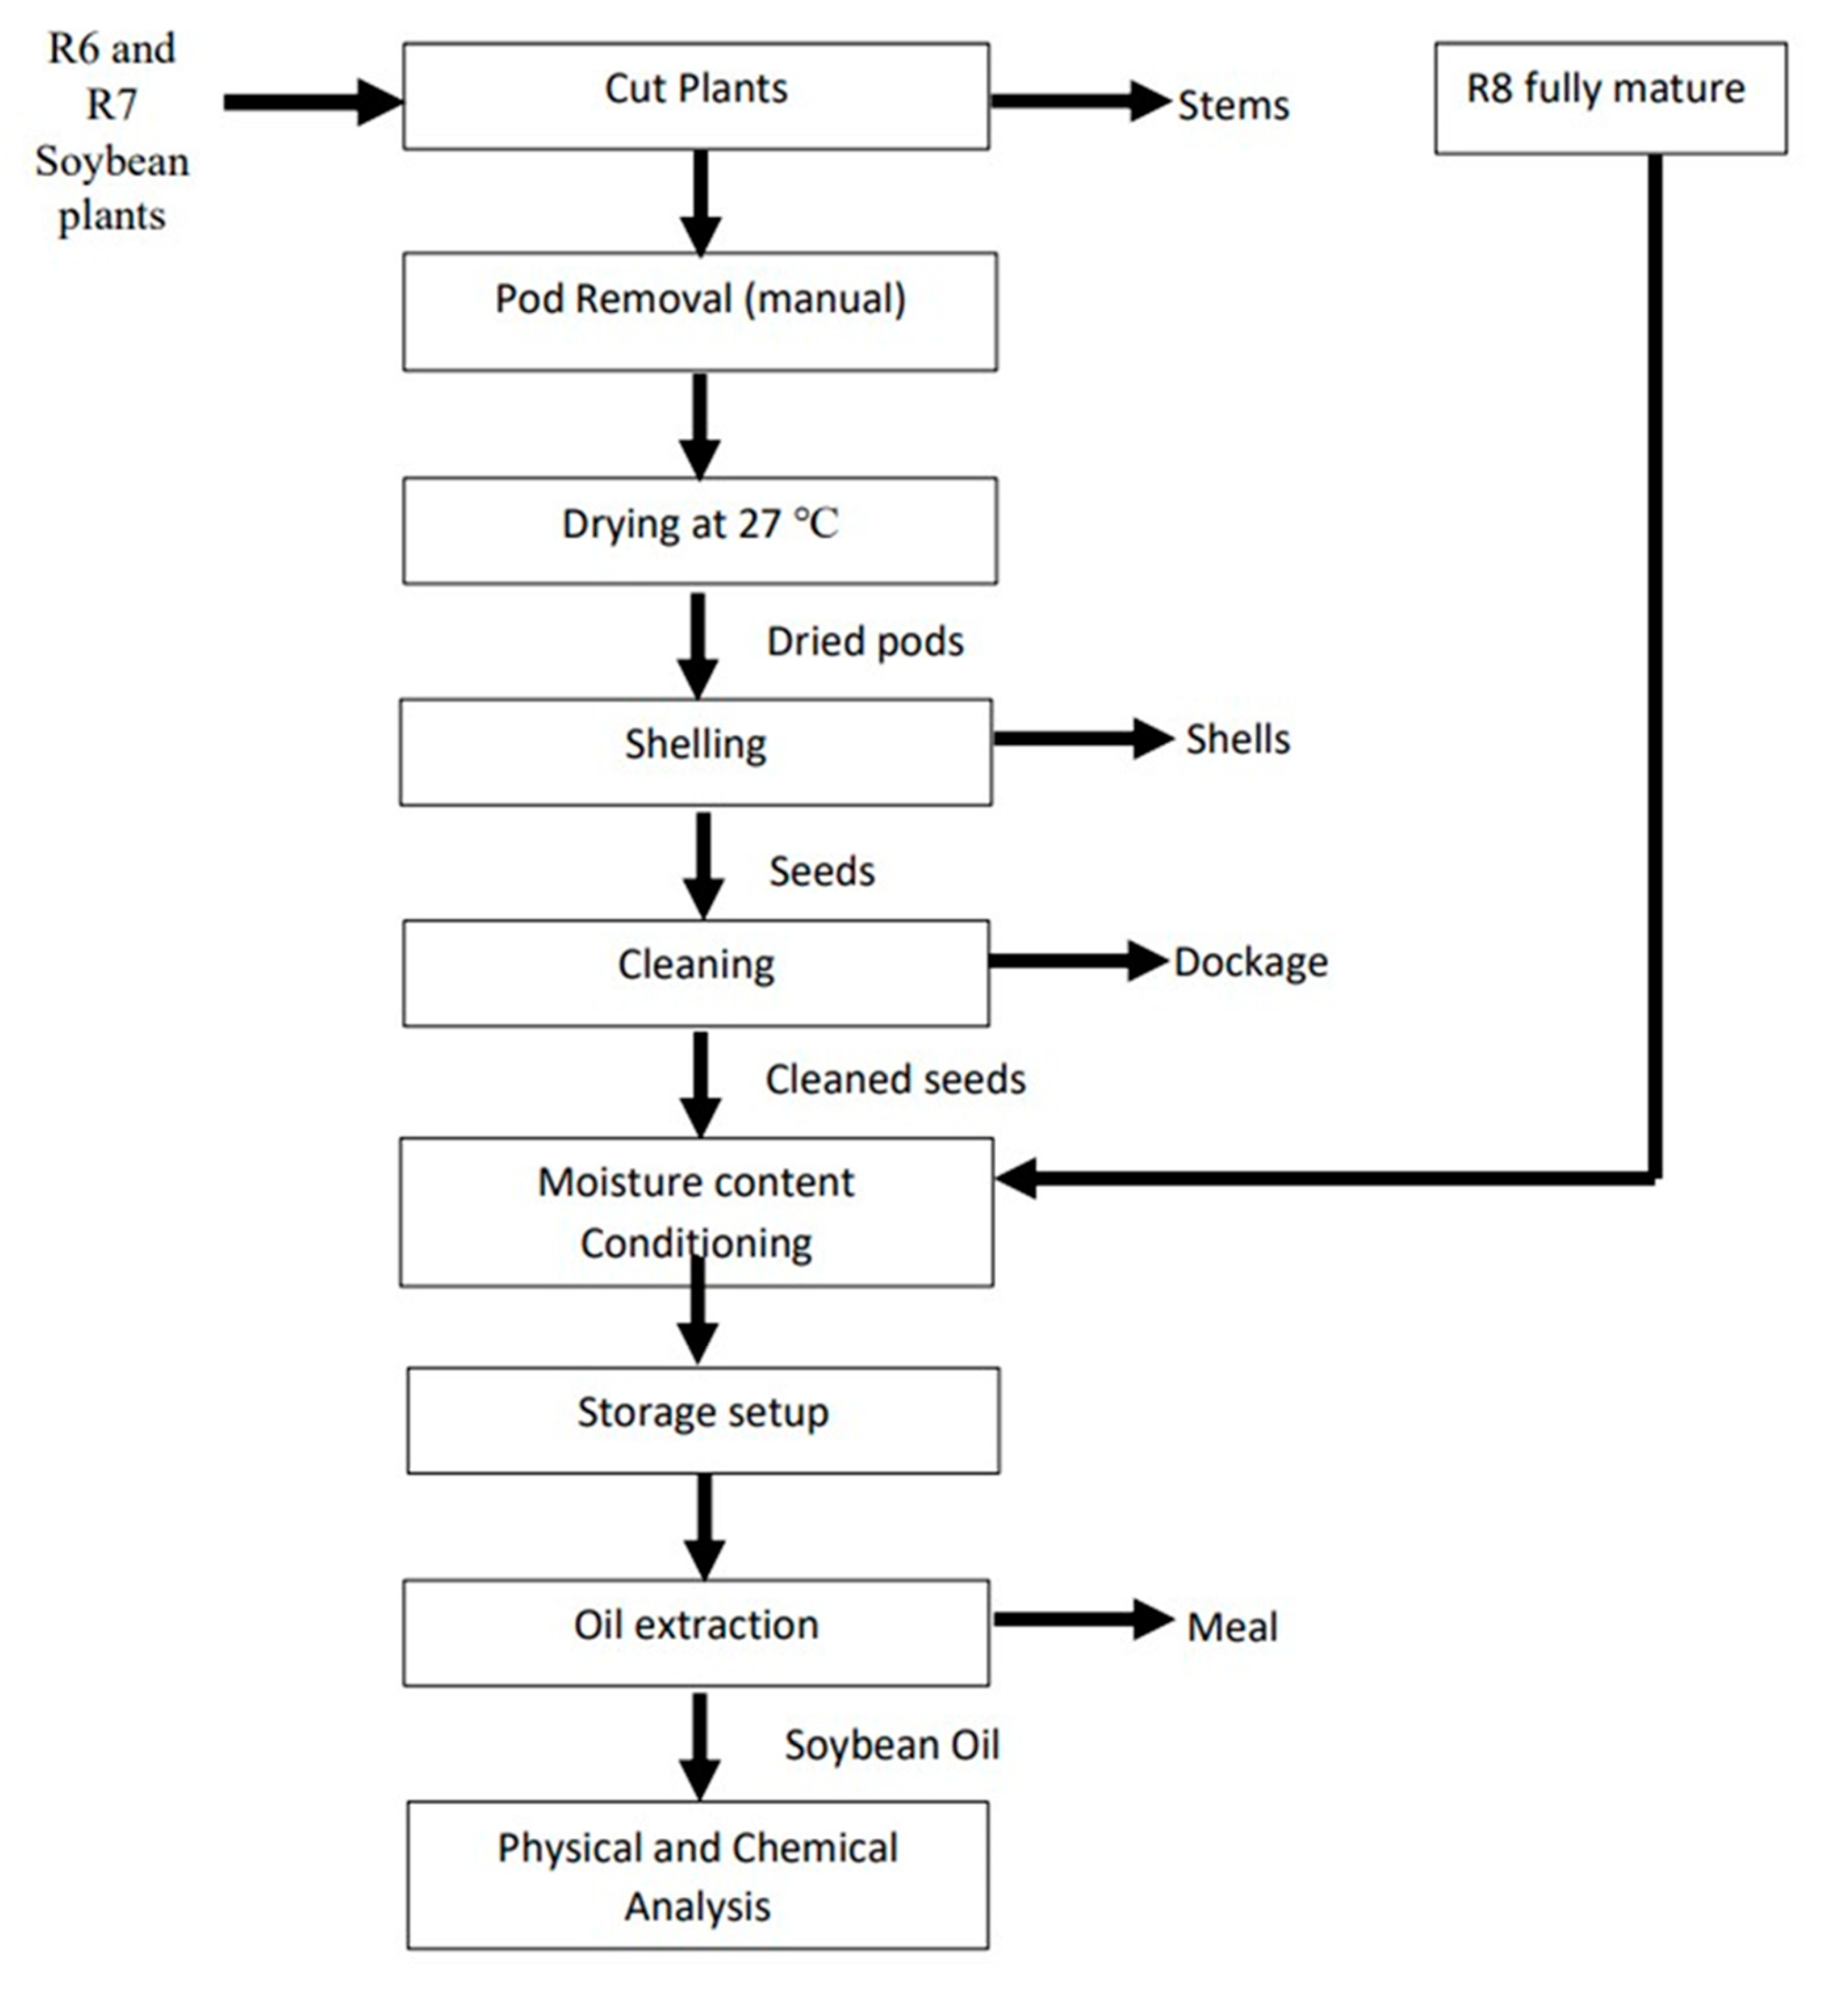
2.2.1. Harvesting and Pod Removal

The soybeans were harvested at three different maturity stages: R6 (green pods with full green seeds), R7 (beginning of maturity: semi-green or yellow pods), and R8 (fully matured; 95% of mature pods). The R8 was the control. Harvesting was conducted on 31 August, 5 September, and 27 September 2018 for the R6, R7, and R8 seeds, respectively.
Due to the high moisture content (greater than 45% wet basis (w.b.) of the soybean seeds) at the R6 and R7 maturity stages, the plot combine harvester was not used. A forage harvester was used to cut the soybean plants at the base of the stem. The cut plants were temporarily stored in black plastic polythene bags in the cold room at 4 °C until the pods were manually removed. The pod removal took approximately two weeks to complete. Figure 1 shows the different stages of the pod removal, drying, and cleaning process after the plants were harvested. Pod removal from the stems was performed prior to drying of the pods. The R8 were fully matured seeds and harvested with the aid of a plot combine harvester. The R8 seeds were stored in airtight plastic pails under the same temperature conditions as the dried and shelled R6 and R7 seeds.

2.2.2. Drying, Shelling, and Cleaning

After manually removing the pods from the R6 and R7 plants, pods were dried in a drying cabinet at 27 ± 2 °C. The soybean pods were dried in batches for a period of 48–96 h to approximately 10% w.b. moisture. The pods were spread out in flat meshed trays inside the drying cabinet. The trays were 7.4 cm × 5.3 cm wide × 0.38 cm deep. A shallow layer of soybean pods was placed in each tray. After drying, pod shelling of R6 and R7 was conducted with the aid of a small bundle thresher model SBT (ALMACO, Nevada, IA, USA) at a threshing rate of approximately 55 kg h−1. The threshed seeds were cleaned with the aid of an aspirator (KICE Metal Products Co. Inc., Park City, KS, USA) to remove foreign materials. The cleaned seeds were then stored in five-gallon airtight plastic pails and placed in the refrigerator prior to the seed conditioning and experimental setup. Fully mature soybeans at R8 were dry when harvested and cleaned prior to receipt, hence they were only conditioned before storage.

2.2.3. Moisture Content Determination

Due to the high initial moisture content of the soybean seeds in the R6 and R7 pods (greater than 45% w.b.), moisture content in the seeds was analyzed with a convection drying oven (Binder, model FD115-UL; Holzgerlingen, Germany) according to the AACC method No. 44-15.02 (1999) [28]. The moisture content was analyzed in triplicate. For each replicate, 15 g of whole soybean seeds was measured in triplicate in drying dishes and placed in an oven. The oven was set at 103 °C for approximately 72 h until no change in weight was recorded. Afterward, the samples were removed from the oven, cooled in the desiccator, and moisture in the seeds was calculated using Equation (1).
%   Moisture content = Initial weight of sample Final weight of sample Initial weight of sample   ( w . b . ) × 100
The moisture contents of the dried soybean seeds were analyzed using the GAC 2100 capacitance-based moisture analyzer (Dickey John, Auburn, IL, USA).

2.2.4. Moisture Content Conditioning

The moisture contents of the cleaned seeds (R6 and R7) were adjusted to 12% and 17%, respectively. R8 seeds were received at a harvest moisture content of 12%; therefore, a proportion of the seeds was conditioned to 17%. Given the initial weight and moisture content of the cleaned seeds and the desired moisture of 12% and 17% for conditioning, the quantity of water added to the threshed seeds was calculated as shown in Equation (2) below.
M w = M c W f W c 100 % W f
where Mw = mass of water added (g), Mc = initial weight of cleaned seeds (g), Wc = initial moisture content of cleaned seeds (%), and Wf = final desired moisture content (%).
Once the mass of water needed to achieve the desired moisture content (12% and 17%) was calculated from the above equation, the seeds were placed in a 27-gallon large tote on a weighing balance and the quantity of distilled water equal to the calculated Mw value was sprayed on the R6 seeds using a spraying bottle. The water was evenly distributed throughout the seeds by mixing thoroughly in the sealed container. Afterward, the tote was placed in the cold room to allow for proper equilibration of the samples for 48 h [29]. The same procedure was conducted for the conditioning of the R7 and R8 seeds. After conditioning, 300 g of seeds were weighed and placed in airtight plastic Ziploc freezer bags for non-aerated samples and mesh bags for aerated samples.

2.3. Experimental Setup

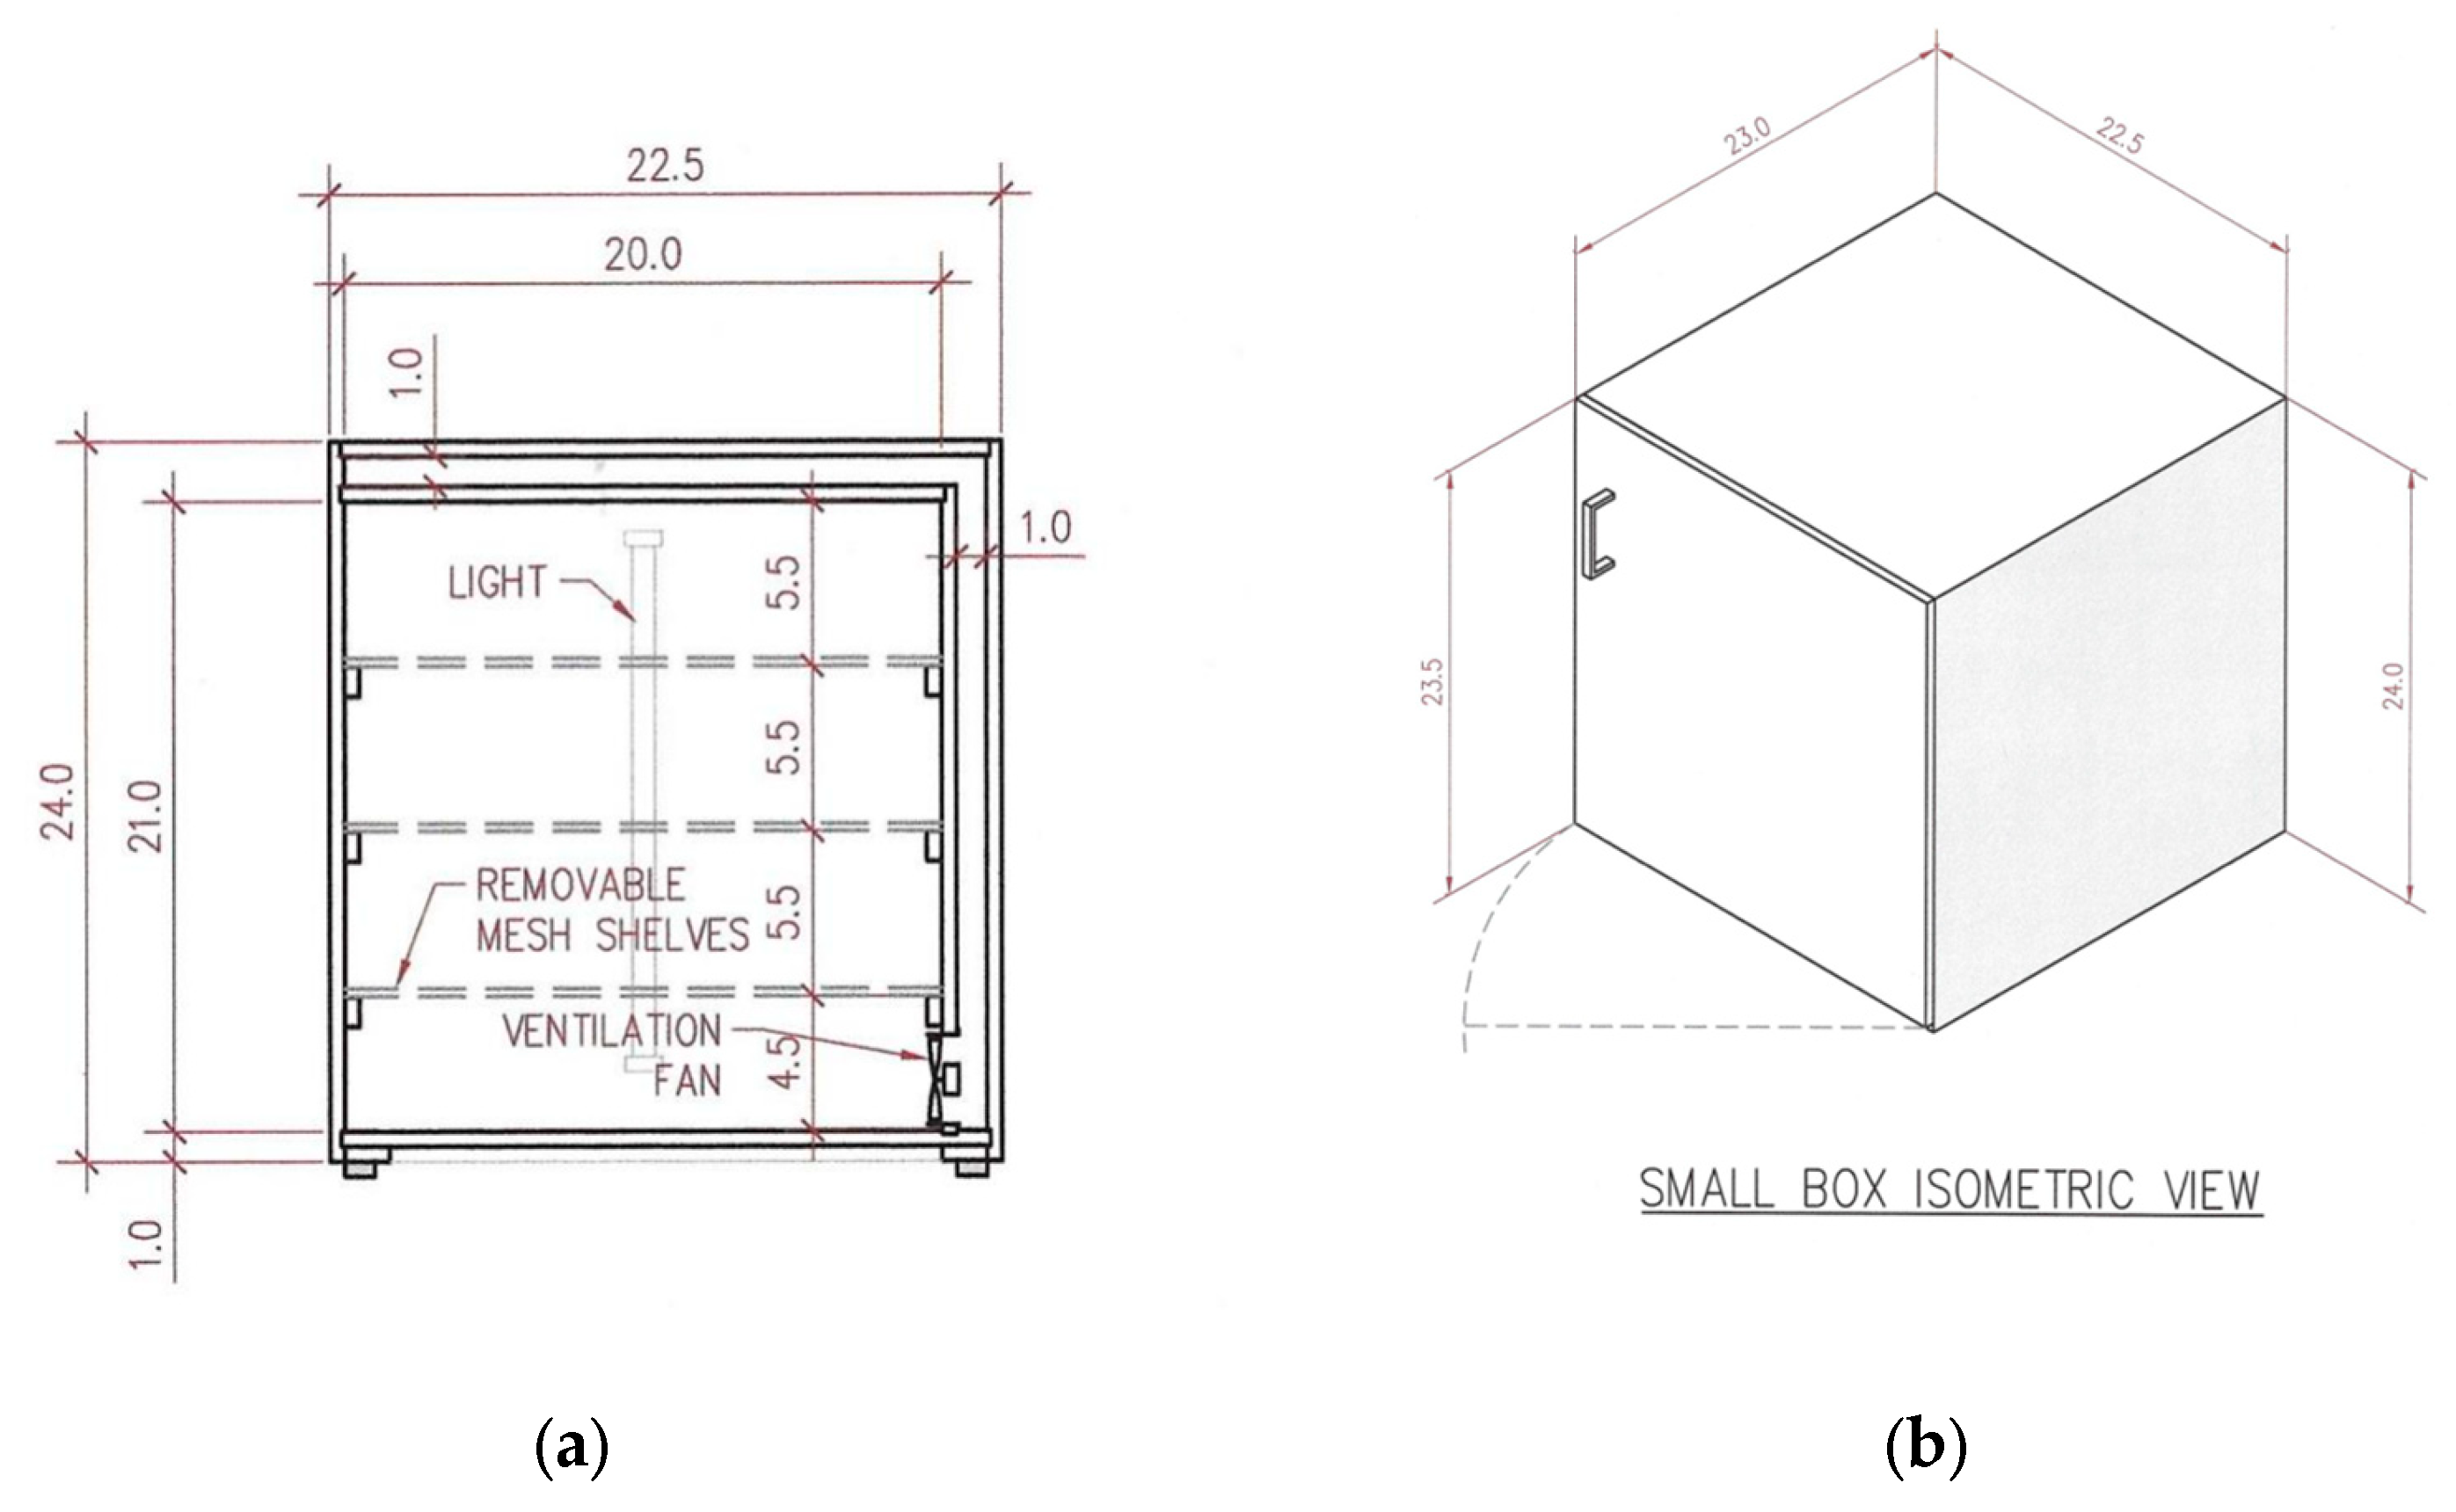
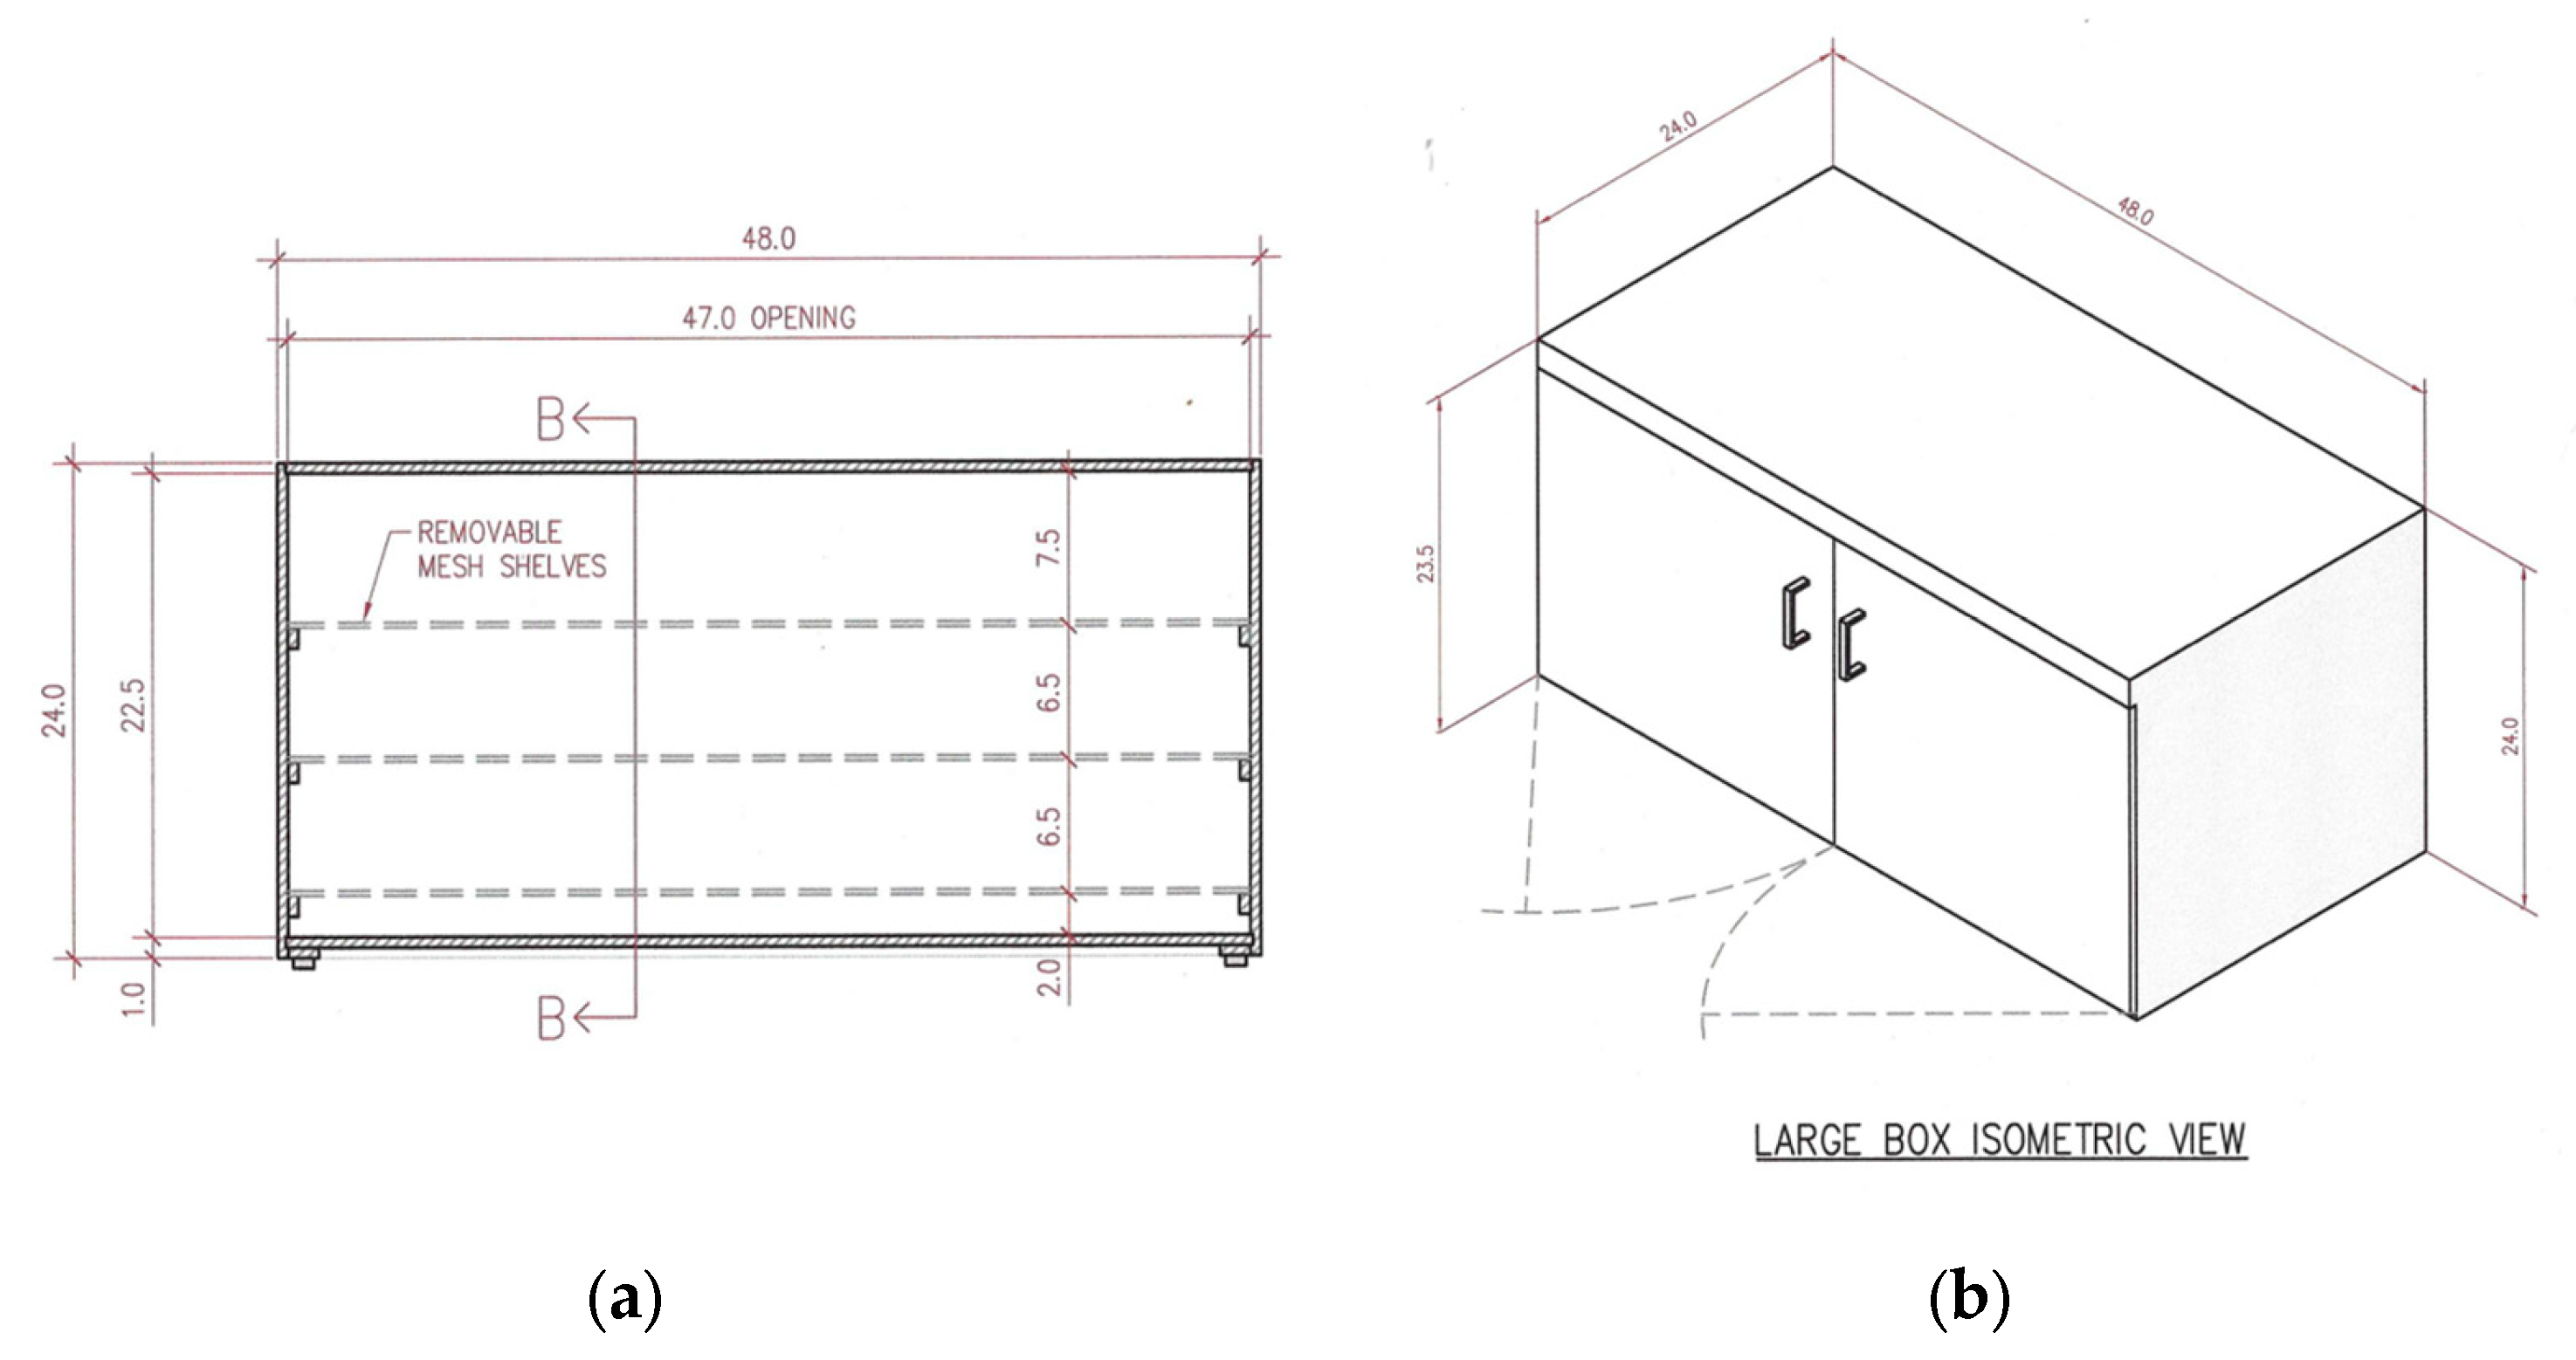
2.3.1. Storage Units Description

Eight small storage boxes of dimensions 61.0 × 58.4 × 57.1 cm and four large storage boxes of dimensions 121.9 × 61.0 × 61.0 cm were designed and made. The storage boxes were designed to have no aeration and no light (NANL), no aeration and light (NAL), aeration and no light (ANL), and aeration and light (AL). Henceforth, storage box conditions will be referred to as NANL, NAL, ANL, and AL unless otherwise stated. Figure 2; Figure 3 show a schematic diagram of the small and large boxes, respectively. The large boxes were designed to have NANL and NAL while the smaller boxes had ANL and AL. The boxes were made of plywood. Three tight mesh Rubbermaid wire shelves (121.9 × 40.6 cm) were placed in each of the boxes evenly spaced from each other. The conditioned soybean samples in meshed bags were placed on the wire shelves in the small boxes with ANL and AL conditions. The meshed bags facilitated the movement of air from the fan through the seeds during storage. Meanwhile, conditioned samples in Ziploc transparent freezer bags were stored in the large boxes under NANL and NAL.
Aeration in the small boxes was achieved by a 12 V DC Dayton square 0.82 m3/min axial fan (6 cm wide, 6 cm high) procured from Grainger. The small and large boxes with a light had one and two 45.7 cm full spectrum fluorescence bulbs (15 W), respectively. Lighted boxes were lined with commercial-grade heavy-duty aluminum foil to allow for proper reflection of light on the conditioned soybean samples. The boxes were designed to be airtight and stored at two different temperatures of 4 °C (cold room) and 23.5 °C–(room temperature).

2.3.2. Temperature Monitoring and Seed Sampling

Digi-Sense Mini Plug Type “T” thermocouples were attached to the boxes to monitor the temperature inside the boxes over the 6 month storage period. Temperature data were collected using a digi-sense temperature meter at the time of sampling. Analysis was performed every two weeks for the first two months and then monthly throughout the storage period. Likewise, moisture content monitoring and evaluation was conducted after each sampling date to ensure seed samples remained within the targeted storage moisture.

2.3.3. Seed Color Analysis

Color analysis of dried and stored seed samples was assessed with a portable tristimulus Konica Minolta Colorimeter (Minolta CR-300 Chroma meter, Ramsey, NJ, USA) that measures color readings in L, a, and b values. The instrument was calibrated with white calibration tiles before analysis. About 30 g of soybean seeds from each stored sample were placed in polystyrene sterilized Petri dishes (60 × 15 mm) purchased from VWR (Chicago, IL, USA). Samples from the cold room (4 °C) were allowed to warm up for 30 min before data collection. The filled Petri dishes were placed on the colorimeter lens and color readings of the samples were recorded in L, a, and b values. The values of lightness L (100—white, 0—black), a (−green to +red), and b (−blue to +yellow) were determined according to Hunter L a b color scale (2° standard observer, D65 Illuminant) and measurement was conducted in triplicate for each sample [30]. The percentage increase in color change was calculated using Equation (3).
%   Increase = Final color   a   value     Initial   color   a   value Initial color   a   value × 100 %

2.3.4. Oil Extraction and Quality Analysis

After storage, an oilseed screw press (Komet, Germany) was used for expelling the oil from the soybean seed samples at a press head temperature of 62 ± 1 °C. The crude oil was then centrifuged using a Jouan CR 412 centrifuge set at 25 °C for 7 min at a speed of 4500 rpm. After centrifugation, the clear supernatant was poured into 50 mL plastic vials for oil quality analysis. The oil was analyzed for chlorophyll, peroxide, and free fatty acid values.
The number of chlorophyll pigments in the crude soybean oil was determined according to AOCS recommended practice Cc13i-96. Peroxide value analysis was conducted according to an adapted AOCS Cd 8-53 official method [31] for small sample sizes. The method involved using 0.001 N sodium thiosulfate solution standardized solution. The iodometric procedure was performed using a 0.5 g sample oil mass, with all reagents at 10% of the amounts recommended for the standard procedure. Oil samples were titrated with a 0.001 N sodium thiosulfate solution into 25-mL Erlenmeyer flasks. The titrant amount was recorded and the peroxide value (PV) was calculated using Equation (4).
P V = S B × N × 1000 Sample oil mass   ( g )
where S = titration of the sample (mL), B = titration of the blank (mL), and N = normality of titrant. The free fatty acid content in the extracted oil samples was determined using the AOCS Ca 5a-40 official modified method [32].

2.4. Experimental Design and Data Analysis

A multilevel factorial experiment design was developed with six factors at various levels as shown in Table 1. Analysis of variance (ANOVA) was used to determine the effects of the maturity stage, storage conditions (moisture content, temperature, lighting, and aeration), and storage period on the seed color and they were statistically analyzed using the general linear model of Minitab 2020 (State College, PA, USA) and SAS 9.4 software. All factor types were fixed. A value of p ≤ 0.05 was used to indicate significant differences among the main effects. Tukey’s method was used to compare differences between the main effect means and interactions using the least square determination (LSD). Data presented in the graphs are in terms of mean values with their respective standard deviations.

3. Results and Discussion

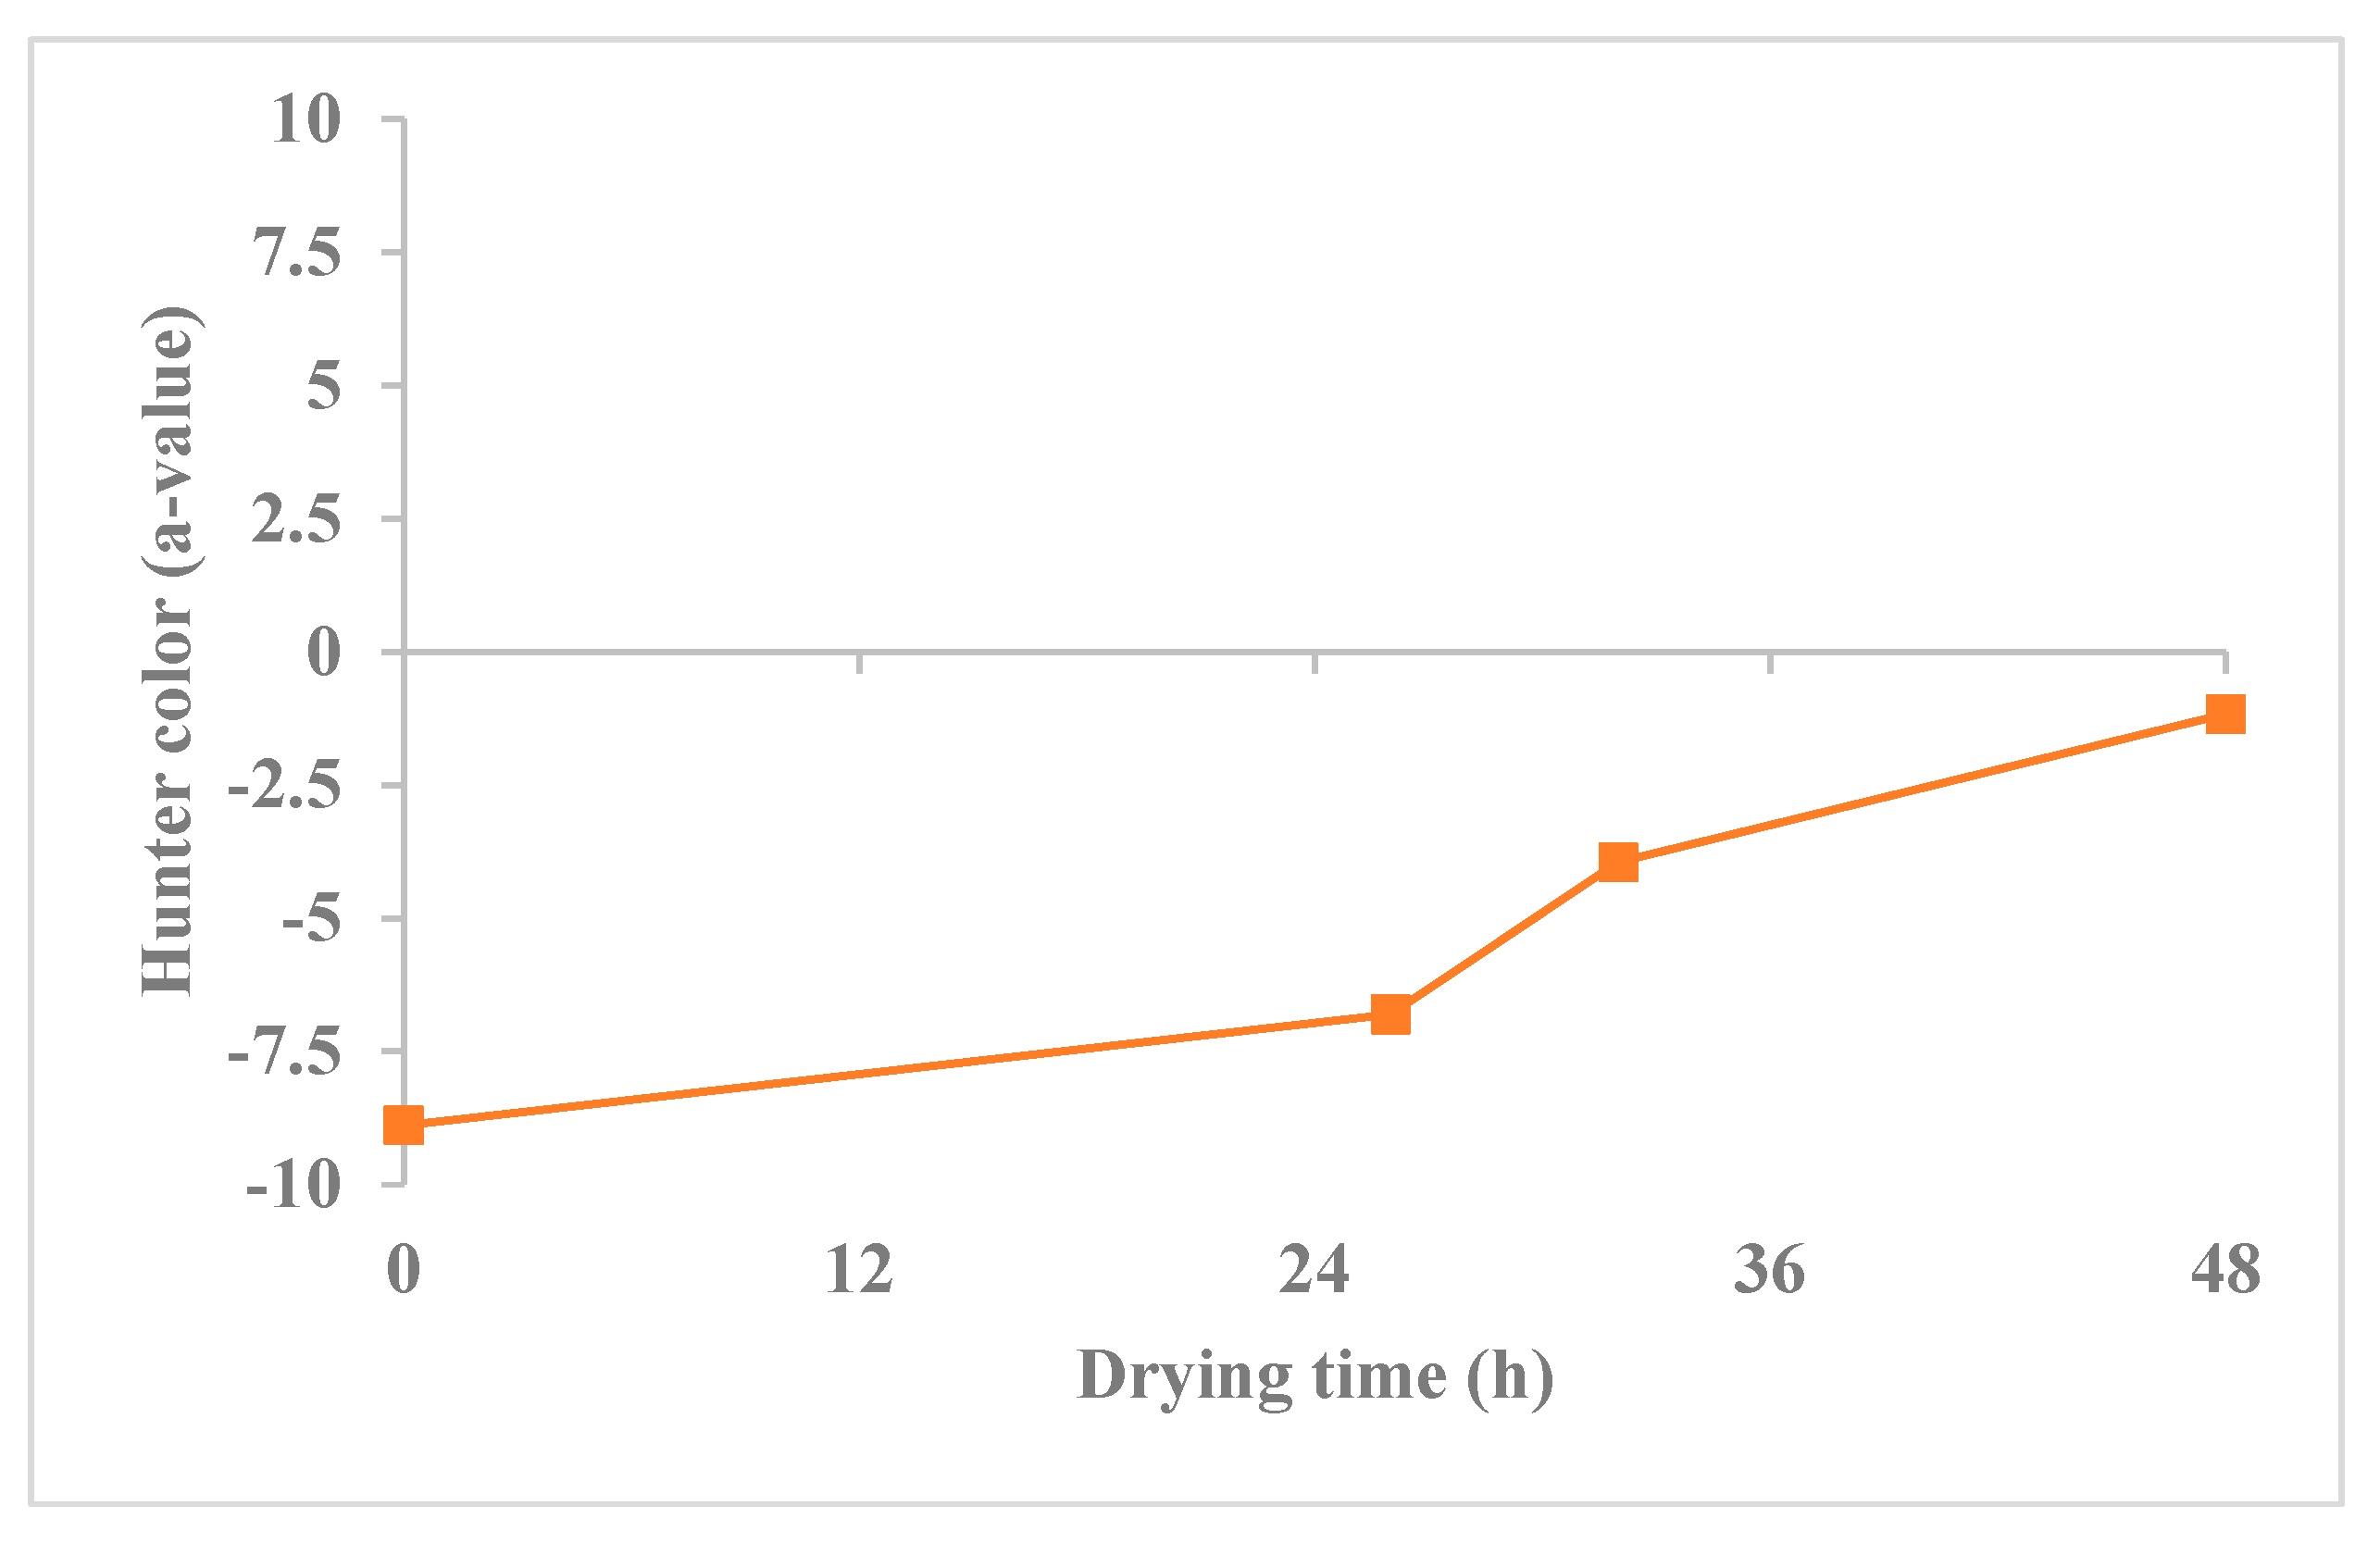
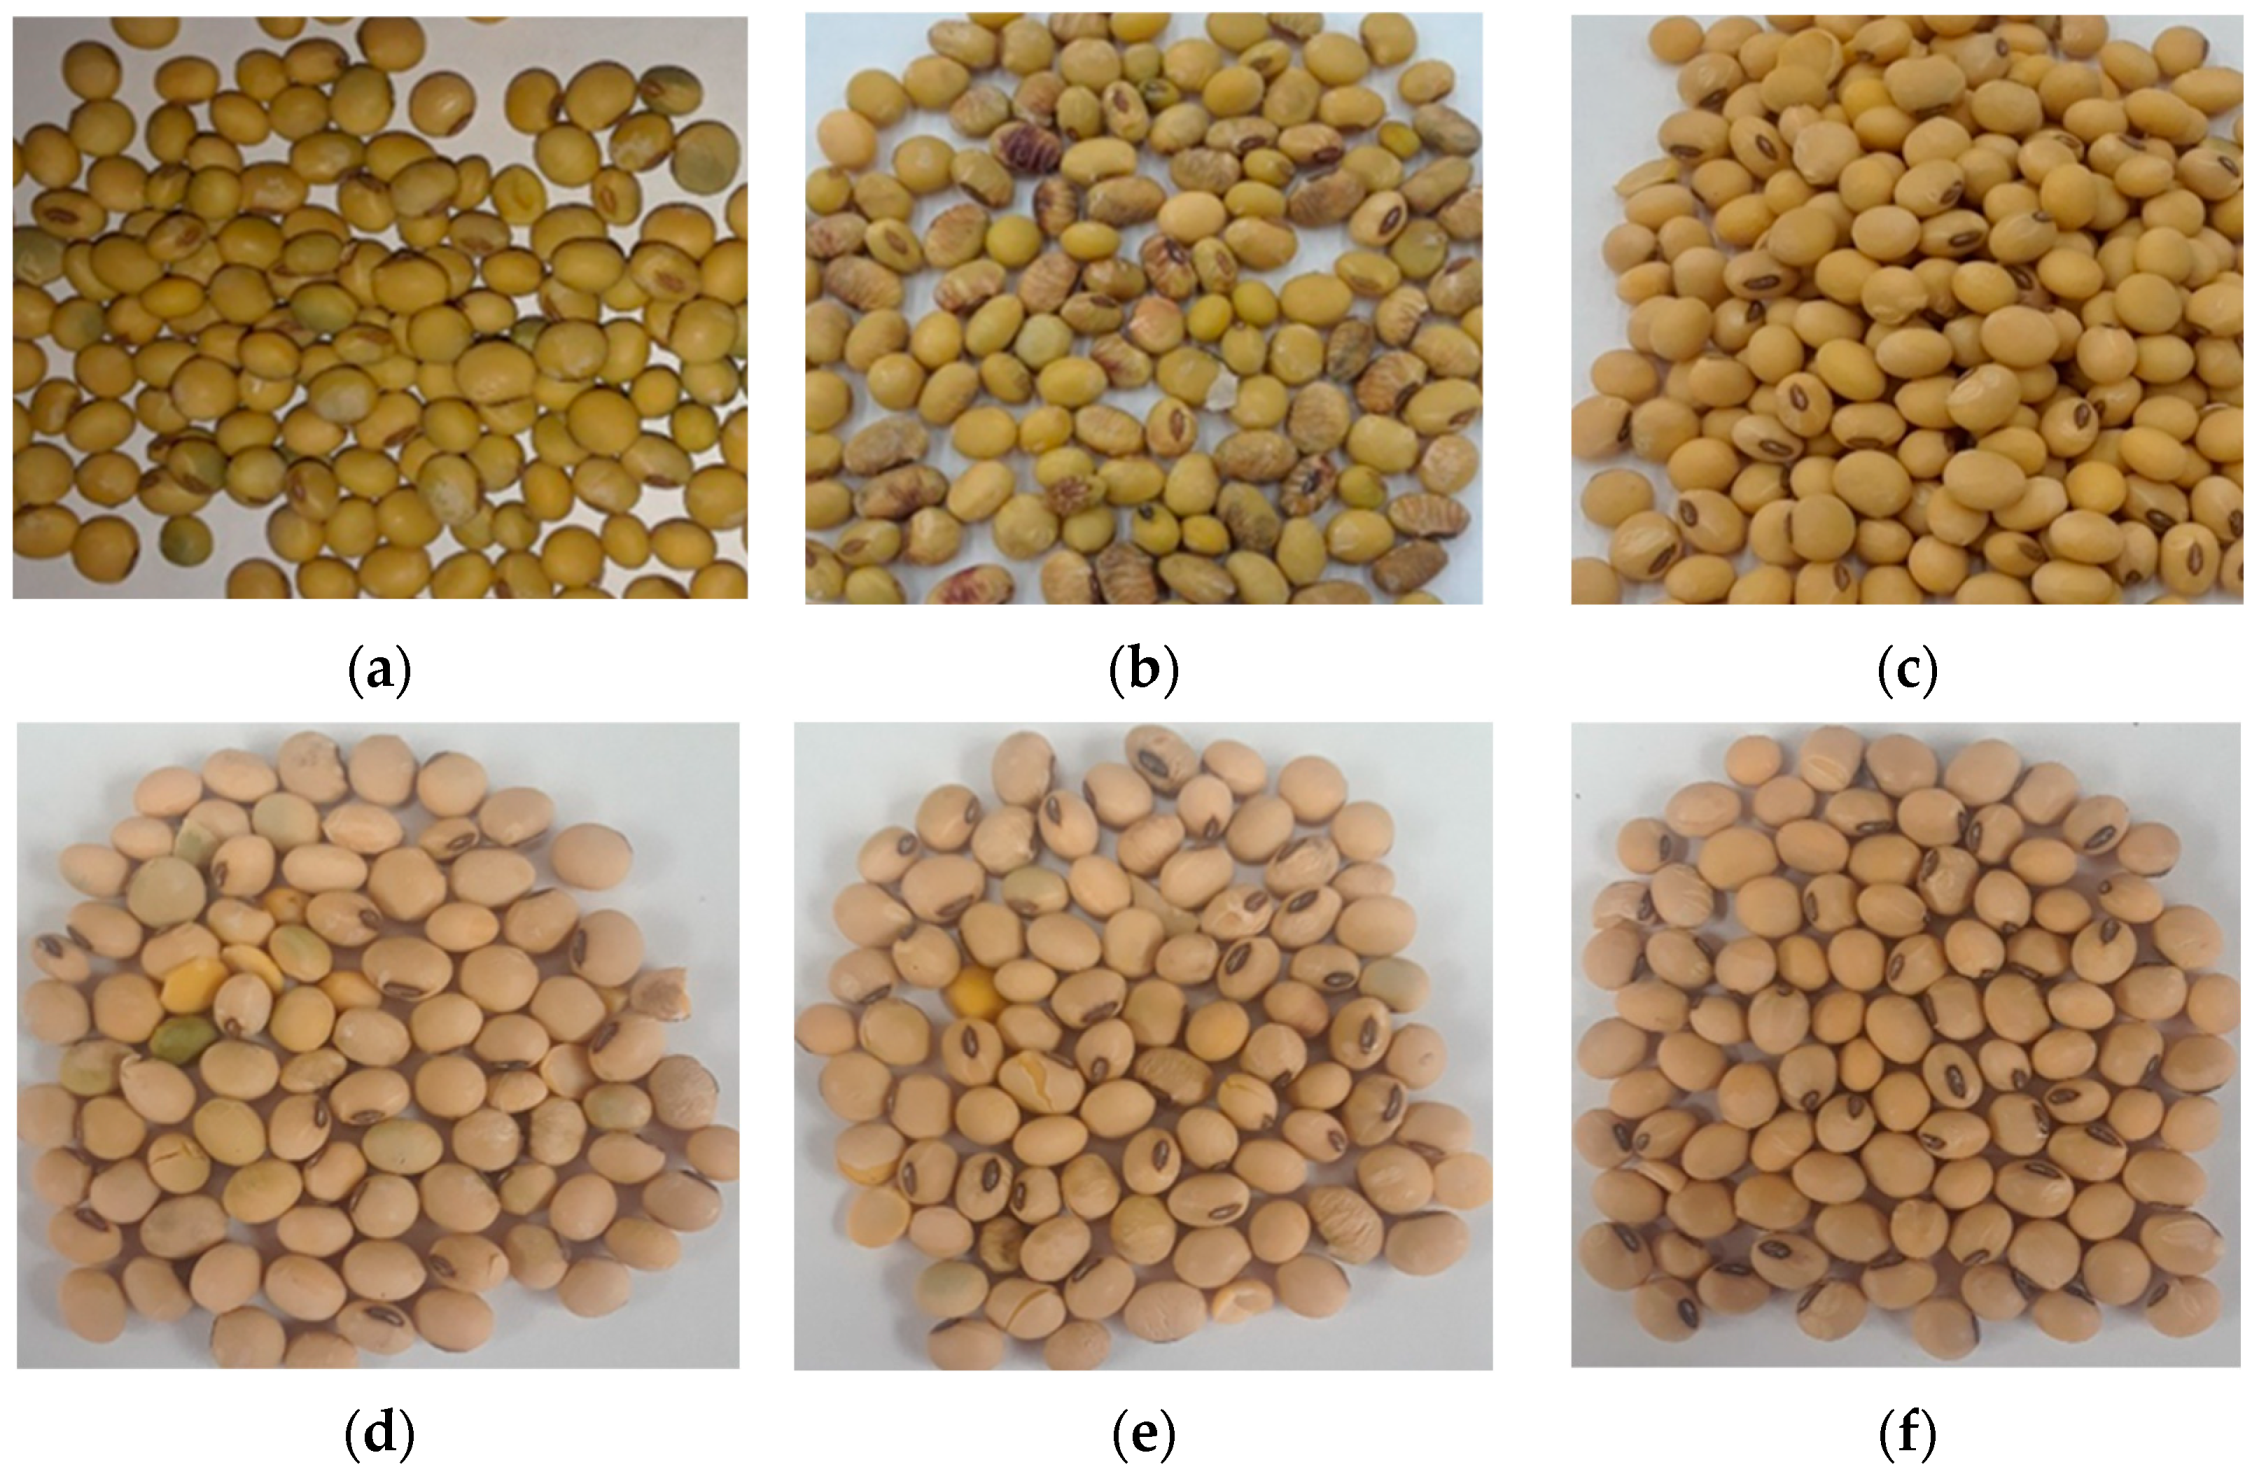
3.1. Effect of Drying on (R6 and R7) Seed Color a-Value

Overall, the Hunter color a-value was noted to have significantly changed during the drying of the R6 and R7 maturity soybeans. Drying was important in reducing the seed moisture contents to an acceptable level before storage commenced. Interestingly, color changes in the seeds also occurred to some degree during the drying process. Since the Hunter color a-value shows the intensity of greenness of a sample, it was used primarily in measuring the color changes observed in the dried seeds. A higher negative Hunter color a-value indicates a higher intensity of the green color while a positive value illustrates the fading away of the green color. The color a-value due to the ease of measurement is referred to as a suitable means for grading purposes in soybean seed classification [13]. Figure 4 shows the color change in the R6 soybeans before and after drying.
An increase in the color a-value of more than 70% was recorded at the end of the drying period from −8.89 to −1.71 for the R6 soybeans. Consequently, the soybean seeds were characterized with a bright yellowish-green color after being subjected to the drying process, indicating the fading away of the green tone as shown in Figure 5. Ref. [13] reported similar yellowing and an increase in color a-value when Brazilian soybean seeds at R6 underwent drying at 25 °C for 10 days. The change in color can likely be attributed to the degradation in the chlorophyll content of the green seeds during the low-temperature drying process [13,17,33].

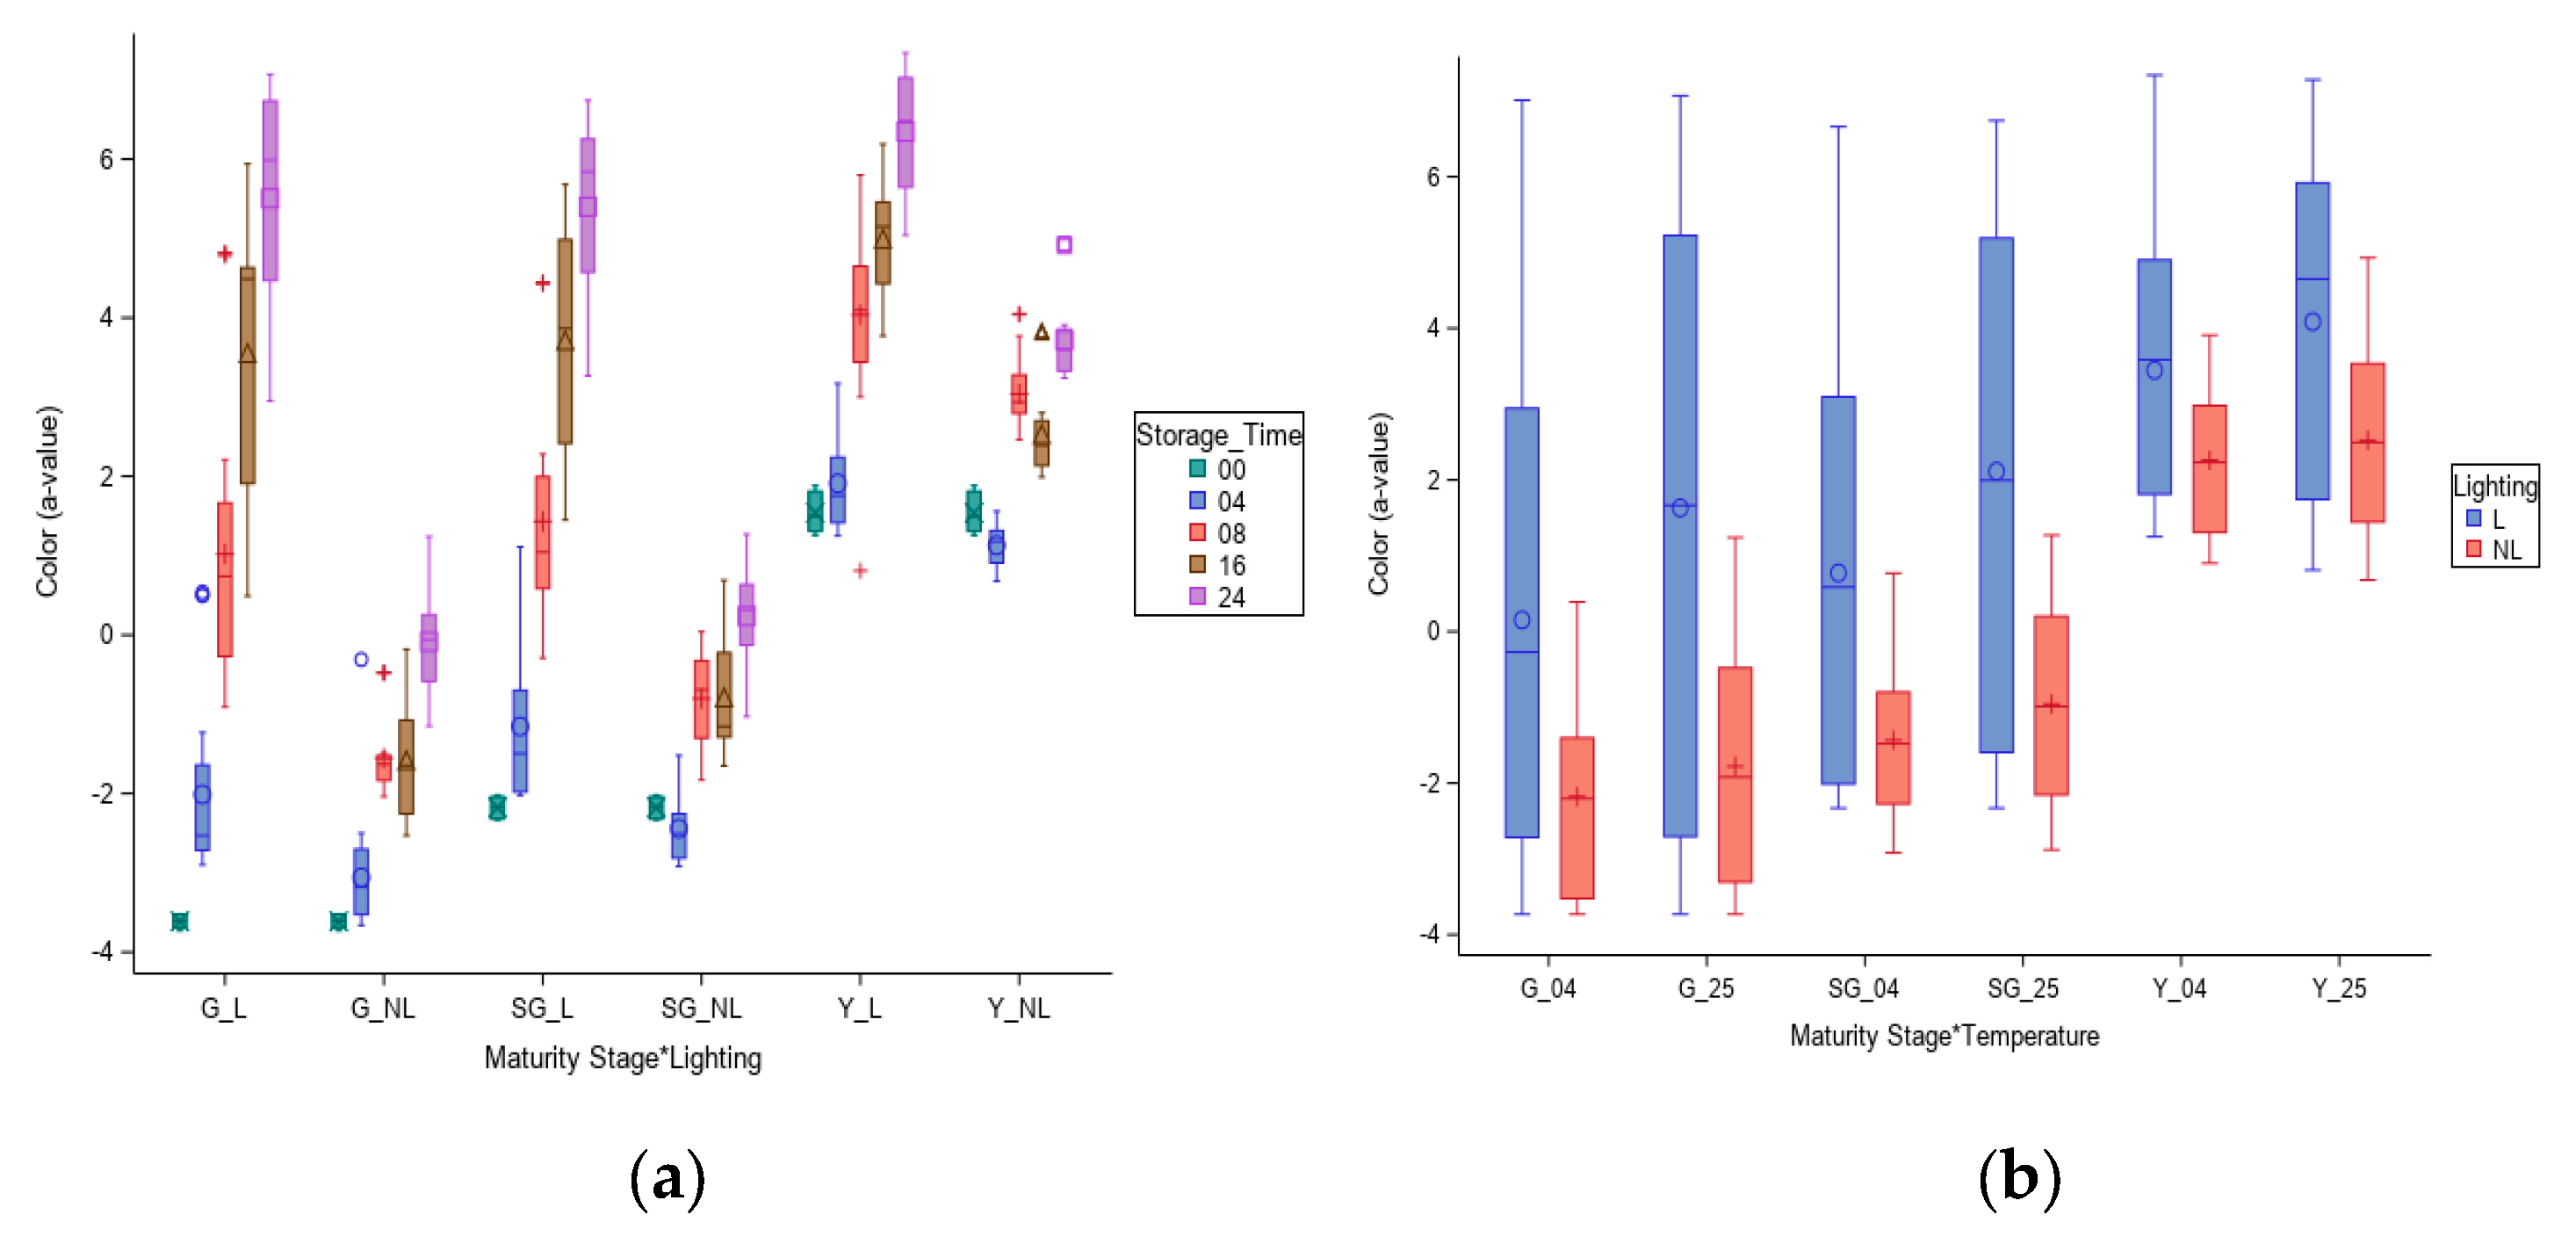
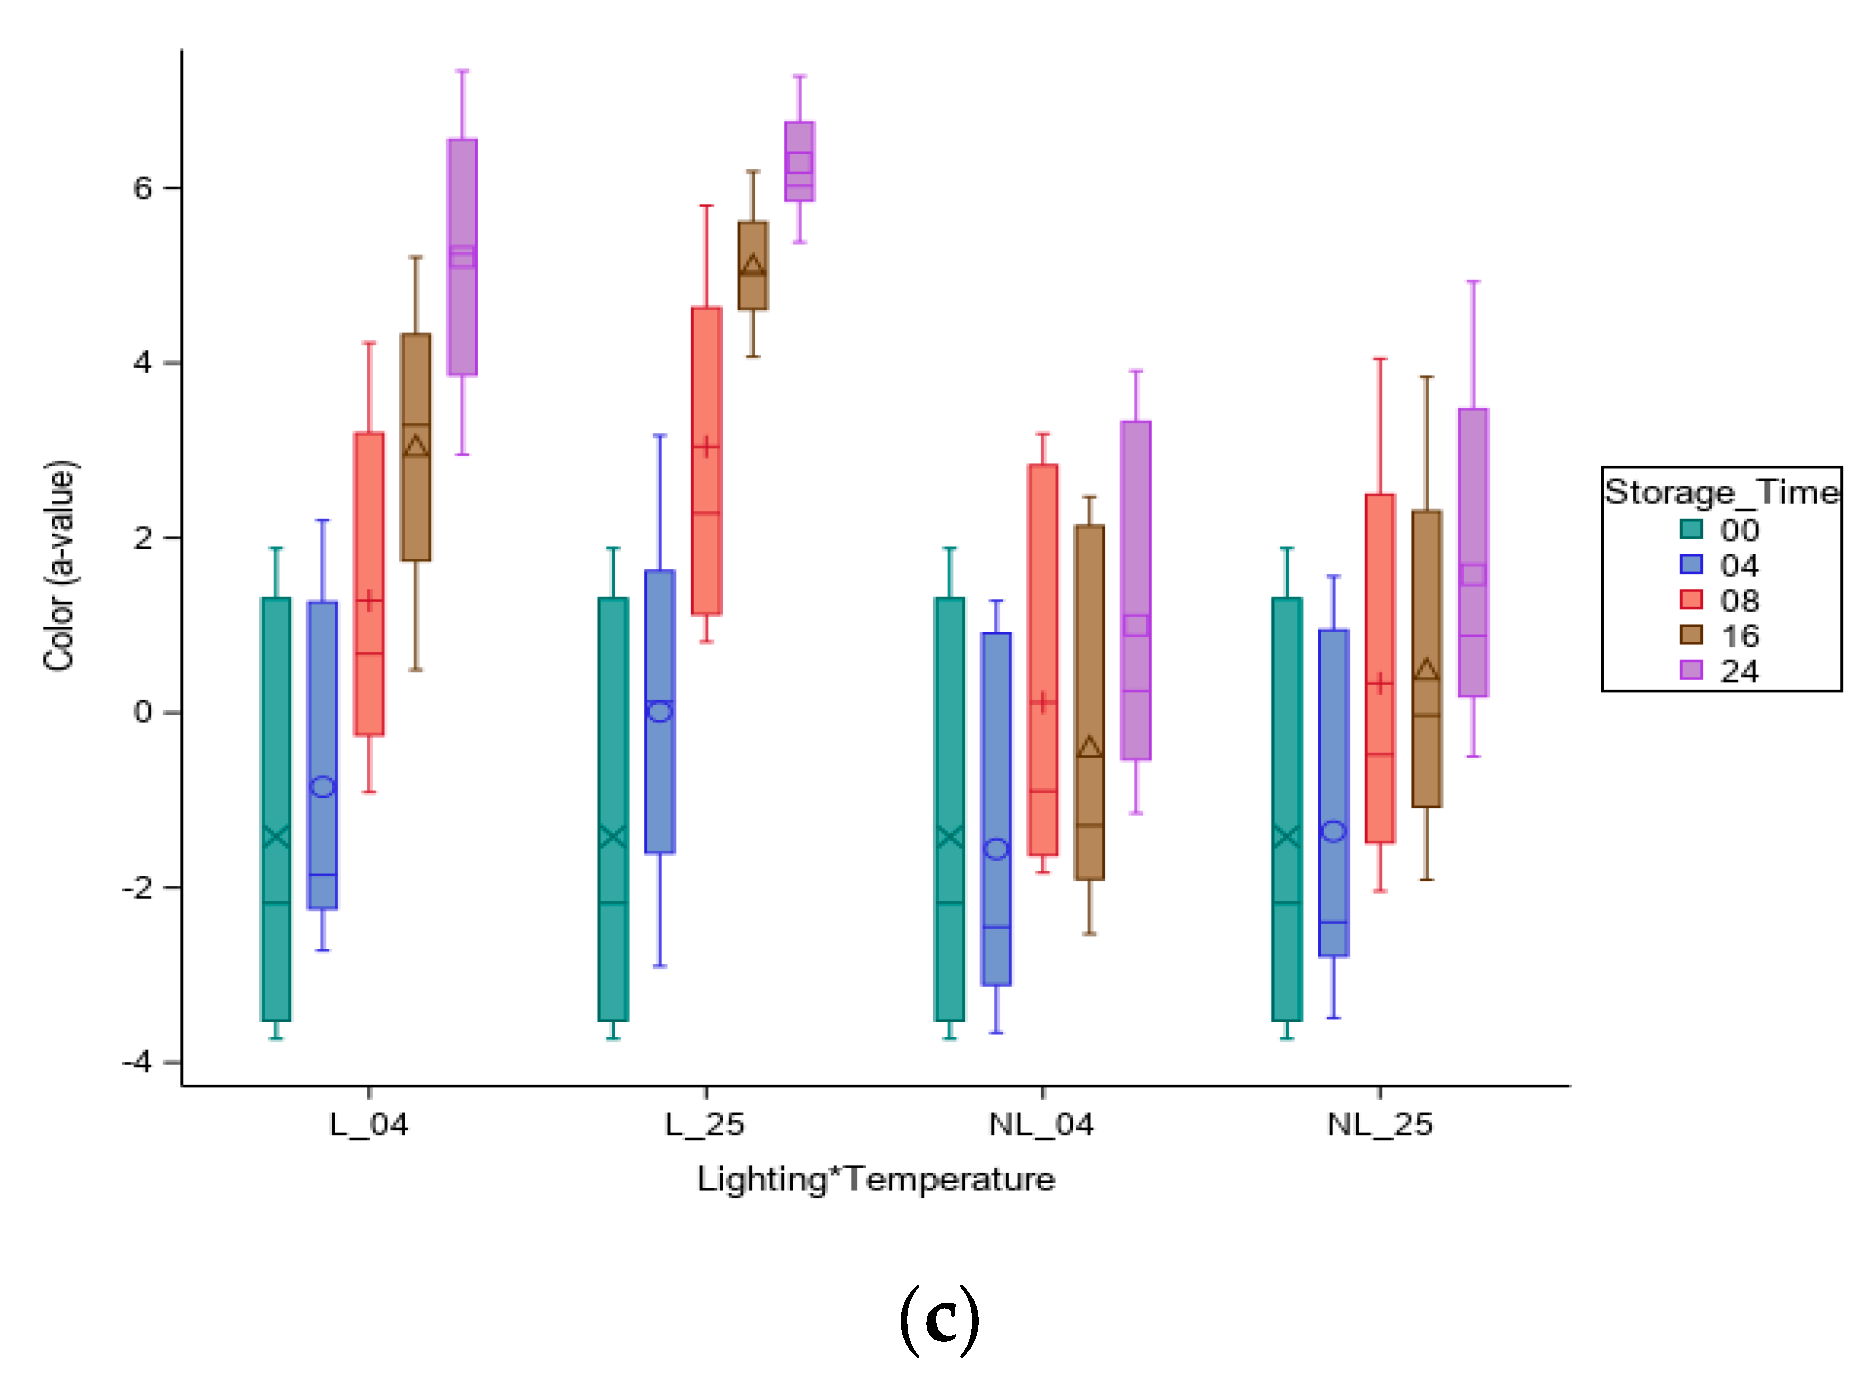
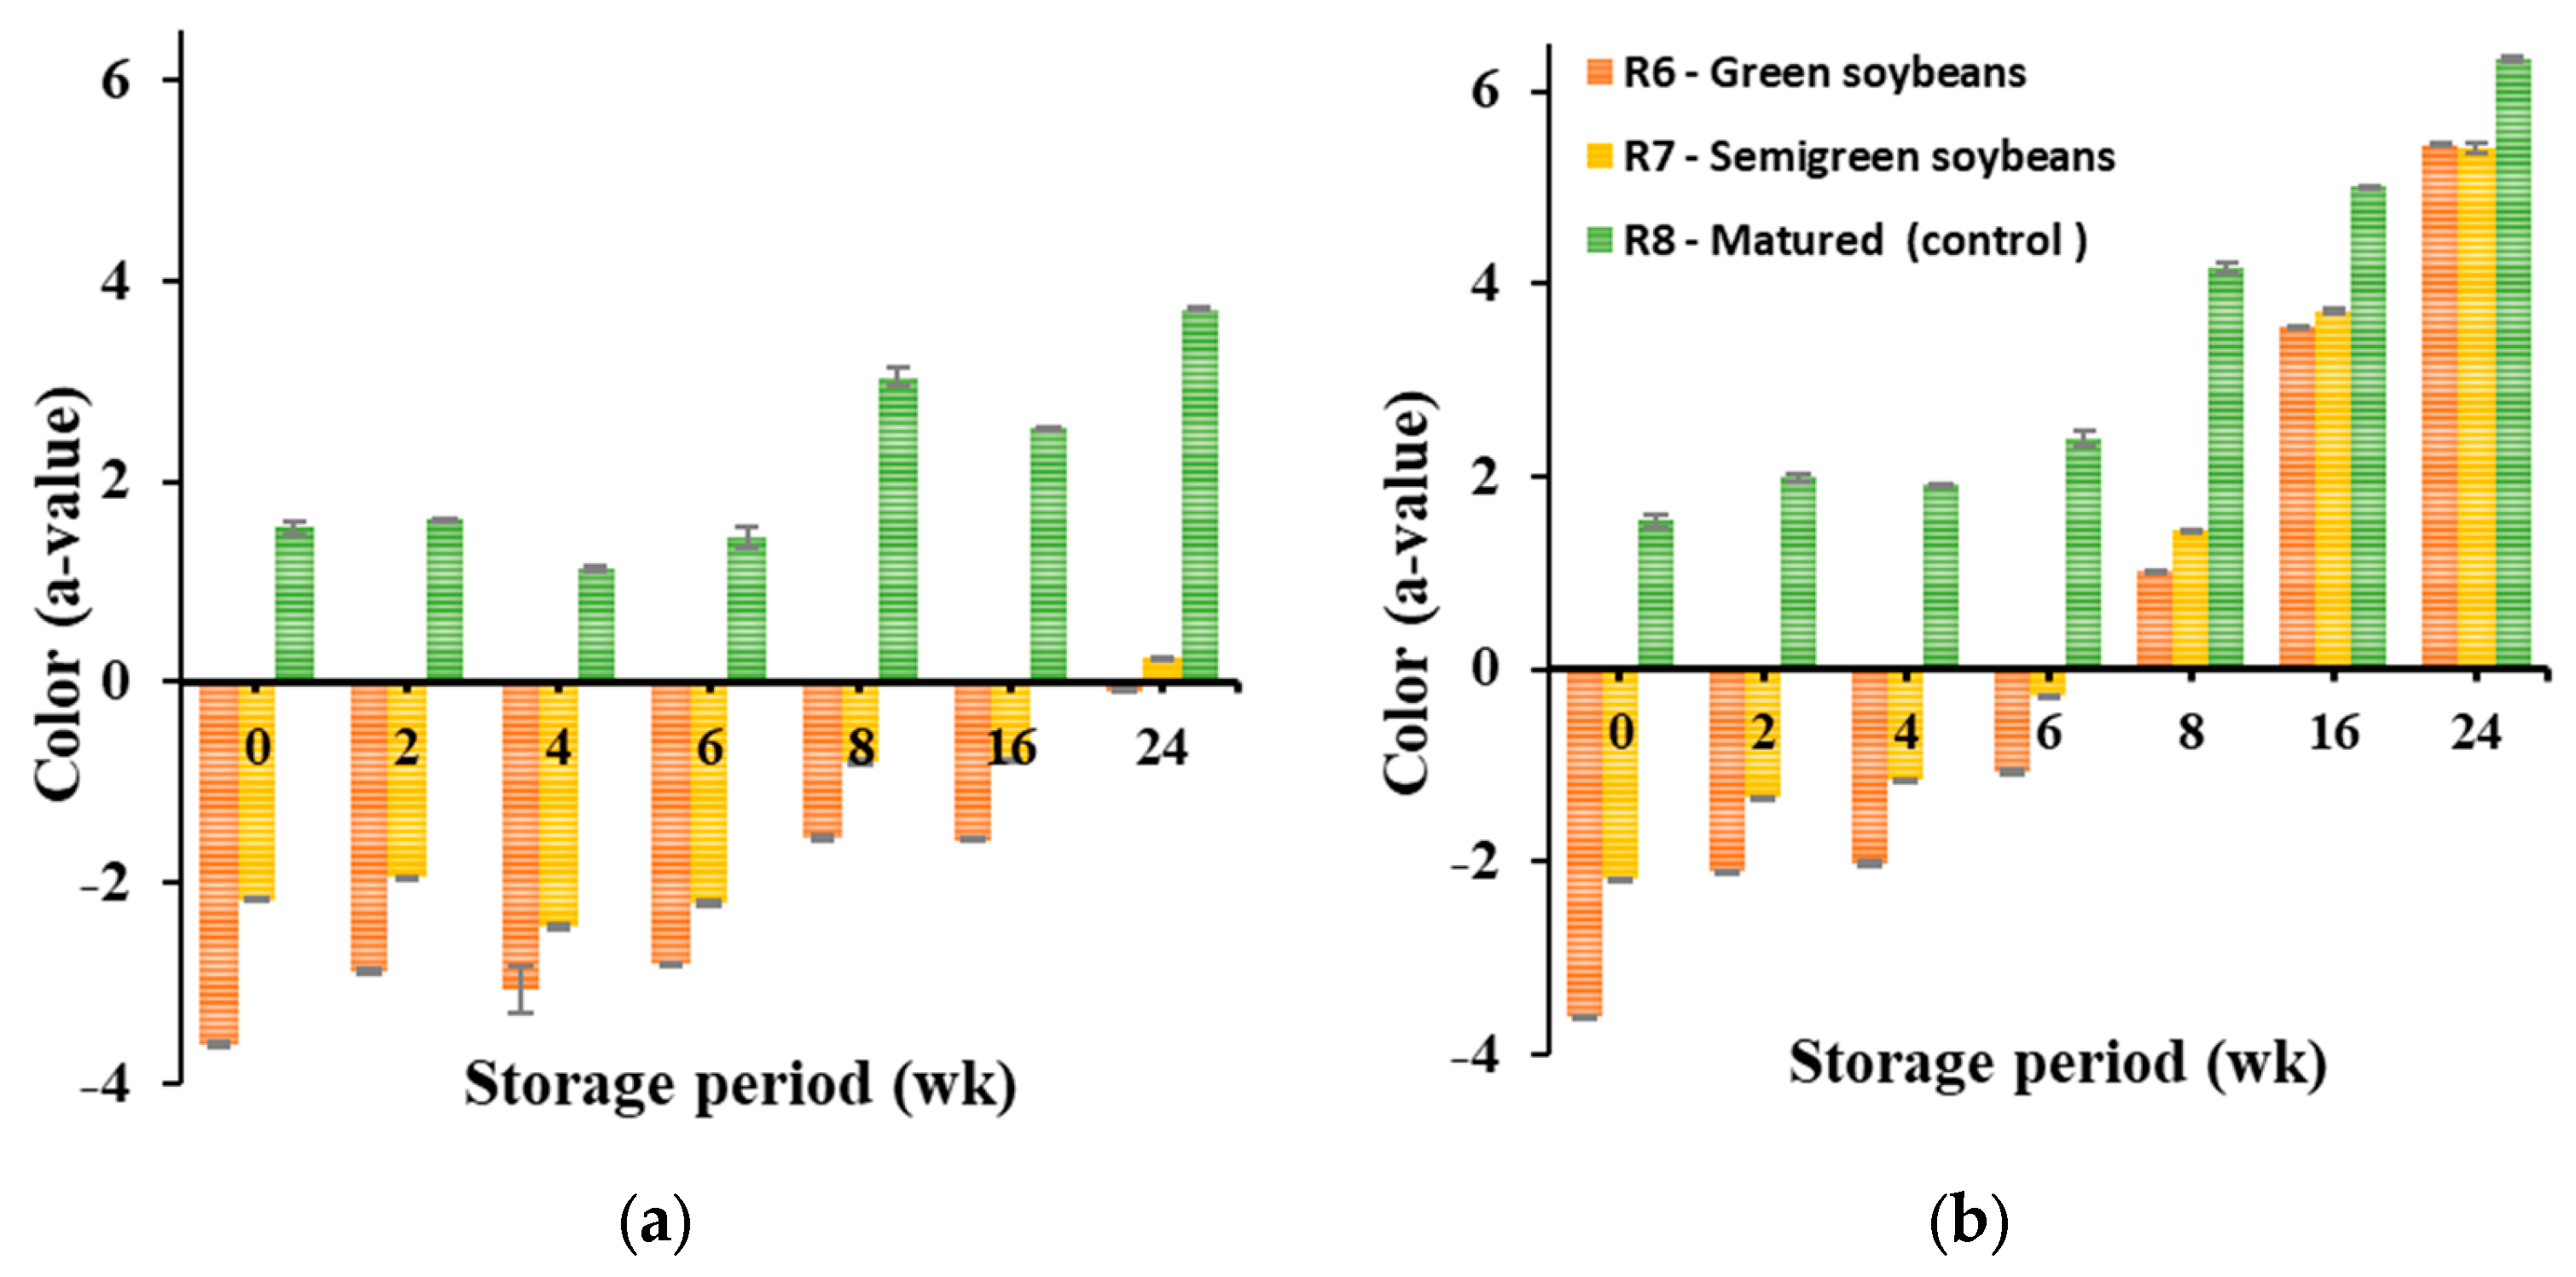
3.2. Effect of Storage Conditions on the Seed Color a-Value

There was still a substantial amount of green tone to the immature soybeans after drying (Figure 5b). It was therefore important to investigate if the color will continue to change during storage and ascertain the optimal conditions that facilitate the complete degradation of chlorophyll in the beans after drying. Therefore, an ANOVA in Table 2 was developed to determine the main and interaction effects on the Hunter color a-value of the stored seeds. Interestingly, all the main factors were significant including all two-way and some three-way interactions at p-value < 0.05. In addition, the main effects (factors) contributed to more than 83% of the source of variation (SOV) observed in the color and less than 17% of the variation was due to the two-way and three-way interactions of these factors. Approximately 65% of the SOV of the color change from the main factors was attributed to differences in the maturity stage and storage time, of which the storage time alone contributed to approximately 38% of the variation in color. This clearly shows that a significant amount of color change will occur over time in storage irrespective of the other factors. The SOV of approximately 27% from the maturity stage alone can be ascribed to the inherent differences of the seeds at the three different maturity stages prior to storage. The other four main factors (moisture content, temperature, lighting, and aeration) can be termed as the storage environment and contribute to approximately 18% of the variation in color.
A closer look at these storage environment factors revealed that lighting conditions (factor) contributed the most to the SOV of the analyzed data. Of the remaining total 18% SOV of all storage environment factors, light alone contributed 14.6% (~81%) with less than 4% for the other factors (temperature contributing 1.6% and moisture content and aeration less than 1.8%). The differences in moisture content and aeration had a very small effect on the color change observed. In addition, the two-way and three-way interactions that were not significant in the ANOVA had either aeration or moisture content. Interactions that contributed the most SOV in the two-way and three-way interactions had either temperature, lighting, maturity stage, and storage time conditions present. Most of the two-way interactions that contributed to at least 5% SOV observed in color either had temperature, lighting, maturity stage, and storage time. In the three-way interactions, the only factors that contributed to this amount of SOV was the maturity stage, lighting, and storage time. Based on this finding, visualization plots were used to look in-depth at the effect of these interactions on the Hunter color a-value. A summary of the information table is provided in Table 3.
In Figure 6, three visualization plots were generated that show the three-way interactions comprising either temperature, light, maturity stage, and storage time significant at a p-value < 0.05. The visualization plots and charts average out the effect of moisture content and aeration. As illustrated earlier, moisture content and aeration had a minimal effect on the color change. Therefore, the focus was only on the effect of temperature and lighting over time across the different maturity stages on the Hunter color a-value of stored soybeans. The interaction conditions that give rise to the maximum change in a-values with reference to lighting and temperature conditions were observed.
In Figure 6a, the three-way interaction plot differs across the maturity stage and light combinations. The G_L (R6 Maturity Stage_Light) and SG_L (R7 Maturity Stage_Light) have very high color “a” values that increased steadily throughout the storage period when compared to the initial value of the R8 (fully matured) control. However, despite the increase in the a value for the Y_L-control (R8 Maturity Stage_Light), the profile looked different. The different maturity stages without light (NL) conditions for the same interaction plot showed a completely different pattern. The color “a” value does not increase steadily with a more compact profile for the G_NL (R6 Maturity Stage_No Light) and SG_NL (R7 Maturity Stage_No Light) throughout storage. For the Y_NL (R8 Maturity Stage_No Light) profile, this also behaved somewhat differently and these varying profiles are the outcome of this interaction. The effect of light on color change in R6 and R7 seeds is best visualized in the three-way interaction plots with a corresponding increase in the color a-value.
A similar pattern Is observed in the three-way maturity stage and temperature interaction combinations (Figure 6b) with higher bars in terms of color a-value for samples under light conditions irrespective of the storage temperature. On the contrary, the compact bars corresponded to lower color a-values for samples without light (NL) conditions, further showing the effect of minimal color change in the R6 and R7 maturity stage soybeans as previously observed in Figure 6a. In addition, samples stored at room temperature seemed to show slightly higher color change in comparison to the ones in the cold room irrespective of the maturity stage.
The last three-way interaction combination for lighting and temperature plot (Figure 6c) further emphasized the impact of light on the increase in color “a” value irrespective of the temperature condition in storage. The highest color a-value is recorded for samples under light conditions, again irrespective of the temperature of storage, with lower values observed for samples stored under no light conditions. These findings seemed to reveal the impact of light conditions on the increase in color a-value, which resulted in the fading away of the R6 green and R7 semi-green color of soybeans in storage. According to a University of Missouri study, sunlight and natural metabolic process were responsible for the decomposition of chlorophyll during soybean seed maturation [34]. Artificial lighting such as full spectrum fluorescent tubes has been shown to mimic and effectively simulate sunlight (natural light) because it characterizes the total visible spectrum [35]. A study reported the use of LED light to improve the quality of tomatoes [36]. Hence, in our study, the color change observed in the samples stored under florescence light can be attributed to similar results observed under field drying conditions because of sunlight.
Based on the outcome of the ANOVA analysis, to further appreciate the effect of light on the stored seeds, color a-value data were averaged out over moisture content, aeration, and temperature in Figure 7 to show the impact of the storage condition (specifically light) and storage period irrespective of other storage factors on the color change in the stored seeds. It was observed that generally, for all storage conditions without light or with light, an increase in the color a-value of stored soybeans was reported throughout the storage period.
For R6 (green) and R7 (semi-green) soybeans stored in boxes/chambers without light conditions (Figure 7a), only about a 63% increase in the initial color a-value of the fully matured R8 soybeans (control) was achieved at the end of the 24th week of storage. The color change was not close to that of the initial R8 (matured) control color a-value of +1.54. According to [24], a preliminary study finding showed that green soybeans showed very slight color change during six months storage in a dark cabinet. The effect of light on the development of green plants via photosynthesis has been known to be very important in their physiological maturity. Color change in terms of fading was also observed in the R8 control (fully matured) under this condition. As the length of the storage period increased, despite the absence of light, an increase in the color a-value of the R8 matured (control) recorded was about 141% from initial value of +1.54 to +3.72 by week 24 (Figure 7a).
In comparison, for soybeans stored under light conditions in Figure 7b, irrespective of the maturity stage, significant color change (an increase in the color a-value) was also marked by visible physical observation. This was evident via the fading away of the green tone color of the R6 and R7 soybeans shown in Figure 8 at the end of the 24th week of storage. R6 and R7 soybeans stored under light conditions by the 8th week of storage showed an increase from −3.61 to +1.02 and −2.18 to +1.44 in color a-values from week 0, respectively. This was about a 67% and 94% increase in color a-value with respect to the initial R8 (control) value of +1.54. By the end of the 24th week of storage, the increase in color a-values for R6 and R7 soybeans under this light condition had exceeded 353% and 350% with respect to the initial R8 (control) a-value (+1.54). At the end of the storage period, the maximum color a-values recorded in line with this percentage increase in color change are +5.44 and +5.40 for R6 green and R7 semi-green soybeans, respectively. Likewise, as observed for R8 soybeans stored without light, an increase in color a-value of R8 (control) was also logged under light conditions. In addition, the color a-value of R8 control under this condition exceeded the value of seeds without light by about 59% (a difference of +2.62) at the termination of the storage exercise.
Figure 8 shows the images of R6 (green seeds), R7 (semi-green seeds), and R8 (fully matured; control) maturity stage soybeans before storage (after drying-week 0) and after 24 weeks of storage. The images highlight the influence of lighting conditions (without or with light) on color change for all three maturity stages including the fully matured soybeans discussed in Figure 7.

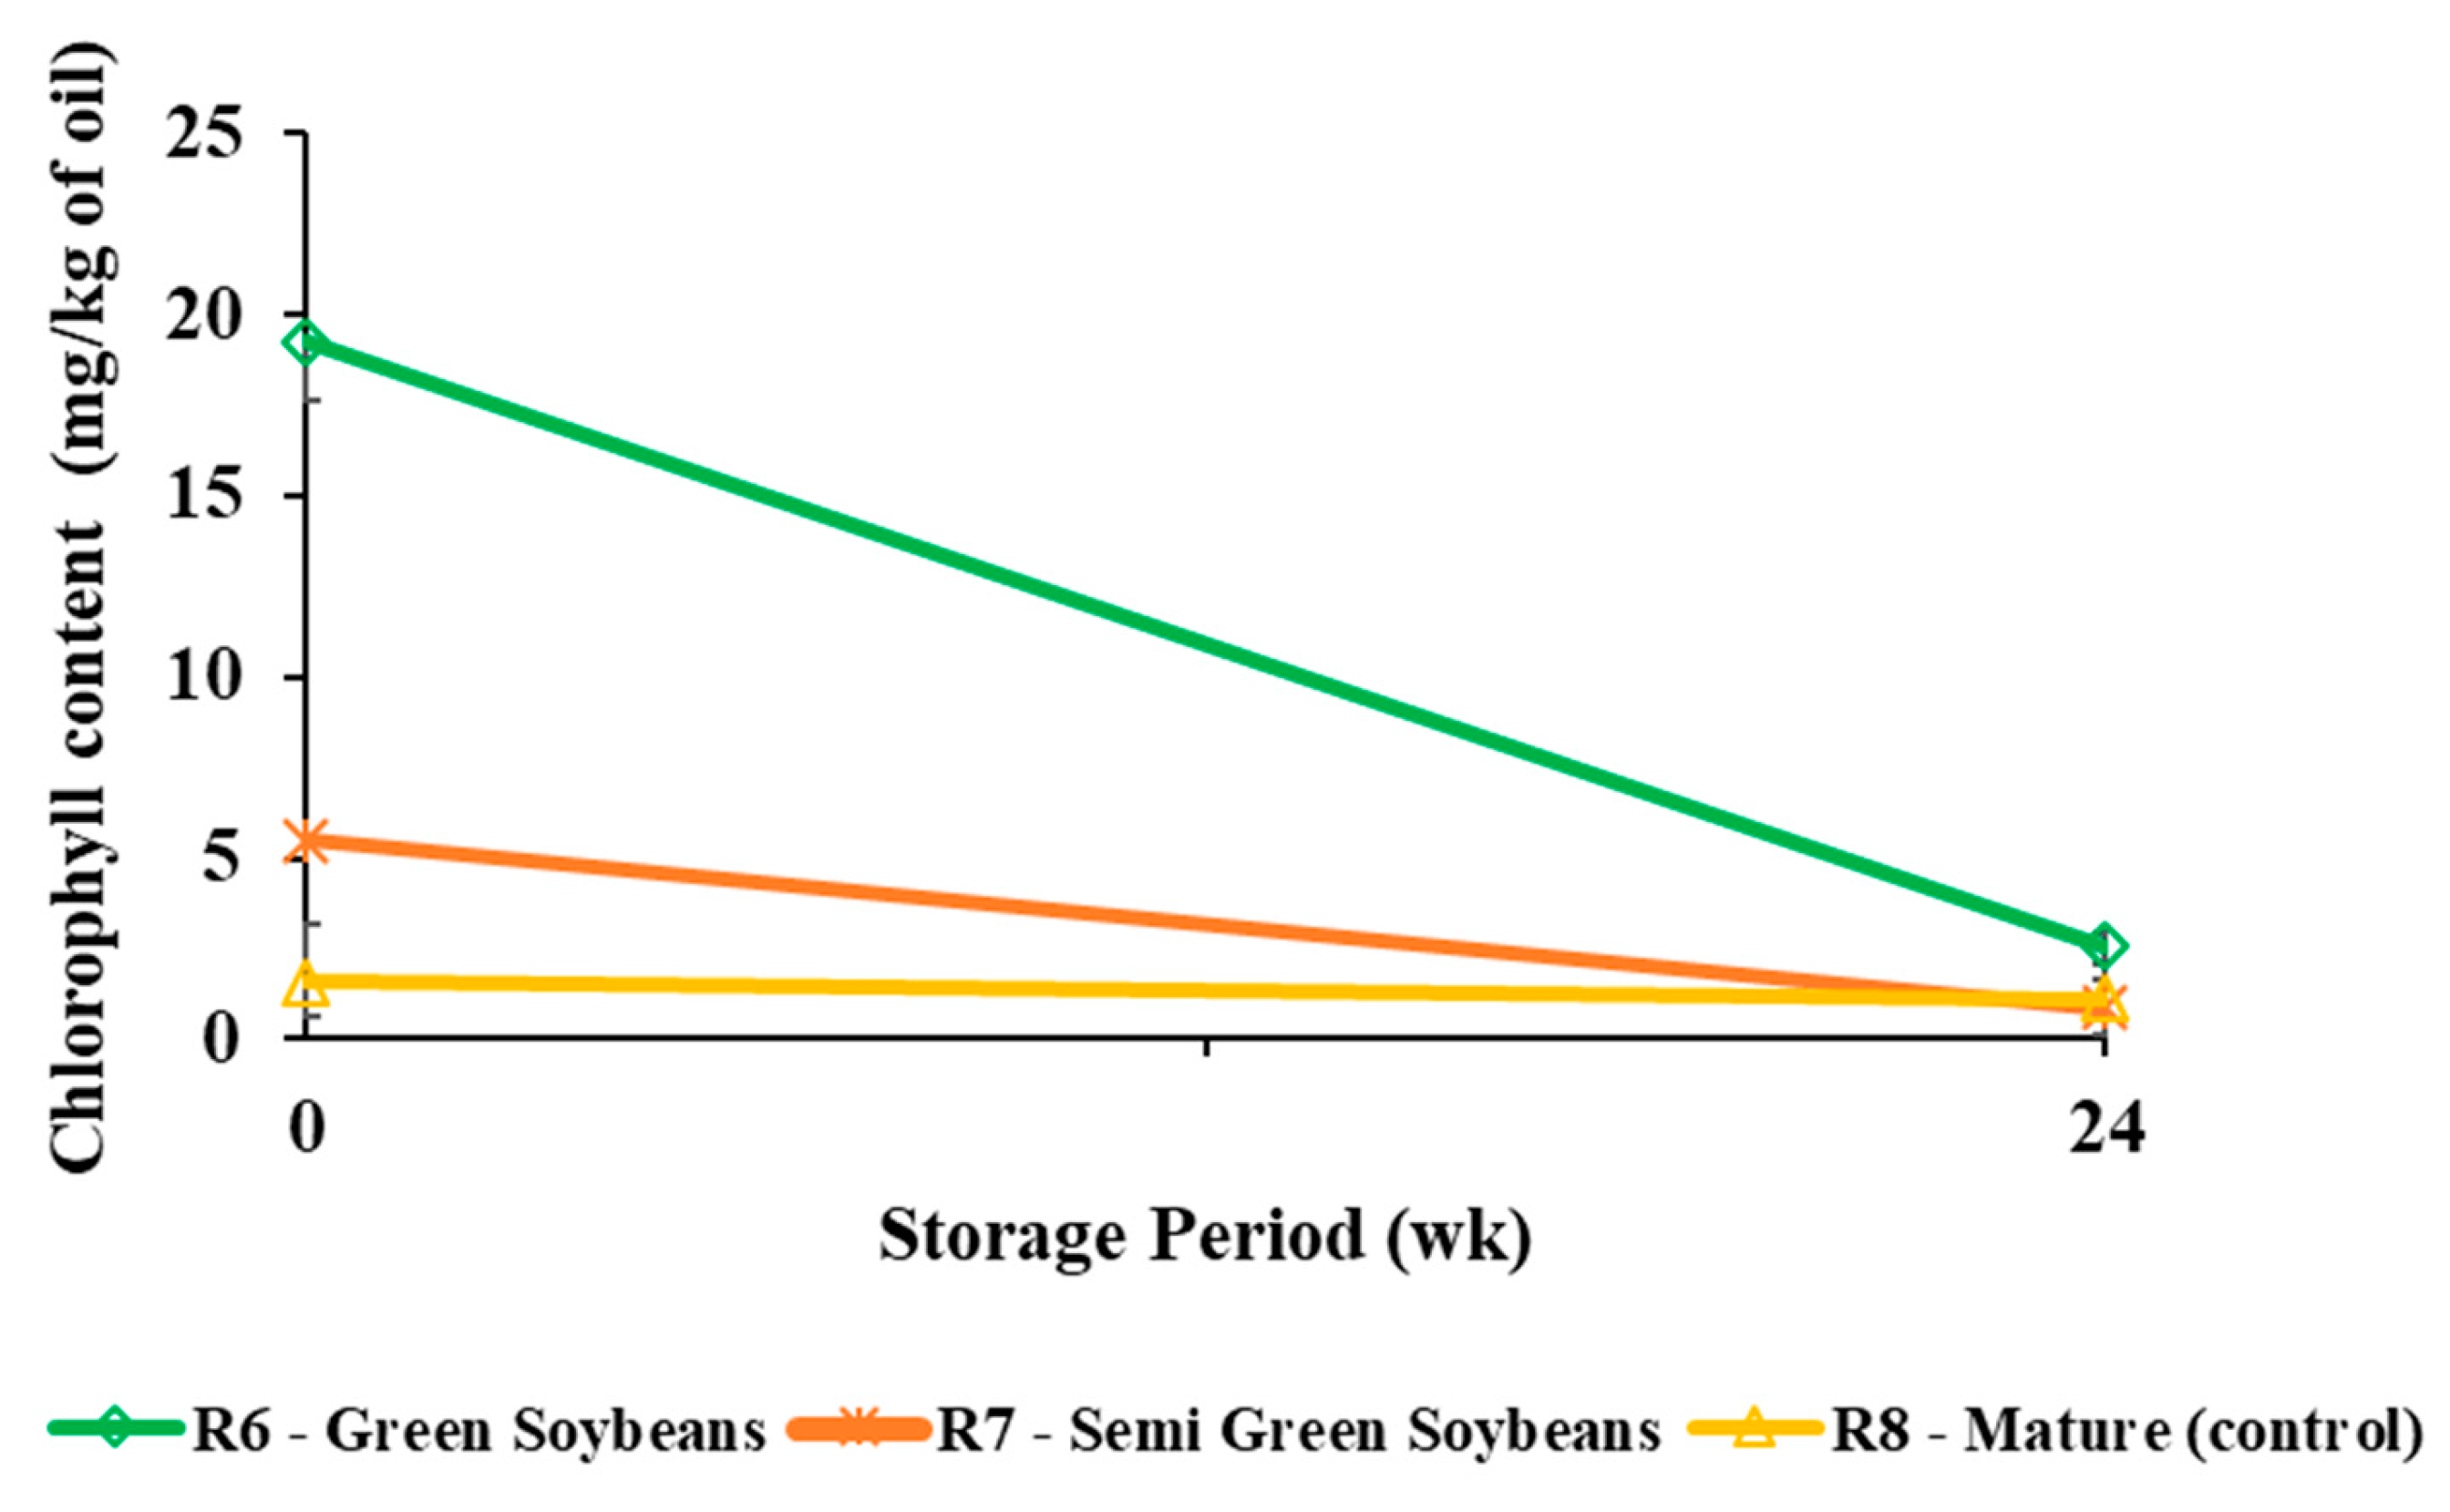
3.3. Chlorophyll Content
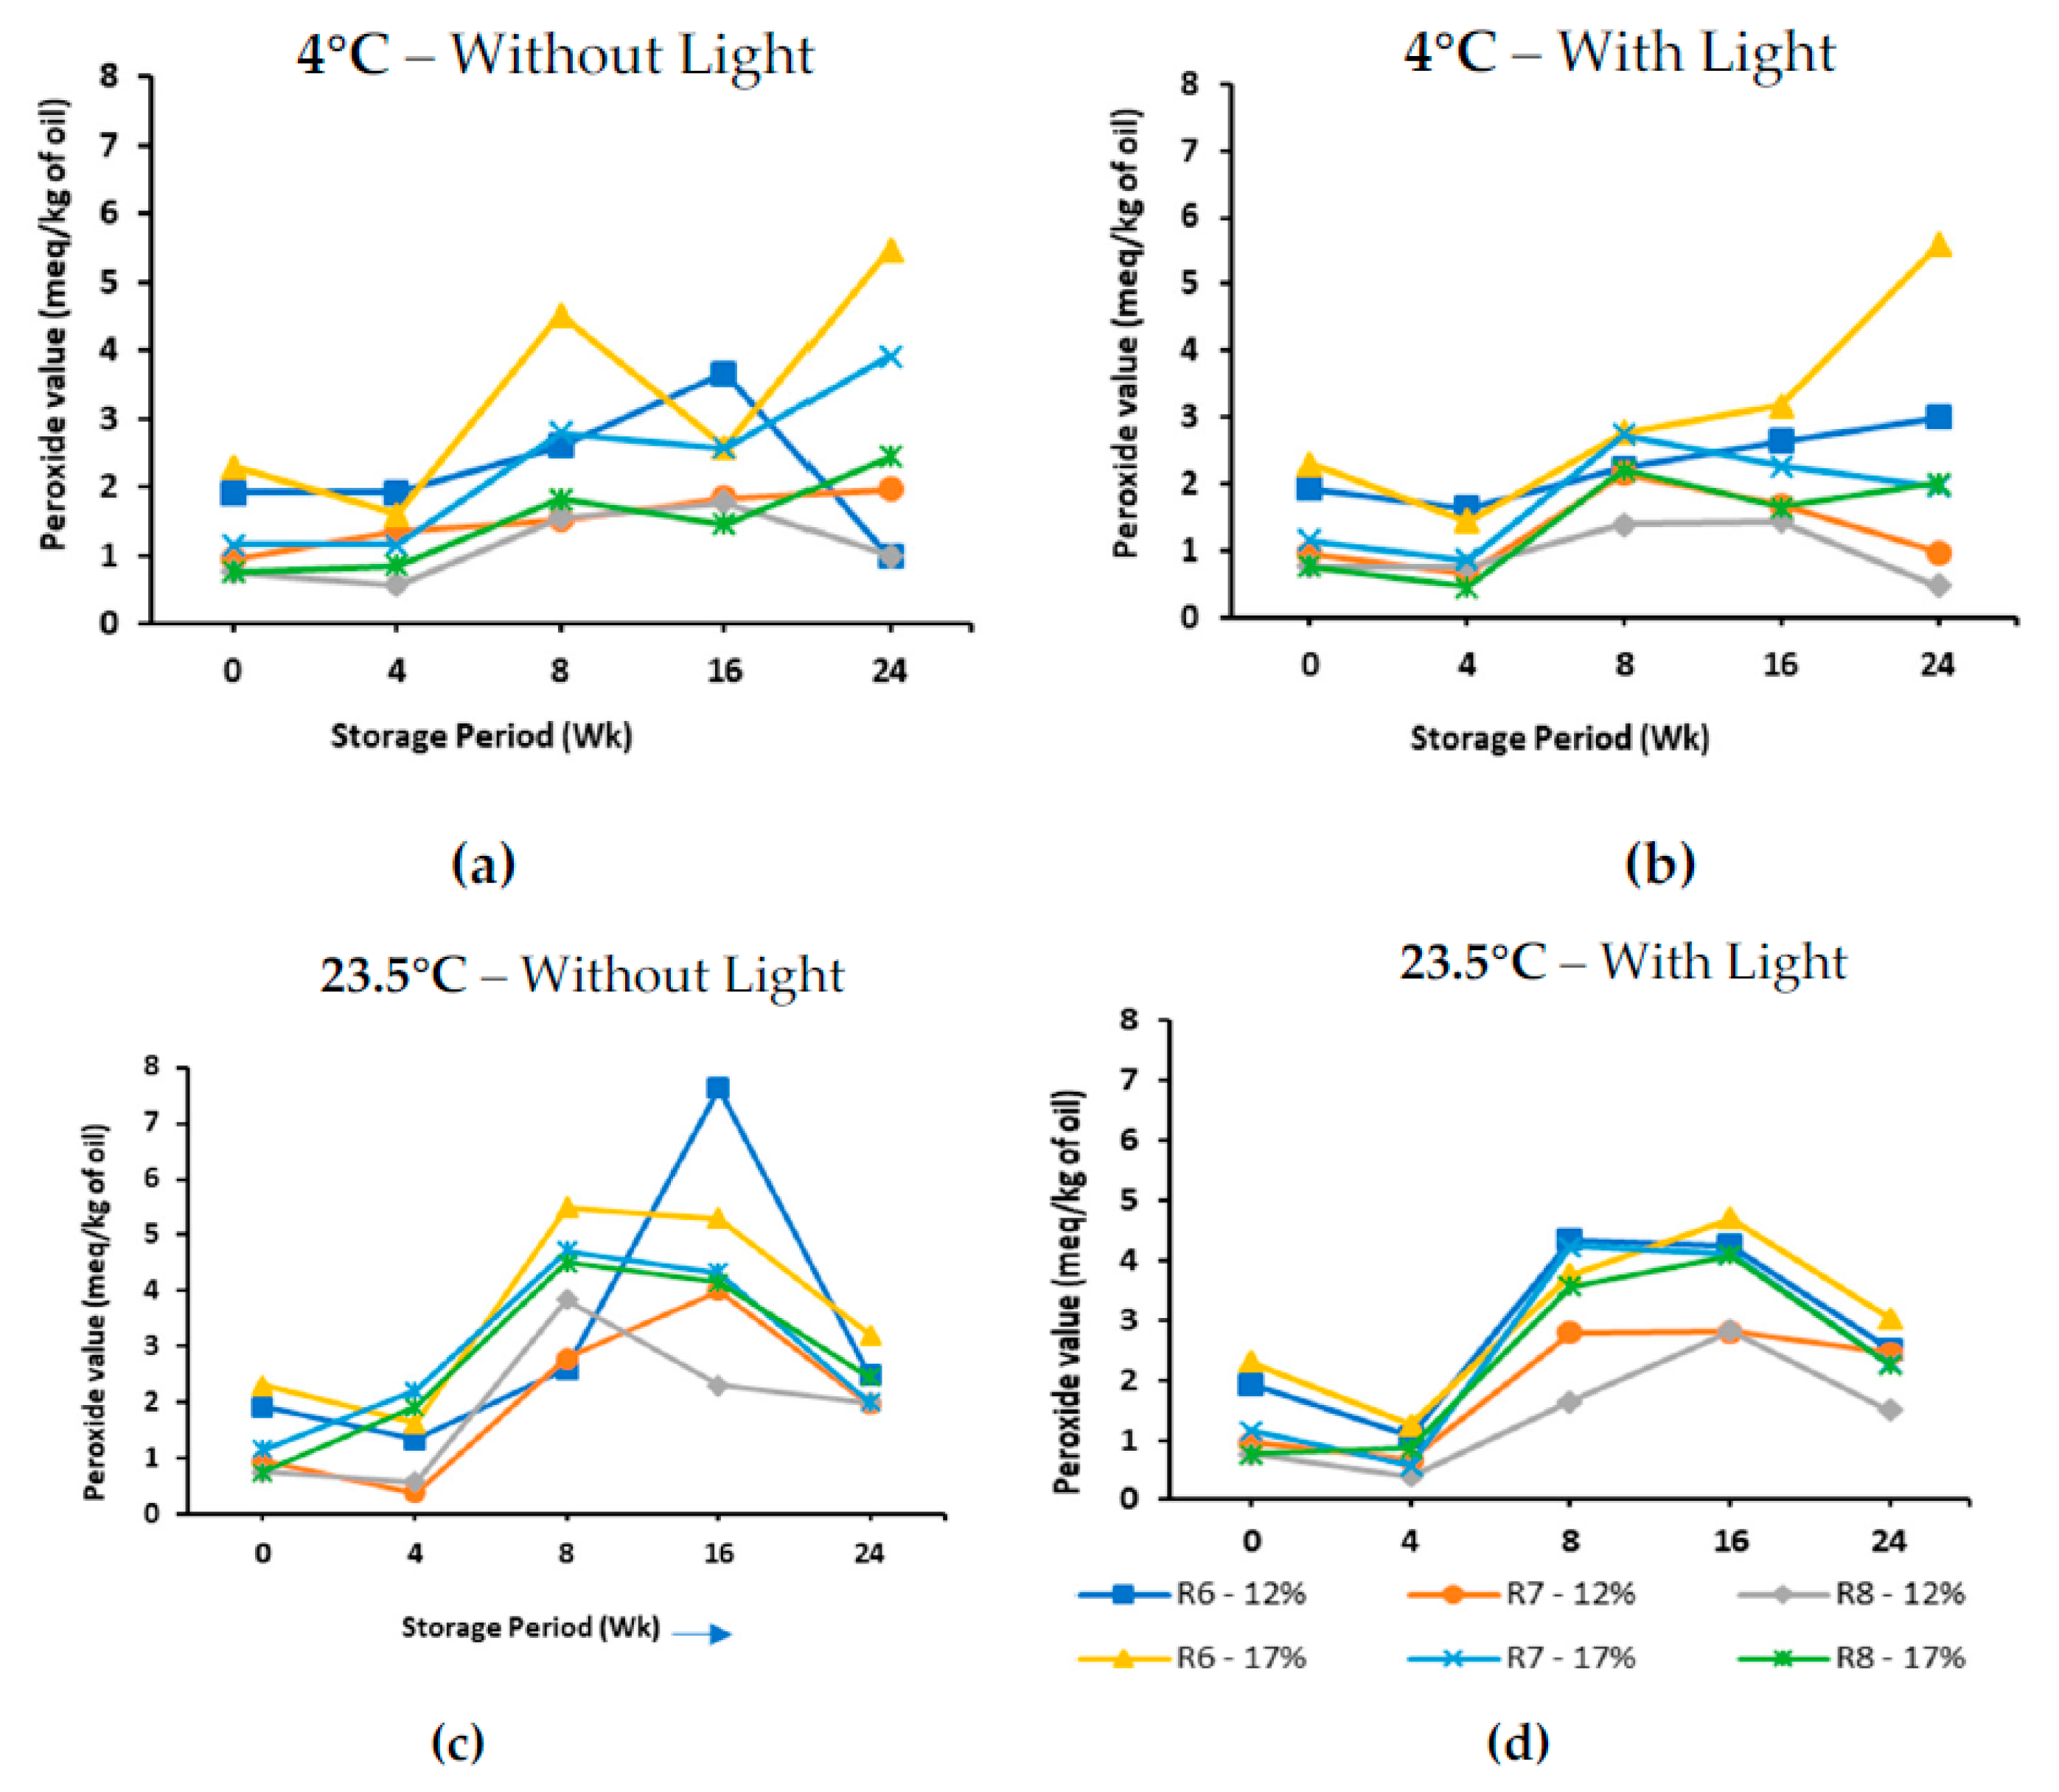
The previous subsection clearly shows the visual color of the stored soybean changed externally, especially for samples stored under light conditions. The presence of green soybean seeds in a soybean lot that exceeds 10% are heavily discounted at the elevator. This aesthetic is caused by chlorophyll pigmentation which is also present in the oil. The green tone appears in oil extracted from the seeds, increasing its refining cost. It was then important to see if this change in the color of stored soybeans was reflected in the oil. Chlorophyll content degradation during soybean maturation is used as a predictor of color change in soybean seeds during physiological maturity prior to harvest. Figure 9 shows the chlorophyll content of the oil extracted from R6, R7, and R8 (control) soybeans after drying (prior to storage) at week 0 and after 24 weeks of storage under light conditions. Extracted oil from R6 (green) and R7 (semi-green) seeds irrespective of moisture content after drying exhibited deep green pigmentation shown in Figure 10.
At the start of storage, the chlorophyll content in R6 and R7 samples were approximately 20 mg/kg and 6 mg/kg, respectively, while low levels of about 1.59 mg/kg of oil was recorded for the R8 (matured) control. These high chlorophyll contents recorded for the R6 and R7 at week 0 were characterized by a deep green tone to oil extracted from the seeds as shown in Figure 10. However, a deep yellow coloration existed in oil from R8 soybeans at week 0 due to the low amount of chlorophyll present in the fully matured seeds. At the end of the 24th week of storage, the chlorophyll content of the oil from R6 soybean stored under light conditions had dropped to 2.57 mg/kg. Likewise, the chlorophyll content of R7 seeds at the end of the 24th week of storage was similar to that of the R8 (matured control). The chlorophyll content of the R8 matured seeds remained relatively the same between weeks 0 and 24 in storage.
At the end of the storage period, oil extracted from R6 and R7, under this same condition, showed the most evident fading away of green color in stored soybeans as explained under the color change in the stored seeds section above. It is remarkably interesting to see the fading away of the green coloration in the R6 and R7 maturity soybeans for samples stored under light at the end of the experiment. These findings support the fading away of the green tone of R6 and R7 soybeans observed after 24 weeks of storage for soybeans stored under light. This also shows a relationship between the color change, chlorophyll content, and oil color of stored seeds.

3.4. Peroxide Value

The peroxide value is one of the most important indicators of primary oxidation in oils, especially during storage. Peroxidation occurs in the presence of oxygen and a favorable temperature, leading to the formation of hydroperoxides that contribute to rancidity in oils. Considering the early maturity stages at which soybeans were harvested in this study, it was important to determine the initial condition of the oil prior to storage and to monitor the changes in the oil under the different storage conditions. Oil processors refine oil prior to commercialization. Limits have been established to determine the acceptable peroxide limits in oils. According to the International Codex Alimentarius Commission [37], the maximum acceptable limit of peroxide value in virgin and cold-pressed crude oil is 15 meq of active oxygen/kg of oil. Figure 11 shows the peroxide value changes at the two storage temperatures under lighting conditions (with and without light). Initial peroxide values before storage were slightly higher in oil extracted from R6 soybeans compared to R7 and the R8 control at both moisture contents of 12% and 17%.
Rapeseed oil oxidation was promoted in the presence of light, resulting in a high number of peroxides [38]. This was not the case in our findings as our soybean seeds were the primary recipient of lighting factor. The oil was extracted from the soybean seeds after each sampling date for immediate analysis. For samples stored without light and under light conditions at 4 °C, 17% moisture soybeans at R6 showed an increase in peroxide value of 5.48 meq/kg and 5.59 meq/kg of oil at the end of the 24th week of storage. A slight increase in peroxide value was also observed for R6 soybeans stored at 12% moisture content at the 16th week of storage at both temperatures. It appears that the presence of chlorophyll in R6 and R7 maturity stage soybeans served as a photosynthesizing agent that activated the increase in the peroxide value when compared to the R8 control with an initial value of 0.77 meq/kg throughout the storage period [38].
For R6 soybean samples at 17% M.C. (Figure 11a) and R6 at 12% M.C. (Figure 11c) stored under no light conditions, the moisture content, maturity stage, and storage temperature affected the peroxide value (PV). At 4 °C, between weeks 8 and 24, R6 17% M.C. seeds had higher PV compared to the R8 control. This could be due to the higher moisture content and initial values of peroxide.
At a warm temperature (23.5 °C), between weeks 4 and 16, a rise in PV was recorded for R6 and R7 soybeans including the R8 (control) irrespective of the moisture content. The initial increase could arise from the storage temperature and presence of chlorophyll compound, resulting in the formation of hydroperoxides causing lipid oxidation during storage [39]. The deterioration in oil quality was faster for R6 at both 12 and 17%, as reflected by the higher PV values at this temperature. After 16 weeks of storage, PV decreased. Since hydroperoxides are unstable, they break down into secondary oxidation products. The decrease observed after the 16th week of storage can be attributed to the rapid decomposition of the hydroperoxides to form volatile organic compounds [40].
R6 maturity stage soybeans at 12% moisture content had a maximum peroxide value of about 7.63 meq/kg of oil and 17% soybeans had a maximum of 5.49 meq/kg of oil under no light conditions. Interestingly, the peroxide value of R6 and R7 maturity soybeans stored under this same condition with light revealed lower values that could probably be attributed to the fading away of the green and semi green tone of the color of R6 and R7 soybeans. Due to the fading observed in the color of soybeans stored under light conditions, a reduction in the chlorophyll content was observed during storage till the end of the experiment as discussed in Section 3.3 above. The lower PV values recorded may be due to the lower chlorophyll content in the extracted oil at a storage temperature of 23.5 °C. In Figure 11d, the same trend of reduction in the PV was observed between week 16 and week 24 for samples stored at warm temperature (23.5 °C). The decrease showed the formation of secondary oxidation products after the 16th week of storage. In summary, the effect of the storage temperature, lighting condition, and maturity stage of soybean affected the chlorophyll content of the oils and contributed to the changes in the peroxide value. The results from this study indicated that the peroxide value of oil from stored seeds irrespective of the maturity stage and storage temperature were below the acceptable limit (<15 meq of active oxygen/kg of oil) for moderate oxidation at the end of the sixth month of storage.

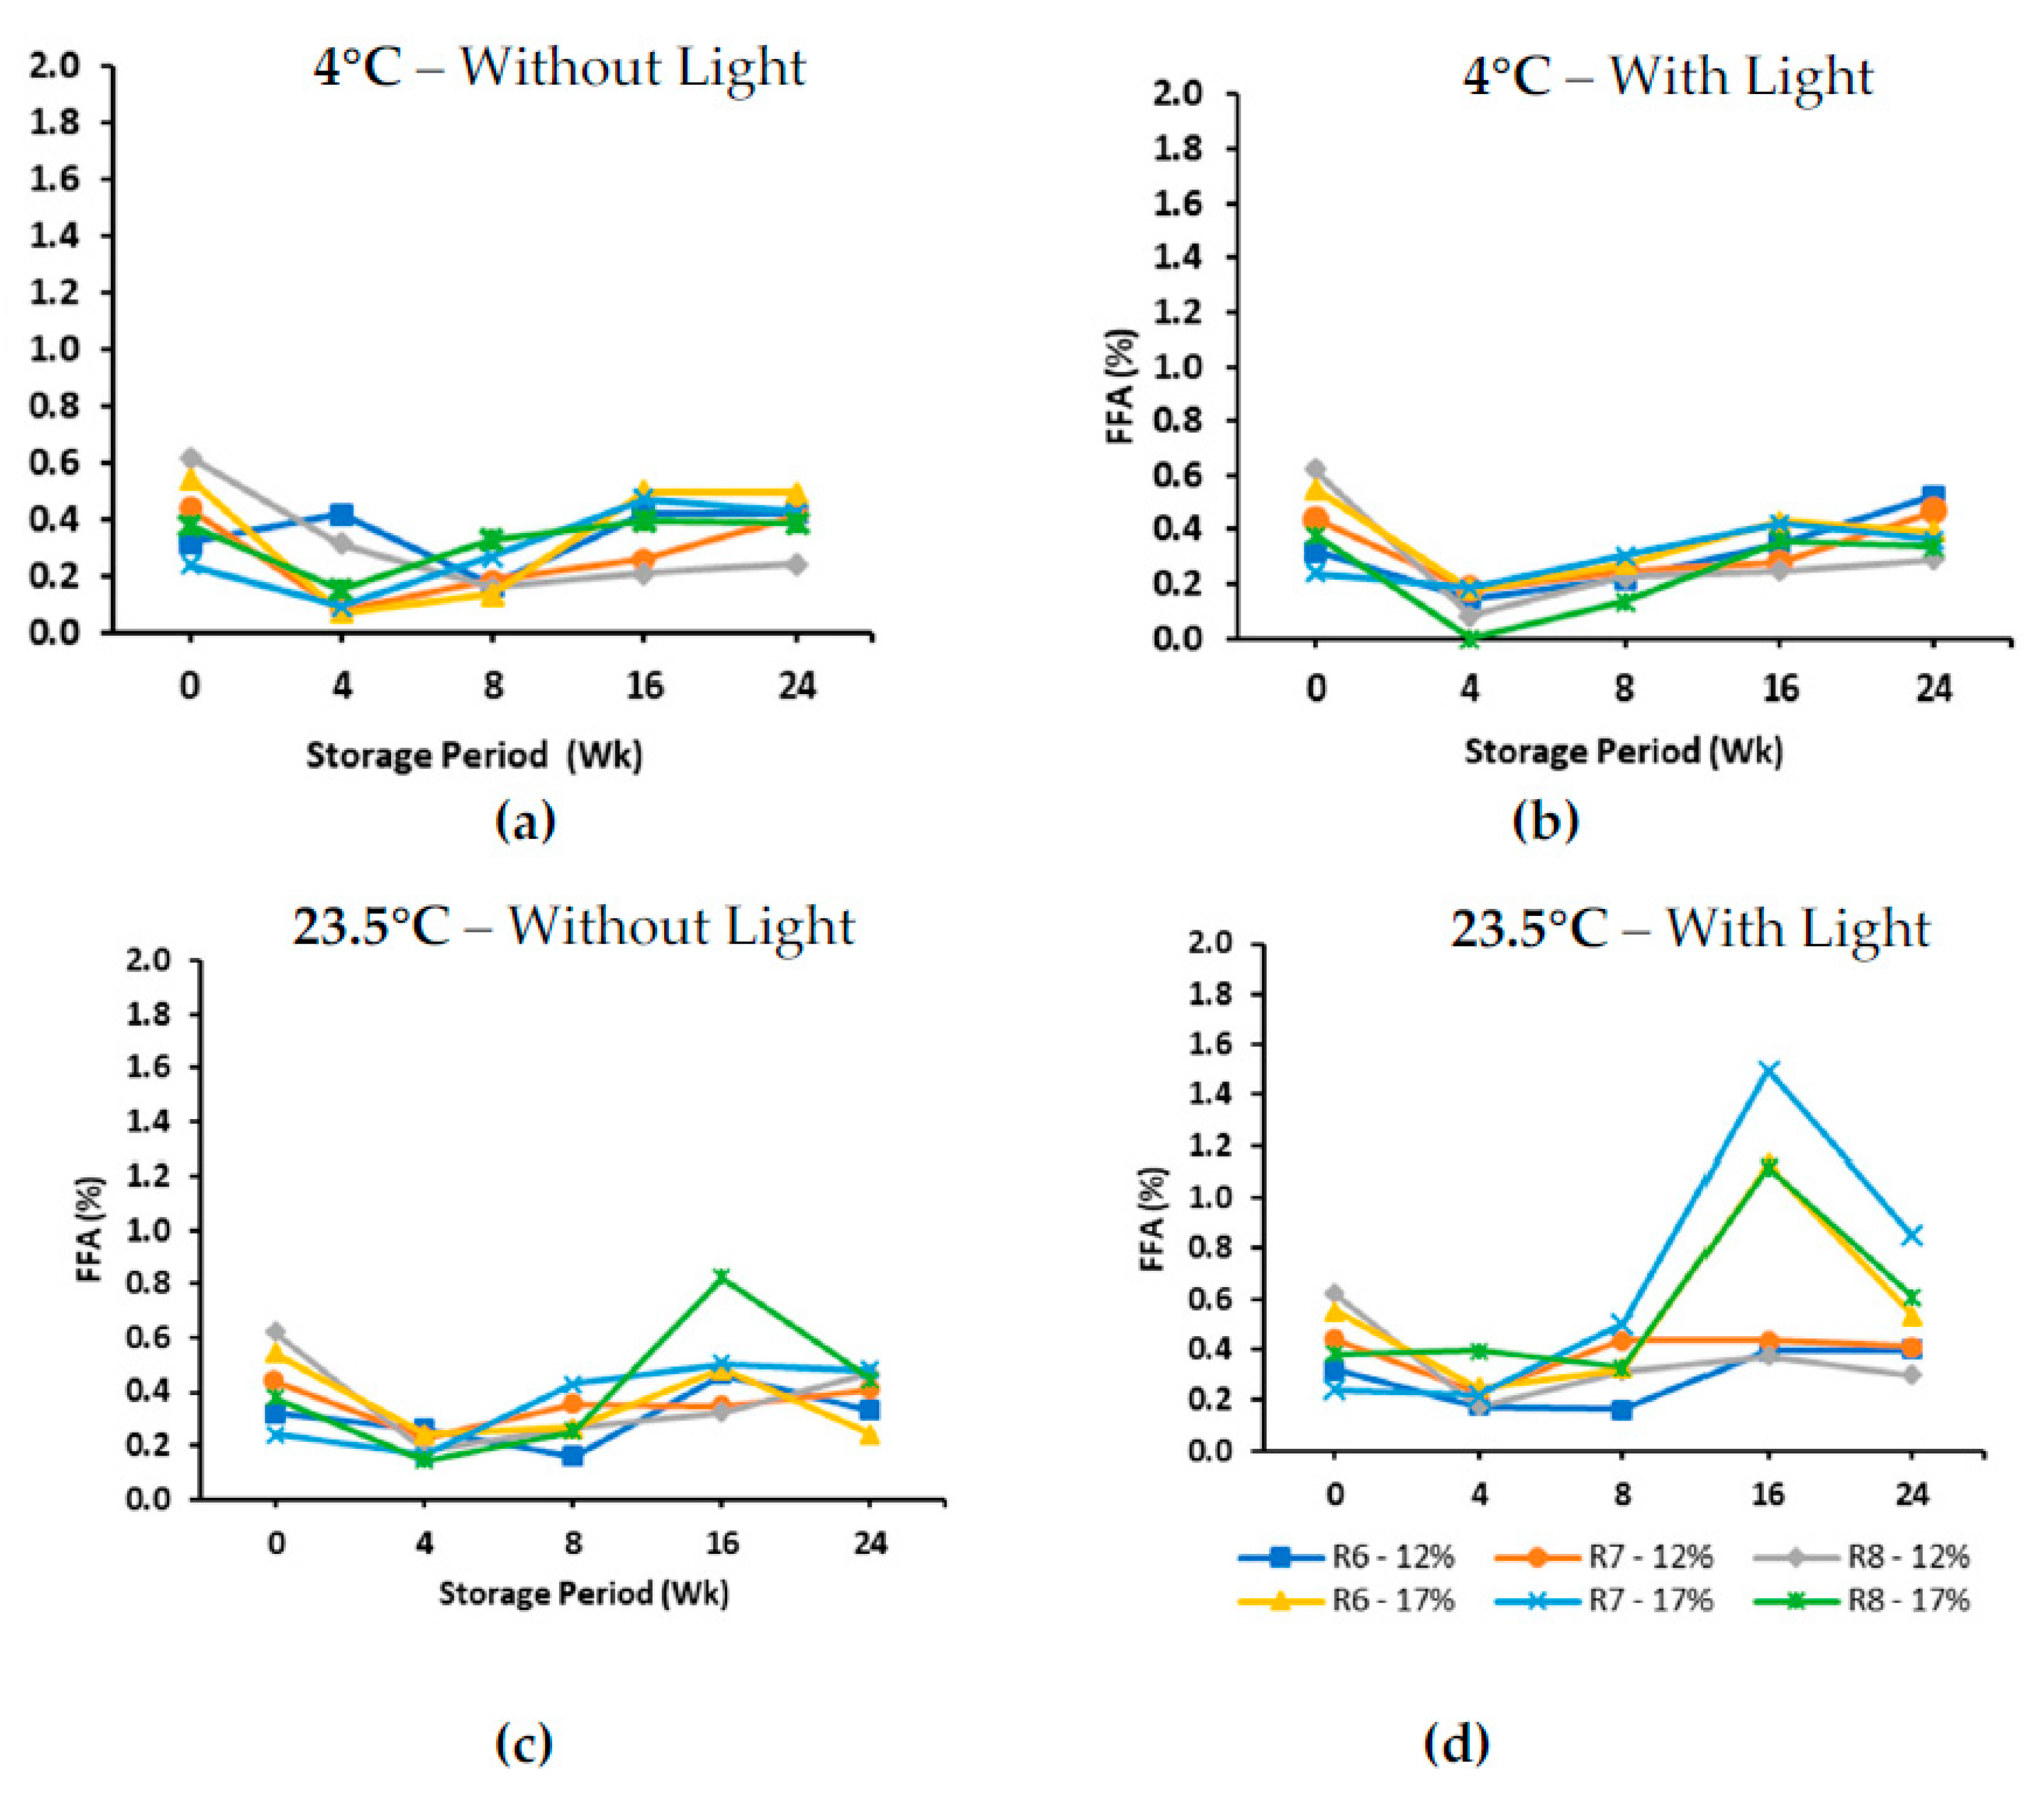
3.5. Free Fatty Acid Value

Free fatty acids (FFA) are the direct product of hydrolysis due to the enzyme lipase under high temperature and high moisture from stored grains. The presence of free fatty acids in oil promotes oil oxidation through formation of hydroperoxides, hence causing off flavor and rancidity. The free fatty acid content has been used as a measure of the quality of stored grain. The US National Oilseed Processors Association (NOPA) grading and trading standards recommends a maximum acceptable level of 0.75% for good quality crude soybean oil. Figure 12 shows the changes in FFA values of soybeans stored at 4 and 23.5 °C with and without light.
In general, very low levels of FFA were recorded for soybeans throughout the storage period at 4 °C. The values were within the acceptable limit irrespective of the maturity stage and moisture content of the soybeans. In addition, an effect of lighting conditions (with or without light) was not observed on the FFA content. Many studies have reported that FFA development is retarded at storage temperatures that are below 10 °C and with soybeans below 17% moisture content in stored grains over a six-month period [41,42,43]. However, there was a slight increase observed in FFA content for samples stored at a warm temperature of 23.5 °C. For samples under light conditions and at 17% moisture, it was observed that FFA content increased to 1.13%, 1.50%, and 1.12% after 16 weeks of storage for R6, R7, and R8 (control) soybeans. These values all exceeded the acceptable limit and the increase in FFA values can be likely due to the high moisture content of the seeds and temperature of storage.
Higher values of FFA content in immature soybeans at R6 and R7 maturity stages have been reported in the literature, which are due to the presence of chlorophyll. The low levels recorded in this study could be due to the degradation of chlorophyll in stored seeds especially for the samples under light conditions prior to oil extraction and oil analysis. Overall, the higher moisture content of stored seeds at warmer temperatures was more responsible for the rapid increase in FFA content. A study reported higher oil quality degradation in oil samples exposed to cold fluorescent light [44], which was not the case for our study.

4. Conclusions

The results of this study showed that drying affected the color change in the seeds before storage. Also, light and storage time affected the color of stored seeds. As a result of light conditions and 24 weeks of storage, an increase in color a-value was observed compared to the beginning of the storage period. This increase was very high and was observed after eight weeks of storage, showing the fading away of the green color in the seeds. The results also indicate that moisture content and storage temperature affected the increase in peroxide value. It might be helpful for farmers to leave their immature soybeans to field-dry. This can help improve the color of the soybeans at harvest.

Author Contributions

I.A.-B.: Methodology, Formal analysis, Resources and Material Preparation, Data Curation, Writing—Original Draft, and Writing—Review and Editing. K.H.: Conceptualization, Methodology, Funding acquisition, Supervision, Project administration, Reviewing, and Discussion. E.M.: Conceptualization, Methodology, Project administration, Supervision, and Writing—Review and Editing. J.T.: Methodology, Resources, and Writing—Review and Editing. S.Y.: Methodology and Resources. All authors have read and agreed to the published version of the manuscript.

Funding

This research was funded by orth Dakota Soybean Council, North Dakota Agricultural Experimental Station, USDA-NIFA Hatch Multi-State Project Number ND01491.

Data Availability Statement

Data used are contained within the article.

Acknowledgments

The authors would like to acknowledge the North Dakota Soybean Council for the funding support. Special appreciation goes to North Dakota State University for the facility made available to carry out the research work.

Conflicts of Interest

The authors declare no conflicts of interest.

References

  1. USDA-FAS. United States Department of Agriculture—Foreign Agricultural Service 2022 Agricultural Export Yearbook. 2022. Available online: https://www.fas.usda.gov/sites/default/files/2023-05/2022-Yearbook.pdf (accessed on 6 January 2022).
  2. Hammond, E.G.; Johnson, L.A.; Murphy, P.A. SOYBEAN|Grading and Marketing. In Encyclopedia of Grain Science; Wrigley, C., Ed.; Elsevier: Oxford, UK, 2004; pp. 155–159. [Google Scholar]
  3. USDA-AMS-FGIS. United States Department of Agriculture-Agricultural Marketing Service-Federal Grain Inspection Service. 2023. Available online: https://www.ams.usda.gov/content/usda-seeks-comments-proposed-amendments-us-standards-soybeans-remove-soybeans-other-colors (accessed on 5 November 2023).
  4. Bohner, H.; Tenuta, A. What Happens to Soybeans When They Get Frosted; Field Crop News: OMAFRA: Stratford, ON, Canada, 2013; Available online: https://fieldcropnews.com/2013/09/what-happens-to-soybeans-when-they-get-frosted/ (accessed on 15 June 2019).
  5. Hurburgh, C.; Vittetoe, R.; Anderson, M. Frost Damage to Soybeans; IOWA State University Extension and Outreach, IOWA: Ames, IA, USA, 2019; Available online: https://crops.extension.iastate.edu/blog/charles-r-hurburgh-meaghan-anderson-rebecca-vittetoe/frost-damage-soybeans-0 (accessed on 6 September 2019).
  6. Butzen, S. Managing delayed or frost-damaged soybeans. In Soybean Reproductive Growth Stages; Corteva: Johnston, IA, USA, 2019. [Google Scholar]
  7. Judd, R.; TeKrony, D.; Egli, D.; White, G. Effect of Freezing Temperatures during Soybean Seed Maturation on Seed Quality 1. Agron. J. 1982, 74, 645–650. [Google Scholar] [CrossRef]
  8. USDA-AMS. USDA Announces Amendments to the U.S. Standard Soybeans. 2023. Available online: https://www.ams.usda.gov/content/usda-announces-amendments-us-standards-soybeans (accessed on 20 October 2023).
  9. Barker, B. Soybean Green Seed and Pulse Seed Quality; Saskatchewan Pulse Growers: Saskatoon, SK, Canada, 2017. [Google Scholar]
  10. CGC. Soybeans: Grading Factors Official Grading Guide. 2021. Available online: https://www.grainscanada.gc.ca/en/grain-quality/official-grain-grading-guide/20-soybeans/grading-factors.html (accessed on 11 November 2022).
  11. Dawson, A. Same Sample Different Grades for Green Seed Soybeans; 2018. Available online: https://www.manitobacooperator.ca/crops/shop-around-green-seeded-soybeans-to-get-your-best-grade/ (accessed on 4 September 2019).
  12. Lange, D. Advice on Green-Seeded Soybeans, 2018.
  13. Sinnecker, P.; Gomes, M.S.O.; Arêas, J.A.G.; Lanfer-Marquez, U.M. Relationship between color (instrumental and visual) and chlorophyll contents in soybean seeds during ripening. J. Agric. Food Chem. 2002, 50, 3961–3966. [Google Scholar] [CrossRef] [PubMed]
  14. Leon, K.; Mery, D.; Pedreschi, F.; Leon, J. Color measurement in L* a* b* units from RGB digital images. Food Res. Int. 2006, 39, 1084–1091. [Google Scholar] [CrossRef]
  15. Wu, D.; Sun, D.-W. Colour measurements by computer vision for food quality control—A review. Trends Food Sci. Technol. 2013, 29, 5–20. [Google Scholar] [CrossRef]
  16. Francis, F.J. Color measurement and interpretation. In Instrumental Methods for Quality Assurance in Foods; Routledge: London, UK, 2017; pp. 189–209. [Google Scholar]
  17. Cenkowski, S.; Sokhansanj, S.; Sosulski, F. The effect of drying temperature on green color and chlorophyll content of canola seed. Can. Inst. Food Sci. Technol. J. 1989, 22, 383–386. [Google Scholar] [CrossRef]
  18. Alencar, E.R.d.; Faroni, L.R.D.; Peternelli, L.A.; da Silva, M.T.C.; Costa, A.R. Influence of soybean storage conditions on crude oil quality. Rev. Bras. Eng. Agrícola Ambient. 2010, 14, 303–308. [Google Scholar] [CrossRef]
  19. Delouche, J.C. Physiological Changes during Storage That Affect Soybean Seed Quality; 2021. Available online: https://scholarsjunction.msstate.edu/cgi/viewcontent.cgi?article=1122&context=seedtechpapers (accessed on 5 November 2023).
  20. Conceição, M.M.; Fernandes, V.J.; Araújo, A.S.; Farias, M.F.; Santos, I.M.; Souza, A.G. Thermal and oxidative degradation of castor oil biodiesel. Energy Fuels 2007, 21, 1522–1527. [Google Scholar] [CrossRef]
  21. Carr, R.; Applewhite, T. Oilseed harvesting, storage and transportation. In Proceedings of the World Conference on Oilseed Technology and Utilization; AOCS Press: Urbana, IL, USA, 1993; pp. 118–125. [Google Scholar]
  22. Anonymous. Use Caution When Drying Soybeans. In No-Till Farmer; 2009. Available online: https://www.no-tillfarmer.com/articles/919-use-caution-when-drying-soybeans (accessed on 16 July 2019).
  23. OMAFRA. Green Soybeans—Can They Be Fed? 2021. Available online: https://omafra.gov.on.ca/english/live-stock/swine/facts/info_green_soybeans_fed_html (accessed on 10 January 2020).
  24. Wilcke, B. Post-Harvest Management of Immature Corn and Soybeans. In Proceedings of the Integrated Crop Management Conference; Iowa State University: Ames, IA, USA, 1995. [Google Scholar]
  25. Alencar, E.R.d.; Faroni, L.R.; Lacerda Filho, A.F.; Peternelli, L.A.; Costa, A.R. Quality of soy bean grains stored under different conditions. Rev. Bras. Eng. Agrícola Ambient. 2009, 13, 606–613. [Google Scholar] [CrossRef]
  26. Hellevang, K. Post Harvest Management to Maintain Bean Quality. 2001. Available online: http://www.northarvestbean.org (accessed on 4 December 2019).
  27. Hou, H.J.; Chang, K.C. Storage conditions affect soybean color, chemical composition and tofu qualities. J. Food Process. Preserv. 2004, 28, 473–488. [Google Scholar] [CrossRef]
  28. International, A. Method 44-15.02: Moisture–air-oven methods. In Approved Methods of Analysis; Cereals and Grains Association: Eagan, MN, USA, 1999. [Google Scholar]
  29. Deshpande, S.; Bal, S.; Ojha, T. Physical properties of soybean. J. Agric. Eng. Res. 1993, 56, 89–98. [Google Scholar] [CrossRef]
  30. Kong, F.; Chang, S.; Liu, Z.; Wilson, L. Changes of soybean quality during storage as related to soymilk and tofu making. J. Food Sci. 2008, 73, S134–S144. [Google Scholar] [CrossRef] [PubMed]
  31. Crowe, T.D.; White, P.J. Adaptation of the AOCS official method for measuring hydroperoxides from small-scale oil samples. J. Am. Oil Chem. Soc. 2001, 78, 1267–1269. [Google Scholar] [CrossRef]
  32. Rukunudin, I.; White, P.; Bern, C.; Bailey, T. A modified method for determining free fatty acids from small soybean oil sample sizes. J. Am. Oil Chem. Soc. 1998, 75, 563–568. [Google Scholar] [CrossRef]
  33. Salunkhe, D.K.; Desai, B.B. Postharvest Biotechnology of Oilseeds; CRC-Press: Boca Raton, FL, USA, 1986. [Google Scholar]
  34. Wiebold, B. Soybean plants killed before maturity possess grain that remains green. In Integrated Pest and Crop Management; University of Missouri: Columbia, MO, USA, 2009. [Google Scholar]
  35. Darko, E.; Heydarizadeh, P.; Schoefs, B.; Sabzalian, M.R. Photosynthesis under artificial light: The shift in primary and secondary metabolism. Philos. Trans. R. Soc. B Biol. Sci. 2014, 369, 20130243. [Google Scholar] [CrossRef] [PubMed]
  36. Xu, H.-L.; Xu, Q.; Li, F.; Feng, Y.; Qin, F.; Fang, W. Applications of xerophytophysiology in plant production—LED blue light as a stimulus improved the tomato crop. Sci. Hortic. 2012, 148, 190–196. [Google Scholar] [CrossRef]
  37. Alimentarius, C. Codex standard for named vegetable oils. Codex Stan 1999, 210, 1–13. [Google Scholar]
  38. Li, X.; Yang, R.; Lv, C.; Chen, L.; Zhang, L.; Ding, X.; Zhang, W.; Zhang, Q.; Hu, C.; Li, P. Effect of chlorophyll on lipid oxidation of rapeseed oil. Eur. J. Lipid Sci. Technol. 2019, 121, 1800078. [Google Scholar] [CrossRef]
  39. Choe, E.; Min, D.B. Mechanisms and factors for edible oil oxidation. Compr. Rev. Food Sci. Food Saf. 2006, 5, 169–186. [Google Scholar] [CrossRef]
  40. Kaleem, A.; Aziz, S.; Iqtedar, M. Investigating changes and effect of peroxide values in cooking oils subject to light and heat. FUUAST J. Biol. 2015, 5, 191–196. [Google Scholar]
  41. McNeal, X. Conditioning and Storage of Soybeans; University of Arkansas: Fayetteville, AR, USA, 1966. [Google Scholar]
  42. Rani, P.; Chelladurai, V.; Jayas, D.; White, N.; Kavitha-Abirami, C. Storage studies on pinto beans under different moisture contents and temperature regimes. J. Stored Prod. Res. 2013, 52, 78–85. [Google Scholar] [CrossRef]
  43. White, G.; Loewer, O.; Ross, I.; Egli, D. Storage characteristics of soybeans dried with heated air. Trans. ASAE 1976, 19, 306–310. [Google Scholar] [CrossRef]
  44. Pignitter, M.; Stolze, K.; Gartner, S.; Dumhart, B.; Stoll, C.; Steiger, G.; Kraemer, K.; Somoza, V. Cold fluorescent light as major inducer of lipid oxidation in soybean oil stored at household conditions for eight weeks. J. Agric. Food Chem. 2014, 62, 2297–2305. [Google Scholar] [CrossRef] [PubMed]
Figure 1. Preprocessing of chopped soybean (at R6 and R7 maturity stage) plants and fully matured (R8) seeds.
Agriengineering 06 00009 g001
Figure 2. Fabricated small storage box/chamber. (a) Front view of the inside of the box. (b) Exterior view of the assembled box with outer dimensions. All dimensions in cm.
Agriengineering 06 00009 g002
Figure 3. Fabricated large storage box/chamber. (a) Front of the inside view of the box. (b) Complete view of the assembled box with outer dimensions (cm). “B” indicates the front view.
Agriengineering 06 00009 g003
Figure 4. Color change in dried soybeans at the R6 maturity stage during drying for a period up to 48 h at drying temperature of 27 ± 5 °C.
Agriengineering 06 00009 g004
Figure 5. R6 maturity green soybeans (a) before drying and (b) after 48 h drying.
Agriengineering 06 00009 g005
Figure 6. Three-way interaction effects plots of Hunter color a-values of each interaction. (a) Maturity stage, lighting, and storage time. (b) Maturity stage, temperature, and lighting. (c) Lighting, temperature, and storage time. N.B: * is used to denote interaction between factors.
Agriengineering 06 00009 g006aAgriengineering 06 00009 g006b
Figure 7. Color change (a-value) of soybeans under storage conditions of (a) without light and (b) with light.
Agriengineering 06 00009 g007
Figure 8. Pictures of soybeans in storage for R6 (green seeds), R7 (semi-green seeds), and R8 (fully matured; control) before storage (week 0) and after twenty-four weeks of storage. (a) R6 soybeans at week 0, (b) R7 soybeans at week 0, (c) R8 soybeans at week 0, (d) R6 at week 24, (e) R7 at week 24, and (f) R8 at week 24.
Agriengineering 06 00009 g008
Figure 9. Chlorophyll content of R6, R7, and R8 soybean seeds after drying (before storage at week 0) and after storage under light conditions at week 24. The lines provide an estimate of degradation during storage after initial drying.
Agriengineering 06 00009 g009
Figure 10. Color of extracted oil from R6 (green), R7 (semi-green), and R8 (matured) soybeans stored under light conditions. (a) R6 at week 0, (b) R7 at week 0, (c) R8 at week 0, (d) R6 at week 24, (e) R7 at week 24, and (f) R8 at week 24.
Agriengineering 06 00009 g010
Figure 11. Peroxide value (meq/kg) for stored soybeans under lighting conditions at storage temperatures of 4 °C and 23.5 °C (a) without light and (b) with light at 4 °C (c) and without light and (d) with light at 23.5 °C.
Agriengineering 06 00009 g011
Figure 12. Percentage of free fatty acid (FFA) for stored soybeans at (a) 4 °C—without light, (b) 4 °C—with light, (c) 23.5 °C—without light, and (d) with light at 23.5 °C.
Agriengineering 06 00009 g012
Table 1. Factor information table.
FactorTypeLevelsValues
Maturity StageFixed3G, SG, Y
Moisture Content (%w.b.)Fixed212, 17
Temperature (°C)Fixed24, 25
LightingFixed2L, NL
AerationFixed2A, NA
Storage Period (weeks)Fixed50, 4, 8, 16, 24
Table 2. Analysis of variance for Hunter color a-values showing main effects and two-way and three-way interactions for stored soybeans.
Source DFAdj SS Adj MSF-Valuep-Value
Maturity Stage 21784.36Agriengineering 06 00009 i00383
%
892.1787495.770.000
Agriengineering 06 00009 i001 Moisture Content 117.3017.298145.330.000
TemperatureAgriengineering 06 00009 i002Storage
environments
1105.57105.570886.960.000
Lighting1947.05947.0557956.830.000
Aeration192.0692.063773.490.000
Storage Time 42458.29614.5735163.430.000
Maturity Stage × Moisture Content 25.60 2.80123.530.000
Maturity Stage × Temperature 28.95 4.47537.600.000
Maturity Stage × Lighting 277.66 38.828326.220.000
Maturity Stage × Aeration 22.03 1.0178.540.000
Maturity Stage × Storage Time 8122.81 15.351128.970.000
Moisture Content × Temperature 10.45 0.4463.750.053
Moisture Content × Lighting 12.28 2.27819.140.000
Moisture Content × Aeration 118.05 18.050151.650.000
Moisture Content × Storage Time 413.31 3.32927.970.000
Temperature × Lighting 126.99 26.989226.760.000
Temperature × Aeration 12.57 2.57021.600.000
Temperature × Storage Time 443.18 10.79490.690.000
Lighting × Aeration 123.83 23.835200.250.000
Lighting × Storage Time 4528.34 132.0851109.730.000
Aeration × Storage Time 424.42 6.10651.300.000
Maturity Stage × Moisture Content × Temperature 20.01 0.0070.060.942
Maturity Stage × Moisture Content × Lighting 20.13 0.0660.560.573
Maturity Stage × Moisture Content × Aeration 20.83 0.4163.490.031
Maturity Stage × Moisture Content × Storage Time 81.59 0.1991.670.102
Maturity Stage × Temperature × Lighting 23.89 1.94516.340.000
Maturity Stage × Temperature × Aeration 20.08 0.0410.350.708
Maturity Stage × Temperature × Storage Time 84.80 0.6005.040.000
Maturity Stage × Lighting × Aeration 22.32 1.1629.760.000
Maturity Stage × Lighting × Storage Time 848.65 6.08251.100.000
Maturity Stage × Aeration × Storage Time 81.15 0.1441.210.290
Moisture Content × Temperature × Lighting 11.22 1.21510.210.001
Moisture Content × Temperature × Aeration 11.65 1.64713.840.000
Moisture Content × Temperature × Storage Time 44.70 1.1749.860.000
Moisture Content × Lighting × Aeration 10.18 0.1811.520.218
Moisture Content × Lighting × Storage Time 41.54 0.3863.240.012
Moisture Content × Aeration × Storage Time 46.18 1.54512.980.000
Temperature × Lighting × Aeration 14.14 4.14034.790.000
Temperature × Lighting × Storage Time 413.06 3.26427.420.000
Temperature × Aeration × Storage Time 419.20 4.80040.330.000
Lighting × Aeration × Storage Time 46.44 1.61013.530.000
Error 59971.30 0.119
Lack-of-Fit 11956.13 0.47214.930.000
Pure Error 48015.17 0.032
Total 7196498.18
Table 3. Summary table of the analysis of variance for Hunter color a-values showing the main effects and two-way and three-way interactions for stored soybeans.
Source DFAdj SSAdj MSF-Valuep-Value
Maturity 21784.36892.1787495.770.000
Moisture Content Agriengineering 06 00009 i004117.3017.298145.330.000
Temperature1105.57105.570886.960.000
Lighting1947.055947.0557956.830.000
Aeration192.0692.063773.490.000
Storage Time 42458.29614.5735163.430.000
Maturity Stage × ighting 277.6638.828326.220.000
Maturity Stage × Storage Time 8122.8115.351128.970.000
Temperature × Lighting 126.9926.989226.760.000
Temperature × Storage Time 443.1810.79490.690.000
Lighting × Storage Time 4528.34132.0851109.730.000
Maturity Stage × Lighting × Storage Time 848.656.08251.100.000
Disclaimer/Publisher’s Note: The statements, opinions and data contained in all publications are solely those of the individual author(s) and contributor(s) and not of MDPI and/or the editor(s). MDPI and/or the editor(s) disclaim responsibility for any injury to people or property resulting from any ideas, methods, instructions or products referred to in the content.

