Article

Seismic Vulnerability Assessment and Strengthening Interventions of Structural Units of a Typical Clustered Masonry Building in the Campania Region of Italy

1
Department of Structures for Engineering and Architecture, School of Polytechnic and Basic Sciences, University of Naples “Federico II”, P. le V. Tecchio, 80125 Naples, Italy
2
Faculty of Architecture and Urbanism, Politehnica University of Timişoara, Traian Lalescu Street, 300223 Timişoara, Romania
*
Author to whom correspondence should be addressed.
Submission received: 21 March 2021 / Revised: 24 May 2021 / Accepted: 27 May 2021 / Published: 2 June 2021

Abstract

:
The present paper aims at inspecting the structural behaviour of a typical masonry aggregate located in the historical centre of Cercola, a municipality in the province of Naples. The clustered building under study consists of four structural units mutually connected to each other made of tuff stone and deformable floors. Two distinct structural units, namely in heading and intermediate places, in both isolated and aggregate conditions, are examined to estimate the influence of structural positions on the global seismic response of the examined case study buildings. For this purpose, non-linear static analyses are performed using the 3MURI software. Pushover analyses are conducted to both evaluate the seismic behaviour of examined structural units and improve their earthquake performances while considering proper retrofit interventions on vertical and horizontal structures. The analysis results are plotted in terms of risk factor, stiffness, and ductility. Finally, a set of fragility functions are derived to point out the structural response of the case study buildings before and after retrofit interventions. From the achieved results, it is highlighted that retrofit interventions improve the structural performances of the buildings, especially those of structural units in aggregate conditions.

1. Introduction

The seismic safety of existing masonry buildings represents a priority for a large number of countries all over the world and is influenced by many geometrical and mechanical factors affecting their behaviour against earthquakes [1,2]. The building patrimony owned by most Italian centres is characterized by masonry buildings without an adequate structural performance level against seismic actions. This inadequacy has generated a drastic increase in global vulnerability and, therefore, a seismic risk for entire urbanized sectors, as often happens in historic centres [3,4].
The seismic vulnerability is understood as the propensity of buildings to suffer a certain degree of damage under a seismic event of a certain intensity. The vulnerability assessment methods suggested by current regulations require the knowledge of a series of construction prerequisites, such as connection types among walls, typologies of floors and roofs, etc., which are difficult to identify in old urban centres. The existing masonry buildings in historic centres are often grouped in aggregates and they interact with each other under seismic actions. Clustered buildings are often built according to traditional practices with very variable vertical structure typologies (heterogeneous or multi-leaf masonry walls) and construction details (poor connections among orthogonal walls and between walls and floors, as well as variation of the wall thickness along with the building height), leading towards behavioural deficiencies in terms of stability and safety against seismic actions [5,6]. Therefore, these building aggregates have very complex structural and seismic behaviour, which makes it difficult to predict possible failure scenarios.
However, several factors are known to affect building performance, mainly depending on the interactions between the individual structural units (SUs). Furthermore, the presence of effective connections between SUs prevents the occurrence of local collapse mechanisms in different cases. Moreover, the presence of construction (e.g., orthogonal walls not well connected) and/or geometric (e.g., buildings with different heights) irregularities are the main causes of activation of out-of-plane collapse mechanisms [3,7,8].
The interactions among adjacent buildings must be appropriately considered when studying the vulnerability of the whole aggregate, since the dynamic response of each SU is often strongly influenced by the presence of adjacent ones. The capacity of the individual SUs can differ significantly from the capacity of the entire aggregate, especially in the case of deformable floors and masonry with poor mechanical features. This type of construction, characterized by a highly non-linear response, can lead to evaluation errors that could compromise the result of the seismic evaluation. For this reason, it is essential to consider a simplified structural model to take into account all the intrinsic peculiarities of SUs to correctly estimate their vulnerability level [9,10,11,12,13].
There are many vulnerability factors, such as the in-plane distribution of walls, the presence of staggered floors, and the structural heterogeneity between adjacent buildings, which must be considered to study the seismic capacity of buildings in aggregate configuration. These vulnerabilities significantly affect the dynamic response of the structure. In this context, many mechanical models have been developed in different works [14,15,16], where the uncertainties related to the vulnerability factors have been taken into consideration to quantify the seismic response of the entire aggregate.
In the work reported in Ref. [17], important considerations were done to estimate the seismic vulnerability of historic aggregate buildings built in Catania after the 1963 earthquake. These clustered buildings made of unreinforced masonry buildings (URM) were analysed using the macro-element approach following the provisions of the Italian Code [18]. An effective methodological approach regarding aggregated masonry buildings was proposed, highlighting how the expected behaviour varies according to the configuration and position of the grouped structural units.
In the study proposed in Ref. [19], the “aggregate effect” assessment was carried out considering the contribution to the seismic vulnerability of different modelling configurations of a case study building located in the historic district of “Bairro Ribeirinho” in Faro (Portugal). By implementing non-linear static analyses, important considerations regarding structural modelling were shown. As was explicitly suggested, to consider the confinement effects induced by SUs, it was suggested to model the contiguous units to consider their contribution in terms of stiffness and strength. These results showed that the intermediate units have a mean capacity compared to the same SUs placed in other positions within the same aggregate.
The present study aims to focus on the seismic response of a masonry aggregate located in Cercola, a municipality near the city of Naples. The selected aggregate consists of four (two head and two intermediate) SUs mutually interacting with each other. It dated back to the 19th century and is composed of SUs representative of the building classes present in the examined urban area. The main issue of the present study is the investigation of the influence of structural units on the global response of the whole aggregate.
Non-linear static analyses were conducted to evaluate the seismic behaviour of SUs both in isolated and aggregate conditions, which was compared to that of the whole aggregate. From the results acquired, it was observed that, for the structural units examined, the behaviour offered in aggregate condition considerably improves the expected seismic response of SUs, providing maximum base shear and displacement greater than that of the corresponding isolated SUs. This result is also observable in Ref. [20], where a more articulated methodology (capacity curve reconstruction method) for plotting the capacity curves of SUs for different structural typologies located in another geographical context was proposed. Therefore, parametric analyses were implemented by varying the quality of masonry and the floor type to select the most unfavourable cases, for which the fragility curves were plotted to estimate the propensity at the damage of the SUs examined.

2. Case Study

The reference building is an existing masonry aggregate (Figure 1) located in the municipality of Cercola, an urban district located within the province of Naples (Italy).
The aggregate was built at the end of the 19th century and represents a classic construction typology widely diffused in the historical centres of the Campania region.
From a structural point of view, it is composed of 4 structural units mutually interacting, represented by two external cells occupying the head position and two internal ones placed in intermediate position), which spread over 3 floors above ground with an average inter-story height of 2.80 m. The masonry walls, characterized by Neapolitan yellow tuff stones, have an average thickness of 0.80 m at the ground floor and 0.50 m on the other floors.
The first level floors of the head structural units consist of masonry vaults, whereas the remaining floor systems are made of wooden structures simply supported to the walls. Besides, in the middle of the 20th century, new horizontal structures using steel beams were erected between the first and second floors of the intermediate SUs. The geometric configuration of the examined clustered buildings is suitably reported in Figure 2.
Figure 3 shows the external view of the main façade of the case study aggregate. In particular, there are shops on the ground floor, while the upper floors are used for residential purposes.
The mechanical properties of the structural elements have been assumed according to the indications provided by the Table C 8.5.I of the Italian code NTC18 [18]. Due to the absence of accurate on-site test procedures, the mechanical features of the masonry have been suitably reduced by assuming a confidence factor, FC, equal to 1.35, which corresponds to a level of knowledge LC1 (limited knowledge) [21,22]. Based on these considerations, the following mechanical parameters for tuff masonry were adopted:
-
average compressive strength: fm = 2.00 MPa;
-
average shear strength: fv0 = 0.10 MPa;
-
Young modulus: E = 1410 MPa;
-
tangential elasticity modulus: G = 450 MPa;
-
specific weight. W = 16 kN /m3
The seismic actions were evaluated according to the elastic reference spectrum as provided by the Italian Design Code, NTC 2018 [18].
Three different case studies were analysed to estimate the influence of mutual interaction among adjacent structural units: (i) the whole aggregate (see Figure 2a); (ii) the intermediate structural unit (see Figure 4); (iii) the heading structural unit (Figure 5). Furthermore, the same structural units were also studied in isolated configurations, as reported in Figure 6 and Figure 7.

3. Numerical Analysis

3.1. Modal Analysis

Modal analysis was performed to point out the main vibration modes associated with the aggregate examined in Section 2. The eigenvalue analysis was appropriately performed using 3Muri software [23], focusing attention on the natural vibration periods, T1 and T2, evaluated in two translational directions (X and Y), and on the rotational period, T3. The modal analysis results were summarized in Table 1.
From the results presented in Table 1, it was noticed that the most unfavourable condition was reached in direction X since the induced torsional phenomena reduced the required displacement ductility. Also, it was observed that the vibration period, T1, is higher than those of the other two analysis directions (T2 and T3). More precisely, the vibration period associated with the intermediate SU considered in isolated configuration (T1 = 0.36 s) has been increased by 12.5% compared to the corresponding SU grouped in aggregate (T1 = 0.32 s). On the other hand, the heading SU has shown a vibration period decrement of 3% (T1 = 0.31 s) regarding the value detected for the same SU placed in the aggregate configuration (T1 = 0.32 s).

3.2. Pushover Analysis

The numerical analyses were carried out through the 3Muri software [23] using the mathematical model based on the Frame by Macro-Elements (FME) theory. In this approach, it was assumed that masonry walls are considered as a set of single-dimensional macro-elements (columns, beams, and nodes). The strength criteria of deformable elements were given based on EN 1998-3 provisions [24], which were established as allowable maximum drifts for shear and flexural collapse mechanisms with the values of 0.4% and 0.6%, respectively. The analyses were performed according to the two main directions of buildings, namely X and Y. For each direction, the accidental eccentricities (positive and negative) were considered. The aforementioned analyses were interrupted at 20% decay of the maximum shear resistance according to the NTC18 indications [18].
In Figure 8, the structural models of the whole masonry aggregate (see Figure 8a,b) and the corresponding intermediate (Figure 8c,d) and heading (Figure 8e,f) SUs were depicted. It is worth highlighting that, to consider the confinement effect of the structural units contiguous to the reference one, both intermediate and heading SUs were modelled considering half part of adjacent structural cells accounting for their contribution in terms of stiffness and mass.
Simultaneously, the previously mentioned structural units were also analysed in isolated conditions to estimate their global seismic response compared to that of SUs placed in clustered conditions. These structural models are presented in Figure 9.
After the above-mentioned structures were modelled, 4 different distributions of seismic forces (±X, ±Y) were considered and 24 analyses were performed. So, for each of the 5 structural models presented, the worst-case conditions were taken into account. More specifically, for each of the 5 structural models previously described, the most unfavourable conditions (among the 24 combinations) in the X and Y directions were identified and then, they were compared to the results obtained in the same scenario cases for the other structural units.
Figure 10 and Figure 11 show the comparison in terms of pushover curves between the entire aggregate and monitored SUs, respectively the intermediate structural unit (ISU) and heading one (HSU), in both structural configurations (isolated and aggregate).
In general, from the obtained results, it was observed that strength and stiffness increase proportionally passing from the SU placed in isolated condition to the corresponding one grouped in aggregate. In contrast, the structural ductility offered by the structural system in isolated conditions is more accentuated compared to the estimated ductility evaluated for the structural system in aggregate configuration.
Furthermore, seismic checks at the Ultimate Limit State (ULS) defined according to the Italian Code, NTC18 [18], were carried out. In particular, the seismic verification was conducted evaluating the coefficient ζ, which represents the ratio between the capacity acceleration (PGAC), evaluated at the ULS considered, and the corresponding acceleration demand, PGAD, related to the construction site. In particular, it seems evident that for ζ ≥ 1, the inspected building provides a good seismic response without reaching significant structural damage; conversely, for ζ < 1, a more or less damaged condition has been reached and the building requires appropriate upgrading or retrofitting interventions. In Table 2, the ζ—safety indexes for all examined are reported.
The results show clear indications regarding the seismic capacity of the buildings. In particular, except for the heading SU in aggregate and isolated configurations, where values of the safety factor greater than 1 in the Y direction were reached, all the risk indexes showed assumed values lower than unity, which should require appropriate upgrading or retrofit interventions.

4. Parametric Analysis for Seismic Retrofitting Interventions

To study the different global behaviour of the examined cases study buildings, parametric analyses were conducted by varying both the floor typology (deformable floor or rigid diaphragm, the latter to guarantee a building box-behaviour) and the masonry type (squared stones or stones arranged chaotically).

4.1. Rigid Floors

As discussed in Section 2, the existing floors, made of wood beams, are deformable and have a poor degree of constraint with the vertical structures. As a possible intervention on horizontal structures, their strengthening aiming at creating a rigid floor was considered to guarantee a different distribution of seismic actions to the vertical structures. This kind of intervention was indiscriminately adapted to the whole aggregate and the SUs monitored in both isolated and grouped configurations.
In Figure 12, the results obtained from using the two different types of floors are plotted and compared in terms of the strength, stiffness, ductility, and safety index.
From the results achieved, it was observed that, globally, the intervention proposed does not apport structural improvements in terms of strength and stiffness, but there is an appreciable increase of both the structural ductility and seismic safety factor for both the whole aggregate and the intermediate SU. Moreover, the proposed stiffening of floors also offers a noticeable increase of ductility and safety factor for the SU considered in the isolated condition.

4.2. Masonry Properties

As a further intervention, variation of mechanical properties of masonry that can be associated to strengthening interventions was done simply by considering different masonry types. As discussed in Section 2, the basic mechanical properties refer to the tuff masonry stones, whose mechanical properties derived from Italian code are in line with experimental values achieved from some literature sources [25,26]. To this purpose, according to what was discussed in Section 4, two masonry types were considered. In particular, a masonry type made of squared blocks with better mechanical properties than those of tuff stones was considered. In addition, for comparison purposes, a chaotic masonry type with worst features than those of tuff masonry stones was also taken into account. All the mechanical features were assumed from the NCT18 standard [18] adopting a limited knowledge level (LC1) with a confidence factor (FC) of 1.35.
The main characteristics of the squared masonry blocks, assumed congruently to the NTC18 [18], are shown as follows:
-
average compressive strength, fm = 5.8 MPa;
-
average shear strength, fv0 = 0.18 MPa
-
Young modulus, E = 2850 MPa
-
shear elastic modulus, G = 950 MPa
-
density, W = 22 kN/m3.
The second masonry type is the chaotic one, which is characterized by the following mechanical properties [18]:
-
average compressive strength, fm = 1 MPa
-
Young modulus, E = 870 MPa
-
Shear modulus, G = 290 MPa
-
density, W = 19 kN/m3.
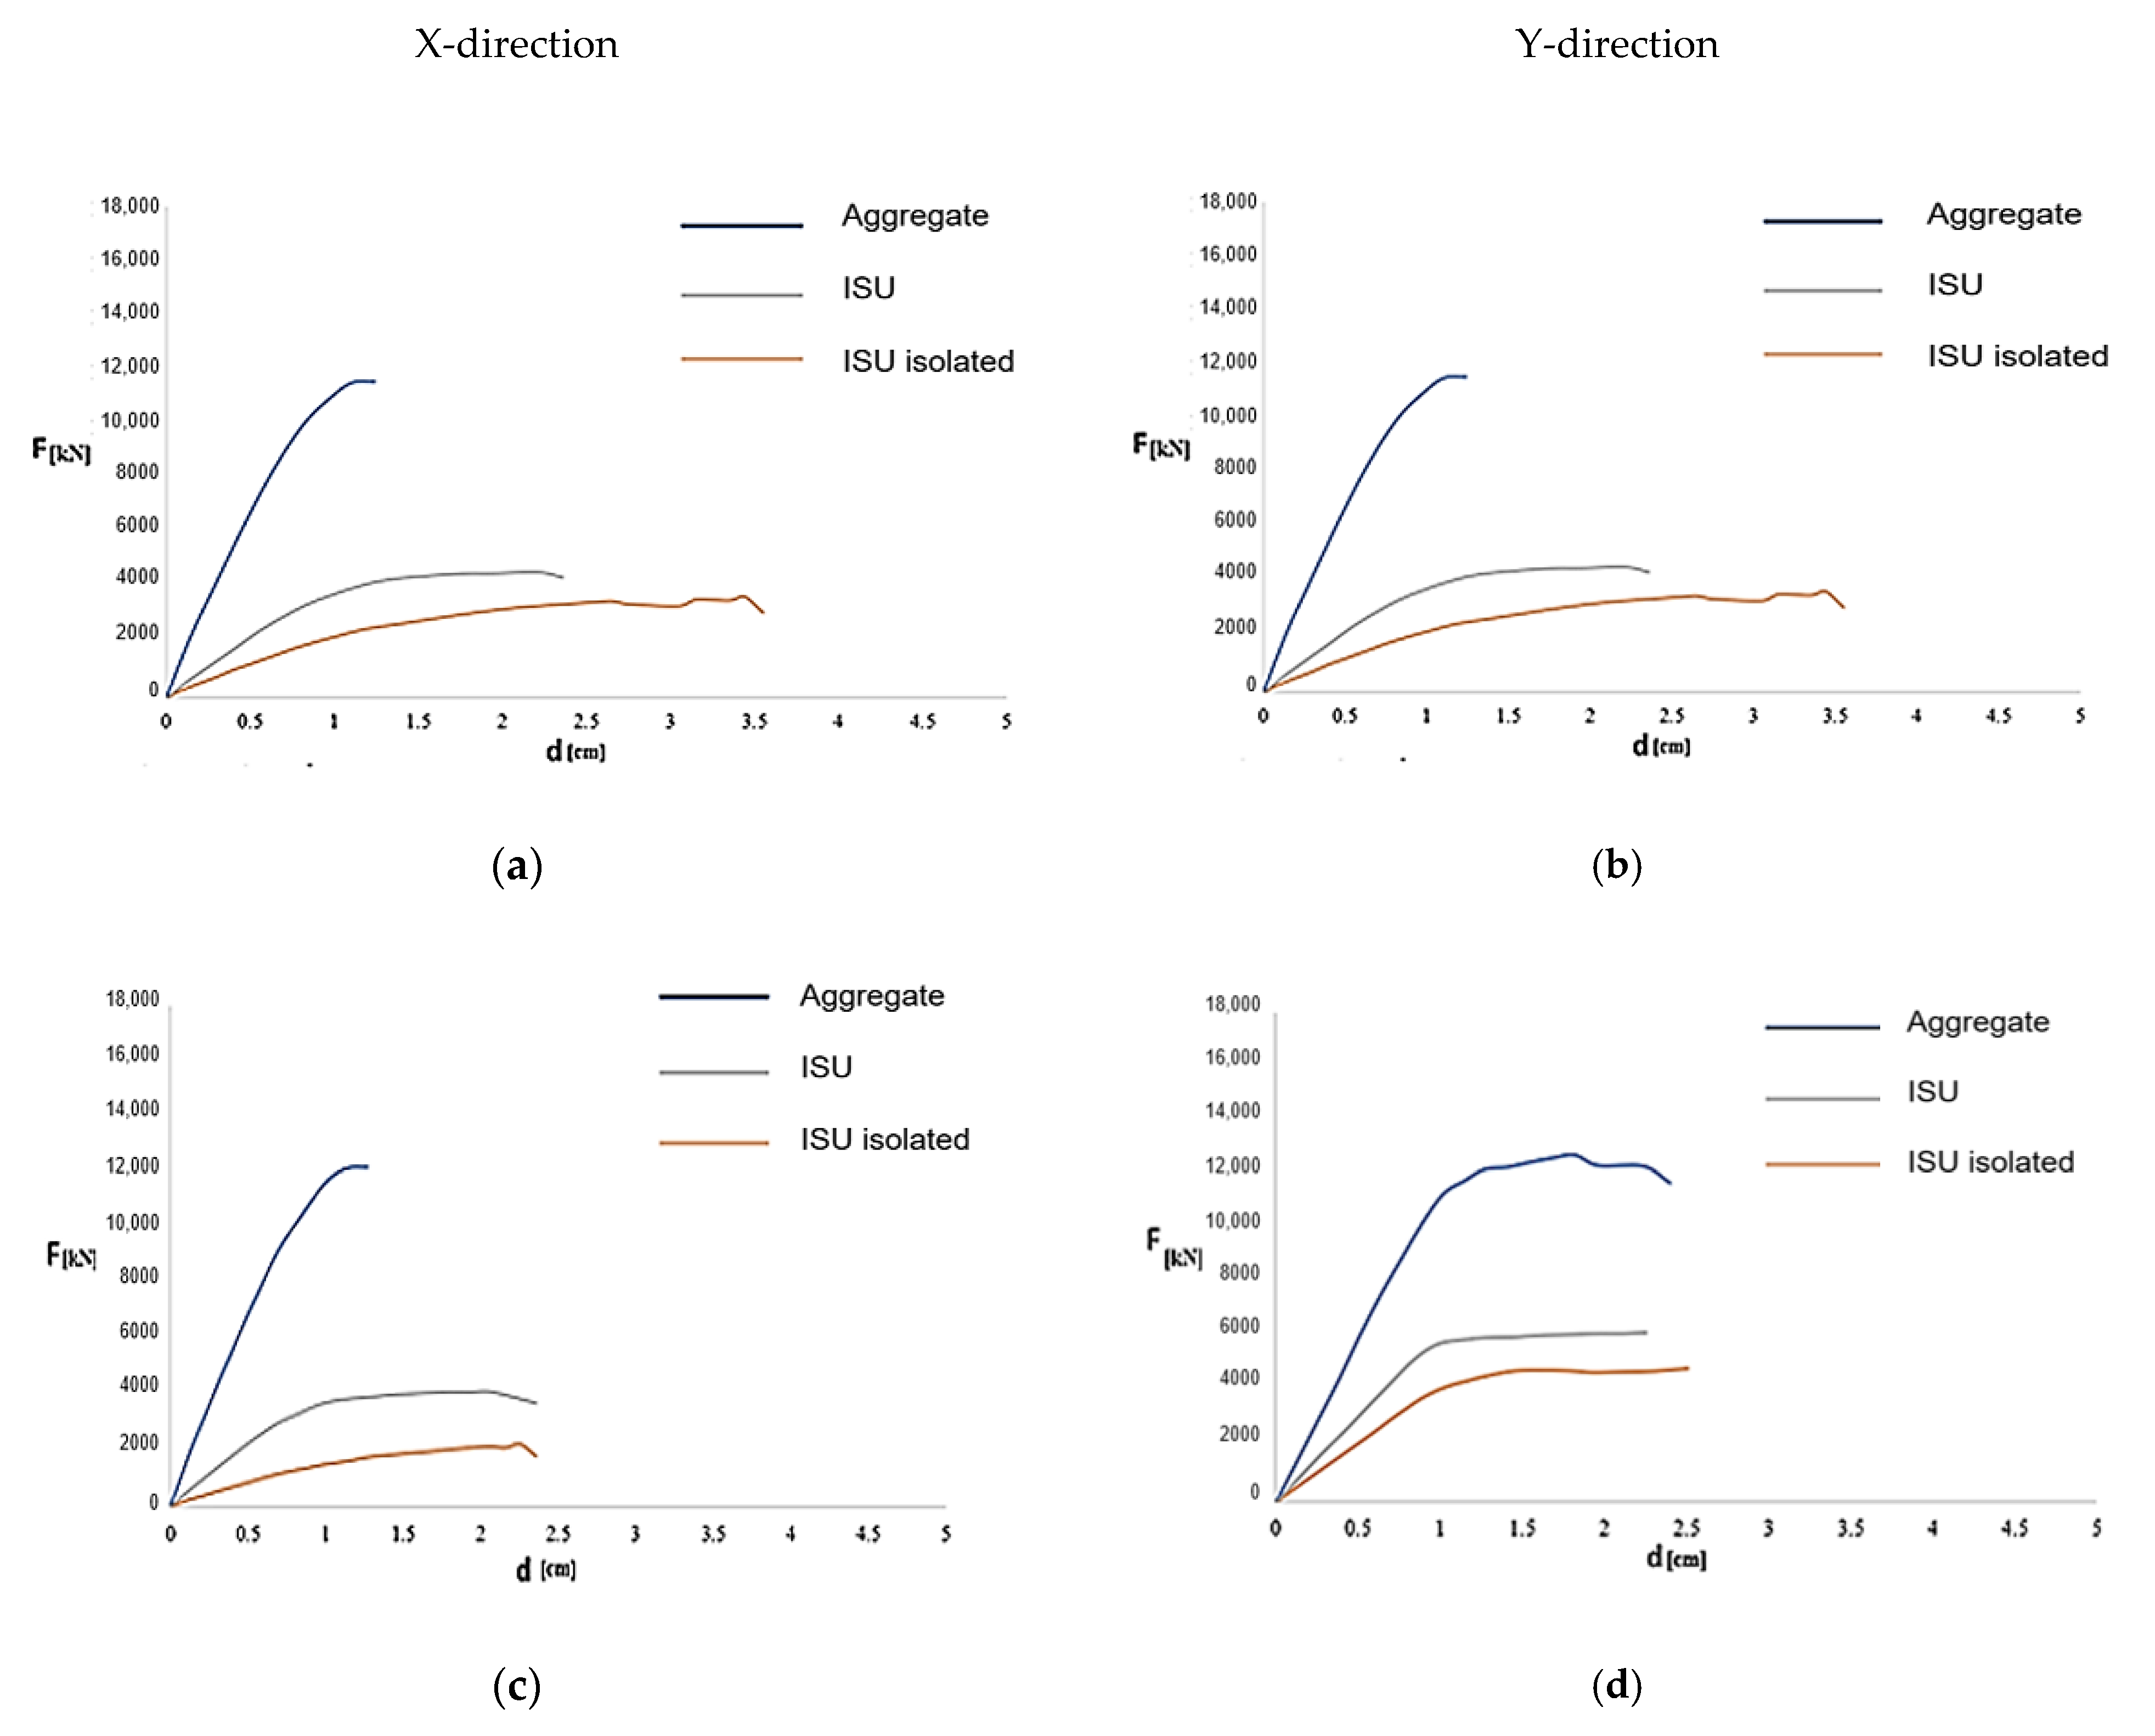
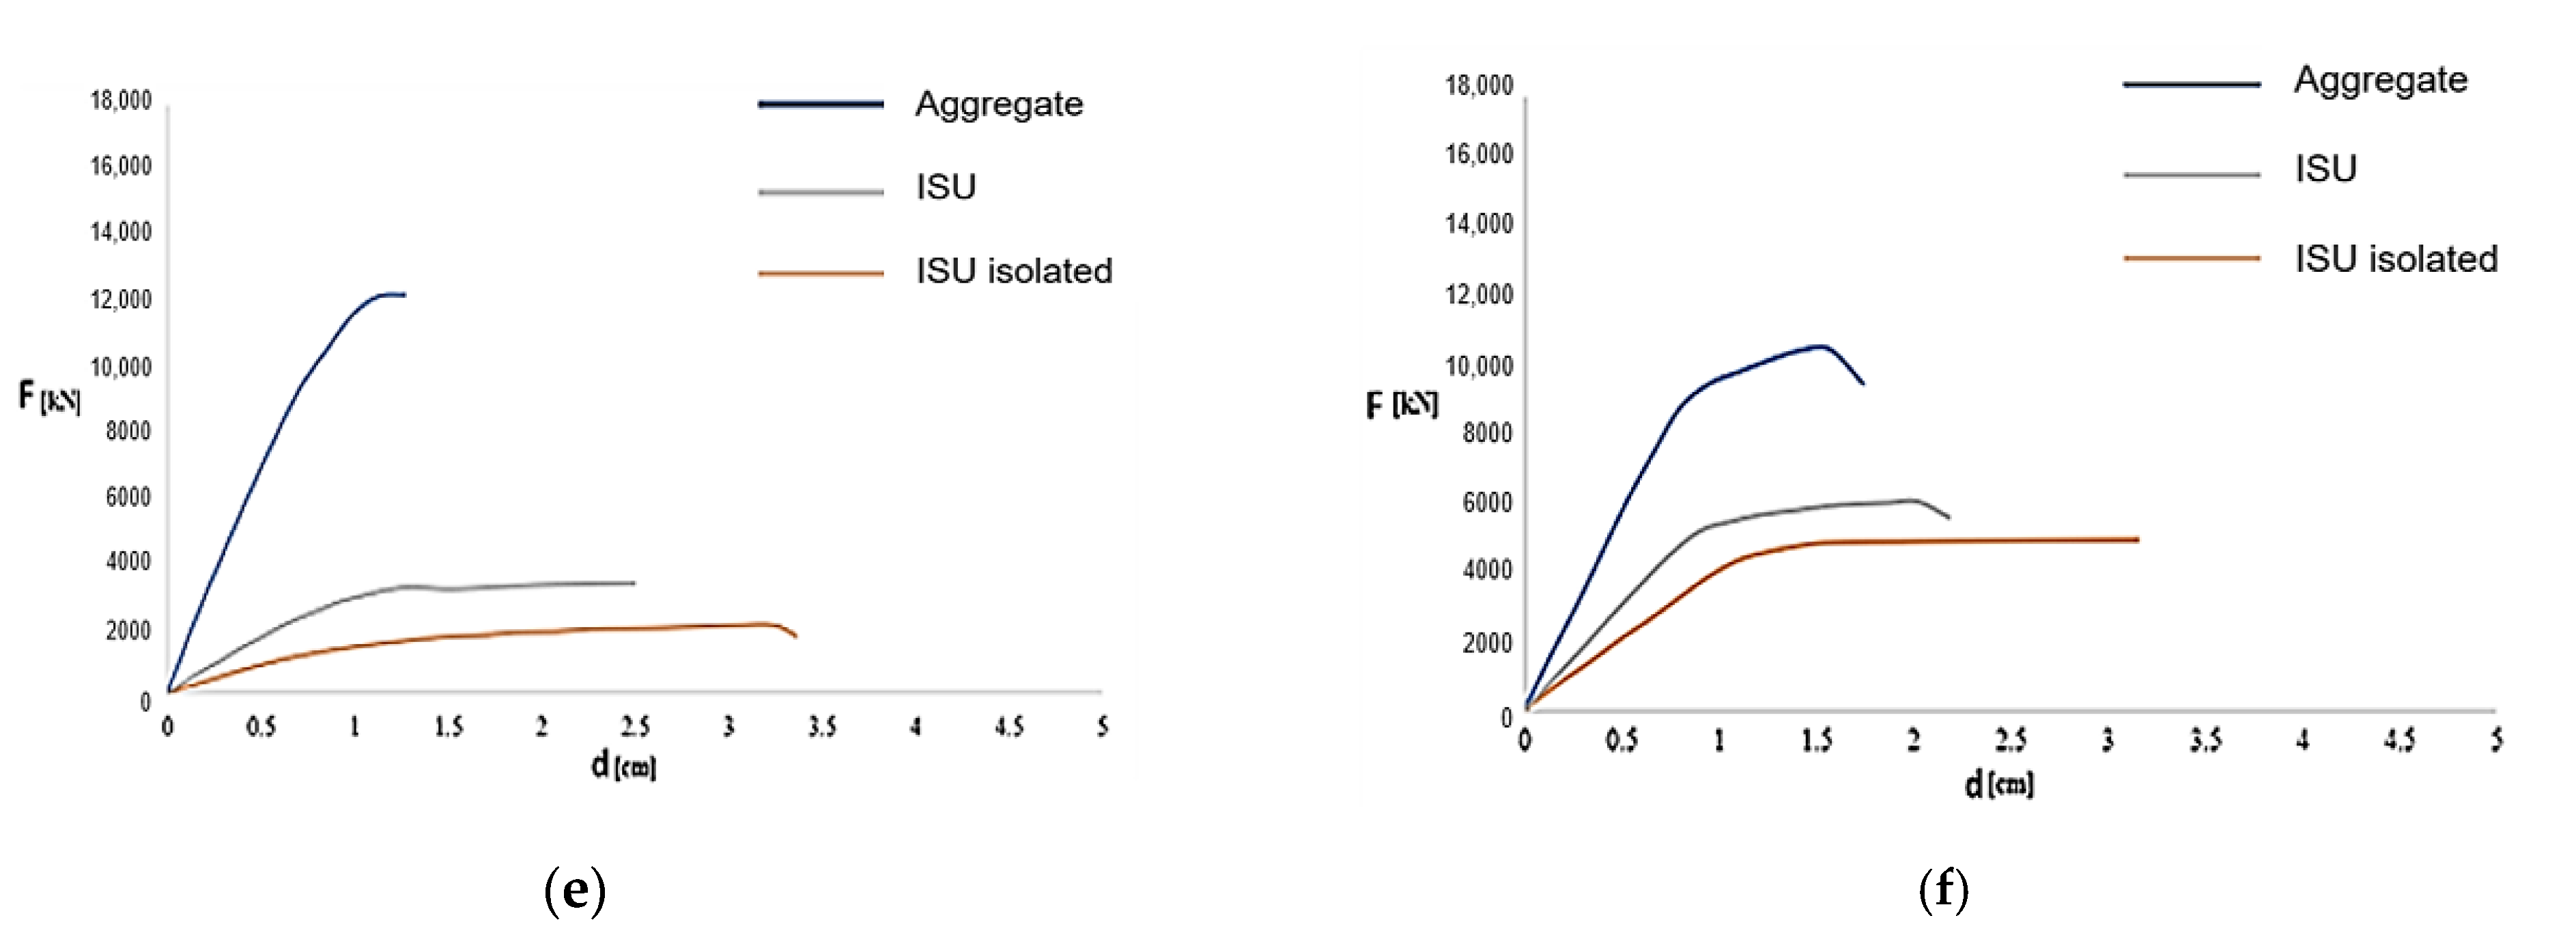
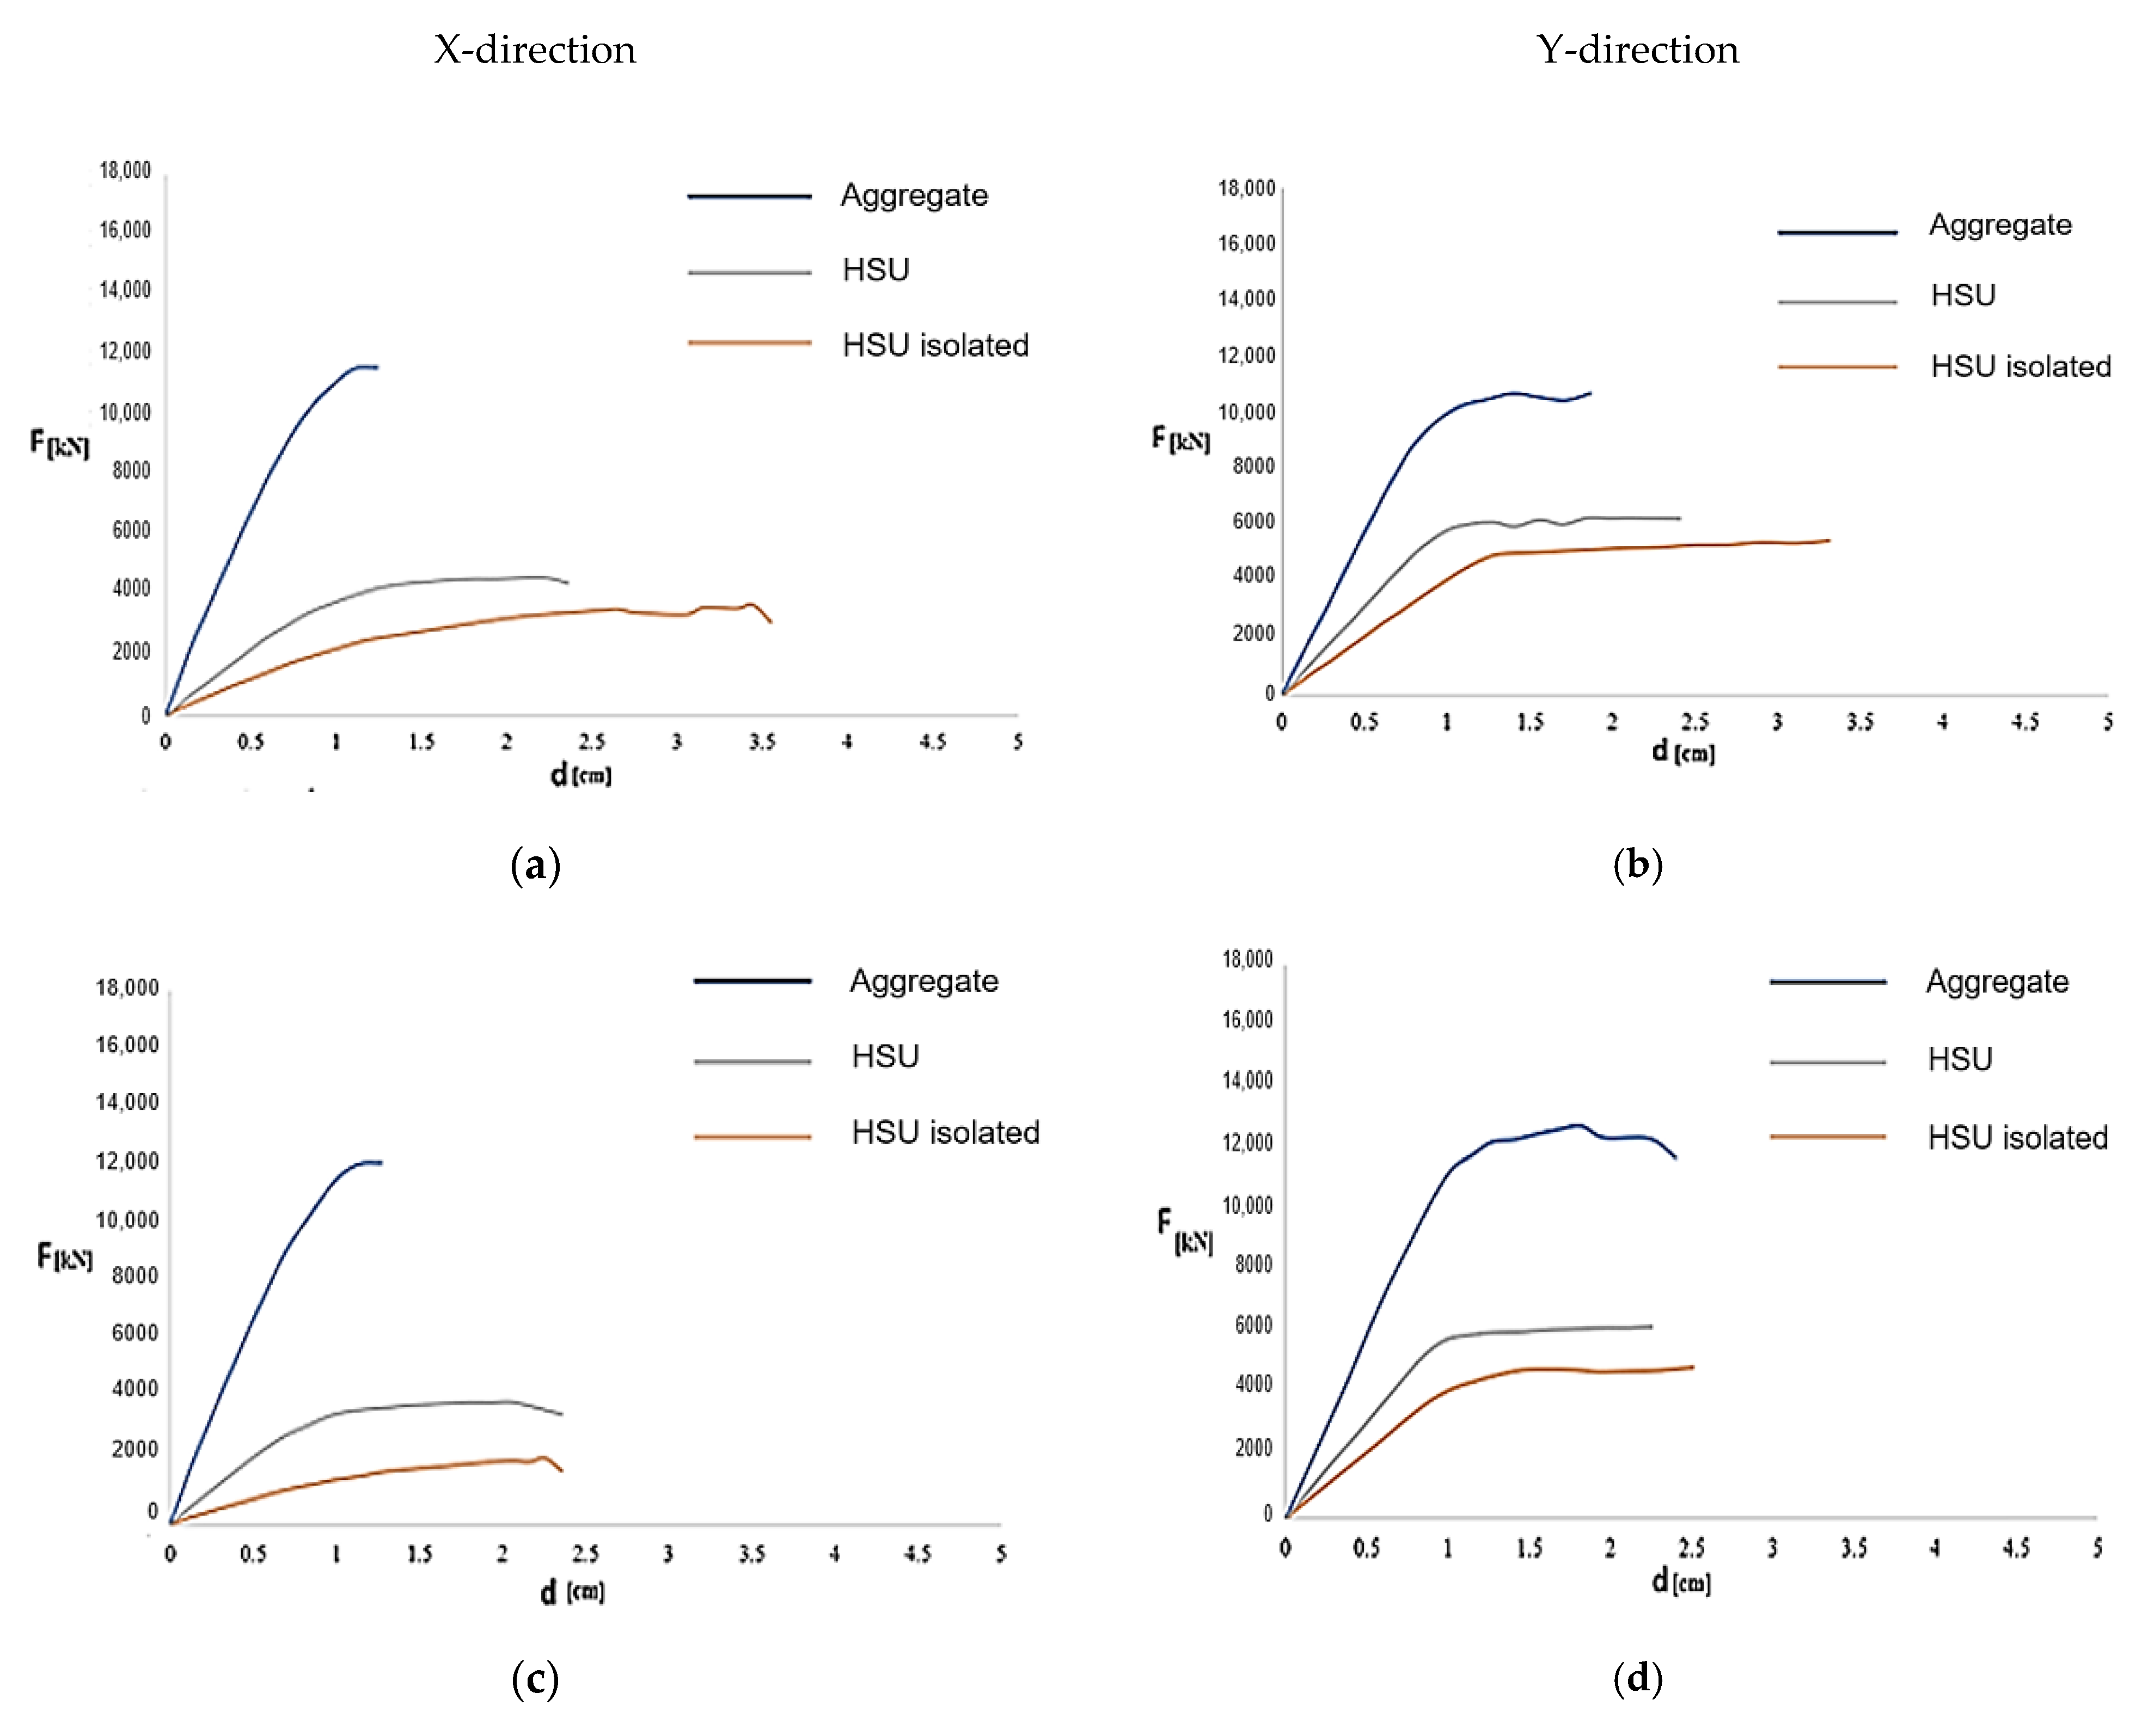
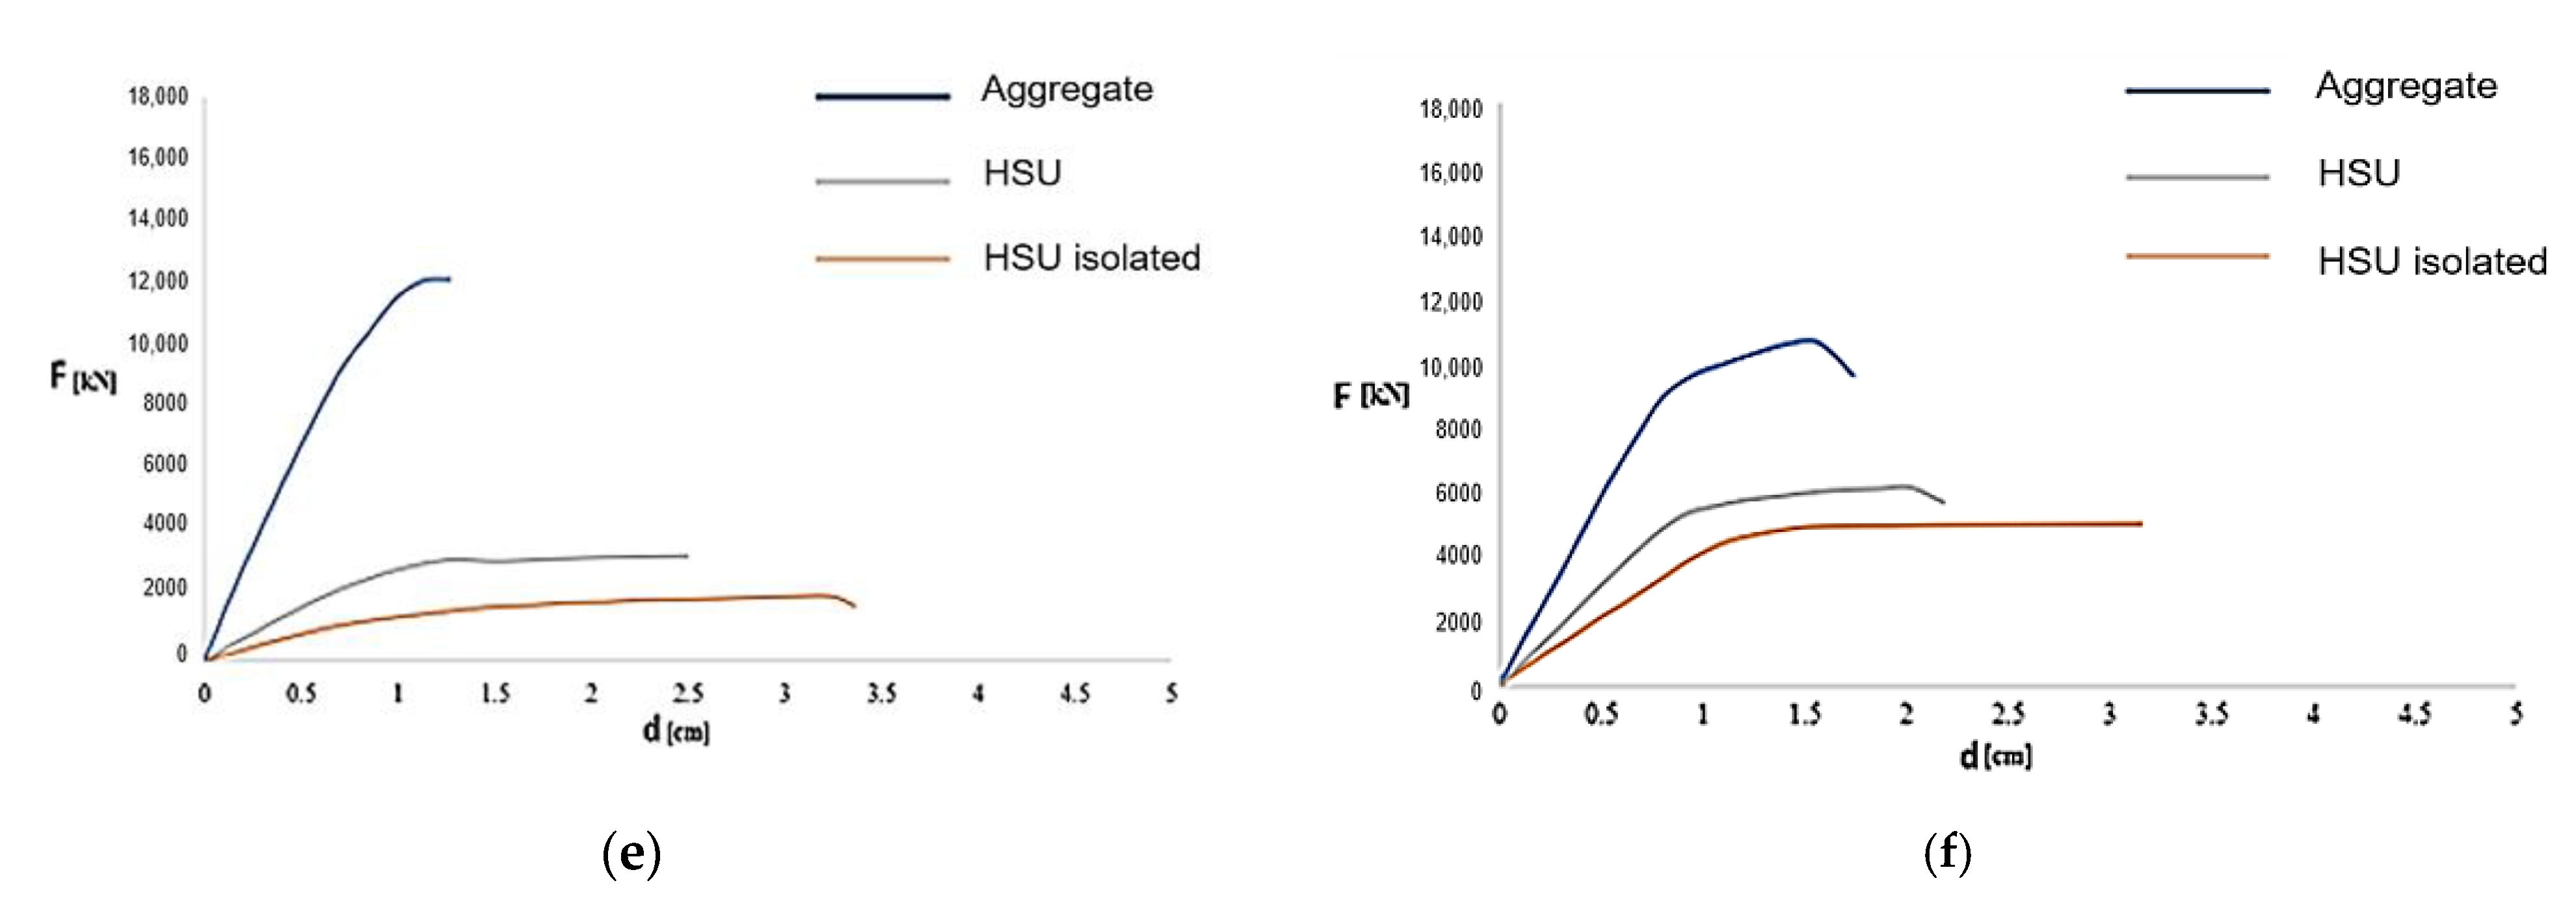
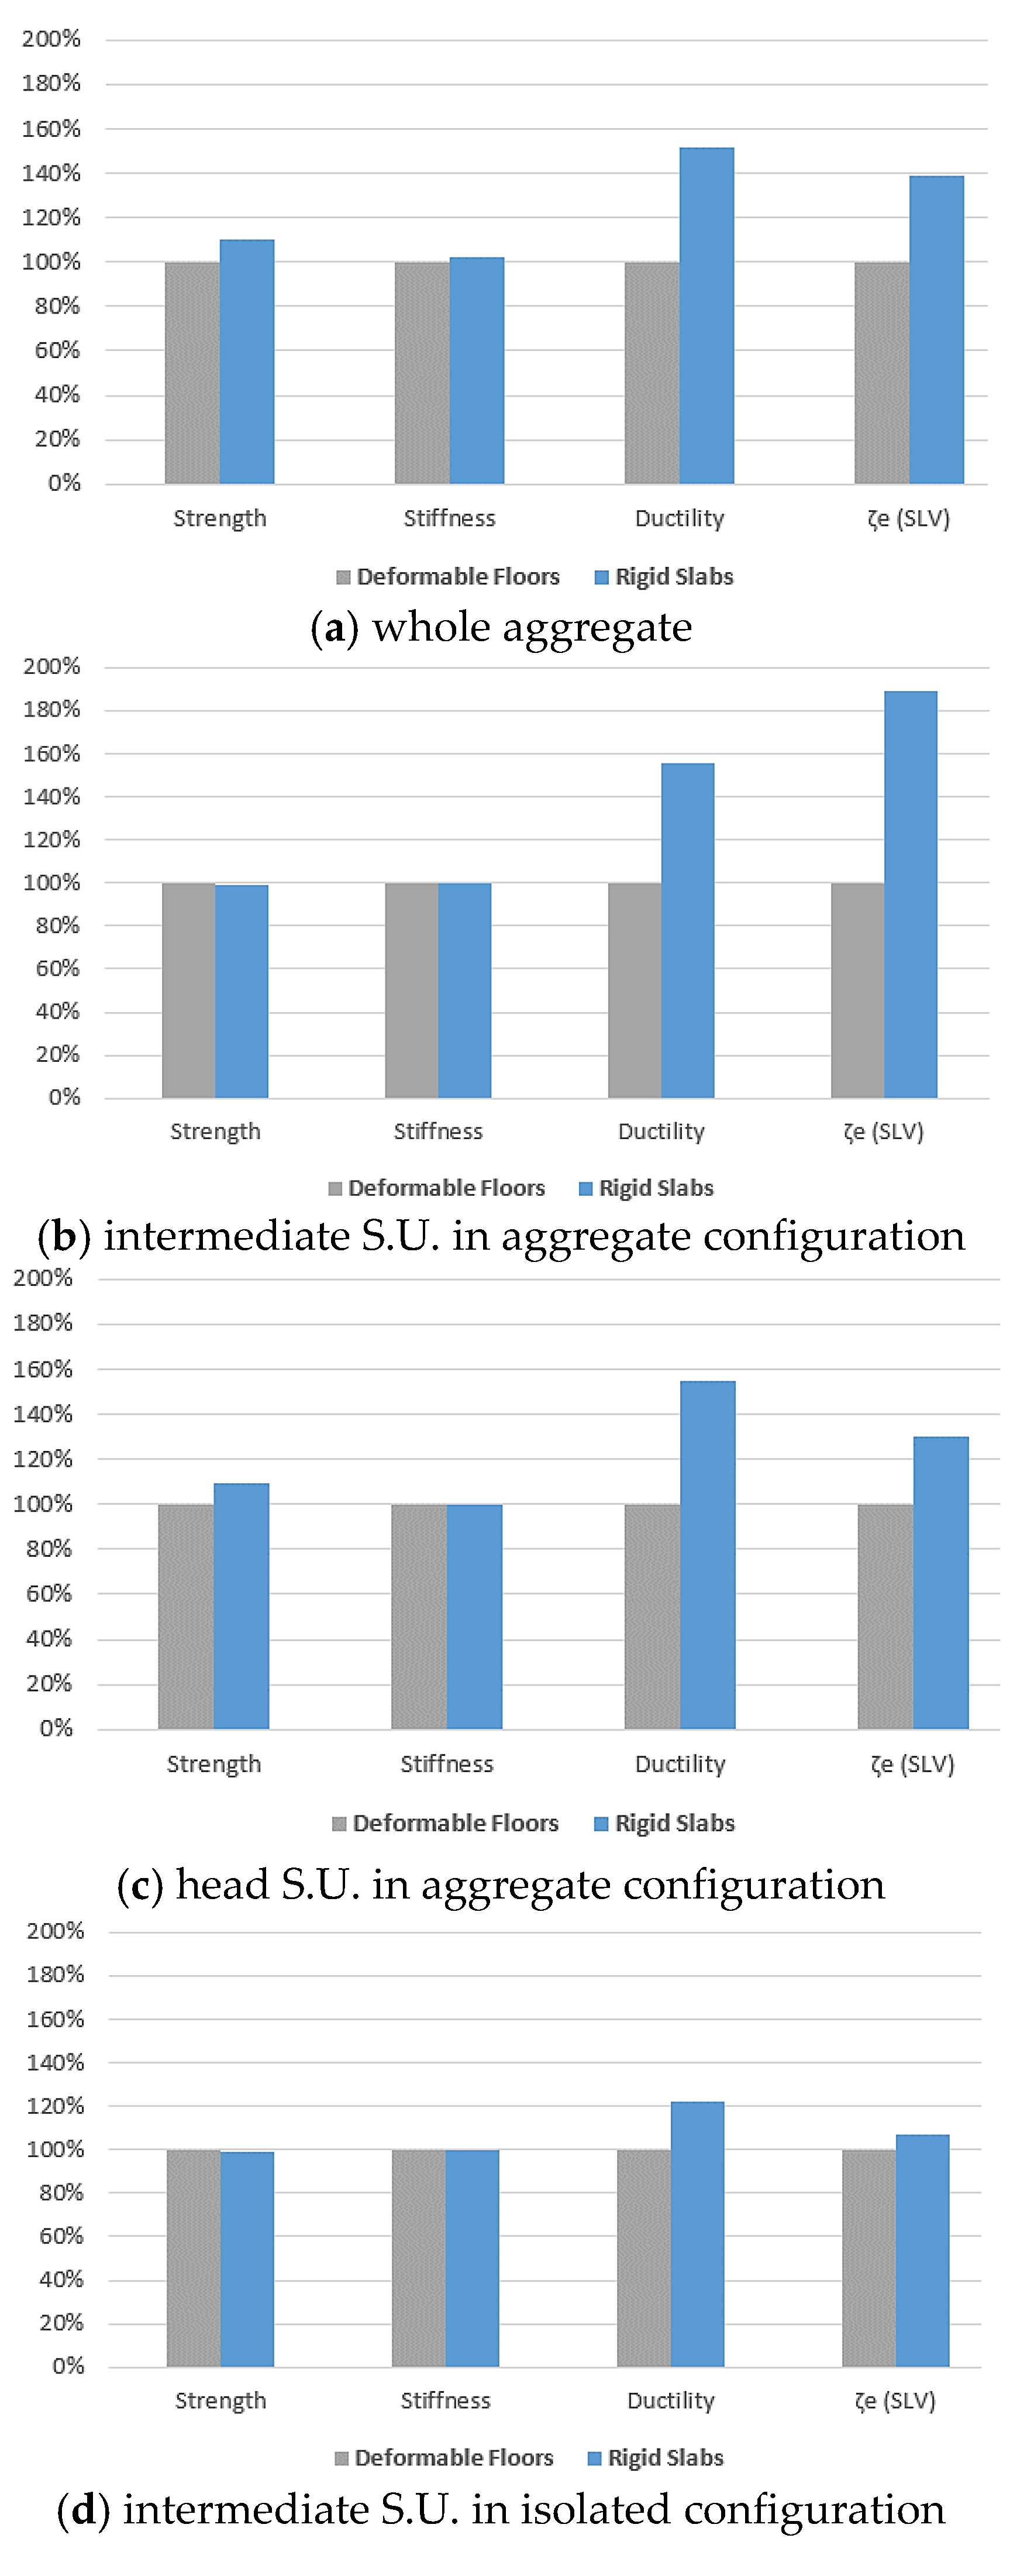
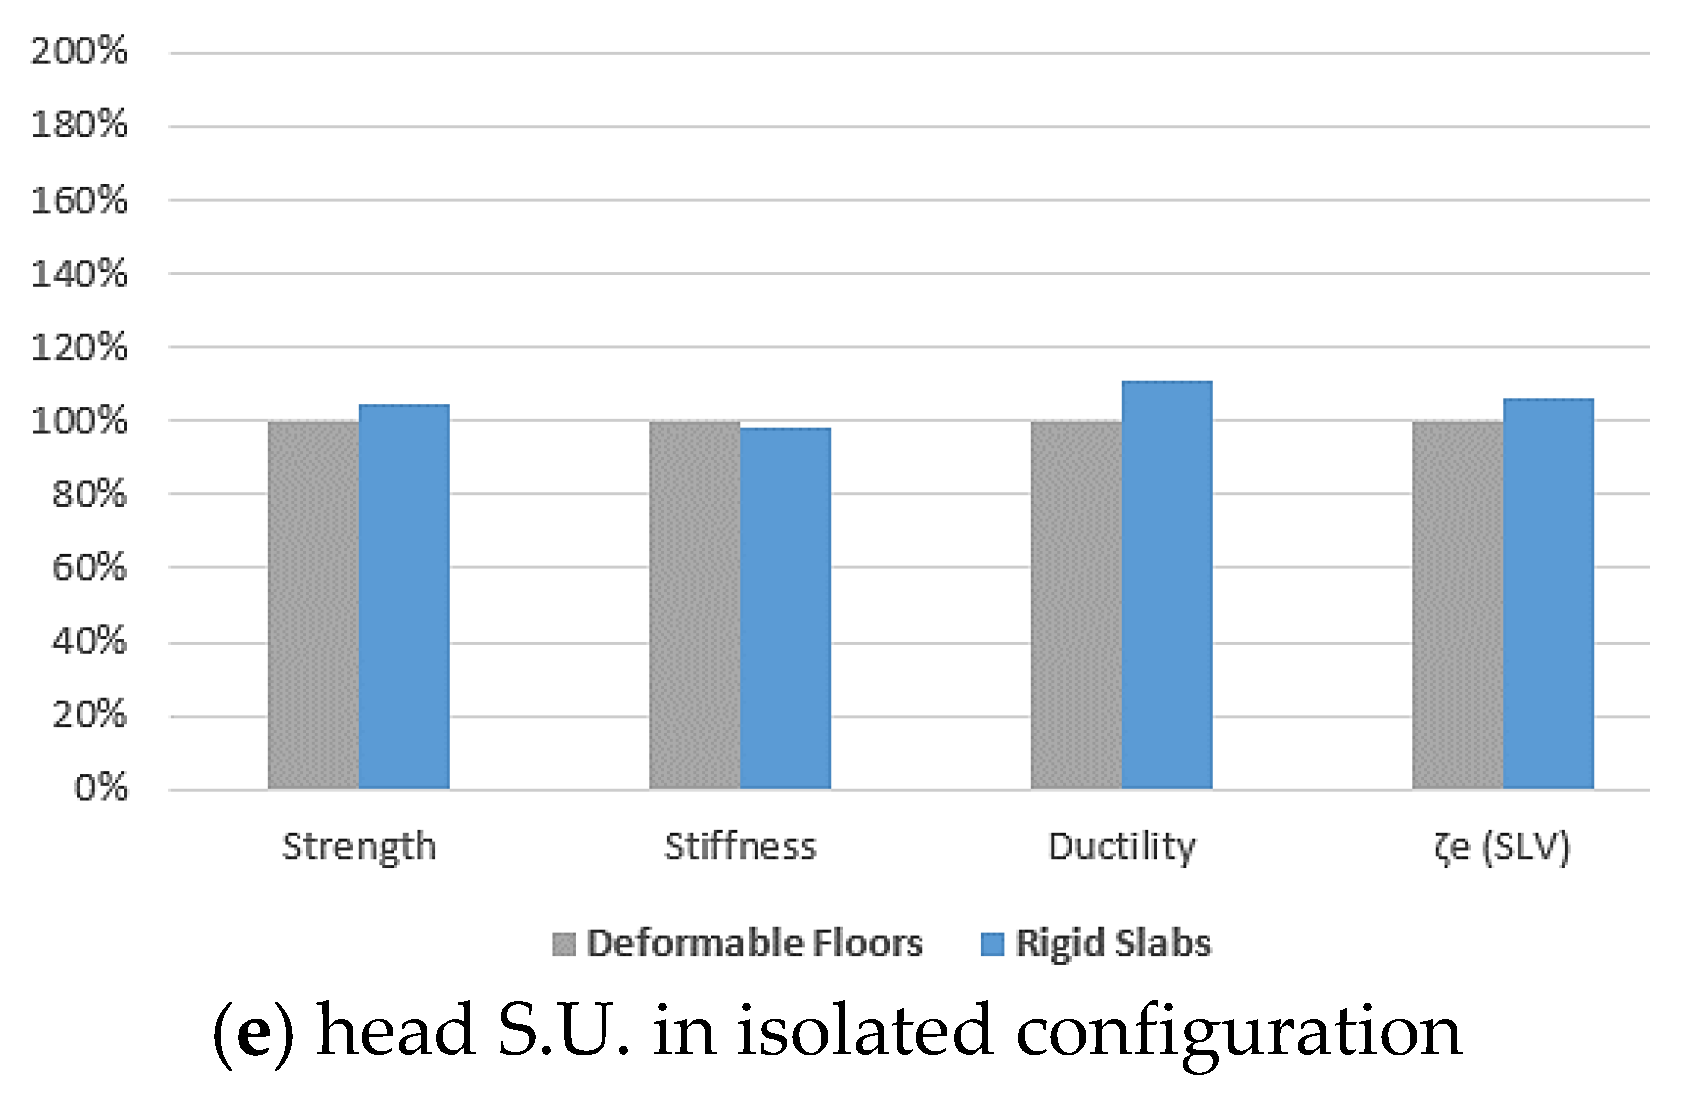
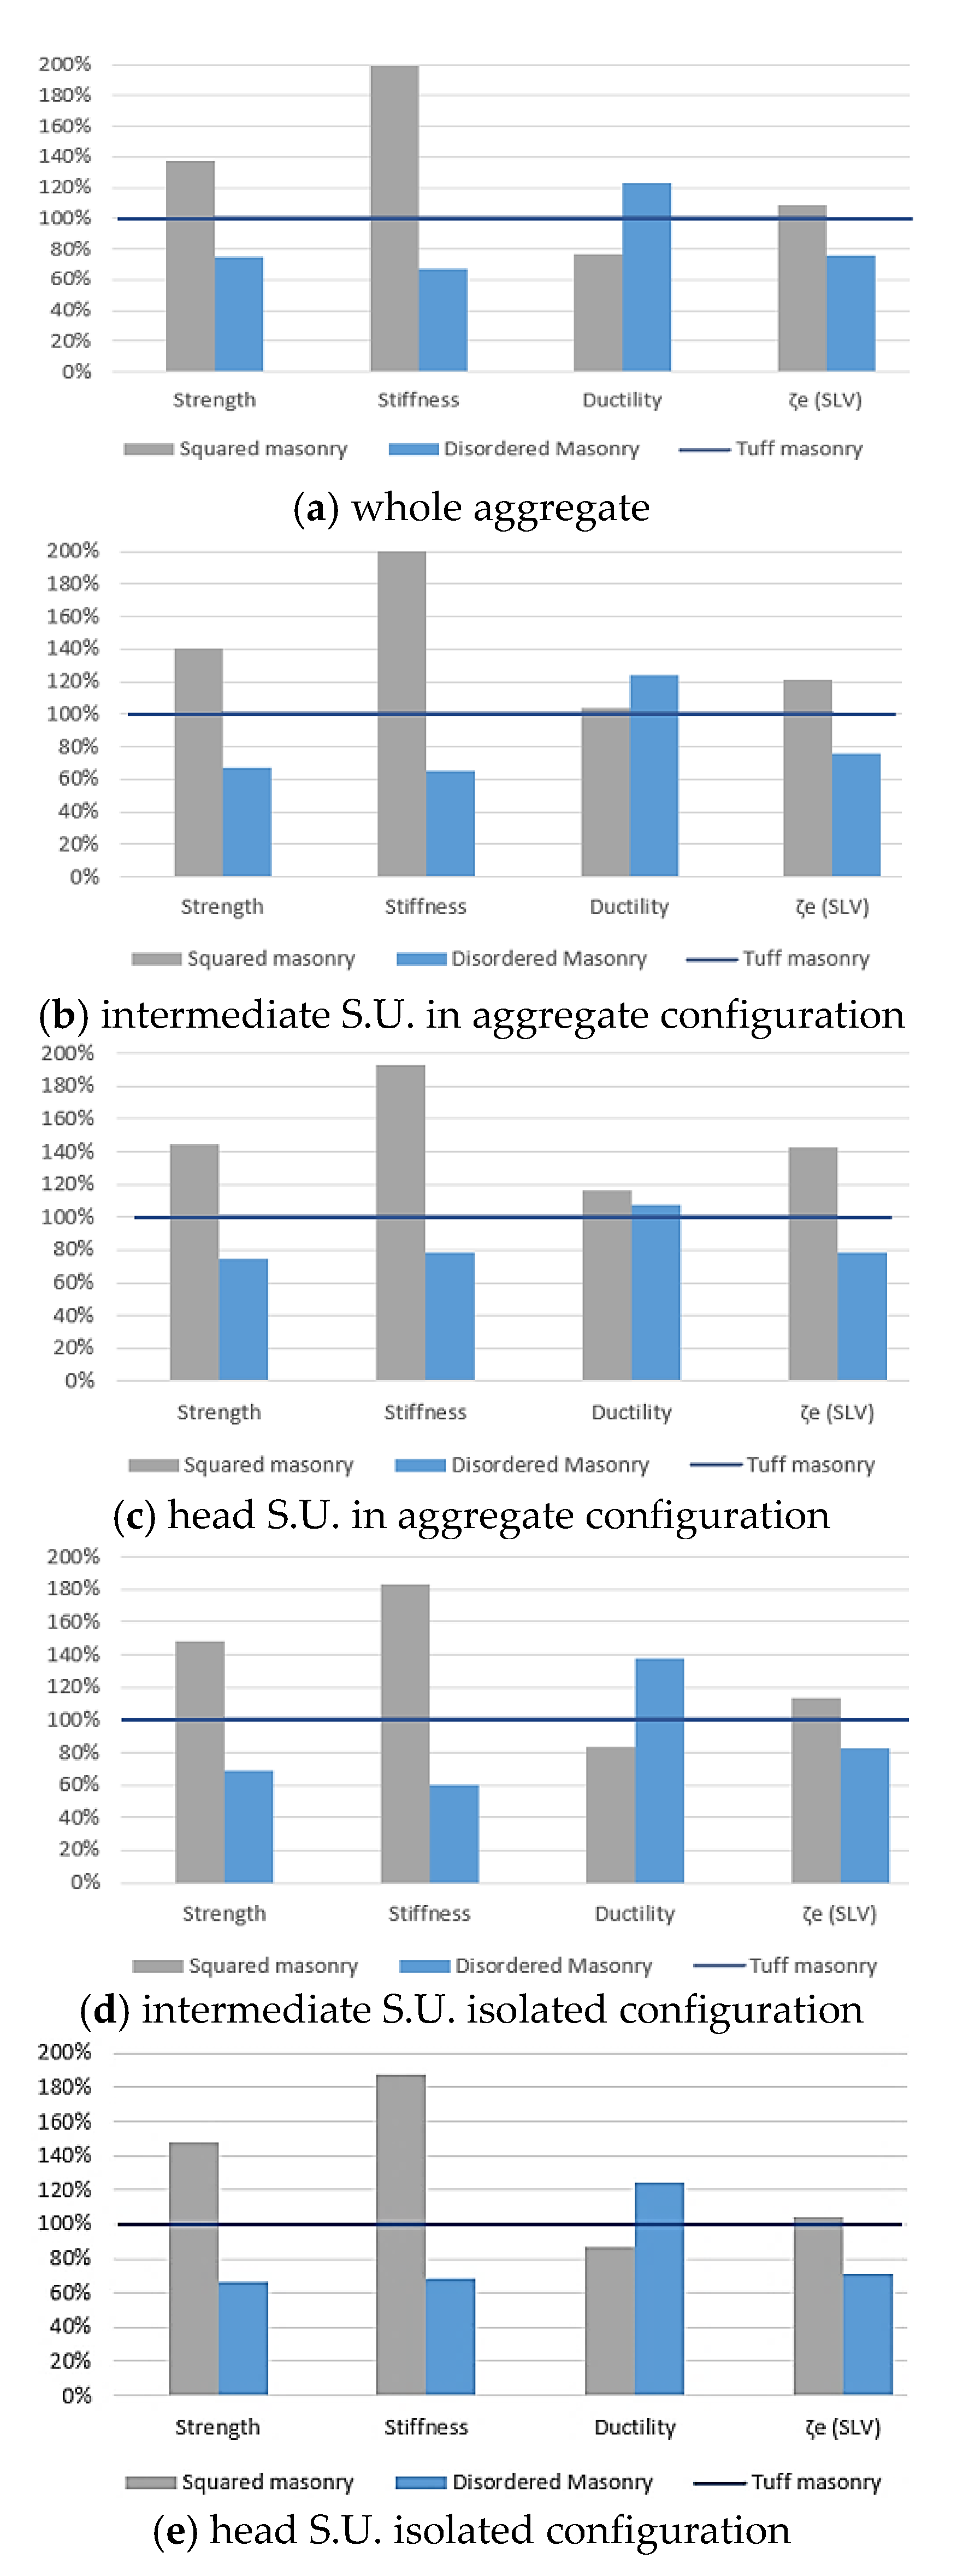
The results of pushover analyses are presented in Figure 13 by comparing the performances of inspected buildings in terms of the strength, stiffness, ductility and safety index. In this figure, the horizontal blue line indicates the target attained by buildings made of the basic material (tuff stones) before the proposed interventions.
The results highlight how the use of good quality masonry provides an important increase in terms of resistance and stiffness rather than the structural ductility, which has increased by 22% both for the whole aggregate and the head SU in aggregate condition and only by 10% for the intermediate SU placed in aggregate. Moreover, as expected, the characteristics in terms of the stiffness, strength, and risk factor are reduced considering the poor mechanical characteristics of the masonry.

4.3. Fragility Analysis of the Typological Building Classes

In this section, the fragility curves were analysed for the case study buildings, taking into consideration the structural behaviour of their original state (seismic safety factor ξ < 1) and the design one (seismic safety factor ξ > 1). As is known, fragility curves represent the probability of exceeding a certain damage threshold varying the intensity measurement, IM, generally represented by the PGA or spectral displacements, Sd. The evaluation of the fragility curves is carried out according to the methodology proposed in [26]. In particular, four damage levels, namely D1 (slight), D2 (moderate), D3 (near collapse), and D4-D5 (collapse), were considered as proposed in [27]. Such damage states were defined considering the yielding displacement (dy) and ultimate displacement (du) of the SDoF system.
Methodologically, fragility curves were defined according to Equation (1):
P [ DS | PGA ] = Φ [ 1 β ln ( PGA PGA DS ¯ ) ]
where Φ is the cumulative distribution function, PGADS is the median acceleration value associated with each damage threshold, and β is the standard deviation of the log-normal distribution. Specifically, concerning the median values of PGADS, these were evaluated according to provisions depicted in [27,28], which provide the values of Table 3.
The above-mentioned median threshold values were obtained by converting the spectral displacements, dy and du associated with the SDoF system, into spectral accelerations, Sa,e according to Equation (2)
S a , e = ω 2 S d , e = ( 2 π T ) S D K
where, T is the vibration period associated with the structural system and SDK is the spectral displacement range [27].
Consequently, the dispersion, β, generally depends on the uncertainties associated with the seismic demand. This parameter is function of the ductility, μ, of the structural system, intended as the ratio between the ultimate displacement, du, and the corresponding yielding displacement, dy, which was evaluated according to the formulation proposed in Ref. [28] (see Table 4).
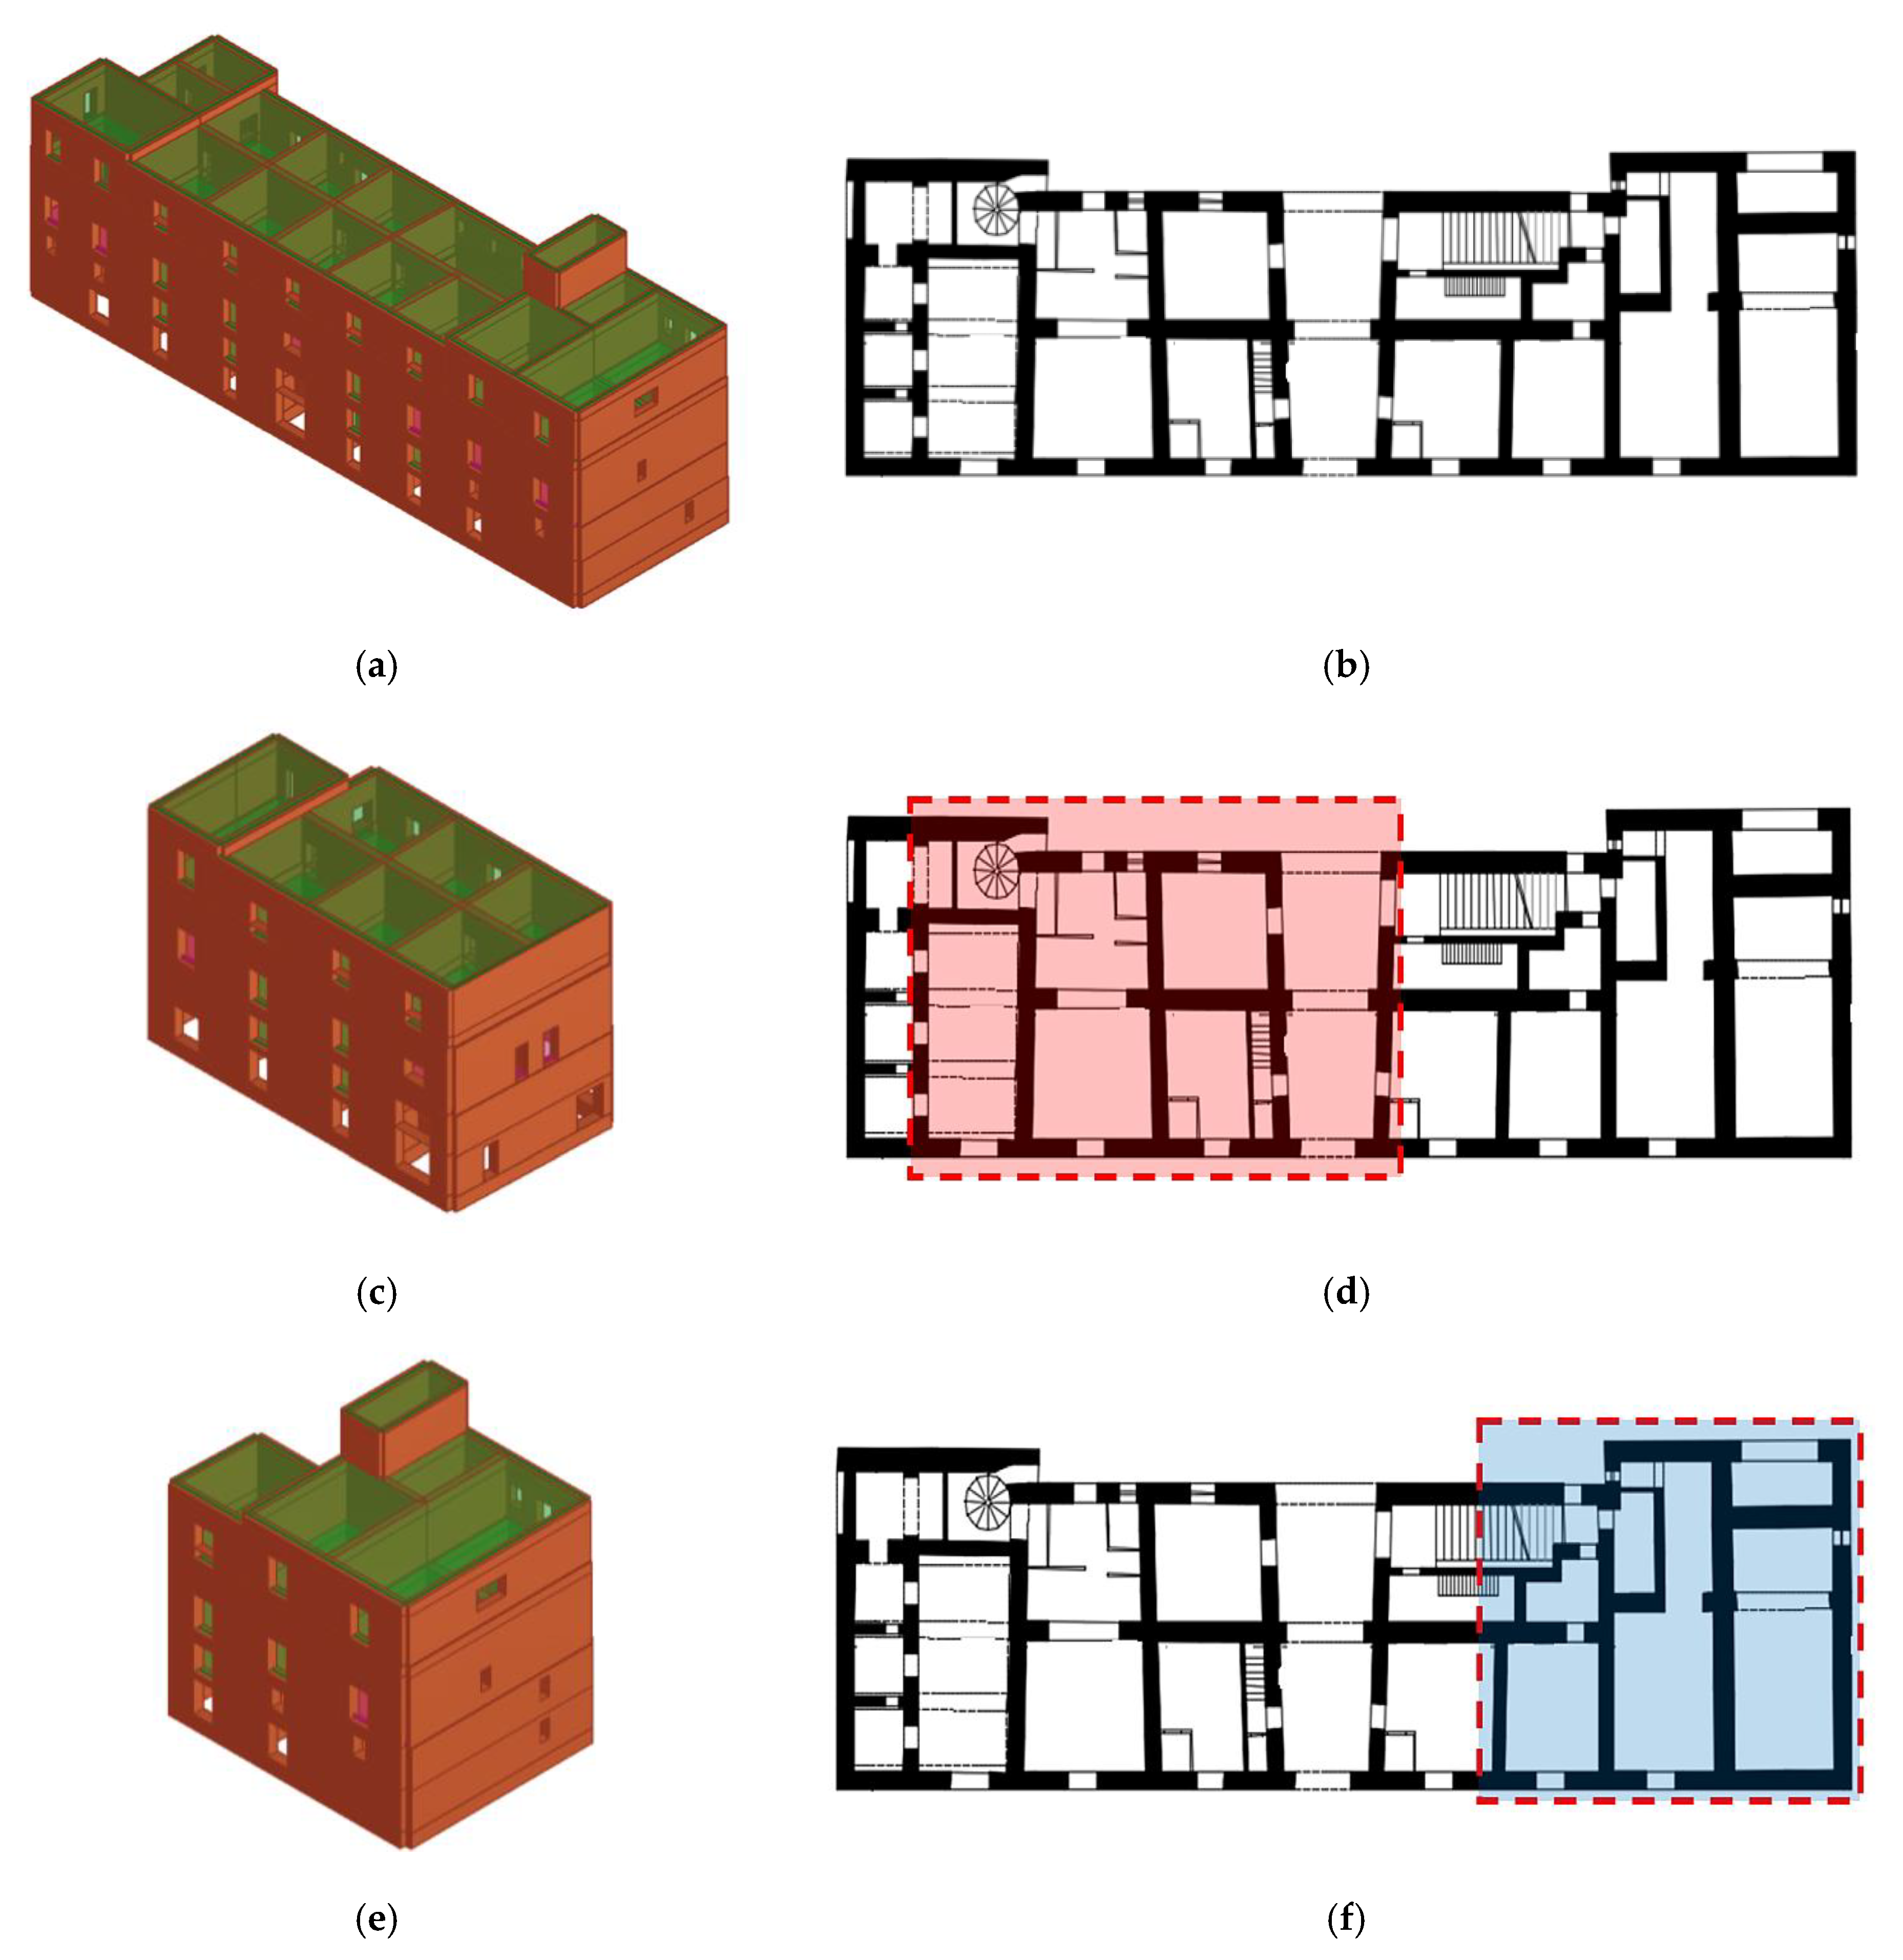
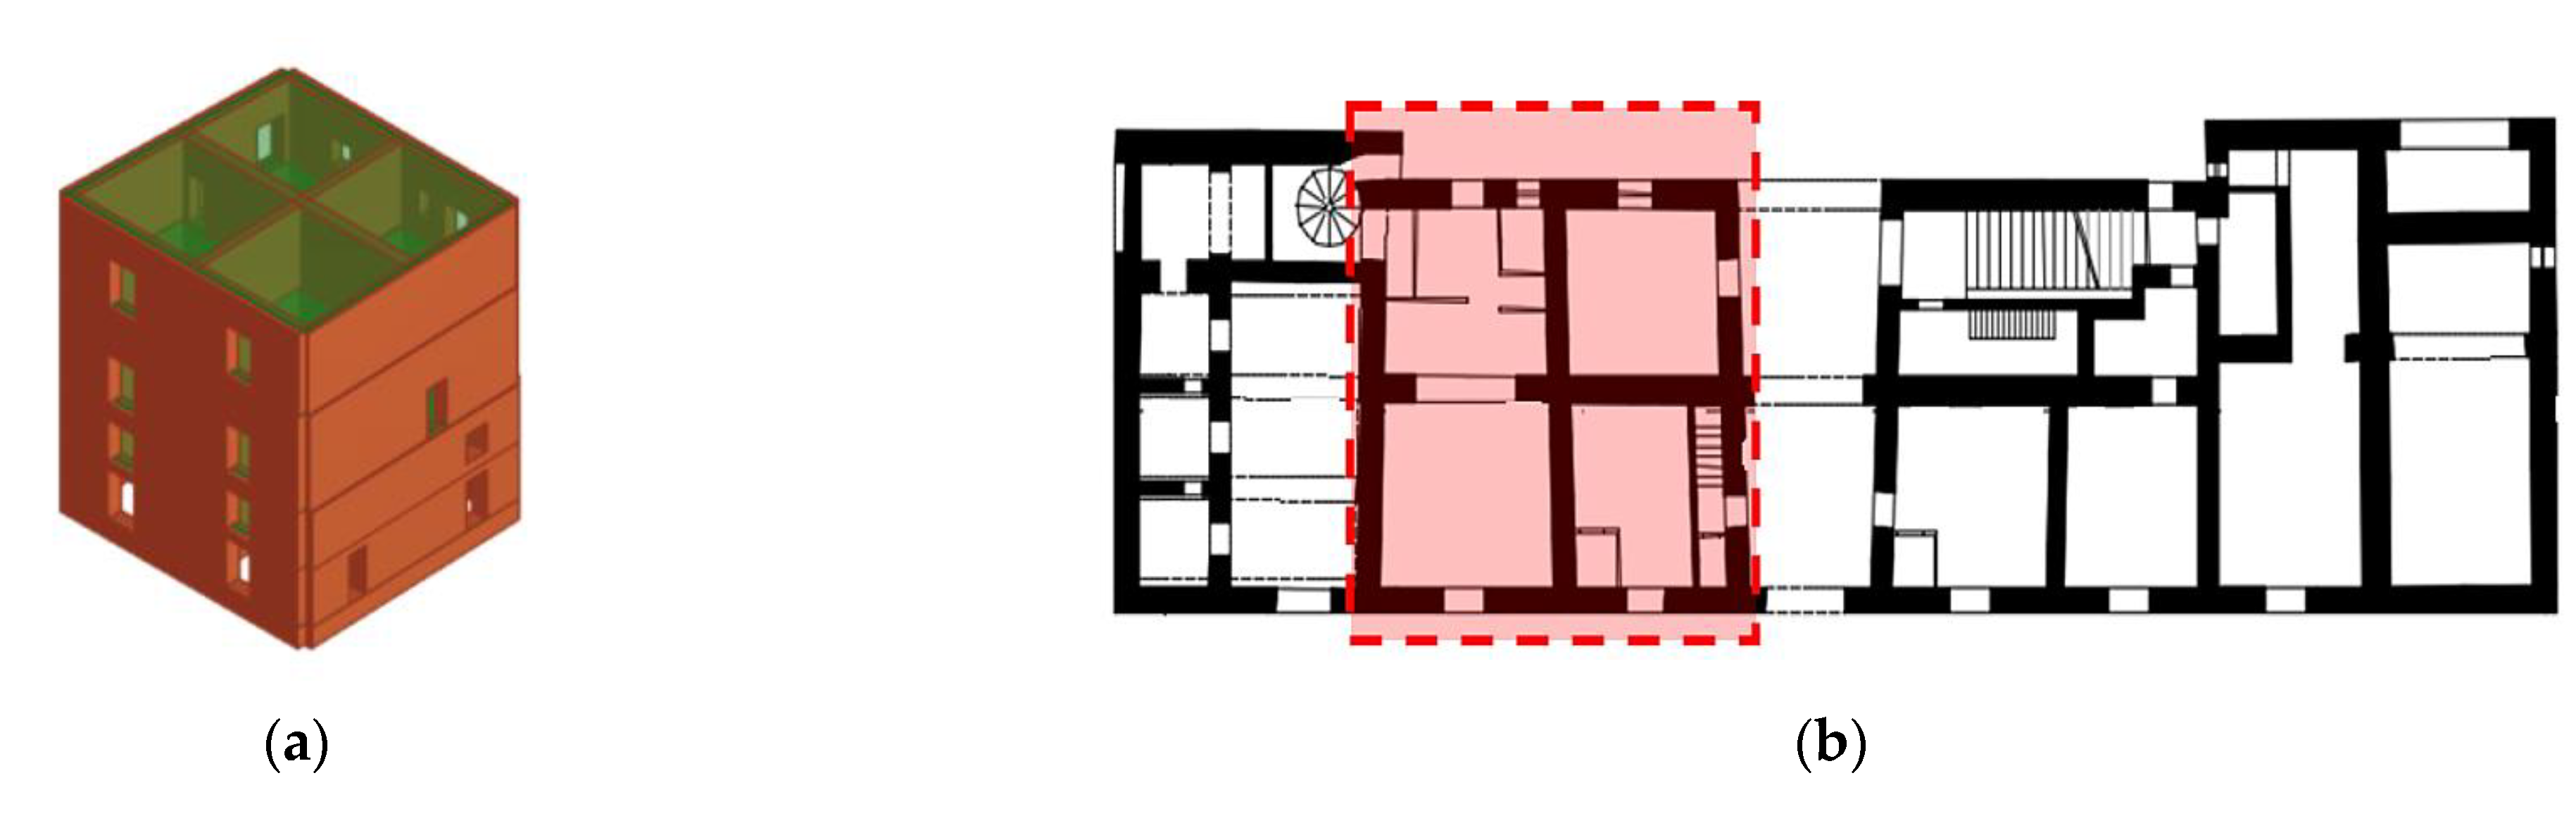
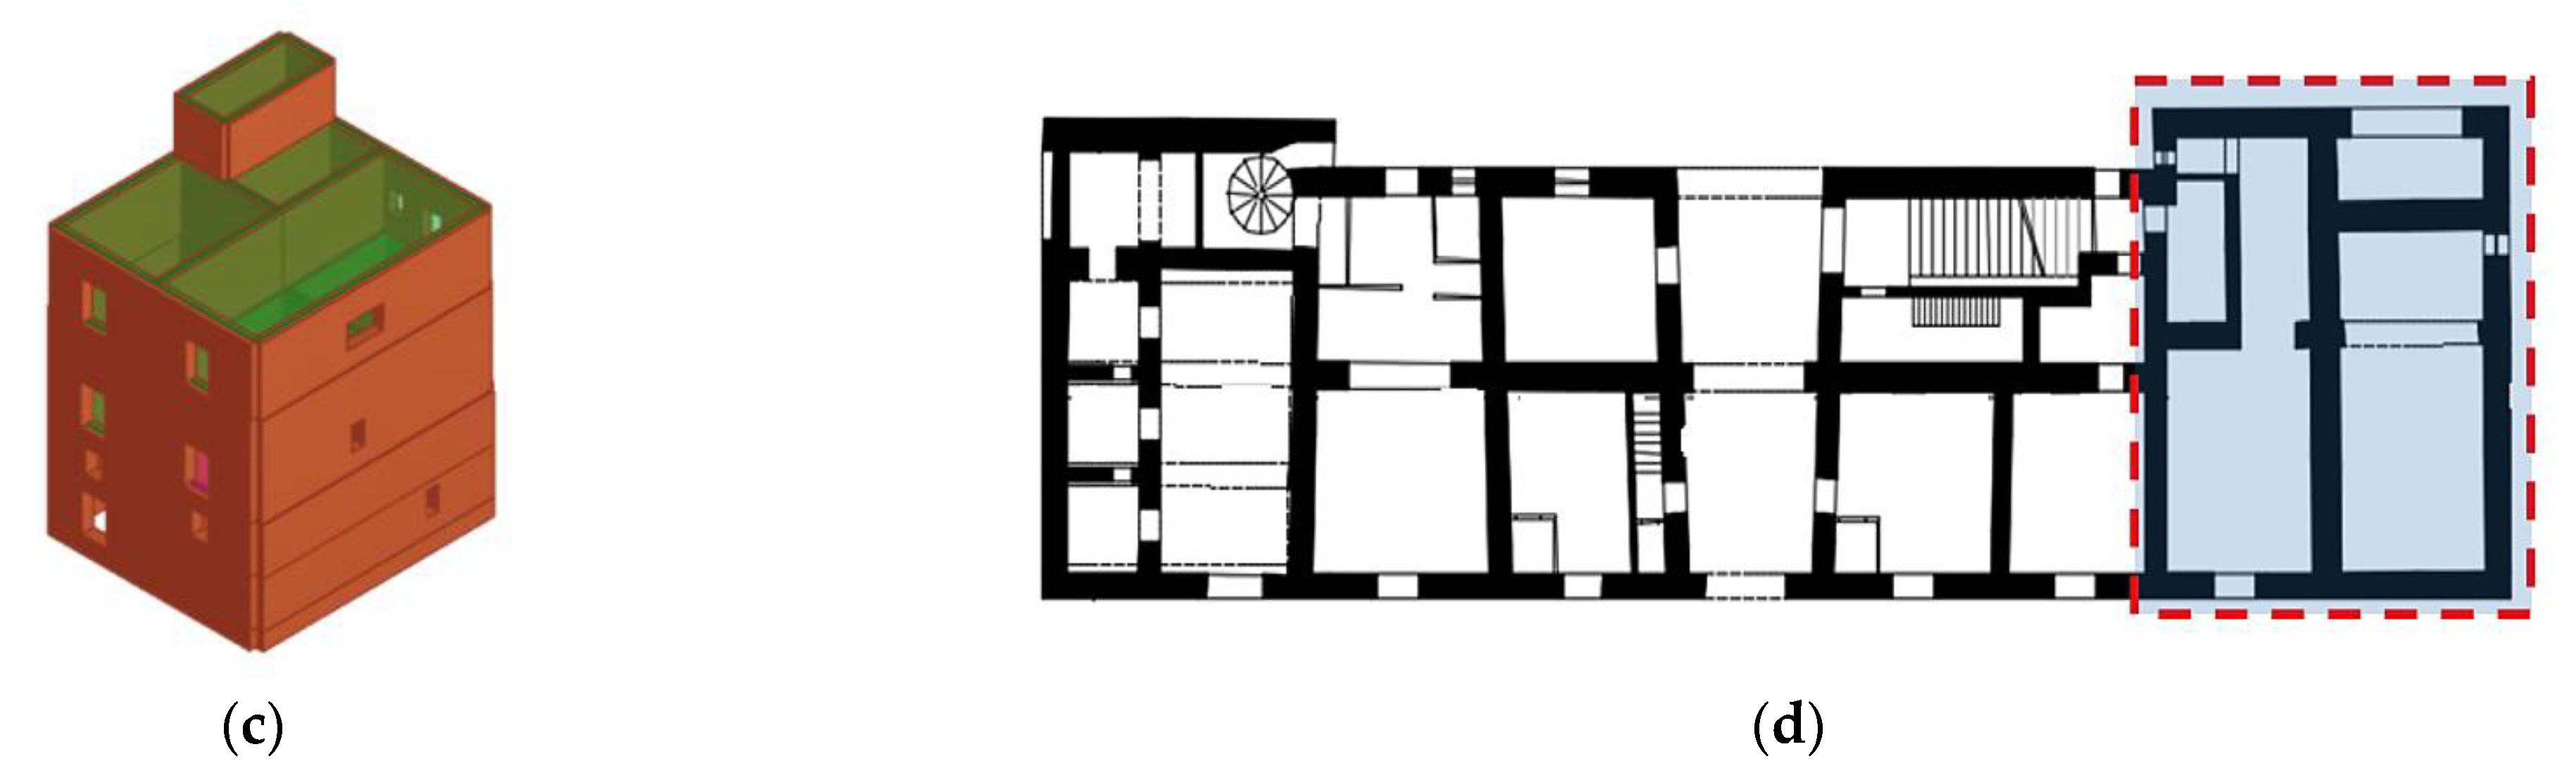
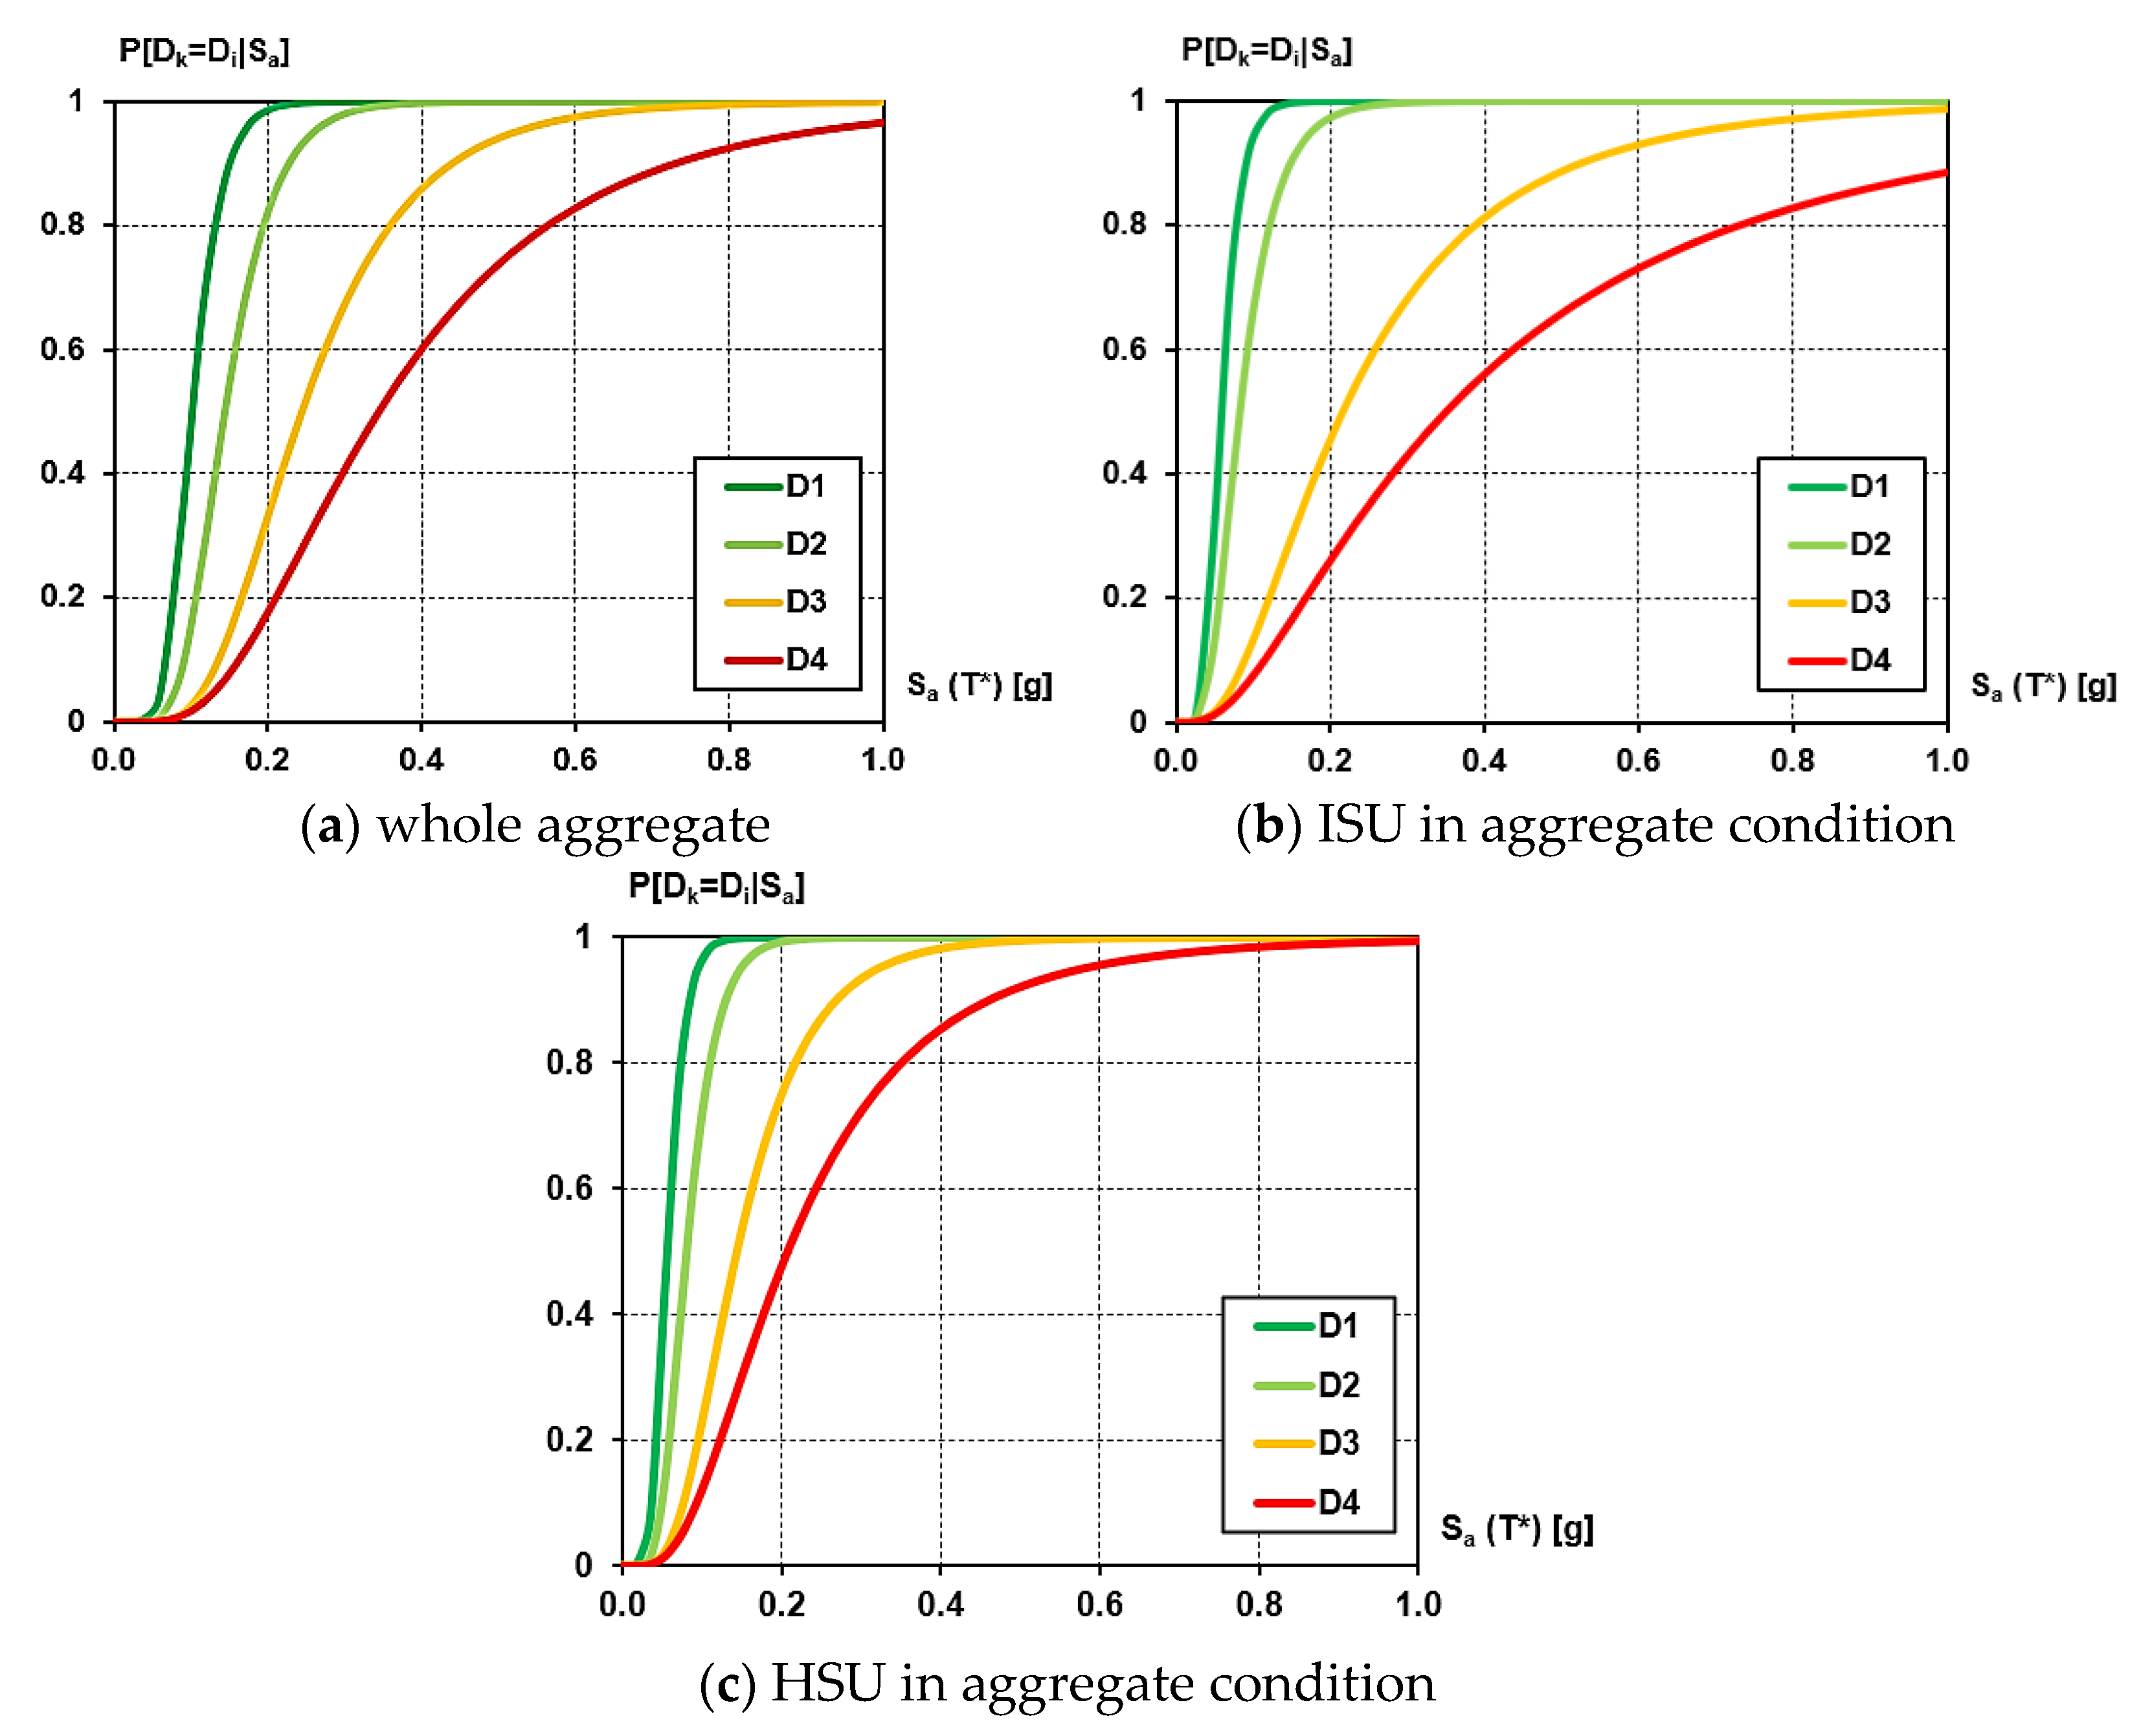
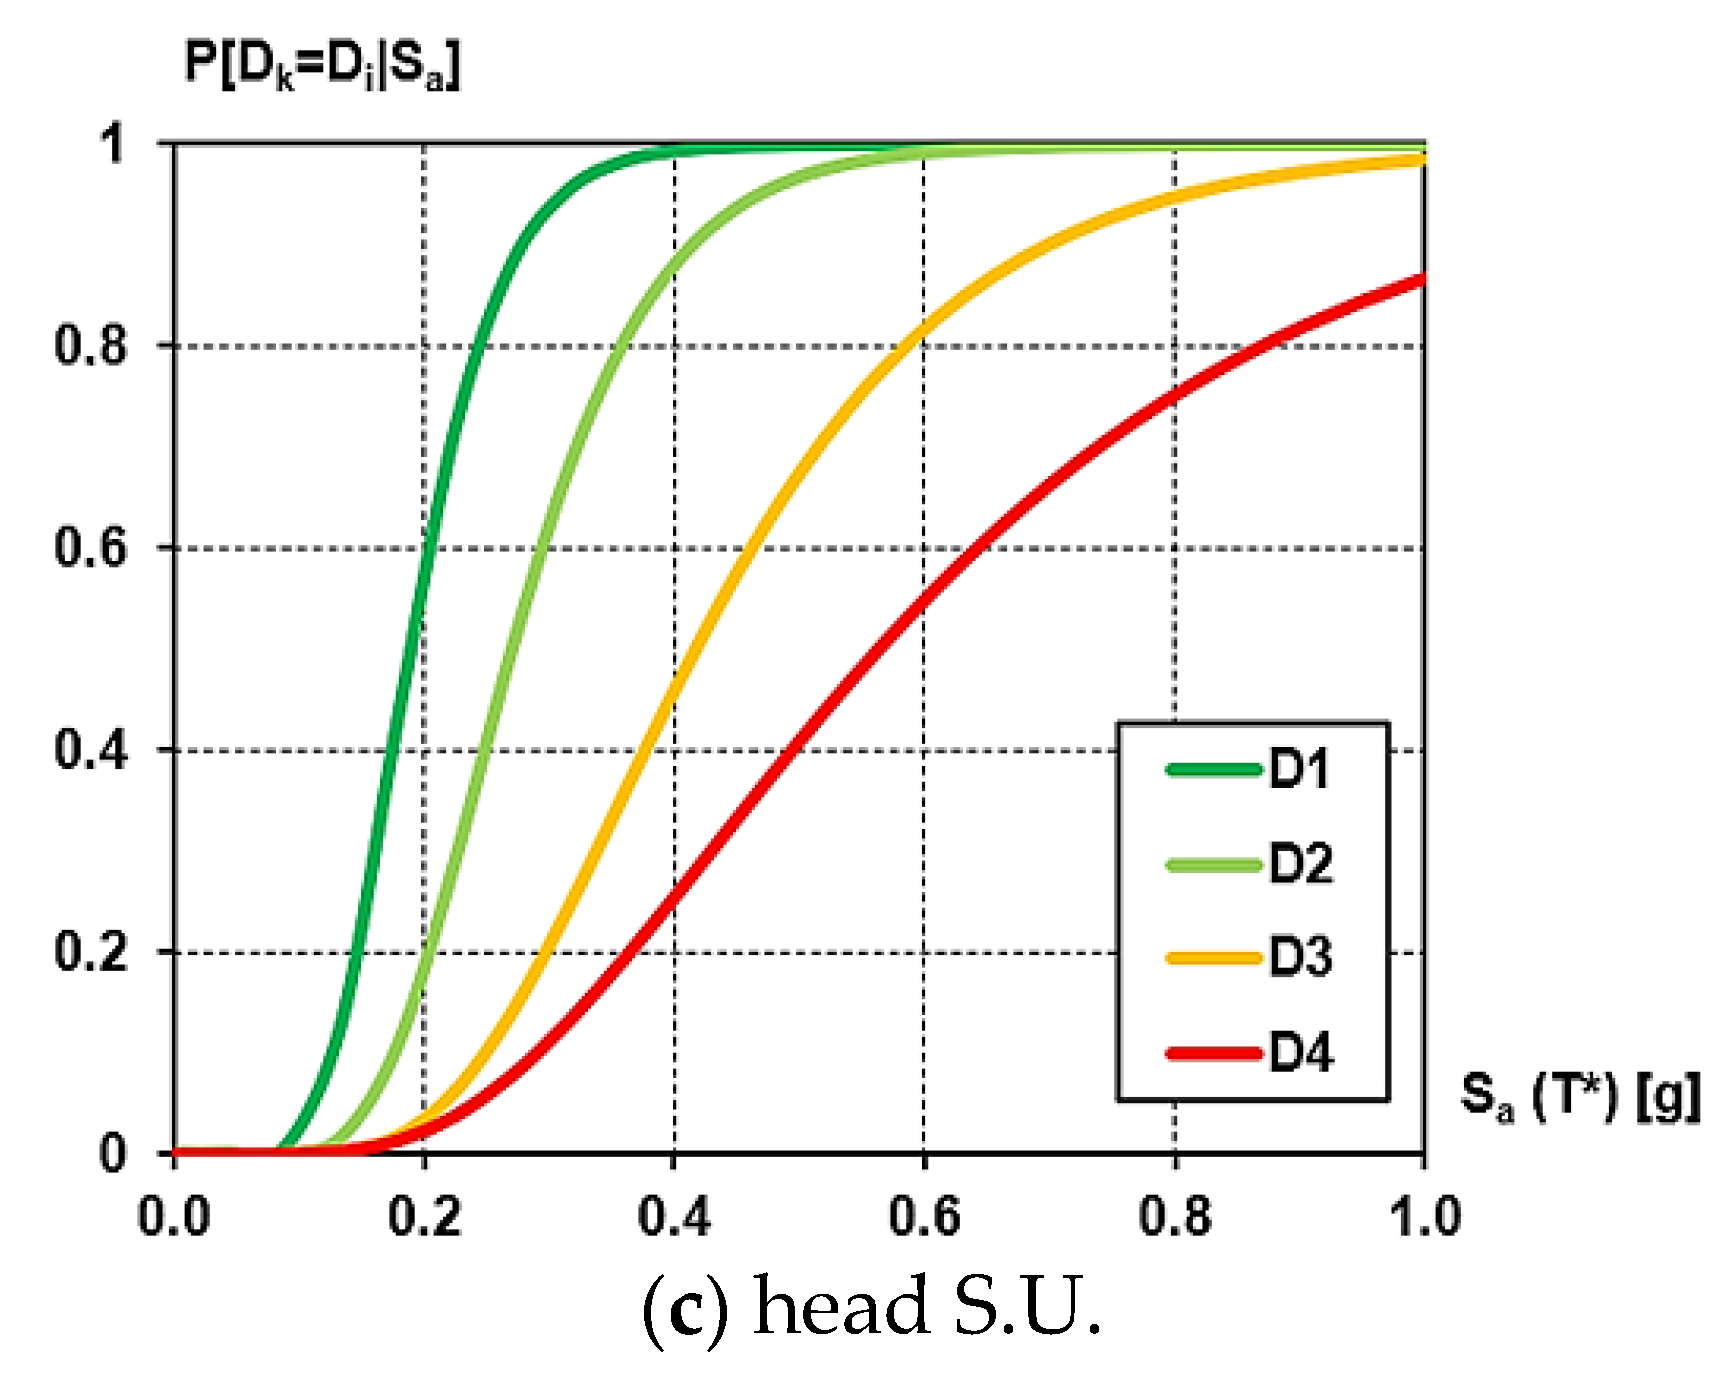
Based on these considerations, the typological fragility curves were plotted considering the most adverse structural analysis conditions, both for the existing whole aggregate and the other isolated and aggregated SUs, as reported in Figure 14.
Furthermore, for an exhaustive correlation with the presented curves, Table 5 shows the data relating to the median and standard deviation values associated with the damage thresholds considered.
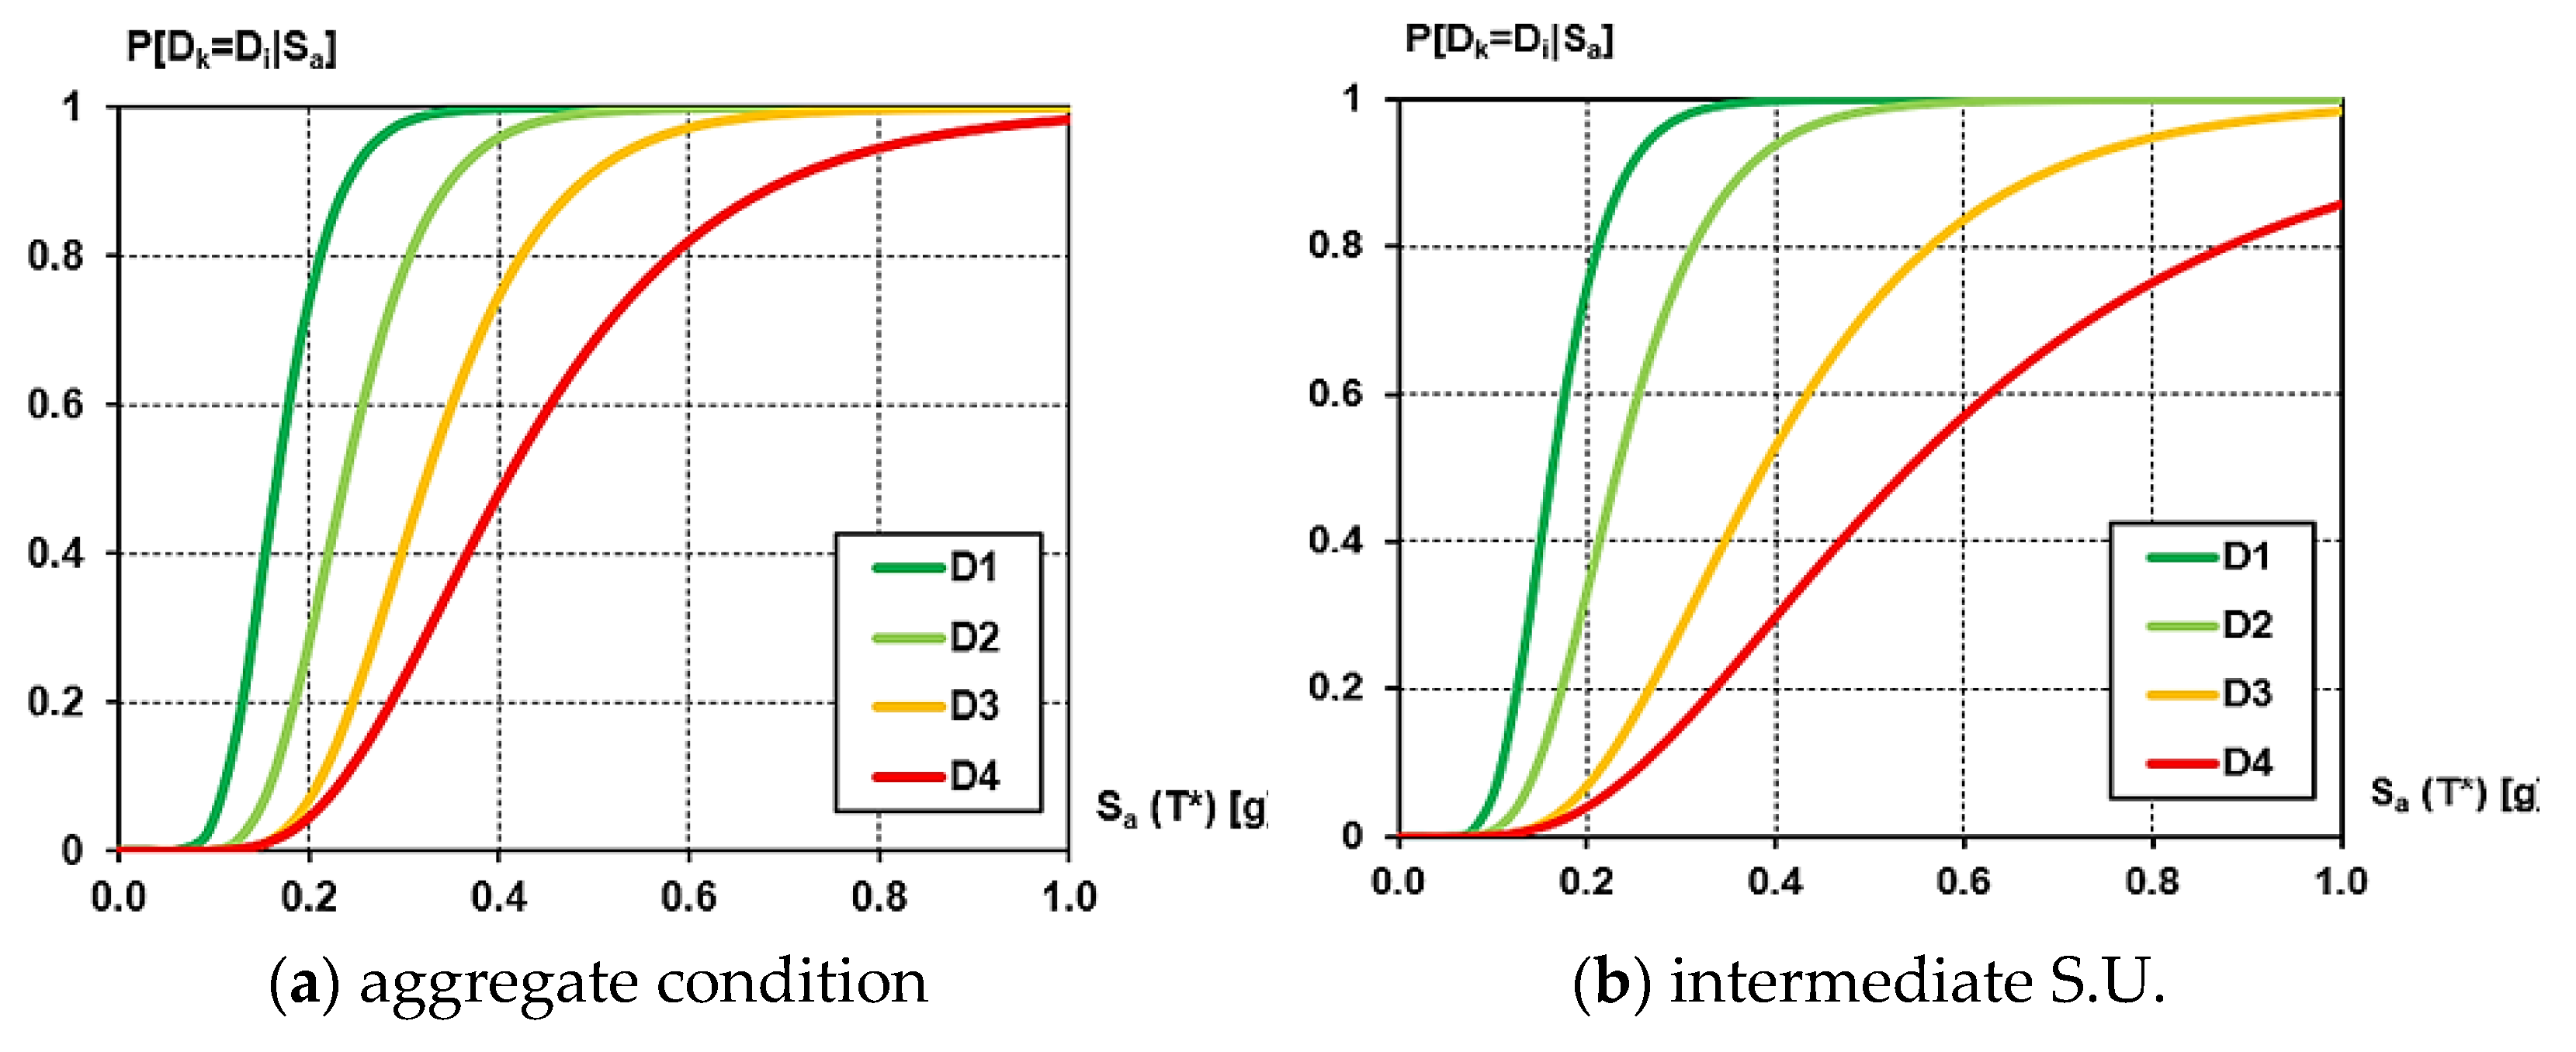
Consequently, by systematically adopting the same derivation procedure presented previously, Figure 15 shows the comparison between the monitored SUs (intermediate and head) placed in aggregate and the same units in isolated configuration.
As reported in Figure 15a, the HSU provides expected damage higher than the intermediate one. For the sake of example, it was noted that for PGA = 0.2 g, the damage thresholds D1 (slight) and D2 (moderate) for both SUs are comparable. Conversely, for PGA > 0.2 g, there is a marked difference between the expected damage level.
More in detail, for PGA = 0.4 g, referring to the damage threshold D3 (near collapse), the probability of damage associated to the HSU is 98%. Instead, for the ISU this damage probability reduces to 80%, with a damage percentage decrease of about 18%. On the other hand, considering the damage threshold D5 (collapse) and the PGA = 0.4 g, the ISU shows a percentage reduction of 41% compared to the corresponding HSU.
The same structural performance condition was also found by comparing the same SUs in the isolated configuration (see Figure 15b). In a general overview, by considering a PGA = 0.2 g, a D1 and D2 damage levels were found to be reached for the SUs monitored. However, considering an increase of the intensity measurement, for PGA equal to 0.4 g, it was possible to observe that for the ultimate limit state, D5, the HSU provides a probability of damage equal to 60%. Contrary, the ISU exhibits a percentage decrease of 42%, highlighting once again how it is less susceptible to damage than the HSU [27].
Besides, the fragility curves were derived even for the retrofitted buildings by adopting rigid floors. The results are plotted in Figure 16.
Similarly, Table 6 suggests the values of the median and standard deviation for the derivation of the typological fragility functions associated with consolidated structural systems.
The results achieved show a clear increase of the structural performance levels provided by all the monitored configurations examined (whole aggregate and two SUs). Specifically, by examining the performance thresholds obtained through the proposed strengthening interventions with those presented previously (see Figure 14), an improvement of the capacity response of the examined structural units was observed with a consequent reduction of the corresponding damage probabilities thresholds, DSi.
In particular, we ascertained that the adoption of the rigid floor system offers an increment in terms of expected displacements favouring, as previously analysed in Section 4.2, a progressive enhancement of the corresponding structural ductility µs.

5. Conclusions

In this paper, the seismic response of a masonry aggregate located in Cercola, a municipality near the city of Naples, was investigated. The selected aggregate consists of four structural units (SUs): two in a head position and two in an intermediate one, which mutually interact. In particular, three different structural configurations were analysed to estimate the influence of mutual interaction among adjacent structural units: (i) the whole aggregate; (ii) the intermediate structural unit; (iii) the head structural unit. Furthermore, the same structural units were also studied in isolated configurations without considering the interaction effects derived on a given SU from adjacent SUs.
Static non-linear analyses on the above-mentioned buildings were carried out through 3MURI software to acquire their capacity curves and collapse mechanisms. From the obtained results, it was observed that in most cases, strength and stiffness increased proportionally passing from the SUs placed in isolated conditions to the corresponding ones grouped in aggregate. In contrast, the structural ductility offered by the SUs in isolated conditions was more accentuated compared to that of SUs in aggregate configuration. The final step of these analyses was to perform the seismic safety checks of the inspected buildings at the Ultimate Limit State according to the Italian code. It was noticed that seismic checks were not satisfied in any cases. For this reason, some seismic upgrading interventions were foreseen. Firstly, the use of rigid floor able to increase structural ductility and seismic safety factor of buildings was considered. Later on, the effect of modifying the mechanical properties of masonry was investigated. In particular, the intervention of masonry features improvement provided an important increase in performance in terms of resistance and stiffness.
In addition, fragility curves of the different buildings examined in both the original state and the design configuration were plotted. The obtained results showed a clear improvement of the structural performance of both whole aggregate and monitored SUs after proposed retrofit interventions.
In particular, the adoption of rigid floors provided an improvement of the seismic behaviour thanks to the increase of the offered structural ductility.
Finally, this work represents a starting point for a broad and accurate assessment of the seismic vulnerability of structural units placed in aggregate configurations, offering a relevant assessment of possible retrofitting solutions aimed at improving the expected seismic performance levels. Furthermore, this procedure, despite being applied to a specific historical centre, can also be extended to entire urban areas with similar structural morphology to evaluate the reliability of different seismic assessment strategies consistent with the historical fabric detected in situ.

Author Contributions

Conceptualization. A.F., N.C., and G.V.; methodology. A.F.; software. G.V., N.C.; validation. A.F., N.C., and G.V.; formal analysis. N.C., G.V.; investigation. N.C., G.V.; resources. A.F.; data curation. A.F.; writing—original draft preparation. N.C., G.V.; writing—review and editing. A.F.; visualization. N.C., G.V.; supervision. A.F.; project administration. A.F.; funding acquisition. A.F. All authors have read and agreed to the published version of the manuscript.

Funding

This research received no external funding.

Data Availability Statement

Data deriving from the current study can be provided to the readers based upon their explicit request.

Acknowledgments

The authors would like to thank the DPC-ReLUIS 2019-2021 research project for the financial support provided to the development of the research activity presented in the current paper.

Conflicts of Interest

The authors declare no conflict of interest.

References

  1. Barbat, A.H.; Carreño, M.L.; Pujades, L.G.; Lantada, N.; Cardona, O.D.; Marulanda, M.C. Seismic vulnerability and risk evaluation methods for urban areas. A review with application to a pilot area. Struct. Infrastruct. Eng. 2010, 6, 17–38. [Google Scholar] [CrossRef]
  2. Marghella, G.; Marzo, A.; Carpani, B.; Indirli, M.; Formisano, A. Comparison between In Situ Experimental Data and Italian Code Standard Values. In Proceedings of the 16th International Brick and Block Masonry Conference (IBMAC) 2016 “Brick and Block Masonry: Trends, Innovations and Challenges”, Padua, Italy, 26–30 June 2016; pp. 1707–1714. [Google Scholar]
  3. Formisano, A. Theoretical and Numerical Seismic Analysis of Masonry Building Aggregates: Case Studies in San Pio Delle Camere (L’Aquila. Italy). J. Earthq. Eng. 2017, 21, 227–245. [Google Scholar] [CrossRef] [Green Version]
  4. Chieffo, N.; Formisano, A. Geo-hazard-based approach for the estimation of seismic vulnerability and damage scenarios of the old city of senerchia (Avellino. Italy). Geosciences 2019, 9. [Google Scholar] [CrossRef] [Green Version]
  5. Chieffo, N.; Onescu, I.; Formisano, A.; Mosoarca, M.; Palade, M. Integrated empirical-mechanical seismic vulnerability analysis method for masonry buildings in timișoara: Validation based on the 2009 italian earthquake. Open Civ. Eng. J. 2020, 14, 314–333. [Google Scholar] [CrossRef]
  6. Formisano, A.; Vaiano, G.; Fabbrocino, F.; Milani, G. Seismic vulnerability of Italian masonry churches: The case of the Nativity of Blessed Virgin Mary in Stellata of Bondeno. J. Build. Eng. 2018, 20, 179–200. [Google Scholar] [CrossRef]
  7. Formisano, A.; Chieffo, N.; Milo, B.; Fabbrocino, F. The influence of local mechanisms on large scale seismic vulnerability estimation of masonry building aggregates. In Proceedings of the AIP Conference, Naples, Italy, 10–11 November 2005; Volume 1979, p. 130010. [Google Scholar] [CrossRef]
  8. Lourenço, P.B.; Roque, J.A. Simplified indexes for the seismic vulnerability of ancient masonry buildings. Constr. Build. Mater. 2006, 20, 200–208. [Google Scholar] [CrossRef] [Green Version]
  9. Lourenço, P.B.; Oliveira, D.V.; Leite, J.C.; Ingham, J.M.; Modena, C.; Da Porto, F. Simplified indexes for the seismic assessment of masonry buildings: International database and validation. Eng. Fail. Anal. 2013, 34, 585–605. (In Italian) [Google Scholar] [CrossRef]
  10. Mezzapelle, P.A.; Clementi, F.; Lenci, S. The seismic vulnerability of historic masonry buildings: From knowledge to structural consolidation. In Cultural Capital: STUDIES on the Value of Cultural Heritage; Edizioni Università di Macerata EUM: Macerata, Italy, 2017. (In Italian) [Google Scholar]
  11. Rapone, D.; Brando, G.; Spacone, E.; De Matteis, G. Seismic vulnerability assessment of historic centers: Description of a predictive method and application to the case study of scanno (Abruzzi. Italy). Int. J. Archit. Herit. 2018, 12, 1171–1195. [Google Scholar] [CrossRef]
  12. Clementi, F.; Gazzani, V.; Poiani, M.; Lenci, S. Assessment of seismic behaviour of heritage masonry buildings using numerical modelling. J. Build. Eng. 2016, 8, 29–47. [Google Scholar] [CrossRef]
  13. Formisano, A.; Marzo, A. Simplified and refined methods for seismic vulnerability assessment and retrofitting of an Italian cultural heritage masonry building. Comput. Struct. 2017, 180, 13–26. [Google Scholar] [CrossRef] [Green Version]
  14. Mosoarca, M.; Onescu., I.; Onescu., E.; Anastiasadis, A. Seismic vulnerability assessment methodology for historic masonry buildings in the near-field areas. Eng. Fail. Anal. 2020, 115. [Google Scholar] [CrossRef]
  15. Mosoarca, M.; Onescu, I.; Onescu, E.; Azap, B.; Chieffo, N.; Szitar-Sirbu, M. Seismic vulnerability assessment for the historical areas of the Timisoara city. Romania. Eng. Fail. Anal. 2019, 101, 86–112. [Google Scholar] [CrossRef]
  16. D’Ayala, D.; Ansal, A. Non linear push over assessment of heritage buildings in Istanbul to define seismic risk. Bull. Earthq. Eng. 2012, 10, 285–306. [Google Scholar] [CrossRef]
  17. Greco, A.; Lombardo, G.; Pantò, B.; Famà, A. Seismic Vulnerability of Historical Masonry Aggregate Buildings in Oriental Sicily. Int. J. Archit. Herit. 2018, 14, 1–24. [Google Scholar] [CrossRef]
  18. Ministry of Infrastructure and Transport. Technical Standards for Construction; Official Gazette: Rome, Italy, 2018. (In Italian) [Google Scholar]
  19. Bernardini, C.; Maio, R.; Boschi, S.; Ferreira, T.M.; Vicente, R.; Vignoli, A. The seismic vulnerability assessment of a stone masonry building enclosed in aggregate. In Proceedings of the 16th European Conference on Earthquake Engineering, Thessaloniki, Greek, 18–21 June 2018. [Google Scholar]
  20. Chieffo, N.; Formisano, A. Comparative Seismic Assessment Methods for Masonry Building Aggregates: A Case Study. Front. Built Environ. 2019, 5, 123. [Google Scholar] [CrossRef]
  21. Ministry of Infrastructure and Transport. Instructions for the Application of the New Technical Code for Constructions; Official Gazette: Rome, Italy, 2019. (In Italian) [Google Scholar]
  22. Ministry of Infrastructure and Transport. Updating Technical Standards for Construction; Official Gazette: Rome, Italy, 2008. (In Italian) [Google Scholar]
  23. S.T.A. DATA. 3Muri-Seismic Calculation of Masonry Structures; S.T.A. DATA srl: Turin, Italy, user manual; Available online: https://www.3muri.com/documenti/brochure/en/3Muri10.9.0_ENG.pdf (accessed on 1 June 2021).
  24. EN 1998-3. Eurocode 8: Design of Structures for Earthquake Resistance—Part 3: Assessment and Retrofitting of Buildings; CEN: Brulles, Belgium, 2004; pp. 1–97. [Google Scholar]
  25. Augenti, N.; Parisi, F. Mechanical characterization of tuff masonry. Proc. Prot. Hist. Build. (PROHITECH) 2009, 9, 1579–1584. [Google Scholar]
  26. Cattari, S.; Curti, E.; Giovinazzi, S.; Lagomarsino, S.; Parodi, S.; Penna, A. Un modello meccanico per l’analisi del costruito in muratura a scala urbana. In Proceedings of the XI Congresso Nazionale “L’ingegneria Sismica in Italia”, Genova, Italy, 25–29 January 2004. [Google Scholar]
  27. Chieffo, N.; Clementi, F.; Formisano, A.; Lenci, S. Comparative Fragility Methods for Seismic Assessment of Masonry Buildings Located in Muccia (Italy). J. Build. Eng. 2019, 25, 100813. [Google Scholar] [CrossRef]
  28. Lamego, P.; Lourenço, P.B.; Sousa, M.L.; Marques, R. Seismic vulnerability and risk analysis of the old building stock at urban scale: Application to a neighbourhood in Lisbon. Bull. Earthq. Eng. 2017, 15, 2901–2937. [Google Scholar] [CrossRef]
Figure 1. Identification of the case study building.
Geohazards 02 00006 g001
Figure 2. The masonry aggregate geometric configuration: (a) plan layout and (b) section A-A’ (measurements in meters).
Geohazards 02 00006 g002aGeohazards 02 00006 g002b
Figure 3. Building aggregate frontal view.
Geohazards 02 00006 g003
Figure 4. Intermediate structural unit in aggregate condition.
Geohazards 02 00006 g004
Figure 5. Heading structural unit in aggregate condition.
Geohazards 02 00006 g005
Figure 6. Intermediate structural unit in isolated condition.
Geohazards 02 00006 g006
Figure 7. Heading structural unit in isolated condition.
Geohazards 02 00006 g007
Figure 8. Numerical model of the case study buildings: (a,b) whole aggregate; (c,d) intermediate S.U.; (e,f) head S.U.
Geohazards 02 00006 g008
Figure 9. A numerical model of the isolated S.U. located in the intermediate (a,b) and head (c,d) positions.
Geohazards 02 00006 g009aGeohazards 02 00006 g009b
Figure 10. Pushover curves of the worst analysis scenarios for the whole aggregate (a,b), the intermediate structural units in aggregate (ISU) (c,d), and the isolated (ISU isolated) (e,f) configurations.
Geohazards 02 00006 g010aGeohazards 02 00006 g010b
Figure 11. Pushover curves of the worst analysis scenarios for the whole aggregate (a,b), the heading structural units in aggregate (HSU) (c,d), and the isolated (HSU isolated) (e,f) configurations.
Geohazards 02 00006 g011aGeohazards 02 00006 g011b
Figure 12. Influence of rigid floors on the seismic behaviour of the whole aggregate and the monitored S.Us.
Geohazards 02 00006 g012aGeohazards 02 00006 g012b
Figure 13. Influence of masonry types on the seismic behaviour of the whole aggregate and the monitored S.Us.
Geohazards 02 00006 g013
Figure 14. Typological fragility functions derived for the whole aggregate (a), the intermediate S.U. (b), and the head S.U. (c).
Geohazards 02 00006 g014
Figure 15. Comparison of fragility curves between intermediate and head S.Us in aggregate condition (a) and isolated one (b).
Geohazards 02 00006 g015
Figure 16. Fragility curves for the whole aggregate (a), intermediate S.U. (b), and head S.U. (c) after floor stiffening intervention considering the most unfavourable pushover case in each analysis direction.
Geohazards 02 00006 g016aGeohazards 02 00006 g016b
Table 1. Main vibration periods associated with the examined structural configurations.
ModelT1 (s)T2 (s)T3 (s)
Aggregate0.310.280.27
Intermediate structural unit (aggregate conf.)0.320.310.27
Head structural unit (aggregate conf.)0.320.270.21
Intermediate structural unit (isolated conf.)0.360.280.23
Head structural unit (isolated conf.)0.310.300.24
Table 2. Safety index evaluated for each structural configuration examined.
Modelζ Values
X-DirectionY-Direction
Aggregate0.750.62
Intermediate structural unit (aggregate conf.)0.740.65
Head structural unit (aggregate conf.)0.561.14
Intermediate structural unit (isolated conf.)0.710.62
Head structural unit (isolated conf.)0.431.01
Table 3. Median thresholds, PGADSi.
Median PGADS (g)
D10.7·PGAySlight
D2PGAyModerate
D3PGAy + 0.5·(PGAu-PGAy)Near-collapse
D4-D5PGAuCollapse
Table 4. Evaluated dispersion, βDS.
Dispersion, βi (-)
β10.25 + 0.07·ln(µ)Slight
β20.20 + 0.18·ln(µ)Moderate
β30.10 + 0.40·ln(µ)Near-collapse
β450.15 + 0.50·ln(µ)Collapse
Table 5. Median and dispersion values for the examined typological fragility functions.
Struct. ConfigurationAggregateIntermediateHead
D1Median (g)0.100.060.06
Dispersion (-)0.310.350.32
D2Median (g)0.140.080.08
Dispersion (-)0.360.460.37
D3Median (g)0.240.220.14
Dispersion (-)0.460.700.48
D4-D5Median (g)0.340.350.21
Dispersion (-)0.590.880.62
Table 6. Median and dispersion values for the examined typological fragility functions in the case of floor stiffening intervention.
Struct. ConfigurationAggregateIntermediateHead
D1Median (g)0.170.160.15
Dispersion (-)0.290.310.30
D2Median (g)0.240.230.21
Dispersion (-)0.300.350.32
D3Median (g)0.320.390.31
Dispersion (-)0.320.450.38
D4-D5Median (g)0.410.540.42
Dispersion (-)0.420.570.50
Publisher’s Note: MDPI stays neutral with regard to jurisdictional claims in published maps and institutional affiliations.

