
Flash Flood Susceptibility Evaluation in Human-Affected Areas Using Geomorphological Methods—The Case of 9 August 2020, Euboea, Greece. A GIS-Based Approach

 ,
,  ,
,  ,
,  ,
, 
Abstract
:1. Introduction
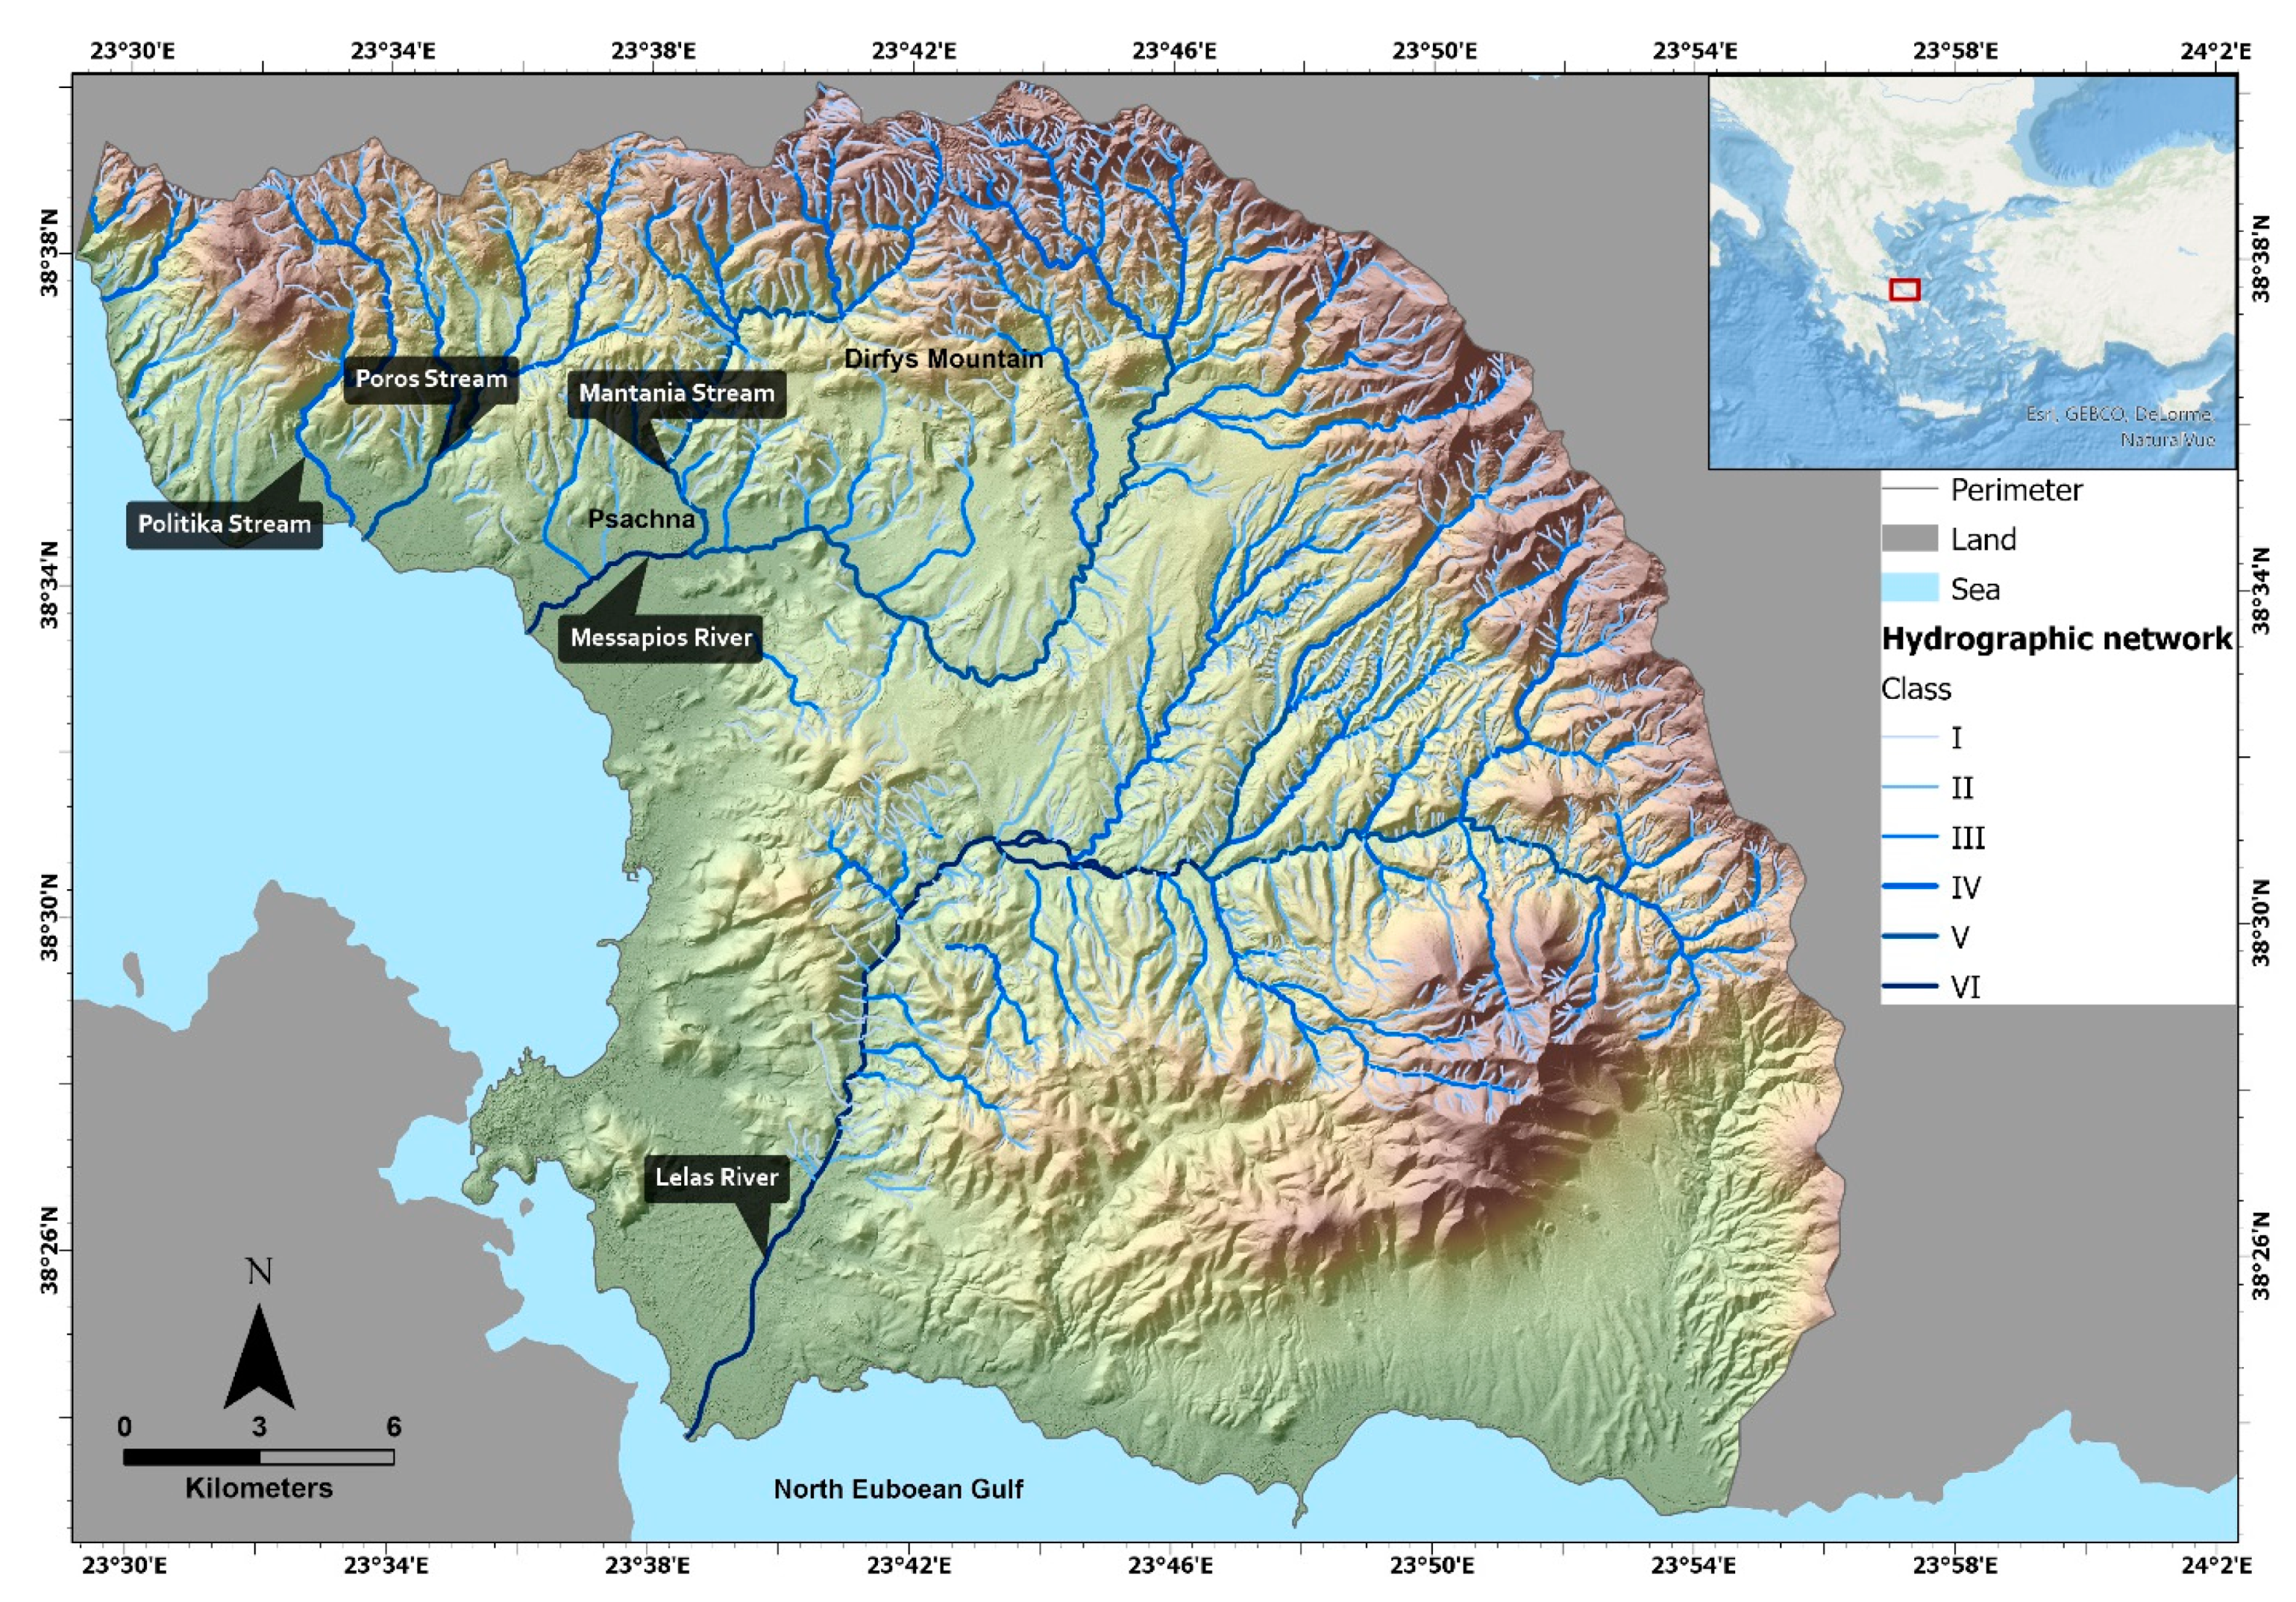
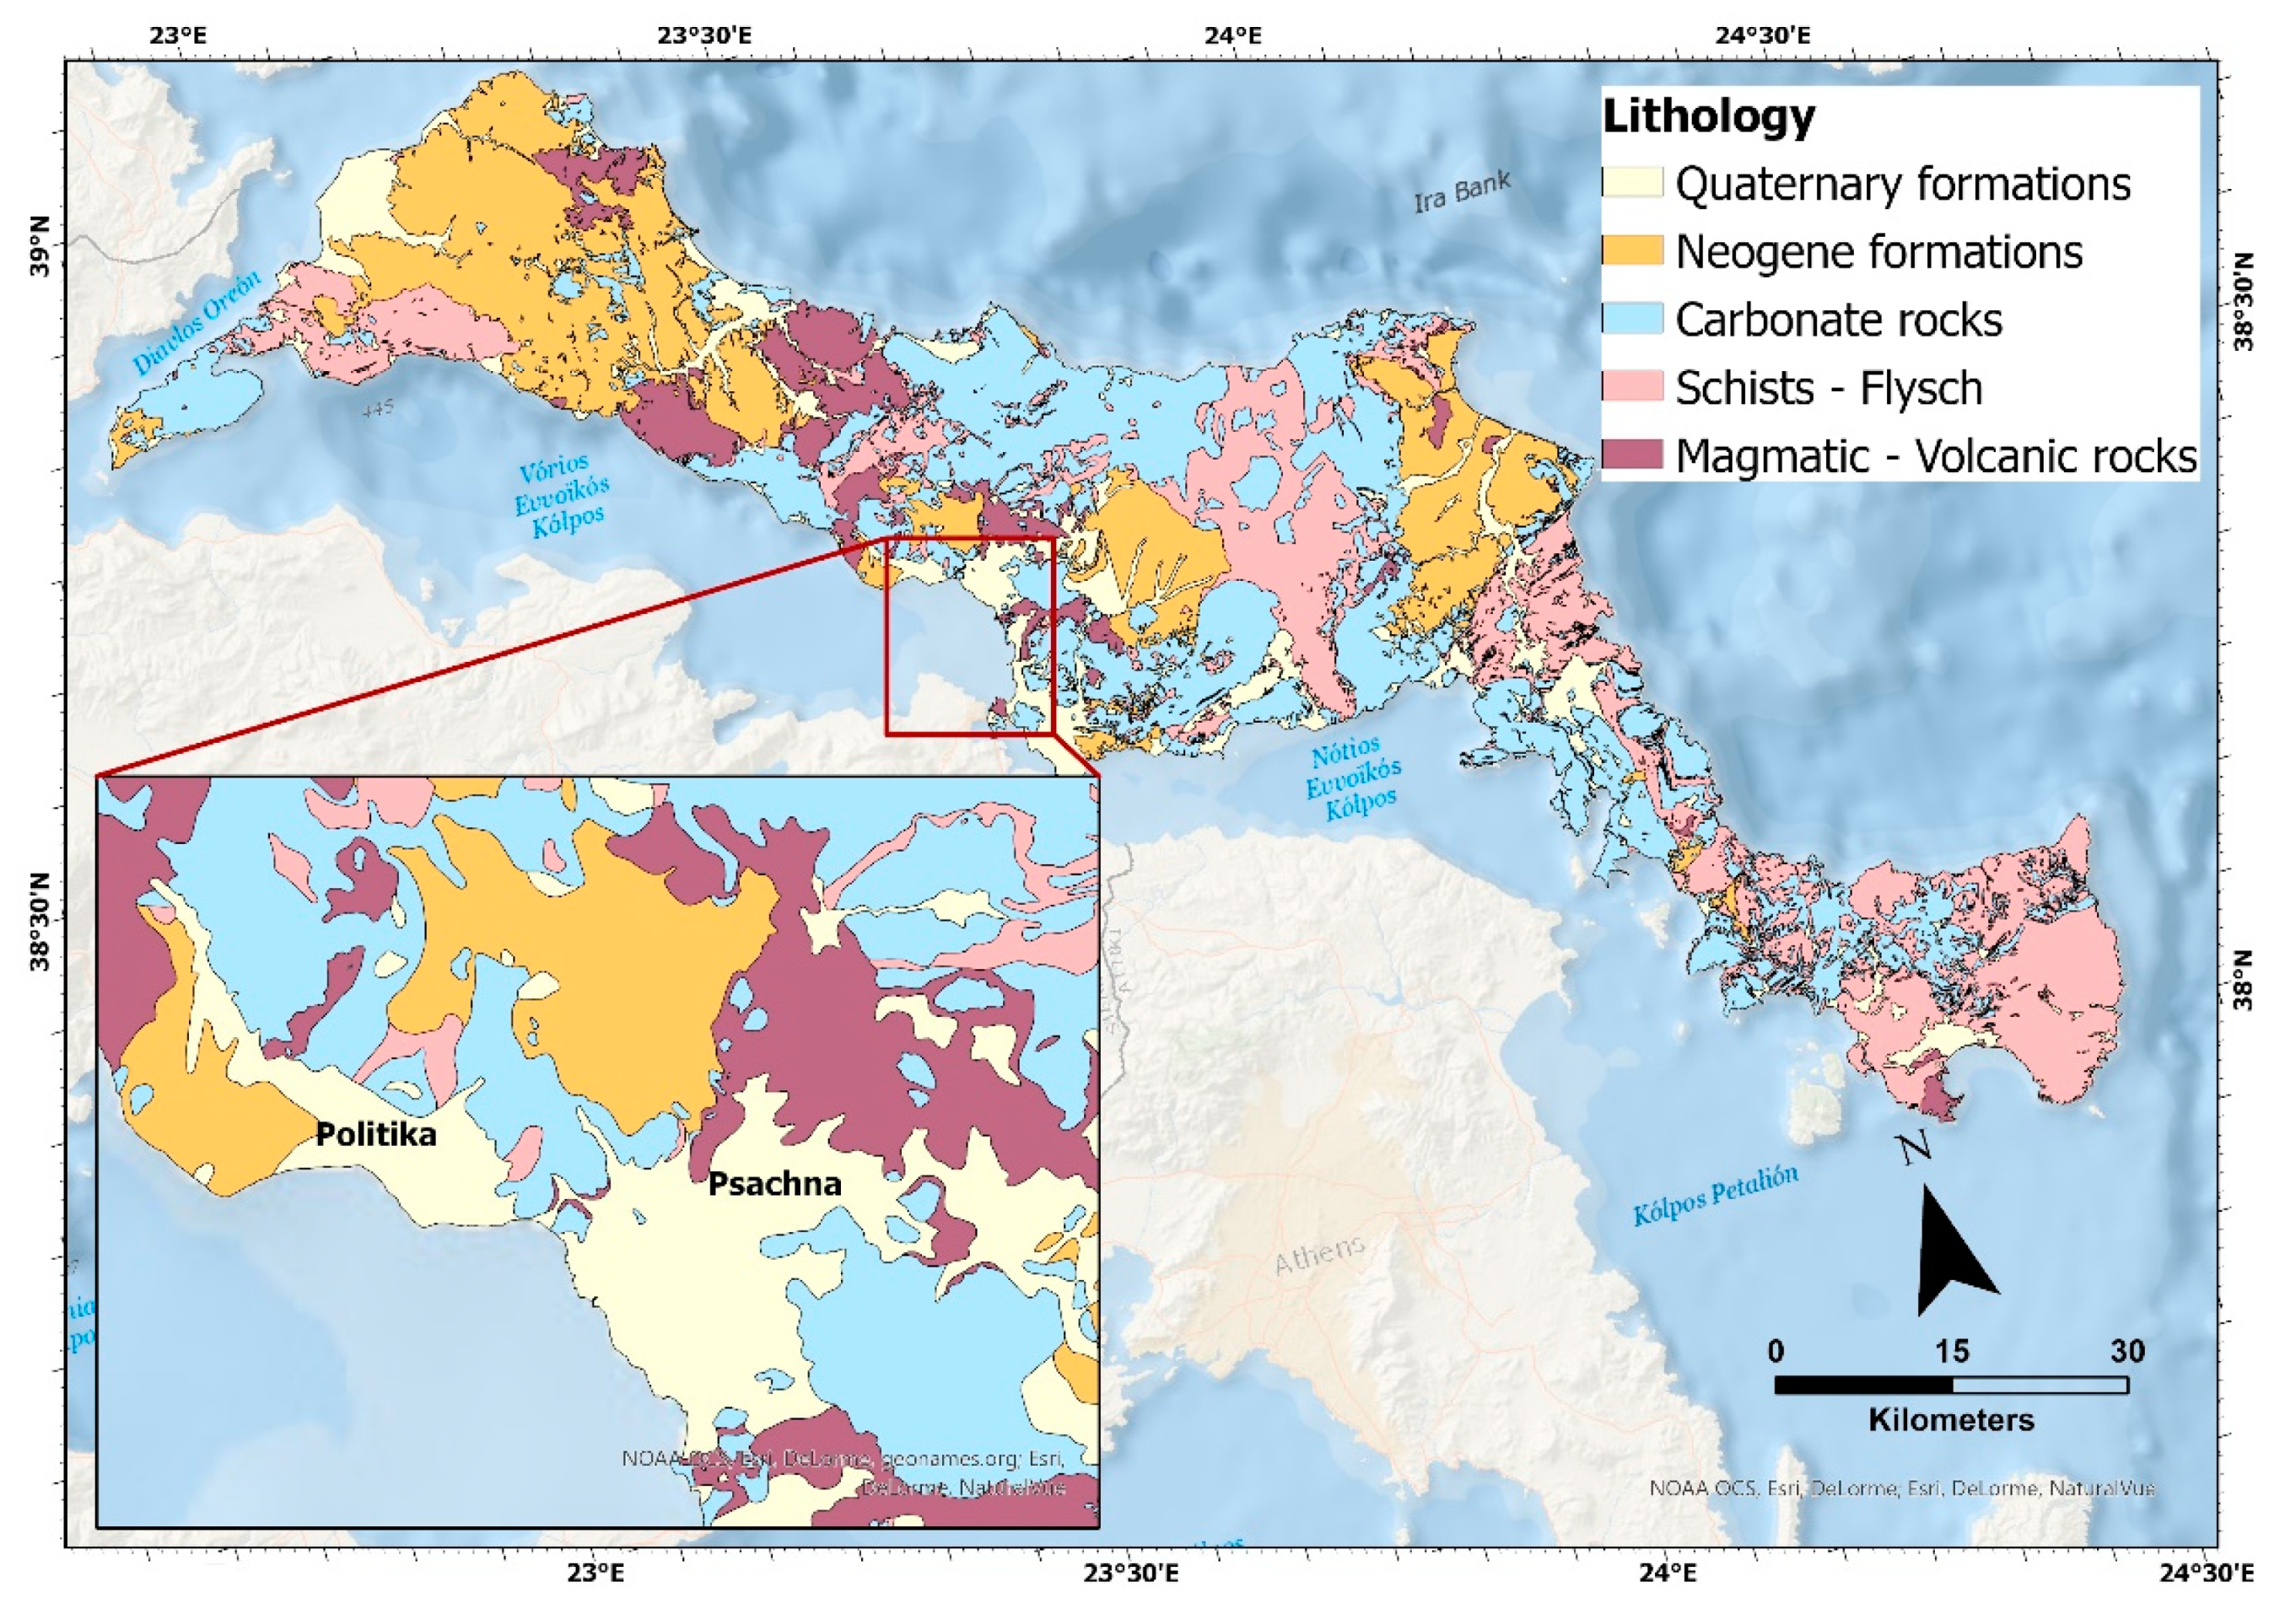
2. Study Area
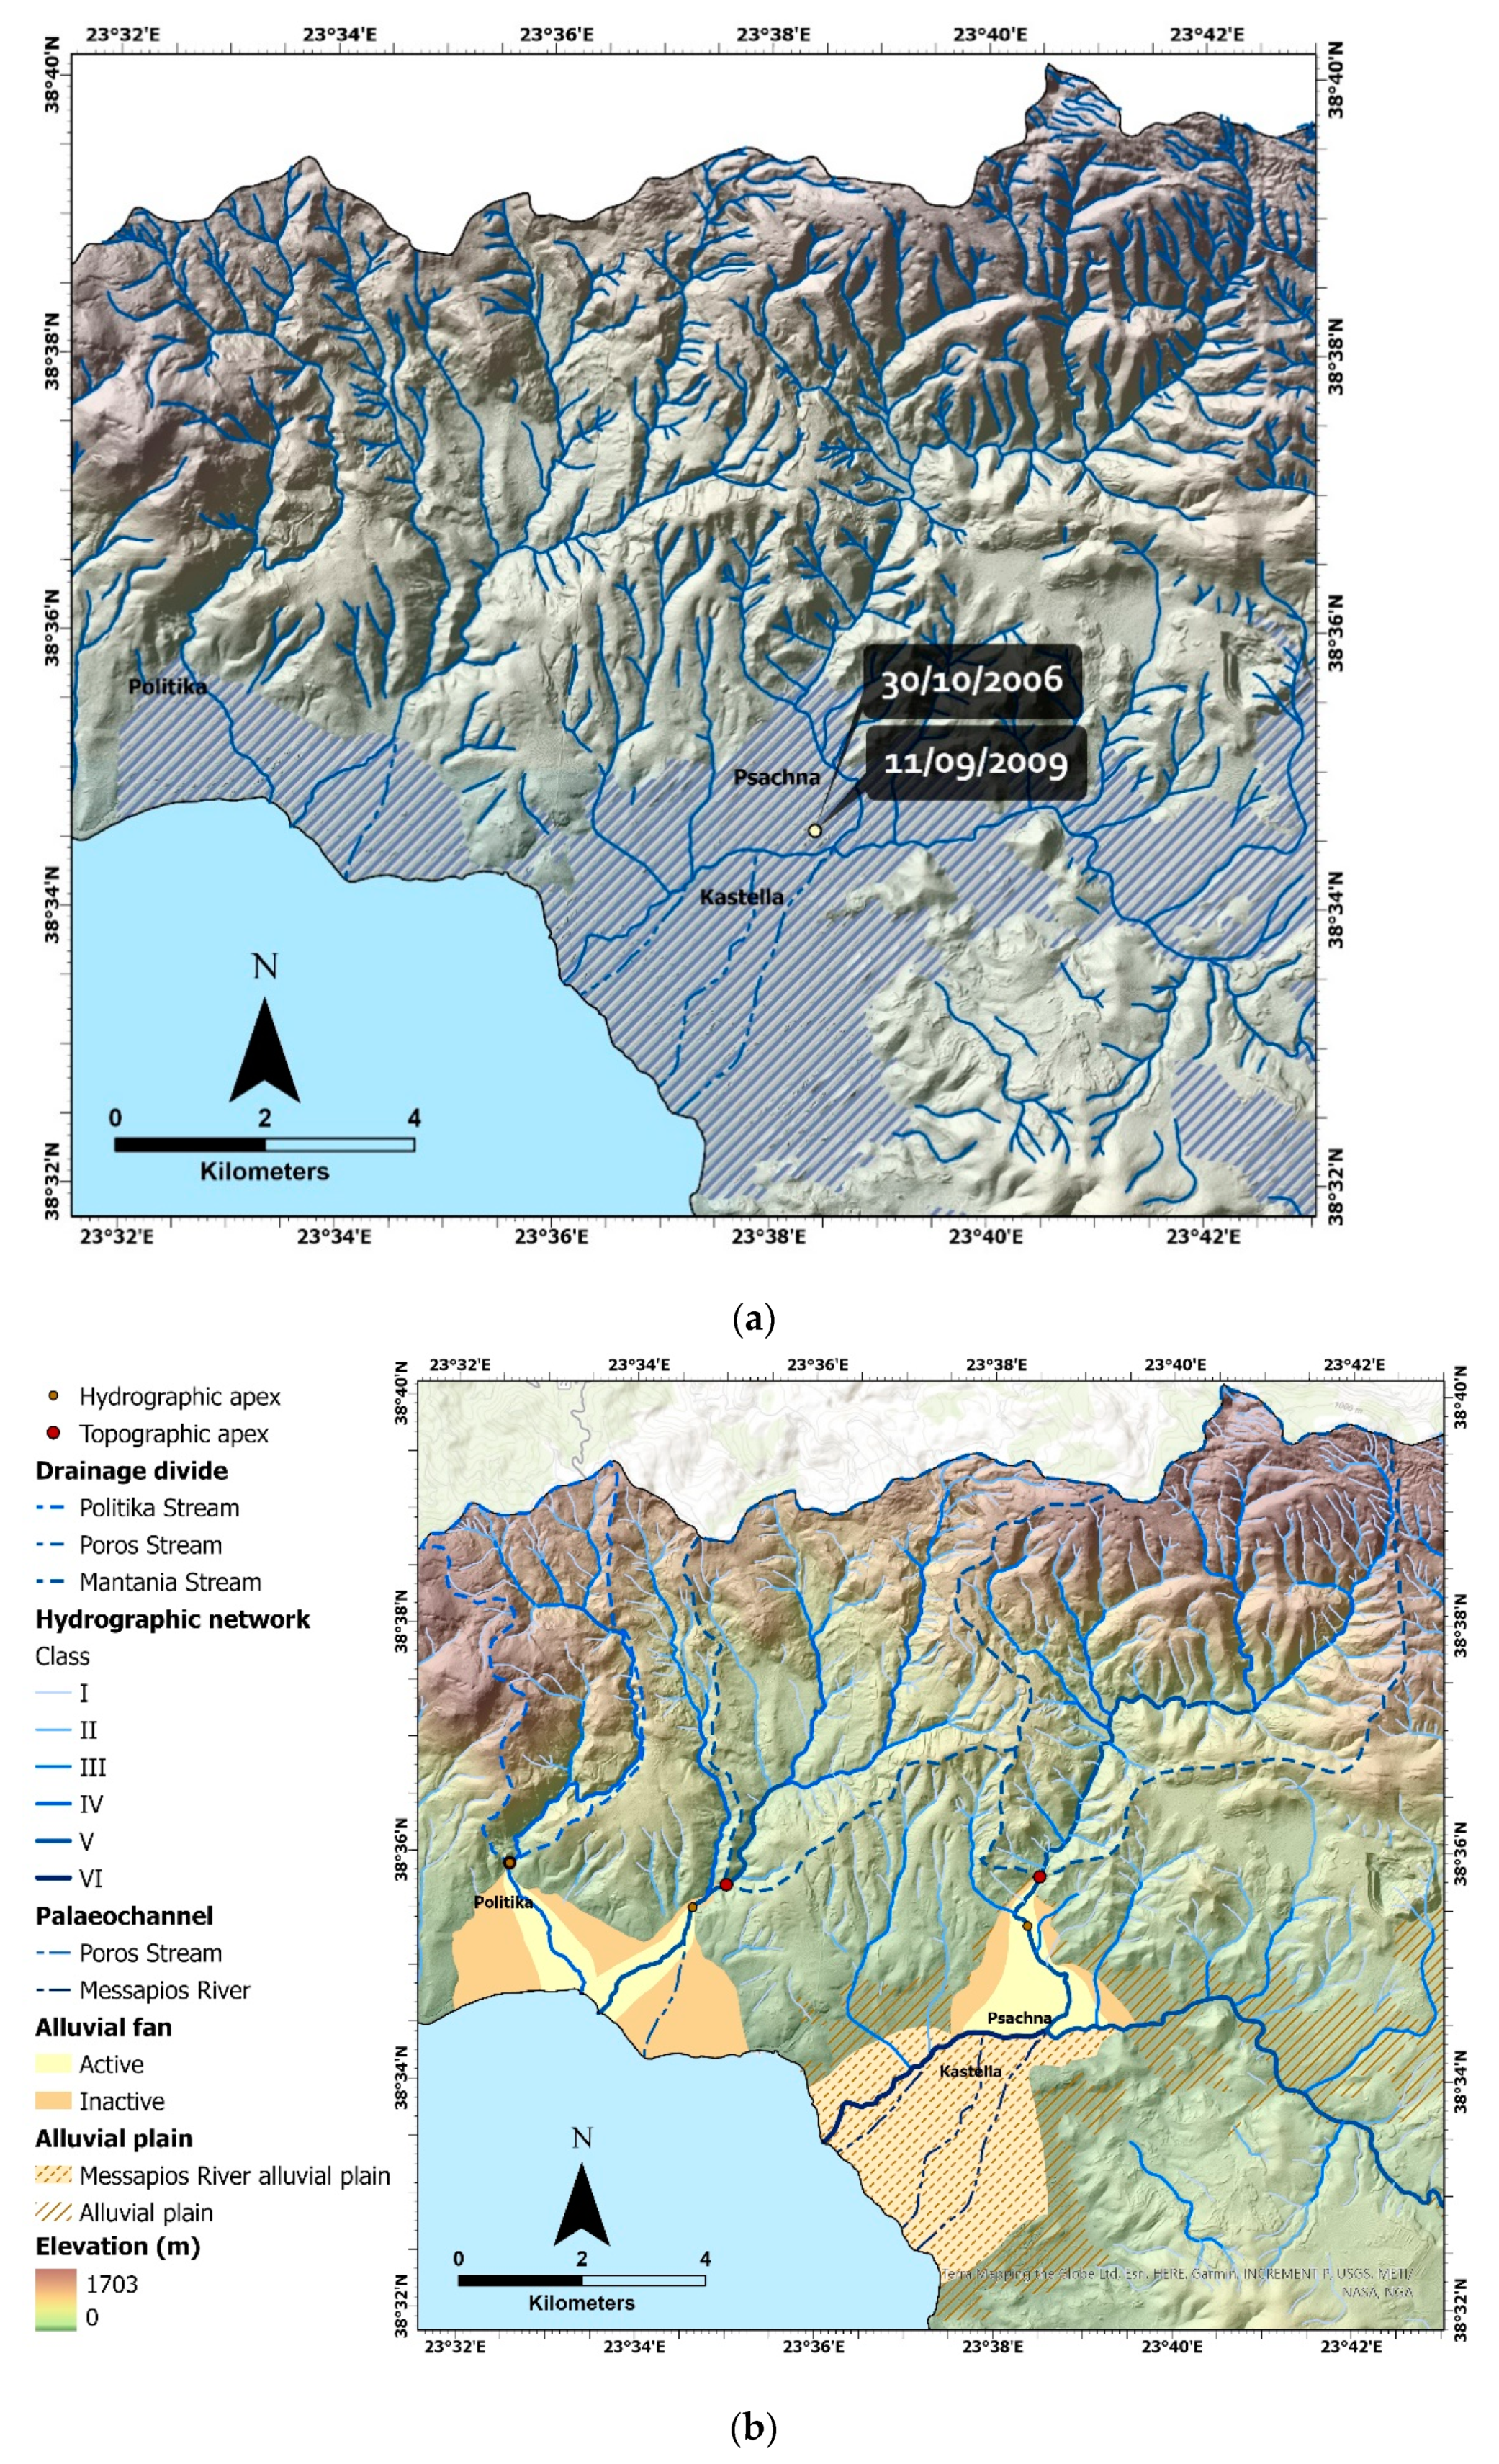
2.1. Historical Floods
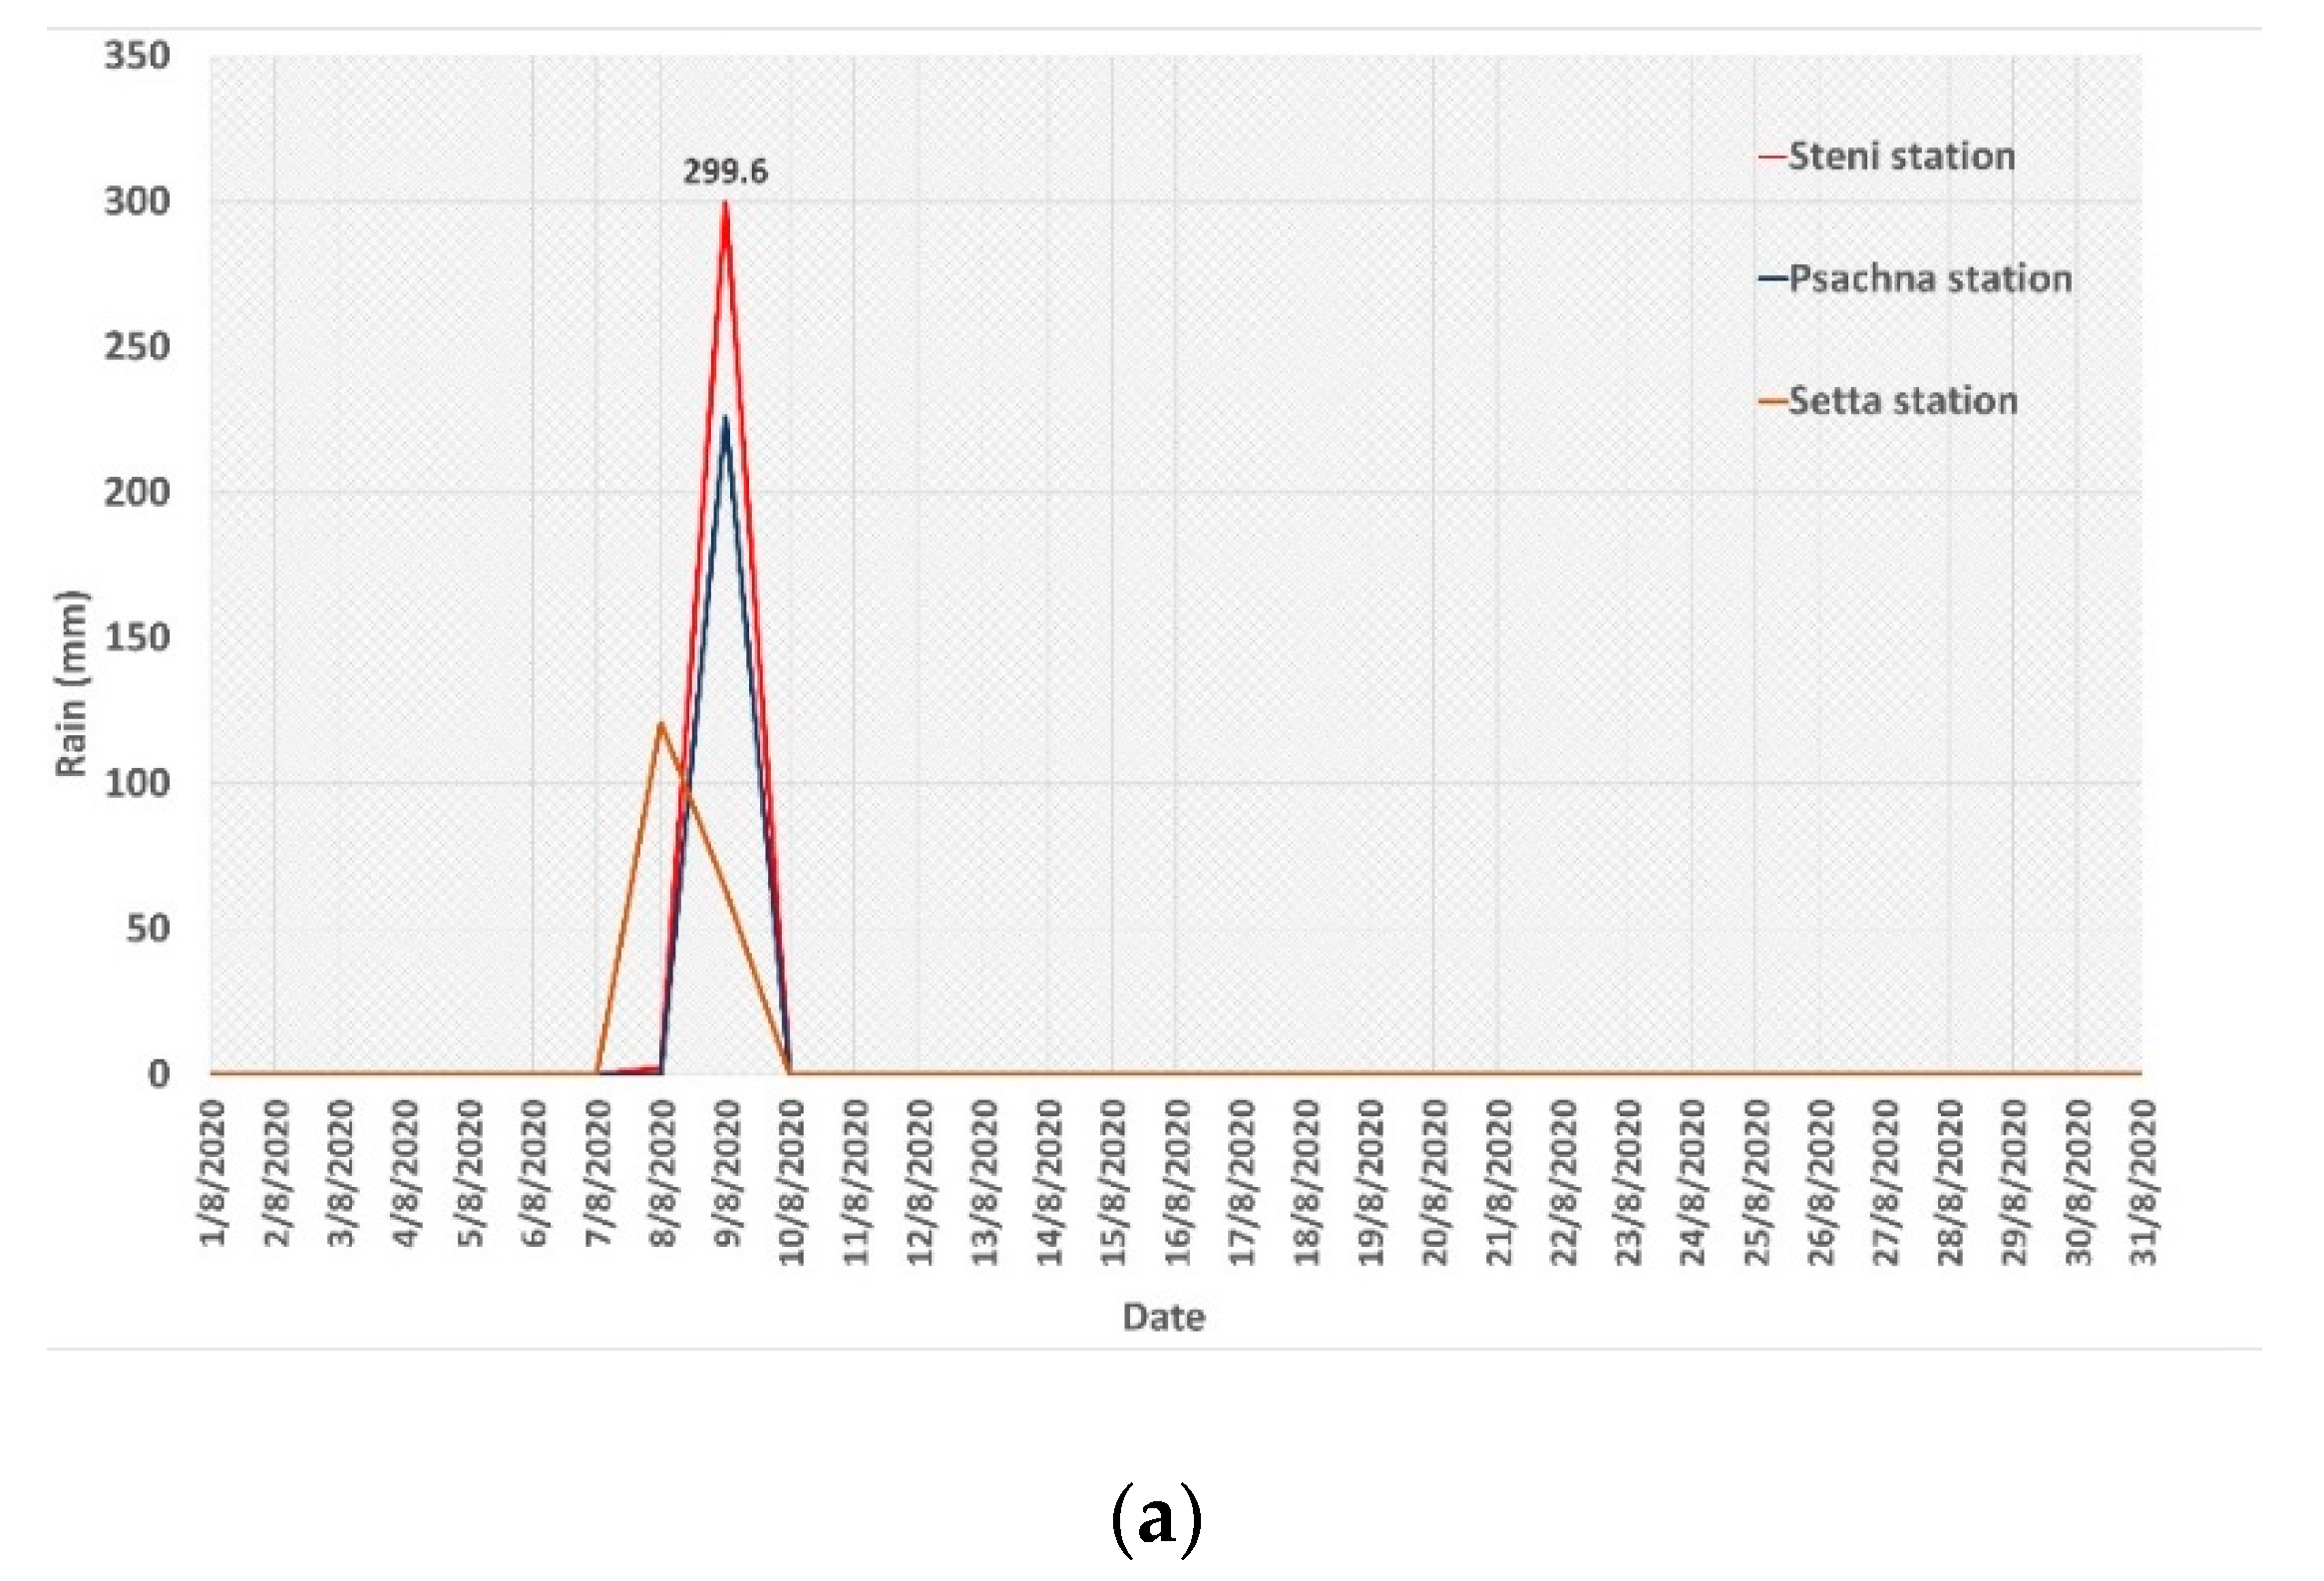
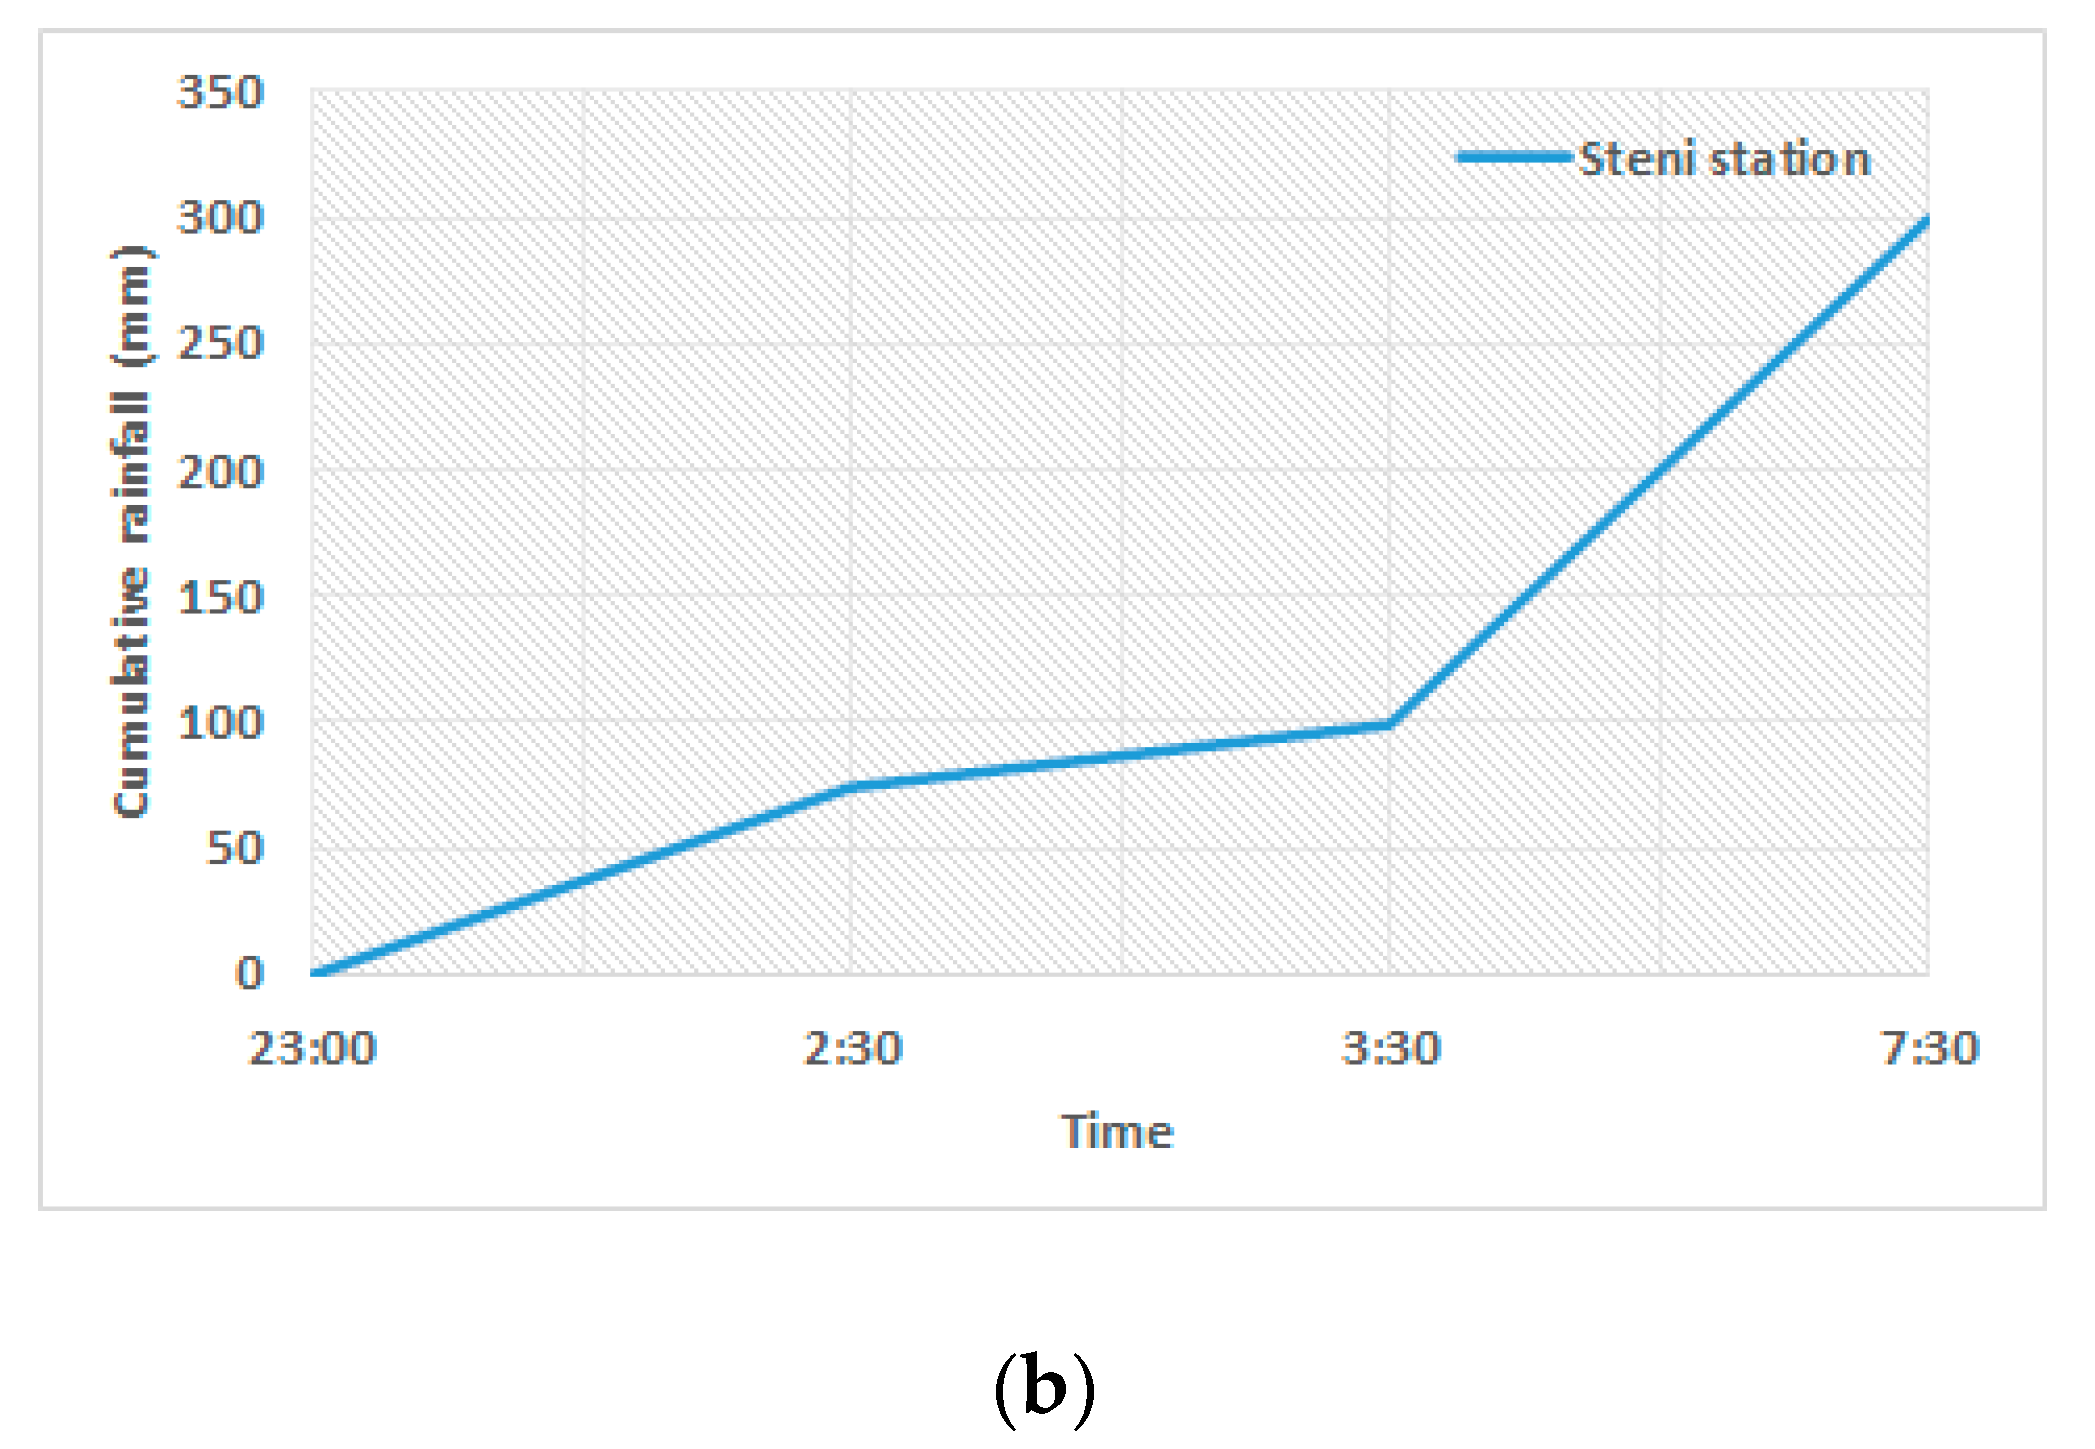
2.2. The 2020 Flood Event
3. Materials and Methods
3.1. Field Survey
- (a)
- In situ measurements and observations regarding the water height level and extent of the most characteristics sites, in the upper part, the urbanized part, and the lower part of the drainage network (i.e., approximately 1.6 km2 at Psachna, and 1.7 km2 at Politika). Maximum water level marks indicating peak discharge were measured at various parts of the flooded area, using a rigid folding meter (8 measurements). High water marks were identified by lines of dried mud on several surfaces, the presence of leaves, limbs and other plant fragments stuck on various places, seed lines, wrack, and debris lines.
- (b)
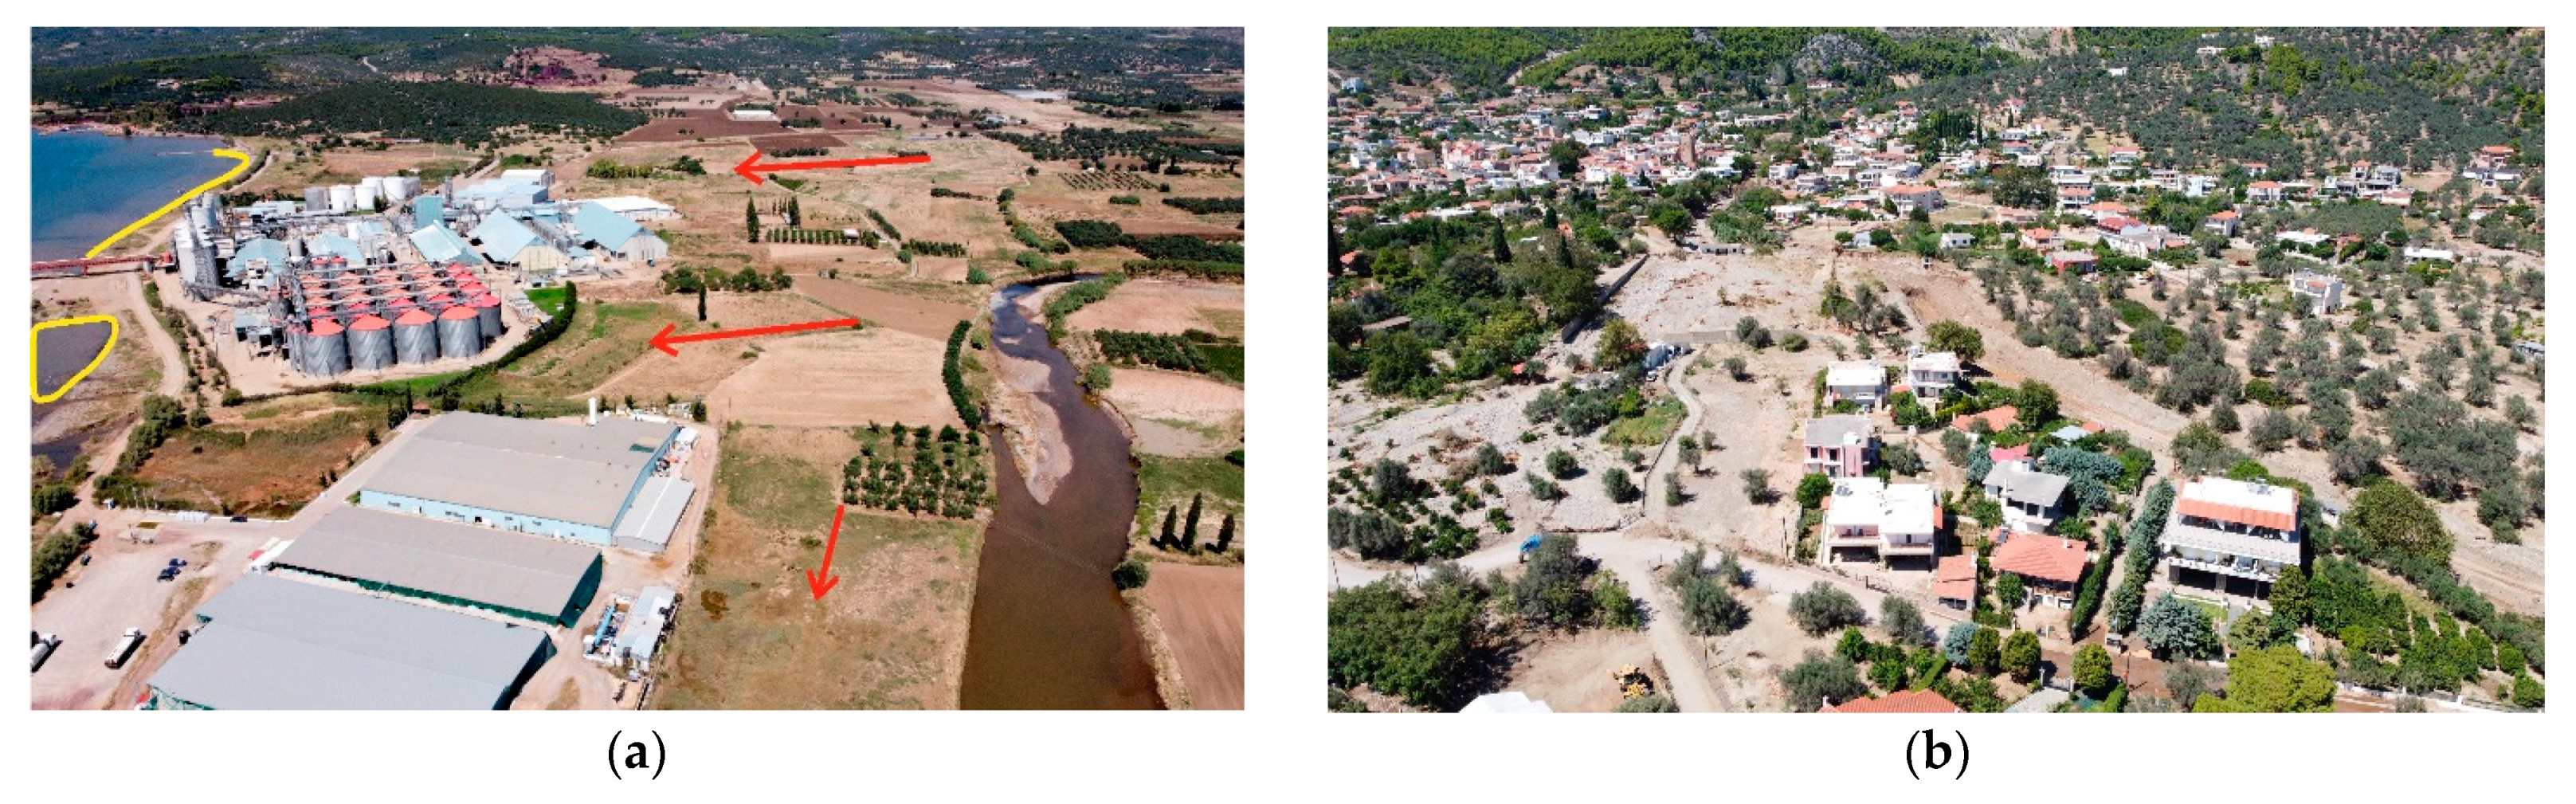
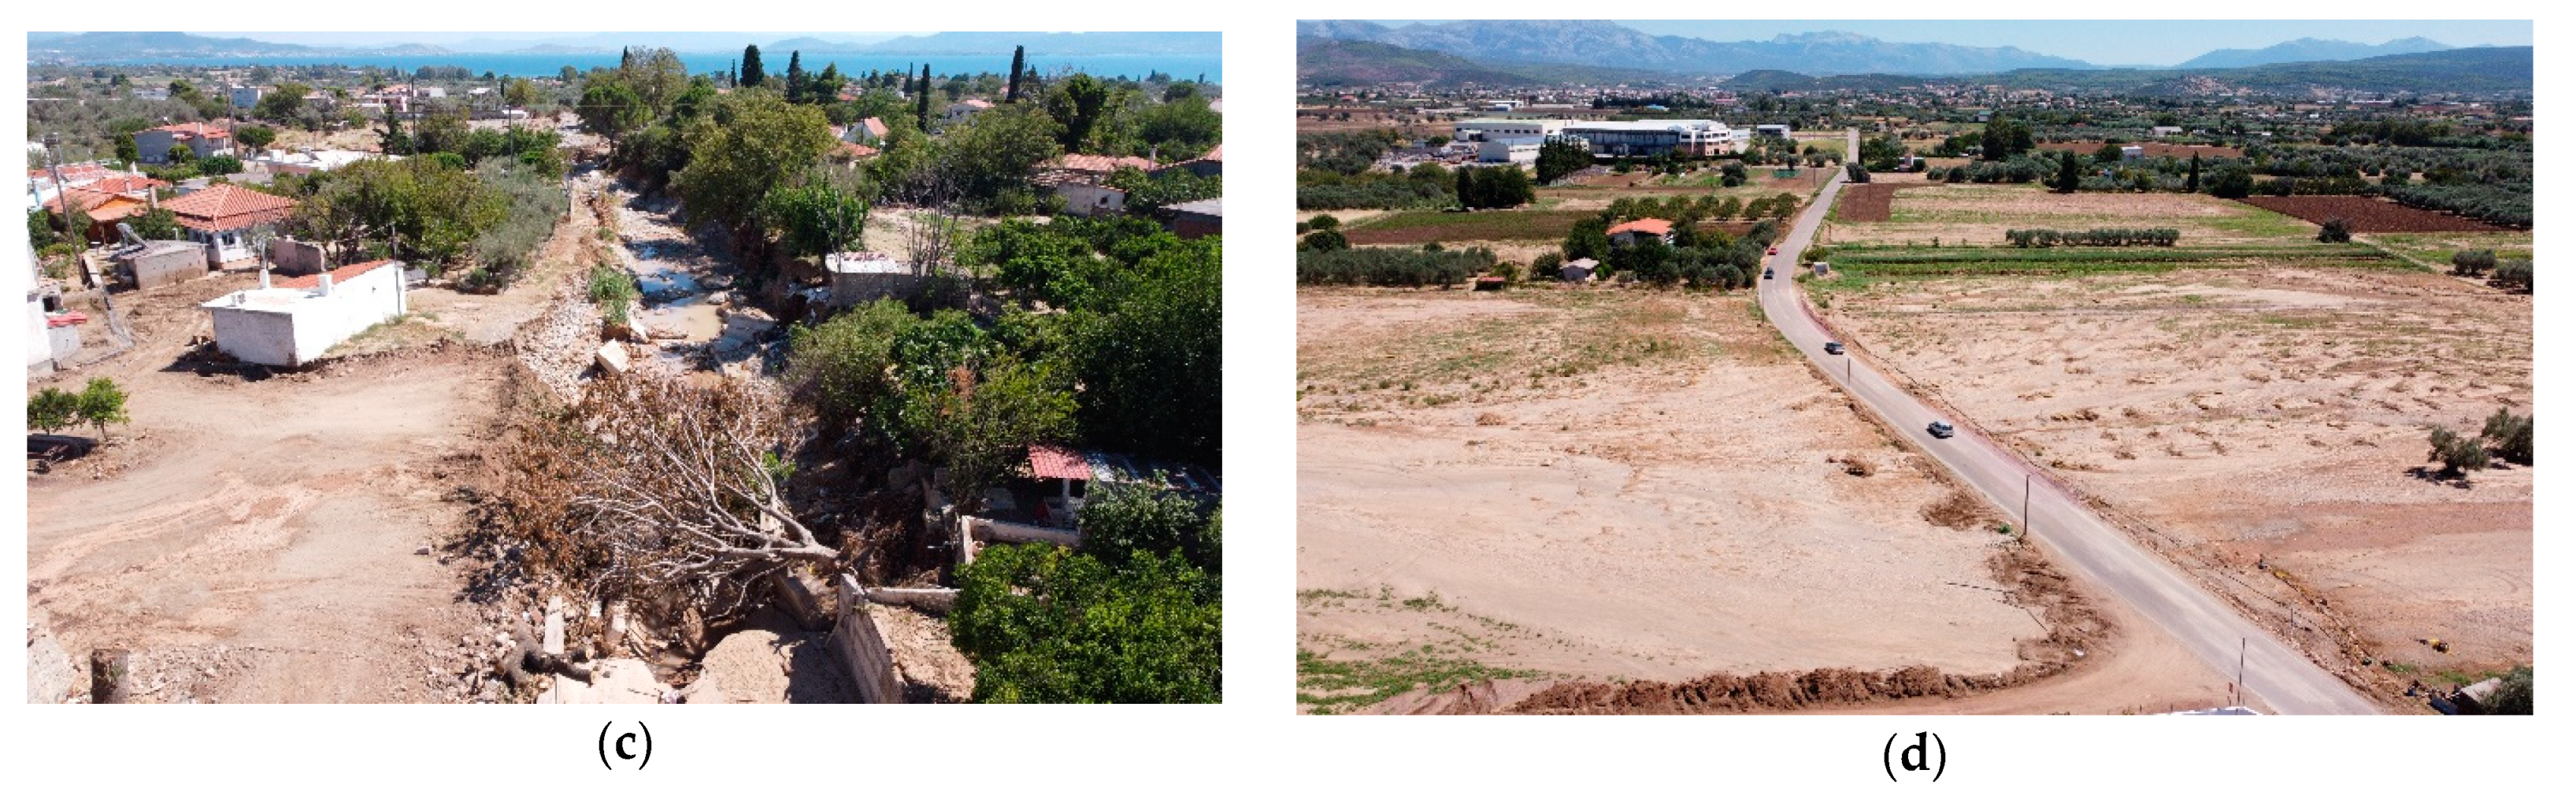
- Qualitative documentation of damages caused by the flash floods, both at human structures and infrastructures and at agricultural areas.
- (c)
- An RTK-GNSS equipment (SPECTRA SP-80) was used, with accuracy 0.2 m, in order to create topographic cross-sections perpendicular to the normal stream flow, in order to determine with accuracy, the topographic apex position, in all studied streams.
- (d)
- Documentation of damages using a commercial U.A.V. (DJI Mavic Mini). Flight elevation ranged between 50–70 m for detailed photos and 90–110 m for panoramic views. The route of the flights was planned in a way so that the areas of interest could be captured, and a sufficient number (80) of photographic and video material could be obtained, so that the flood limit and the impacts of the event could be determined.
3.2. Flash Flood Susceptibility Assessment
4. Results
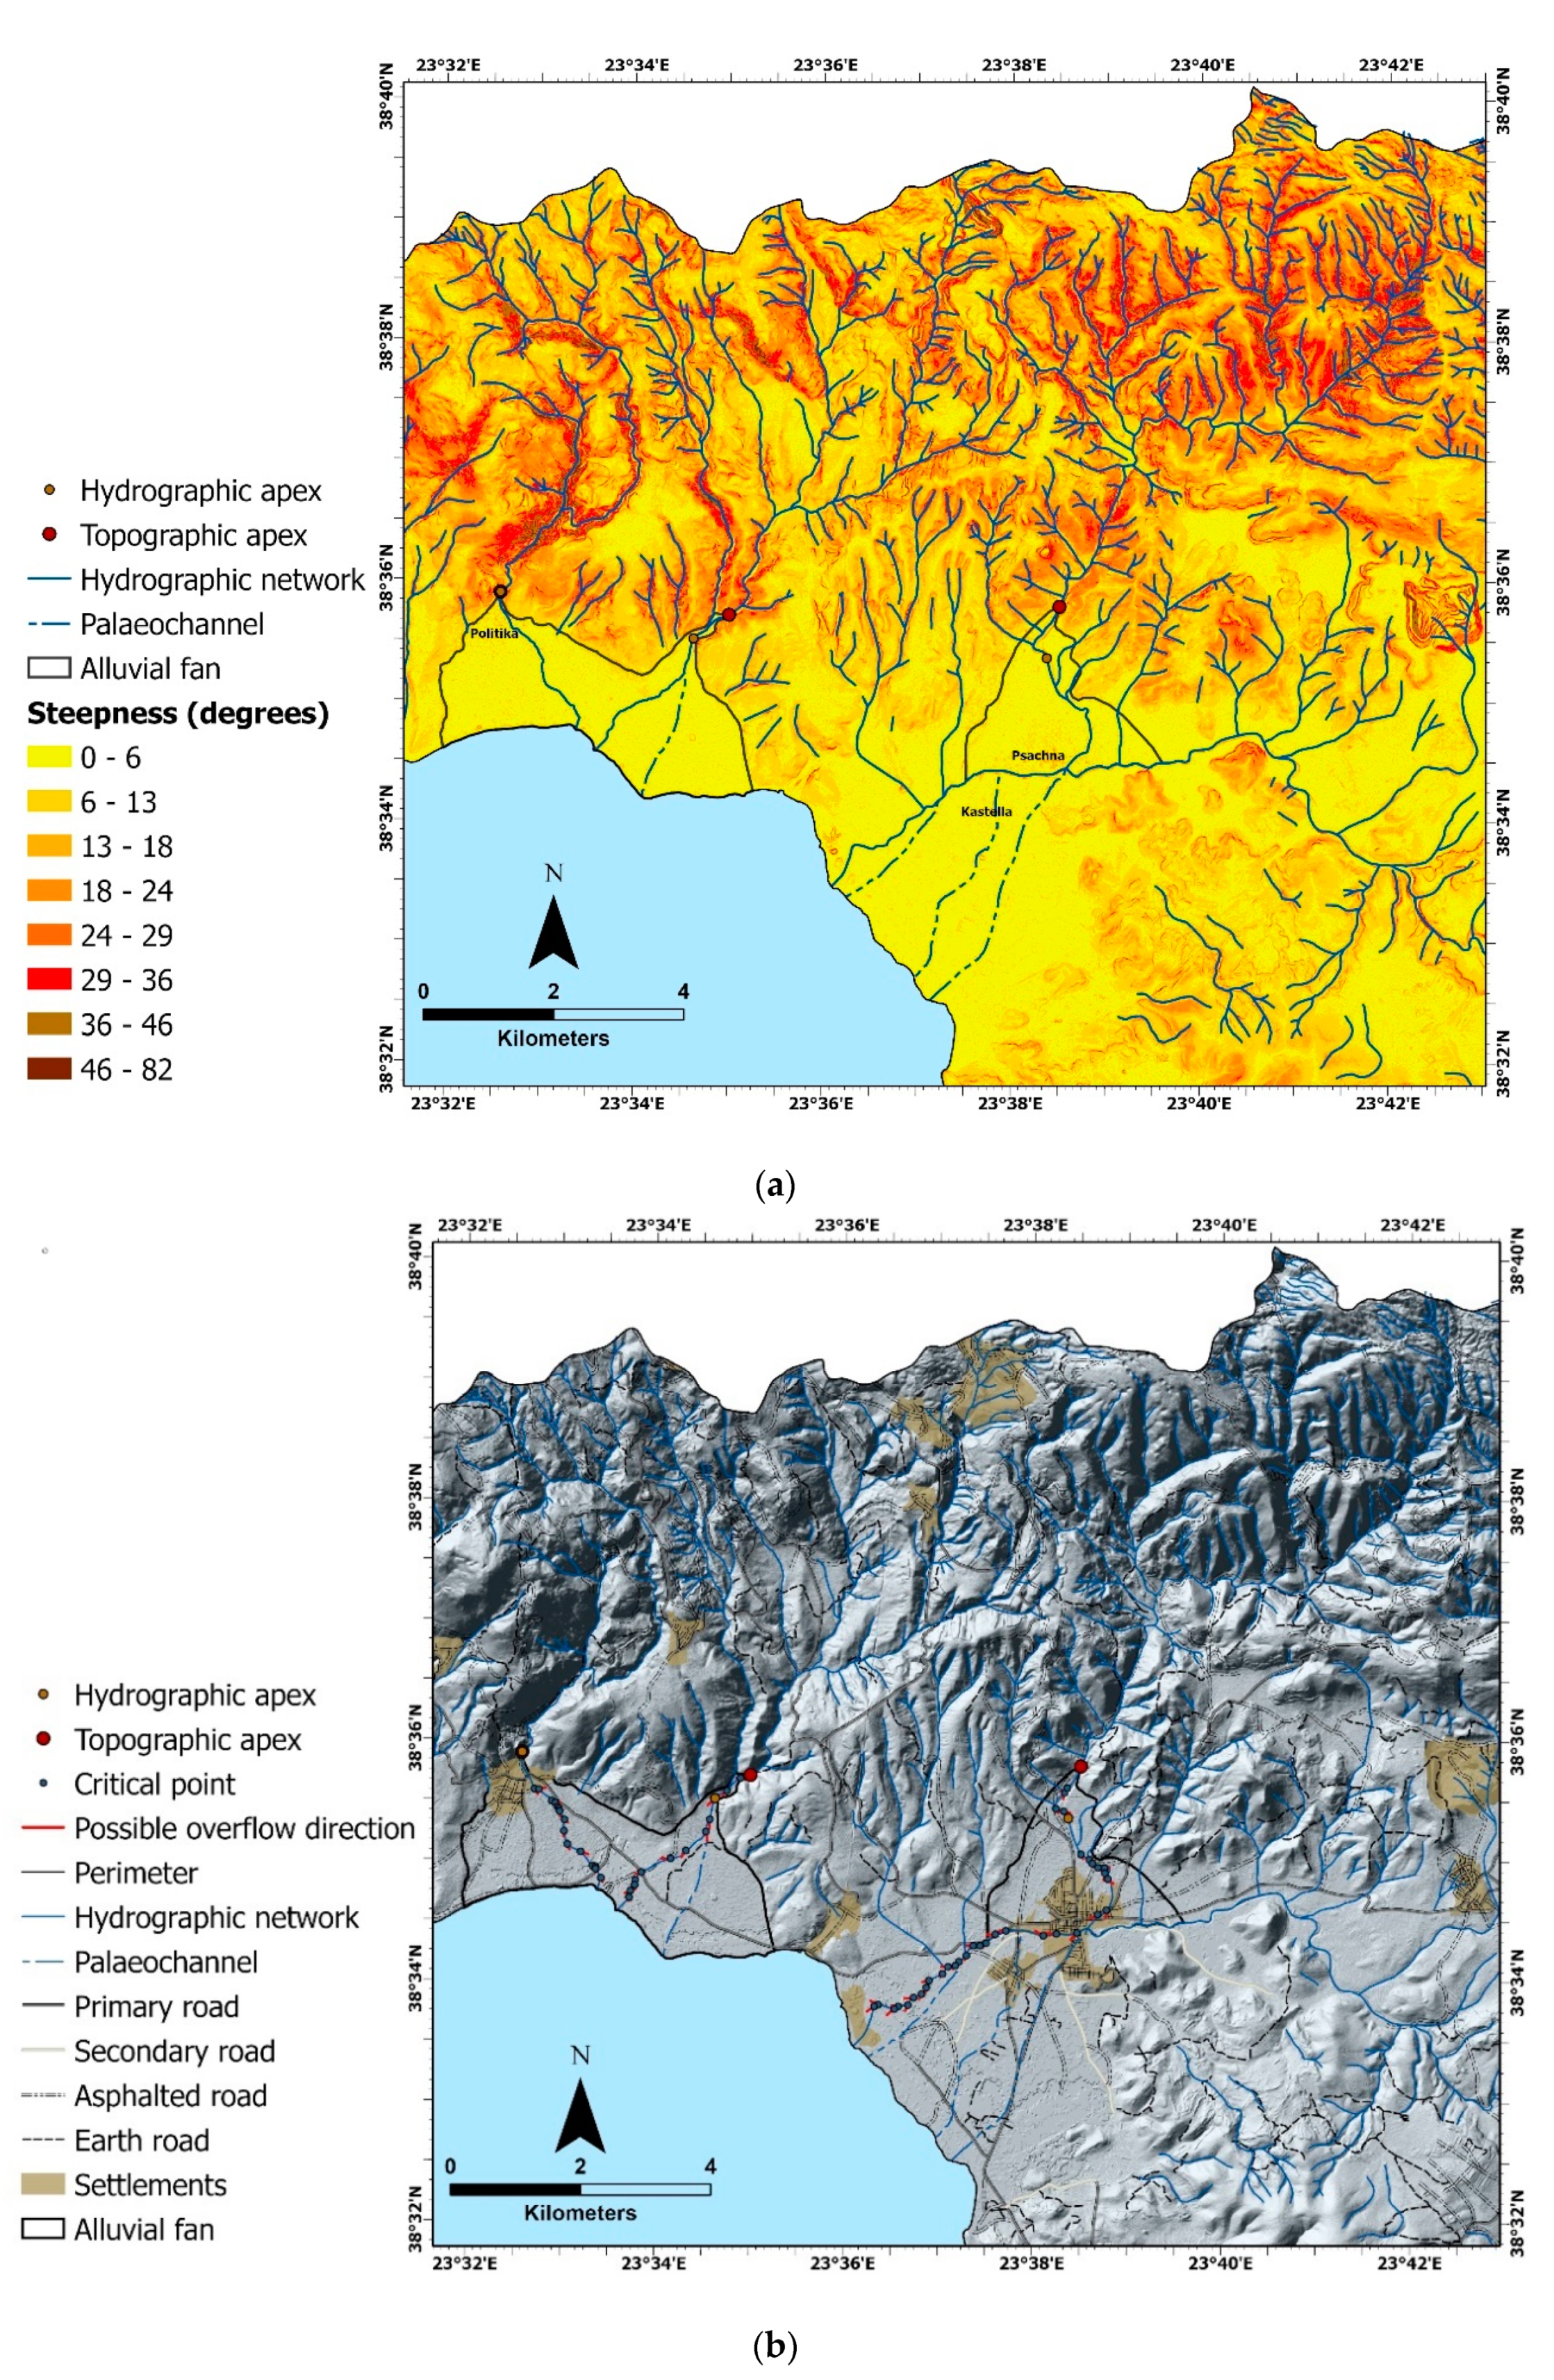
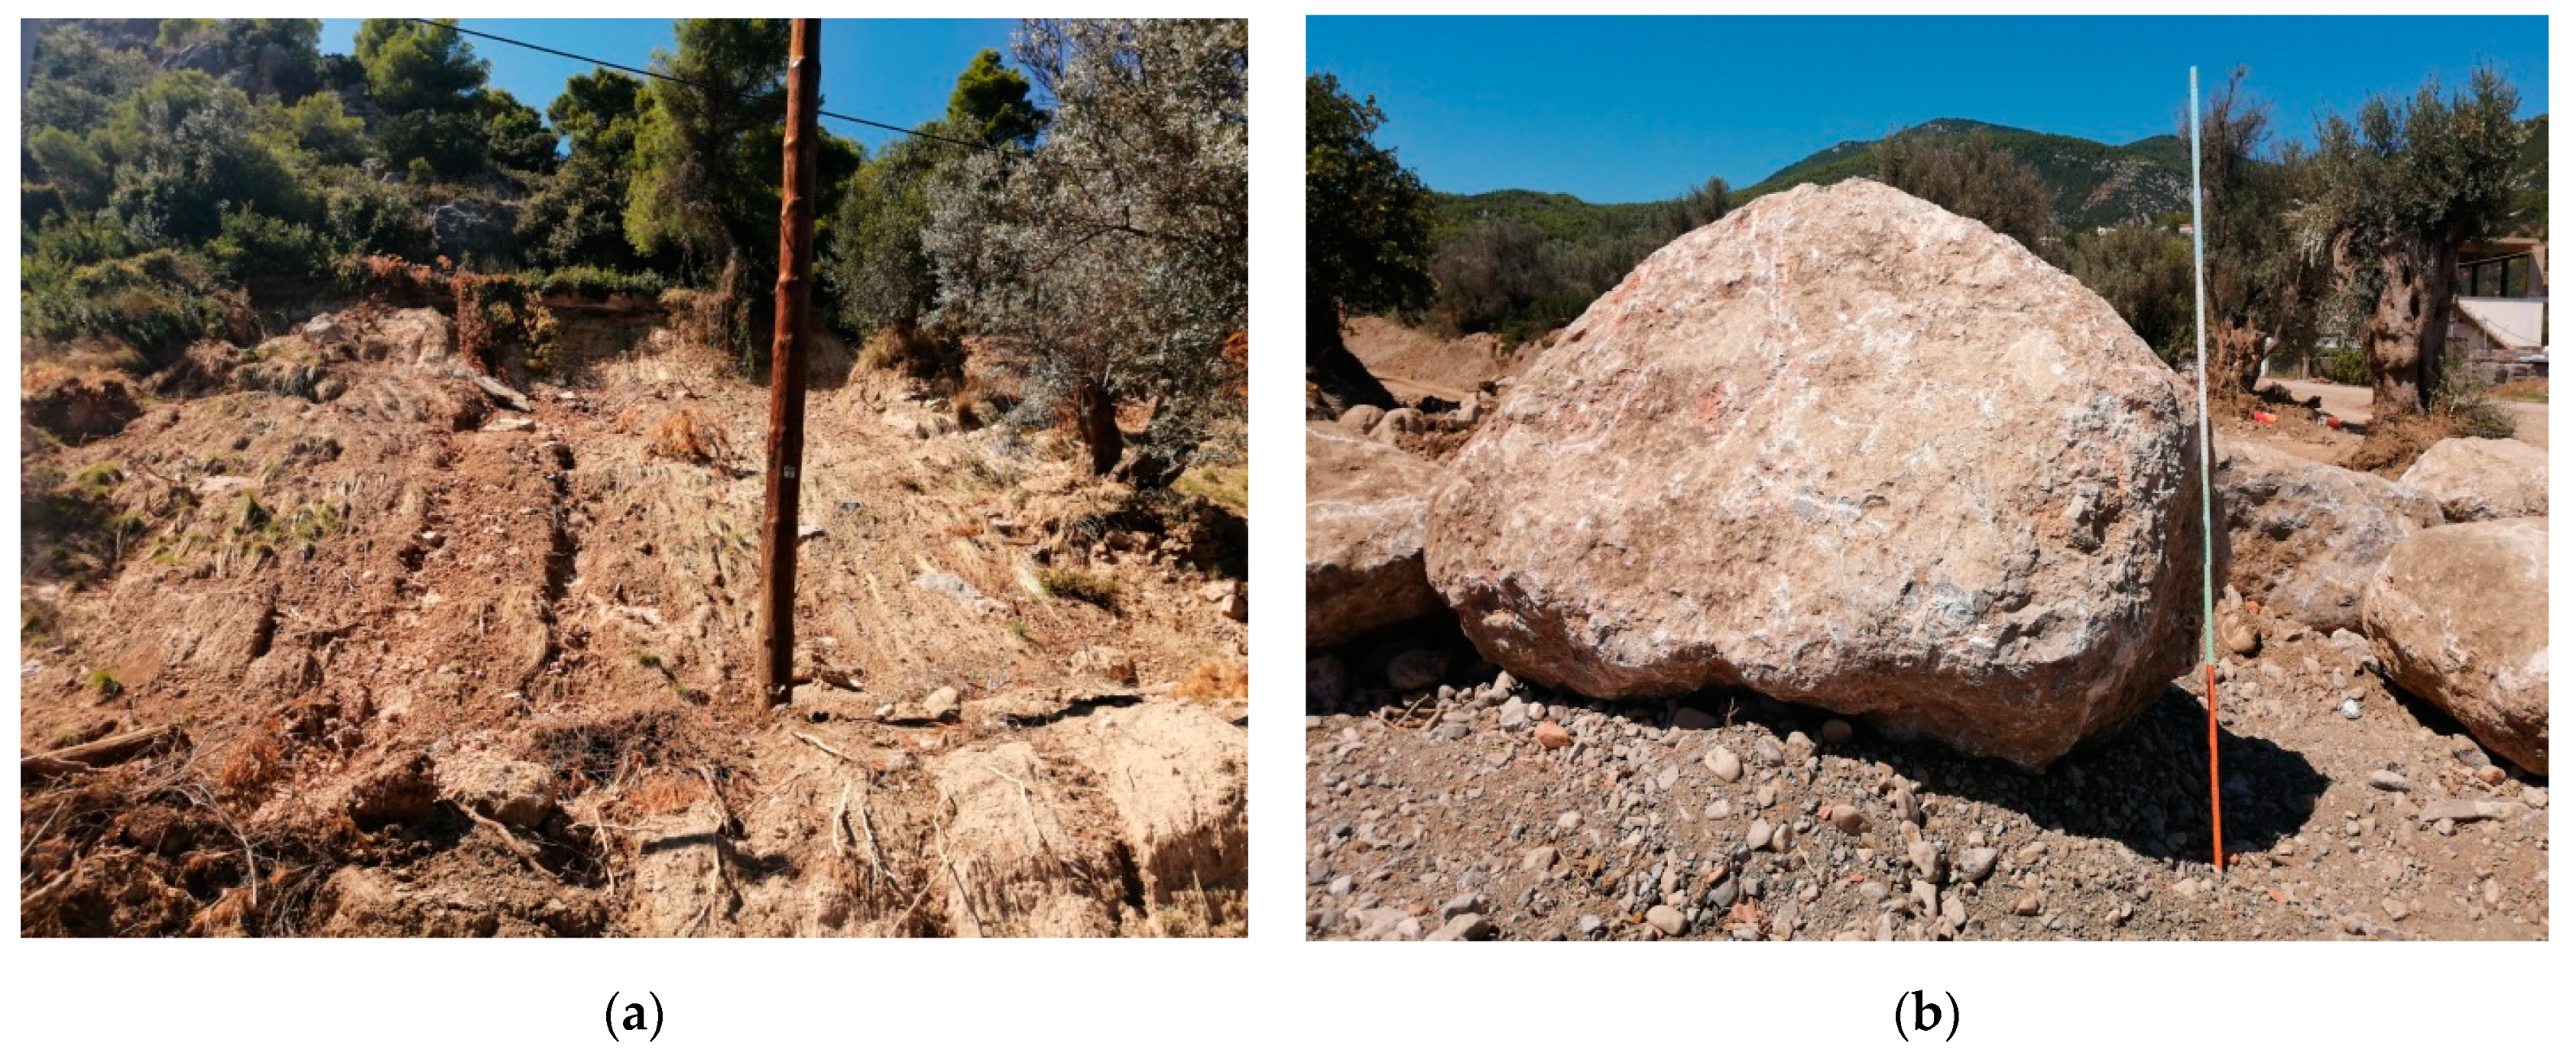
4.1. Geomorphological Observations
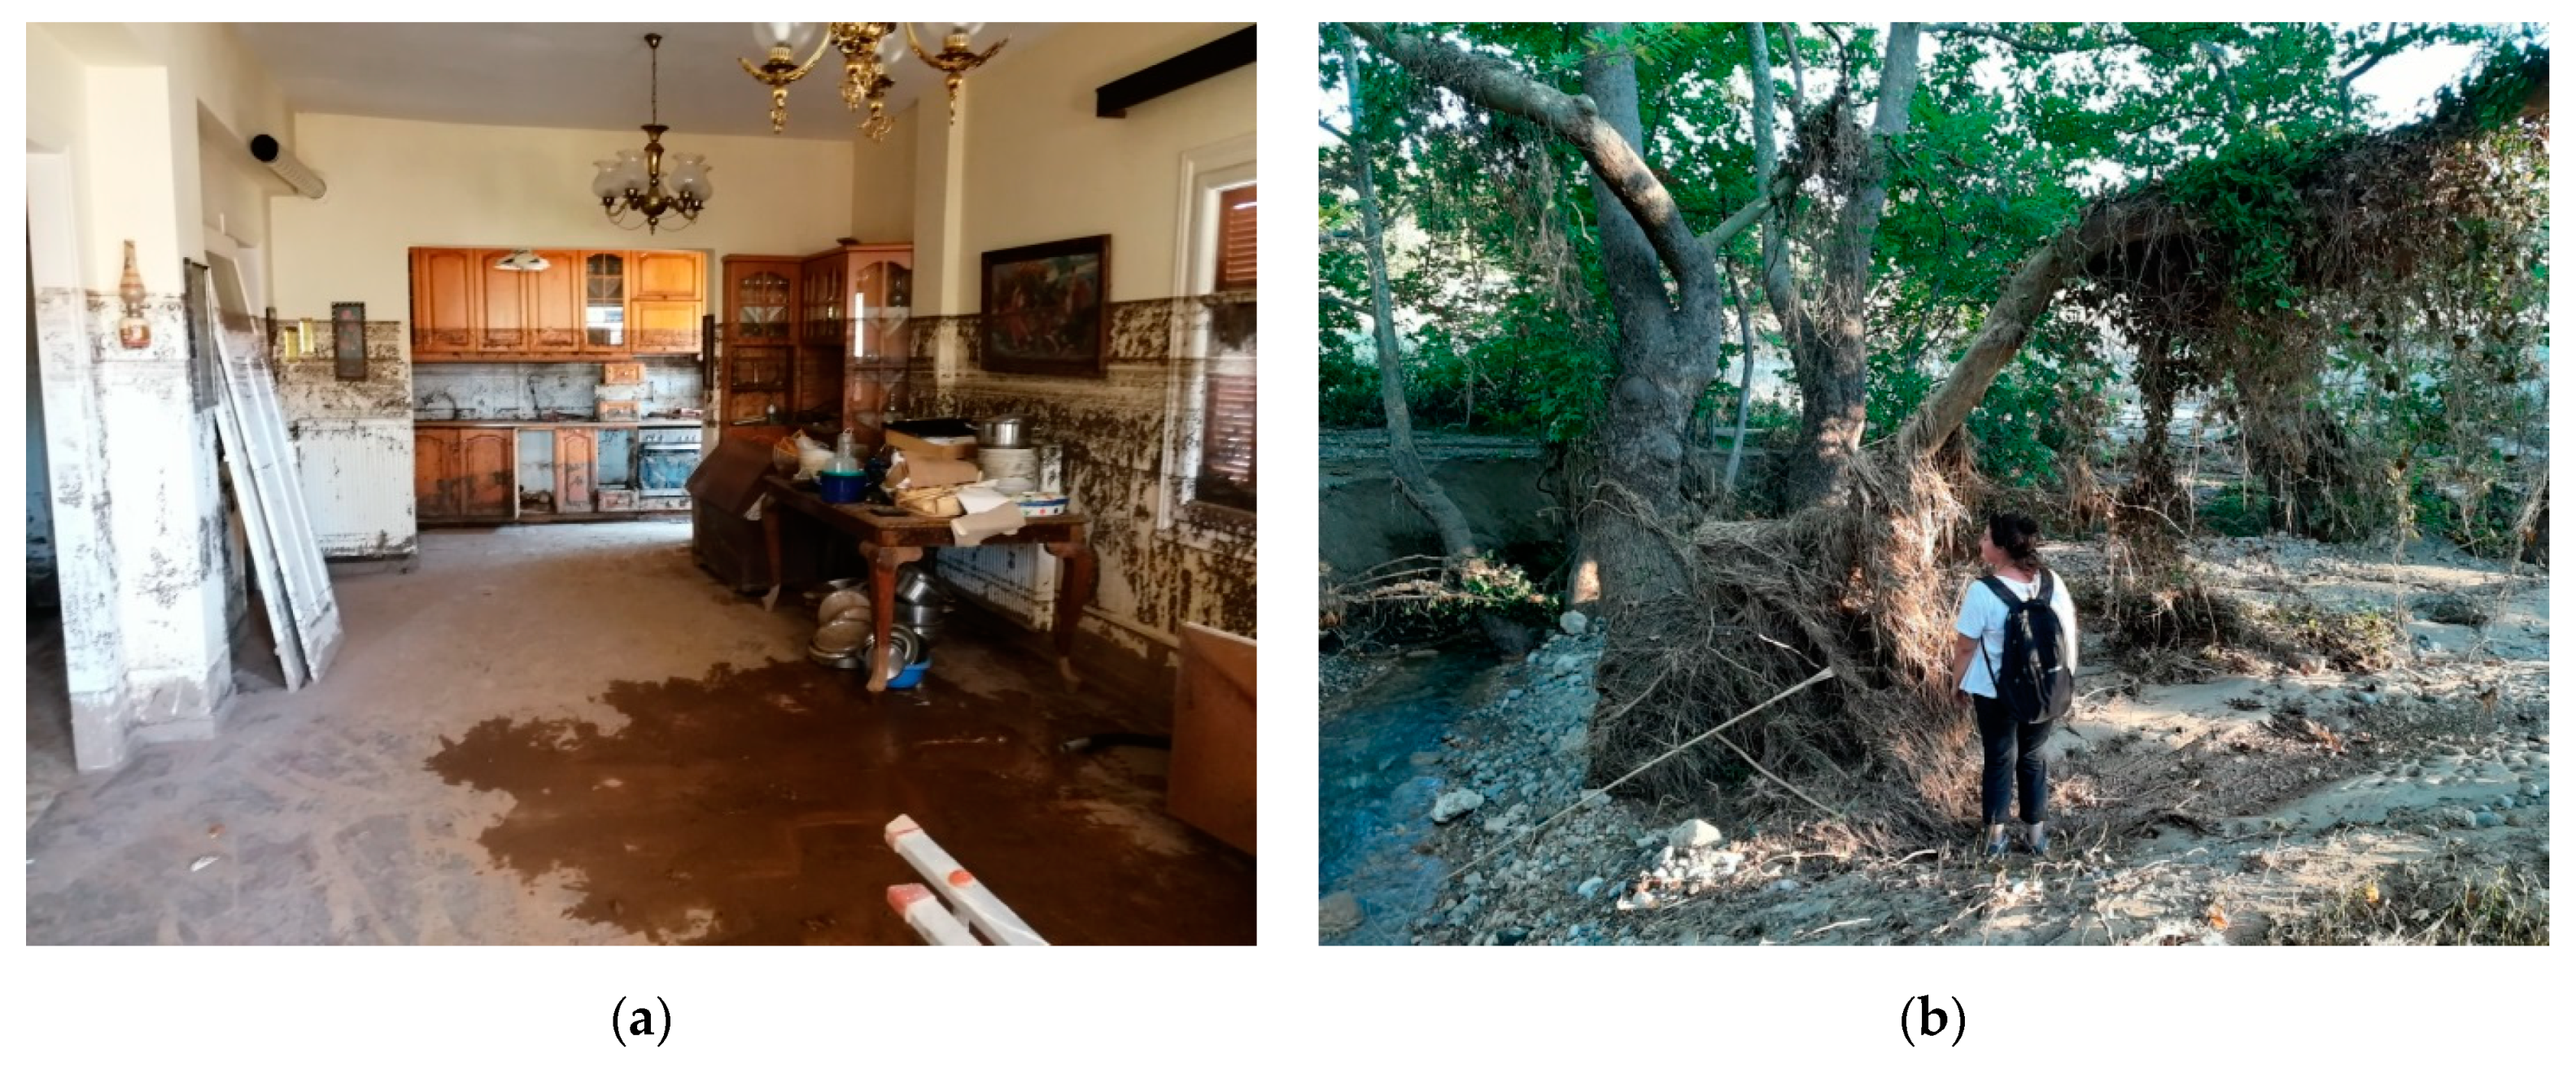
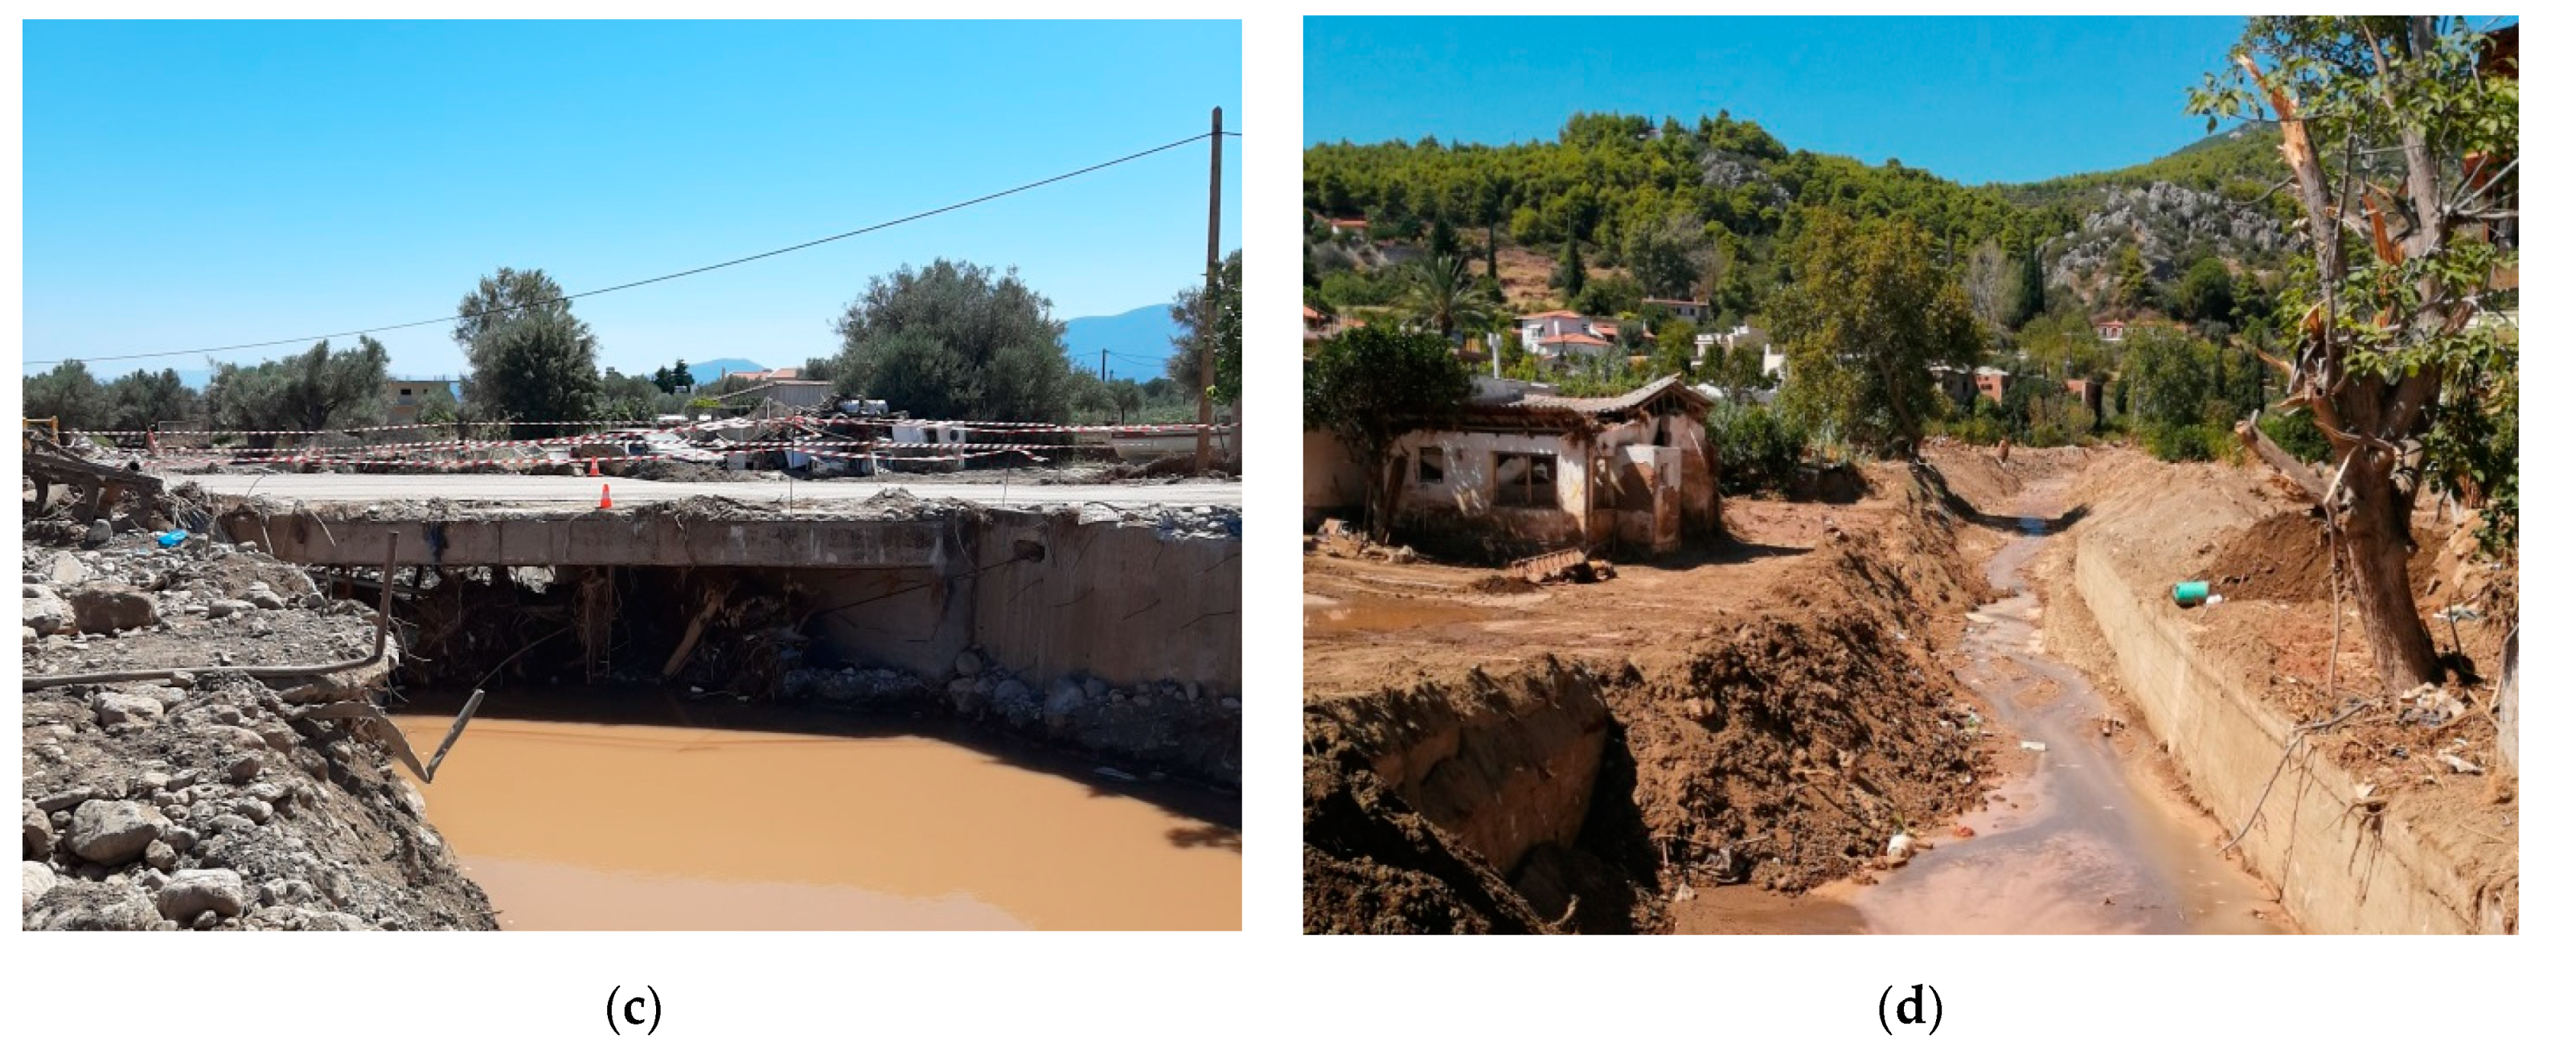
4.2. The 2020 Flood Impacts on the Settlements and Rural Environment
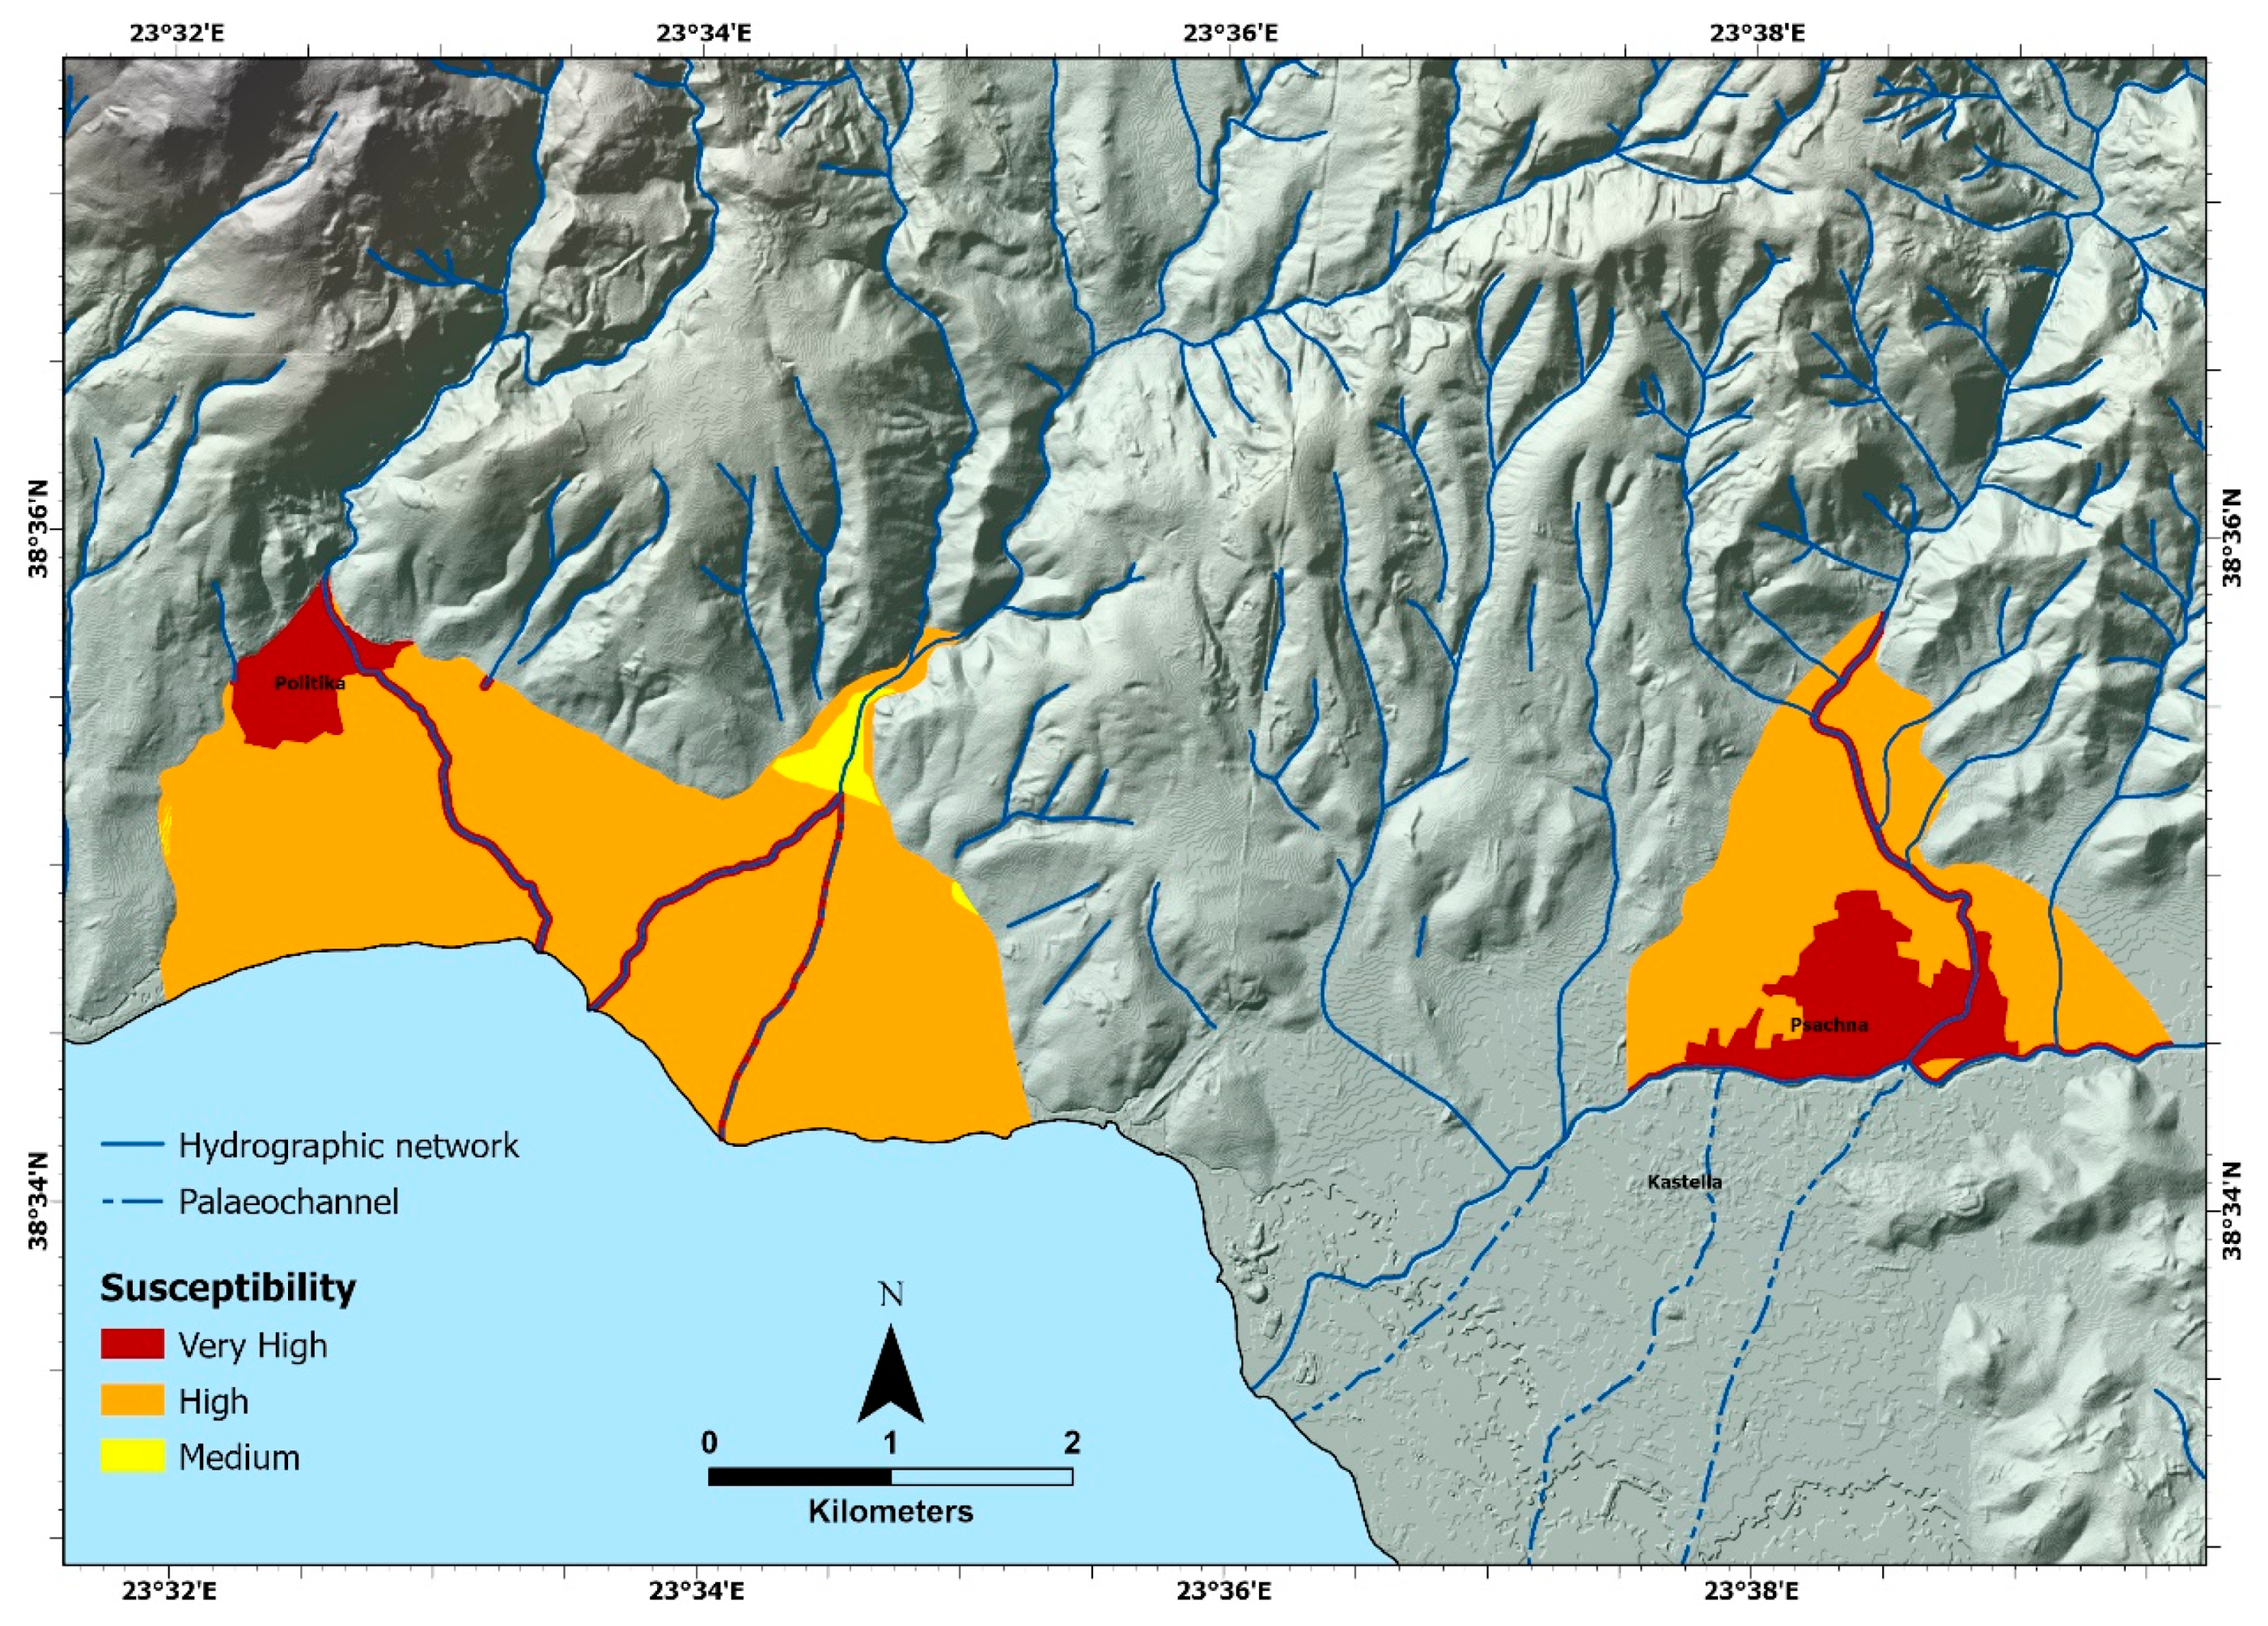
4.3. Alluvial Fan Susceptibility Mapping
5. Discussion
6. Conclusions
Author Contributions
Funding
Institutional Review Board Statement
Informed Consent Statement
Data Availability Statement
Acknowledgments
Conflicts of Interest
References
- IPCC. Managing the Risks of Extreme Events and Disasters to Advance Climate Change Adaptation; Field, C.B., Barros, V., Stocker, T.F., Qin, D., Dokken, D.J., Ebi, K.L., Mastrandrea, M.D., Mach, K.J., Plattner, G.K., Allen, S.K., et al., Eds.; Cambridge University Press: Cambridge, UK, 2012. [Google Scholar]
- European Union Directive. 2007/60/EC of the European Counil and European Parliment of 23 October 2007 on the assessment and management of flood risks. Off. J. Eur. Union 2007, 288, 27–34. [Google Scholar]
- Andjelkovic, I. Guidelines on Non-Structural Measures in Urban Flood Management; International Hydrological Programme (IHP); United Nations Educational: Paris, France, 2001. [Google Scholar]
- Diakakis, M. Flood Hazard Assessment with the Use of Modeling Techniques; National and Kapodistrian University of Athens: Athens, Greece, 2012. [Google Scholar]
- Koutsovili, E.-I. Investigation of Flood Risk in an Intermittent Flow Stream in Pefkochori, Chalkidiki; Aristotle University of Thessaloniki: Thessaloniki, Greece, 2018. [Google Scholar]
- Kundzewicz, Z.W.; Pińskwar, I.; Brakenridge, G.R. Changes in river flood hazard in Europe: A review. Hydrol. Res. 2018, 49, 294–302. [Google Scholar] [CrossRef]
- Sofia, G.; Nikolopoulos, E.I. Floods and rivers: A circular causality perspective. Sci. Rep. 2020, 10, 5175. [Google Scholar] [CrossRef] [PubMed] [Green Version]
- Barredo, J.I. Major flood disasters in Europe: 1950–2005. Nat. Hazards 2007, 42, 125–148. [Google Scholar] [CrossRef]
- Barredo, J.I. Normalised flood losses in Europe: 1970–2006. Nat. Hazards Earth Syst. Sci. 2009, 9, 97–104. [Google Scholar] [CrossRef]
- Ahmadalipour, A.; Moradkhani, H. A data-driven analysis of flash flood hazard, fatalities, and damages over the CONUS during 1996–2017. J. Hydrol. 2019, 578, 124106. [Google Scholar] [CrossRef]
- Flack, D.; Skinner, C.; Hawkness-Smith, L.; O’Donnell, G.; Thompson, R.; Waller, J.; Chen, A.; Moloney, J.; Largeron, C.; Xia, X.; et al. Recommendations for Improving Integration in National End-to-End Flood Forecasting Systems: An Overview of the FFIR (Flooding From Intense Rainfall) Programme. Water 2019, 11, 725. [Google Scholar] [CrossRef] [Green Version]
- Hosseinzadehtalaei, P.; Tabari, H.; Willems, P. Satellite-based data driven quantification of pluvial floods over Europe under future climatic and socioeconomic changes. Sci. Total Environ. 2020, 721, 137688. [Google Scholar] [CrossRef]
- Khajehei, S.; Ahmadalipour, A.; Shao, W.; Moradkhani, H. A Place-based Assessment of Flash Flood Hazard and Vulnerability in the Contiguous United States. Sci. Rep. 2020, 10, 448. [Google Scholar] [CrossRef] [Green Version]
- EEA. Flood Risks and Environmental Vulnerability: Exploring the Synergies between Floodplain Restoration, Water Policies and Thematic Policies; European Environment Agency: Copenhagen, Denmark, 2016. [Google Scholar]
- Wilson, E.M. Engineering Hydrology; Macmillan Education: London, UK, 1990. [Google Scholar]
- Smith, K.; Ward, R. Floods: Physical Processes and Human Impacts; John Wiley & Sons Ltd.: London, UK, 1998; ISBN 978-0-471-95248-0. [Google Scholar]
- Mimikou, M.; Baltas, E. Engineering Hydrology, 4th ed.; Papasotiriou: Athens, Greece, 2006. [Google Scholar]
- Gaume, E.; Borga, M.; Llassat, M.C.; Maouche, S.; Lang, M.; Diakakis, M. Mediterranean extreme floods and flash floods. Mediterr. Reg. Clim. Chang. A Sci. Updat. 2016, 72, 133–144. [Google Scholar]
- Anagnostou, E.N.; Grecu, M.; Anagnostou, M.N. X-band Polarimetric Radar Rainfall Measurements in Keys Area Microphysics Project. J. Atmos. Sci. 2006, 63, 187–203. [Google Scholar] [CrossRef] [Green Version]
- Gaume, E.; Borga, M. Post-flood field investigations in upland catchments after major flash floods: Proposal of a methodology and illustrations. J. Flood Risk Manag. 2008, 1, 175–189. [Google Scholar] [CrossRef]
- Vennari, C.; Parise, M.; Santangelo, N.; Santo, A. A database on flash flood events in Campania, southern Italy, with an evaluation of their spatial and temporal distribution. Nat. Hazards Earth Syst. Sci. 2016, 16, 2485–2500. [Google Scholar] [CrossRef] [Green Version]
- Tamminga, A.D.; Eaton, B.C.; Hugenholtz, C.H. UAS-based remote sensing of fluvial change following an extreme flood event. Earth Surf. Process. Landforms 2015, 40, 1464–1476. [Google Scholar] [CrossRef]
- Smith, M.W.; Carrivick, J.L.; Hooke, J.; Kirkby, M.J. Reconstructing flash flood magnitudes using ‘Structure-from-Motion’: A rapid assessment tool. J. Hydrol. 2014, 519, 1914–1927. [Google Scholar] [CrossRef]
- Baker, V.; Kochel, R.C.; Patton, P.C. Flood Geomorphology; Wiley-Interscience: New York, NY, USA, 1988; ISBN 0-471-62558-2. [Google Scholar]
- Hoyois, P.; Below, R.; Scheuren, J.M.; Guha-Sapir, D. Annual Disaster Statistical Review: Numbers and Trends 2006; Center for Research on the Epidemiology of Disasters: Brussels, Belgium, 2007. [Google Scholar]
- CRED. Europe-Disaster Statistics Region Profile for Natural Disasters from 1980–2008 Emergency Events Database EM-DAT: The OFDA/CRED International Disaster Database; Center for Research on the Epidemiology of Disasters: Brussels, Belgium, 2008. [Google Scholar]
- Paprotny, D.; Morales-Nápoles, O.; Jonkman, S.N. HANZE: A pan-European database of exposure to natural hazards and damaging historical floods since 1870. Earth Syst. Sci. Data 2018, 10, 565–581. [Google Scholar] [CrossRef] [Green Version]
- Santangelo, N. Geomorphological Contribution to Flash Floods Hazard Evaluation: Examples from Campania (Southern Italy). J. Environ. Sci. Allied Res. 2019, 2, 44–50. [Google Scholar] [CrossRef]
- CRED. The Human Coast of Weather-Related Disasters 1995–2015; Center for Research on the Epidemiology of Disasters: Brussels, Belgium, 2015. [Google Scholar]
- Kundzewicz, Z.W.; Kanae, S.; Seneviratne, S.I.; Handmer, J.; Nicholls, N.; Peduzzi, P.; Mechler, R.; Bouwer, L.M.; Arnell, N.; Mach, K.; et al. Flood risk and climate change: Global and regional perspectives. Hydrol. Sci. J. 2014, 59, 1–28. [Google Scholar] [CrossRef] [Green Version]
- Kron, W. Changing Flood Risk–A Re-insurer’s Viewpoint. In Changes in Flood Risk in Europe; Kundzewicz, Z.W., Ed.; CRC Press: London, UK, 2012; pp. 459–490. ISBN 9780203098097. [Google Scholar]
- Tasoulas, G. Natural and Man-Made Disasters: The Case of Floods; University of Thessaly: Thessaly, Greece, 2020. [Google Scholar]
- Kundzewicz, Z.W.; Pińskwar, I.; Brakenridge, G.R. Large floods in Europe, 1985–2009. Hydrol. Sci. J. 2013, 58, 1–7. [Google Scholar] [CrossRef]
- Valkanou, K.; Karymbalis, E.; Papanastassiou, D.; Soldati, M.; Chalkias, C.; Gaki-Papanastassiou, K. Μorphometric Analysis for the Assessment of Relative Tectonic Activity in Evia Island, Greece. Geosciences 2020, 10, 264. [Google Scholar] [CrossRef]
- Antoniadis, Z. Scale Development for Flash Flood Impacts; National and Kapodistrian University of Athens: Athens, Greece, 2016. [Google Scholar]
- Sideris, N.; Papageorgiou-Torpidi, N.; Skokou, T.; Papanikolaou, G.; Foteinopoulos, B. Special Secretariat for Water. Available online: https://floods.ypeka.gr/index.php?option=com_content&view=article&id=15&Itemid=507 (accessed on 30 December 2020).
- Lekkas, E.; Spyrou, N.-I.; Kotsi, E.; Filis, C.; Diakakis, M.; Lagouvardos, K.; Cartalis, C.; Kotroni, V.; Dafis, S.; Vassilakis, E.; et al. The August 9, 2020 Evia (Central Greece) Flood; Newsletter of Environmental; Disaster and Crises Management Strategies: Athens, Greece, 2020. [Google Scholar]
- Blair, T.C.; McPherson, J.G. Processes and Forms of Alluvial Fans. In Geomorphology of Desert Environments; Parsons, A.J., Ed.; Springer Netherlands: Dordrecht, The Netherlands, 2009; pp. 413–467. [Google Scholar]
- Hooke, R.L. Processes on arid-region alluvial fans. J. Geol. 1967, 75, 438–460. [Google Scholar] [CrossRef]
- Santangelo, N.; Santo, A.; Di Crescenzo, G.; Foscari, G.; Liuzza, V.; Sciarrotta, S.; Scorpio, V. Flood susceptibility assessment in a highly urbanized alluvial fan: The case study of Sala Consilina (southern Italy). Nat. Hazards Earth Syst. Sci. 2011, 11, 2765–2780. [Google Scholar] [CrossRef] [Green Version]
- Santo, A.; Santangelo, N.; Forte, G.; De Falco, M. Post flash flood survey: The 14th and 15th October 2015 event in the Paupisi-Solopaca area (Southern Italy). J. Maps 2017, 13, 19–25. [Google Scholar] [CrossRef] [Green Version]
- de Roo, A.P.J.; Gouweleeuw, B.; Thielen, J.; Bartholmes, J.; Bongioannini-Cerlini, P.; Todini, E.; Bates, P.D.; Horritt, M.; Hunter, N.; Beven, K.; et al. Development of a European flood forecasting system. Int. J. River Basin Manag. 2003, 1, 49–59. [Google Scholar] [CrossRef]
- Robinson, M.; Cognard-Plancq, A.L.; Cosandey, C.; David, J.; Durand, P.; Führer, H.W.; Hall, R.; Hendriques, M.O.; Marc, V.; McCarthy, R.; et al. Studies of the impact of forests on peak flows and baseflows: A European perspective. For. Ecol. Manag. 2003, 186, 85–97. [Google Scholar] [CrossRef]
- Lasda, O.; Dikou, A.; Papapanagiotou, E. Flash flooding in Attika, Greece: Climatic change or urbanization? Ambio 2010, 39, 608–611. [Google Scholar] [CrossRef] [Green Version]
- Tarolli, P.; Borga, M.; Morin, E.; Delrieu, G. Analysis of flash flood regimes in the North-Western and South-Eastern Mediterranean regions. Nat. Hazards Earth Syst. Sci. 2012, 12, 1255–1265. [Google Scholar] [CrossRef] [Green Version]
- Tramblay, Y.; Mimeau, L.; Neppel, L.; Vinet, F.; Sauquet, E. Detection and attribution of flood trends in Mediterranean basins. Hydrol. Earth Syst. Sci. 2019, 23, 4419–4431. [Google Scholar] [CrossRef] [Green Version]
- Amponsah, W.; Ayral, P.-A.; Boudevillain, B.; Bouvier, C.; Braud, I.; Brunet, P.; Delrieu, G.; Didon-Lescot, J.-F.; Gaume, E.; Lebouc, L.; et al. Integrated high-resolution dataset of high-intensity European and Mediterranean flash floods. Earth Syst. Sci. Data 2018, 10, 1783–1794. [Google Scholar] [CrossRef] [Green Version]
- Llasat, M.C.; Llasat-Botija, M.; Prat, M.A.; Porcú, F.; Price, C.; Mugnai, A.; Lagouvardos, K.; Kotroni, V.; Katsanos, D.; Michaelides, S.; et al. High-impact floods and flash floods in Mediterranean countries: The FLASH preliminary database. Adv. Geosci. 2010, 23, 47–55. [Google Scholar] [CrossRef] [Green Version]
- Geijzendorffer, I.R.; Galewski, T.; Guelmami, A.; Perennou, C.; Popoff, N.; Grillas, P. Mediterranean Wetlands: A Gradient from Natural Resilience to a Fragile Social-Ecosystem. In Atlas of Ecosystem Services; Springer International Publishing: Cham, Switzerland, 2019; pp. 83–89. [Google Scholar]
- Fader, M.; Giupponi, C.; Burak, S.; Dakhlaoui, H.; Koutroulis, A.; Lange, M.A.; Llasat, M.C.; Pulido-Velazquez, D.; Sanz-Cobeña, A. Water. In Climate and Environmental Change in the Mediterranean Basin–Current Situation and Risks for the Future. First Mediterranean Assessment Report; Cramer, W., Guiot, J., Marini, K., Eds.; Union for the Mediterranean, Plan Bleu, UNEP/MAP: Marseille, France, 2020; pp. 181–236. [Google Scholar]
- Piacentini, T.; Carabella, C.; Boccabella, F.; Ferrante, S.; Gregori, C.; Mancinelli, V.; Pacione, A.; Pagliani, T.; Miccadei, E. Geomorphology-Based analysis of flood critical areas in small hilly catchments for civil protection purposes and earlywarning systems: The case of the feltrino stream and the Lanciano Urban Area (Abruzzo, Central Italy). Water 2020, 12, 2228. [Google Scholar] [CrossRef]
- Janizadeh, S.; Avand, M.; Jaafari, A.; Van Phong, T.; Bayat, M.; Ahmadisharaf, E.; Prakash, I.; Pham, B.T.; Lee, S. Prediction success of machine learning methods for flash flood susceptibility mapping in the Tafresh watershed, Iran. Sustainability 2019, 11, 5426. [Google Scholar] [CrossRef] [Green Version]
- Esper Angillieri, M.Y. Morphometric analysis of Colangüil river basin and flash flood hazard, San Juan, Argentina. Environ. Geol. 2008, 55, 107–111. [Google Scholar] [CrossRef]
- Tsanakas, K.; Gaki-Papanastassiou, K.; Kalogeropoulos, K.; Chalkias, C.; Katsafados, P.; Karymbalis, E. Investigation of flash flood natural causes of Xirolaki Torrent, Northern Greece based on GIS modeling and geomorphological analysis. Nat. Hazards 2016, 84, 1015–1033. [Google Scholar] [CrossRef]
- Pham, B.T.; Avand, M.; Janizadeh, S.; van Phong, T.; Al-Ansari, N.; Ho, L.S.; Das, S.; Le, H.; Amini, A.; Bozchaloei, S.K.; et al. GIS based hybrid computational approaches for flash flood susceptibility assessment. Water 2020, 12, 683. [Google Scholar] [CrossRef] [Green Version]
- Curebal, I.; Efe, R.; Ozdemir, H.; Soykan, A.; Sönmez, S. GIS-based approach for flood analysis: Case study of Keçidere flash flood event (Turkey). Geocarto Int. 2016, 31, 355–366. [Google Scholar] [CrossRef]
- Abdo, H.G. Evolving a total-evaluation map of flash flood hazard for hydro-prioritization based on geohydromorphometric parameters and GIS–RS manner in Al-Hussain river basin, Tartous, Syria. Nat. Hazards 2020, 104, 681–703. [Google Scholar] [CrossRef]
- Abdelkareem, M. Targeting flash flood potential areas using remotely sensed data and GIS techniques. Nat. Hazards 2017, 85, 19–37. [Google Scholar] [CrossRef]
- Dinis, P.A.; Huvi, J.; Pinto, M.C.; Carvalho, J. Disastrous flash floods triggered by moderate to minor rainfall events. Recent cases in coastal Benguela (angola). Hydrology 2021, 8, 73. [Google Scholar] [CrossRef]
- Psomiadis, E.; Soulis, K.X.; Zoka, M.; Dercas, N. Synergistic approach of remote sensing and gis techniques for flash-flood monitoring and damage assessment in Thessaly plain area, Greece. Water 2019, 11, 448. [Google Scholar] [CrossRef] [Green Version]


| Characteristics | Politika | Psachna | |
|---|---|---|---|
| Politika Stream | Poros Stream | Mantania Stream | |
| Basin area (km2) | 12.08 | 25.05 | 35.30 |
| Basin length (km) | 6.68 | 8.98 | 8.52 |
| Fan area (km2) | 7.88 | 15.41 | |
| Stream length (km) | 2.68 | 65.22 | 119.20 |
| Event | Affected Area |
|---|---|
| 1998 | Dirfys-Messapia municipality |
| 2002 | Dirfys-Messapia municipality |
| 30/10/2006 | Makrykapa, Kastella and Psachna in the municipality of Dirfys-Messapia |
| 2009 | Dirfys-Messapia municipality |
| Steepness | |||||
| 0–2 (°) | 2–5 (°) | >5 (°) | |||
| 1 (Low) | 2 (Medium) | 3 (High) | |||
| Predisposing factors | One Factor | 1 | 2 (Medium) | 3 (High) | 4 (High) |
| Two Factors | 2 | 3 (High) | 4 (High) | 5 (Very High) | |
| Three Factors | 3 | 4 (High) | 5 (Very High) | 6 (Very High) | |
| Flash Flood Damage Criteria | Messapios River | Politika Stream |
|---|---|---|
| Settlements | Psachna, Kastella | Politika |
| Infrastructure | Road | Road, Bridge |
| Industrial and commercial zones | Medium effects | Low effects |
| Agricultural areas | Extended effects, close to the estuary of the river | Extended effects, at the active fan area |
| Number of deaths | 2 | 2 |
Publisher’s Note: MDPI stays neutral with regard to jurisdictional claims in published maps and institutional affiliations. |
© 2021 by the authors. Licensee MDPI, Basel, Switzerland. This article is an open access article distributed under the terms and conditions of the Creative Commons Attribution (CC BY) license (https://creativecommons.org/licenses/by/4.0/).
Share and Cite
Karkani, A.; Evelpidou, N.; Tzouxanioti, M.; Petropoulos, A.; Santangelo, N.; Maroukian, H.; Spyrou, E.; Lakidi, L. Flash Flood Susceptibility Evaluation in Human-Affected Areas Using Geomorphological Methods—The Case of 9 August 2020, Euboea, Greece. A GIS-Based Approach. GeoHazards 2021, 2, 366-382. https://0-doi-org.brum.beds.ac.uk/10.3390/geohazards2040020
Karkani A, Evelpidou N, Tzouxanioti M, Petropoulos A, Santangelo N, Maroukian H, Spyrou E, Lakidi L. Flash Flood Susceptibility Evaluation in Human-Affected Areas Using Geomorphological Methods—The Case of 9 August 2020, Euboea, Greece. A GIS-Based Approach. GeoHazards. 2021; 2(4):366-382. https://0-doi-org.brum.beds.ac.uk/10.3390/geohazards2040020
Chicago/Turabian StyleKarkani, Anna, Niki Evelpidou, Maria Tzouxanioti, Alexandros Petropoulos, Nicoletta Santangelo, Hampik Maroukian, Evangelos Spyrou, and Lida Lakidi. 2021. "Flash Flood Susceptibility Evaluation in Human-Affected Areas Using Geomorphological Methods—The Case of 9 August 2020, Euboea, Greece. A GIS-Based Approach" GeoHazards 2, no. 4: 366-382. https://0-doi-org.brum.beds.ac.uk/10.3390/geohazards2040020