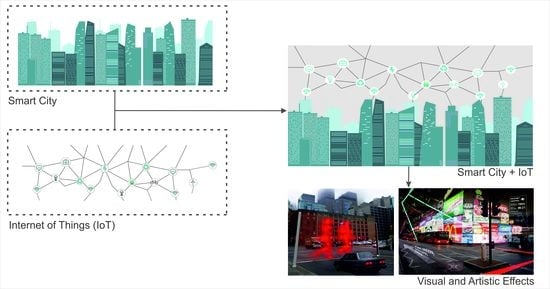
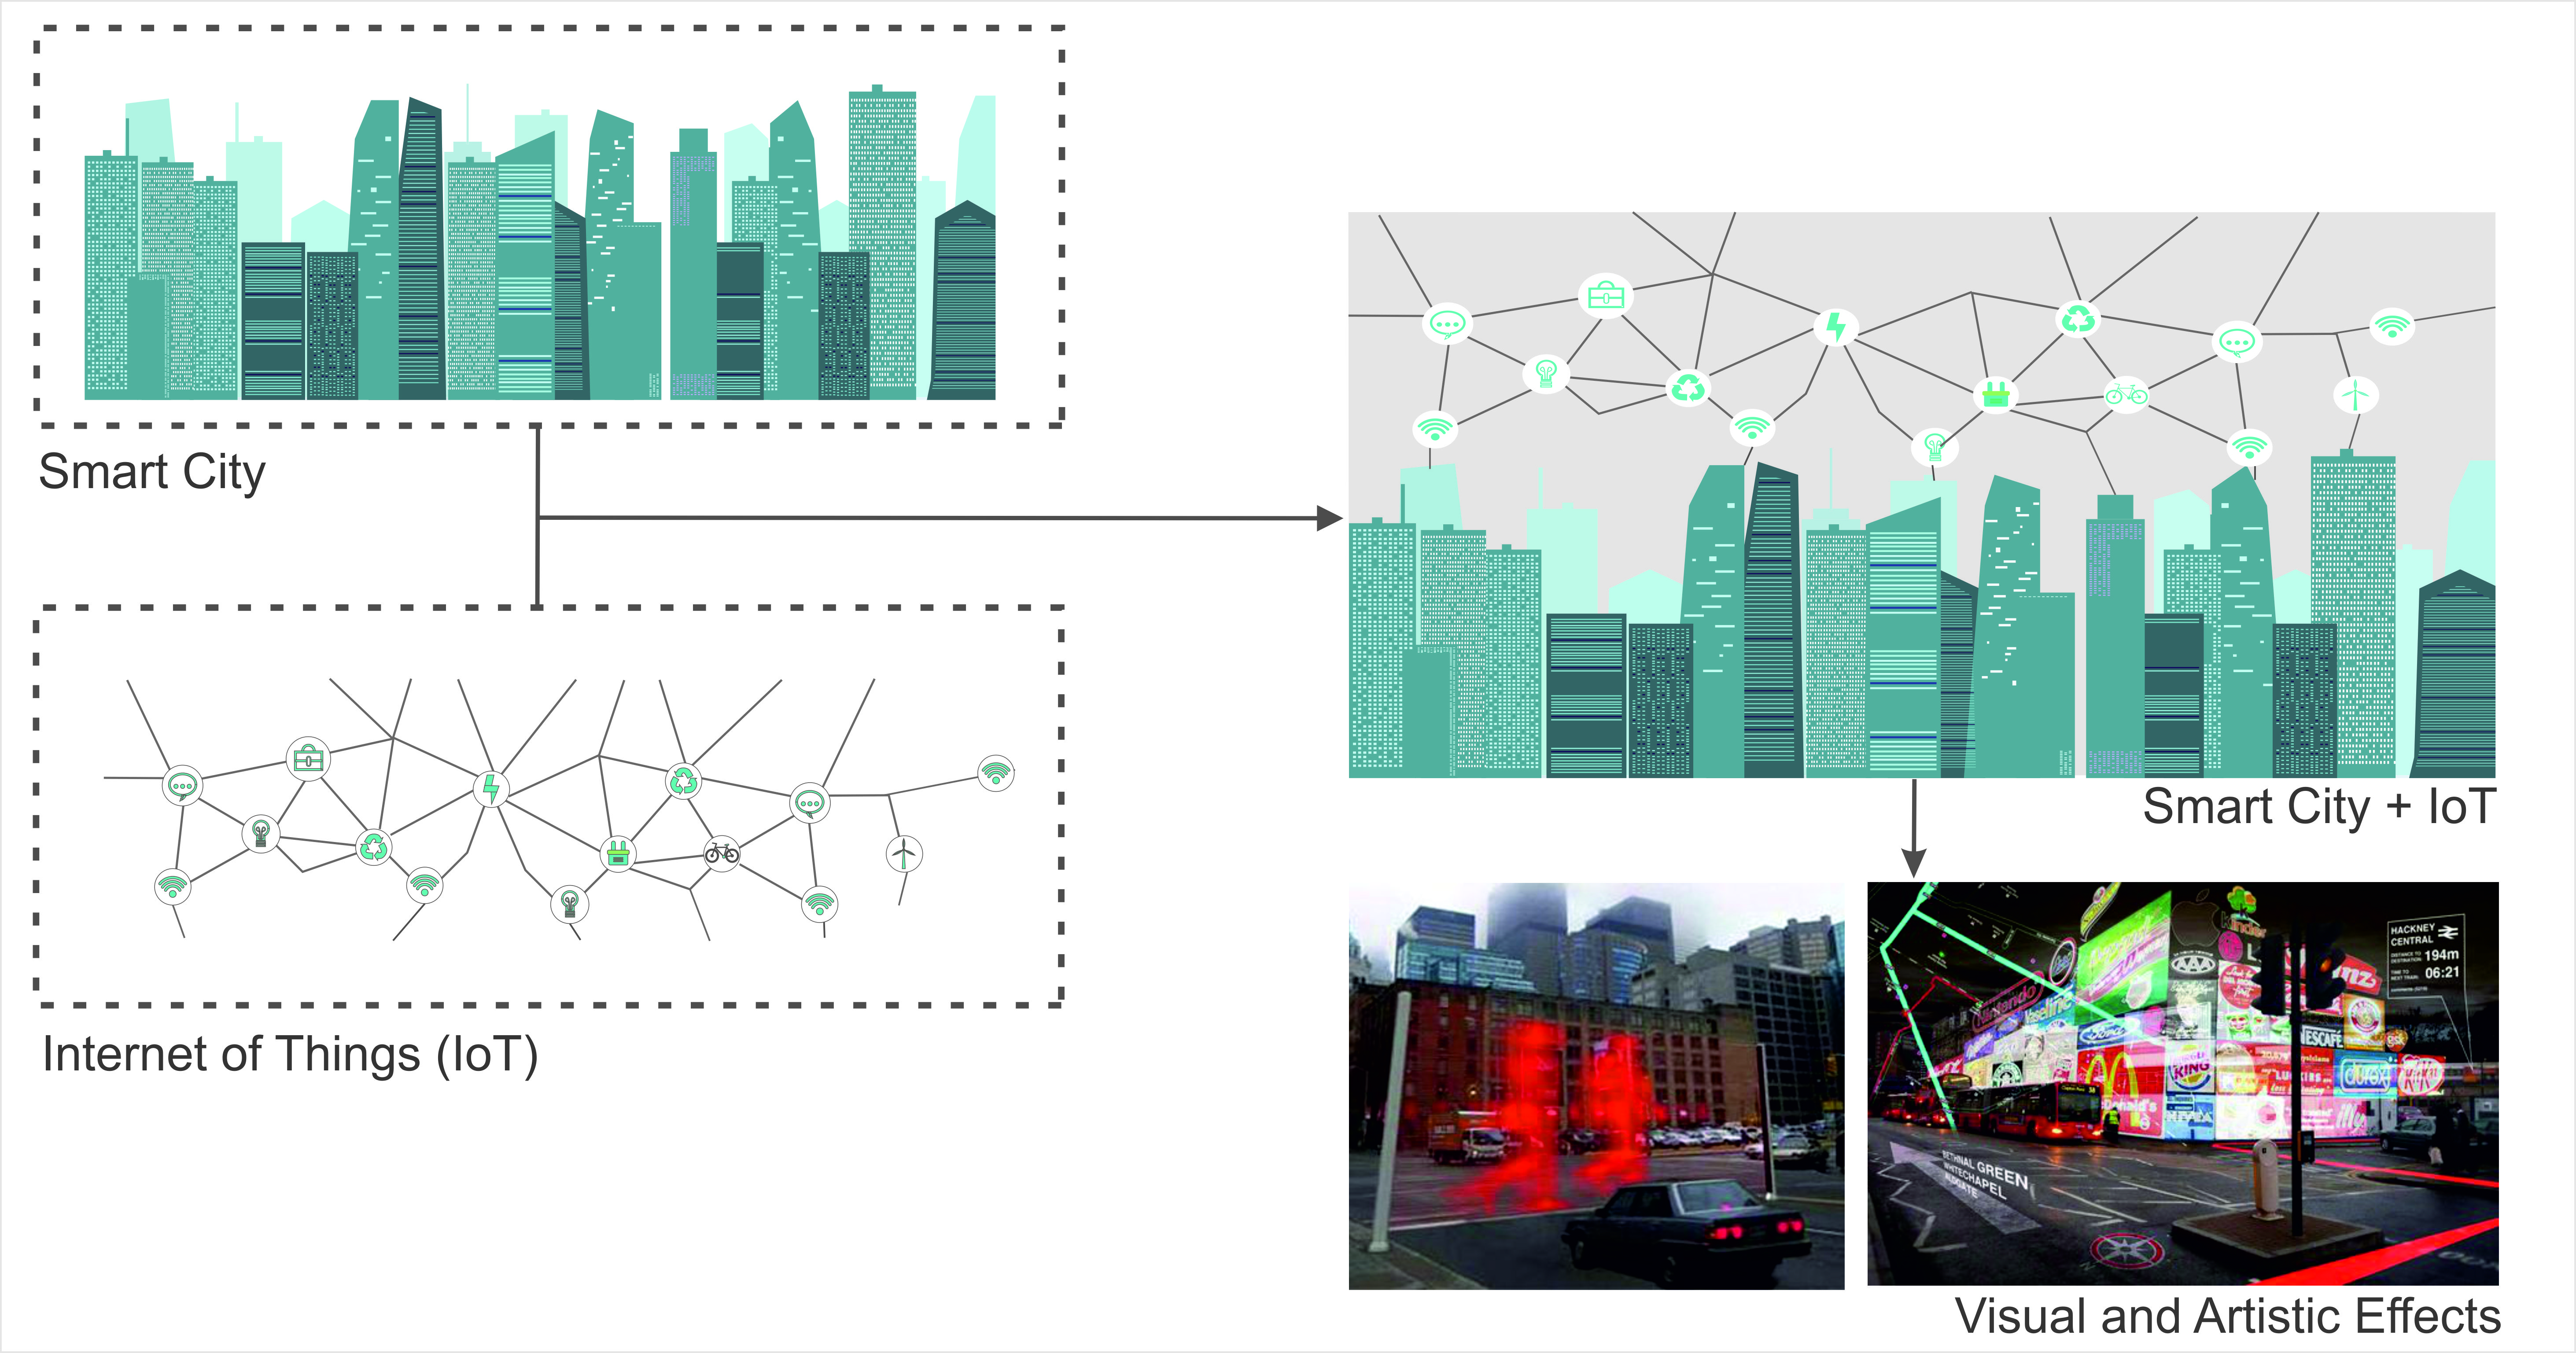
Visual and Artistic Effects of an IoT System in Smart Cities: Research Flow


1
Department of Education, University of Almeria, 04120 Almeria, Spain
2
Higher Technical School of Architecture of Seville, Queen Mercedes Avenue, 2, 41012 Seville, Spain
3
Department of Economics and Business, University of Almeria, 04120 Almeria, Spain
*
Author to whom correspondence should be addressed.
IoT 2020, 1(2), 161-179; https://0-doi-org.brum.beds.ac.uk/10.3390/iot1020011
Submission received: 24 August 2020
/
Revised: 16 September 2020
/
Accepted: 22 September 2020
/
Published: 27 September 2020
(This article belongs to the Special Issue Internet of Things Technologies for Smart Cities)
Abstract
:In smart cities, the progress of technology has allowed the implementation of sensors, originating the Internet of Things (IoT) and making cities safer and more sustainable. Hence, the presence of elements that generate visual and artistic effects of IoT technology can make a great contribution to the provision of information that the urbanite needs. The aim of this study is to analyze worldwide research on the visual and artistic effects of IoT in smart cities. Bibliometric techniques were utilized on 1278 articles on this subject matter for the period of 2010–2019 to achieve results on activity production. This has increased yearly, where in the last triennium, it has accumulated 85.21% of documents. Computer science and engineering were the most prominent subject areas where the articles were classified. The lines of research in the development of this research topic have been detected. Furthermore, the main directions for future research have also been identified. This study aims to contribute to highlighting the drivers of this field of research, in addition to providing the available information and future directions to improve academic and scientific discussion.
1. Introduction
Digitization constitutes the main engine of social and economic transformation of the 21st century, being the greatest source of competitiveness and impacting all spheres of society. New digital technologies offer opportunities and represent new challenges, making a world that is increasingly hyperconnected and completely changing our lives and the way we connect [1]. In this context, the Internet of Things (IoT) technology consists of the grouping and interconnection of devices and objects through a network where all these could be visible and interact; they create a new paradigm at a general level, but the environment of cities is where its application reaches one of its great potentials [2].
The application of this technology to modern urban spaces seeks to promote more sustainable and efficient solutions that improve, among other things, the quality of life of citizens in relation to the reduction of pollution, acoustics, light and environment, facilitate mobility and transport; promote the development of sustainable economies; and offer personalized health and safety services, among others [3].
The digital interconnection of objects is generated through sensors that obtain data from the real world and are sent to platforms for further processing. These, through service platforms, are converted into information and actions. Data analysis enables one to improve the meaning of the data, allowing for the optimization of the decision-making process [4]. The application of IoT in cities enables the evolution to smart cities [2,5]. IoT promotes advances such as: (i) production models [6], (ii) the progress of consumption and production models based on the innovation of the circularity [7], (iii) the smart management of resources [8], (iv) the presence of smart inhabitants assessing their opinions in real time [9], (v) smart mobility, and (vi) mobile connectivity based on 5G technology [10].
The smart city concept describes a city that applies information and communication technologies (ICT) to offer an interactive and efficient infrastructure and public services based on available resources, in order to improve its sustainability, in economic, social and environmental dimensions. In this system people and technology interact, and a strategic and transparent management of energy flows, materials, services and financing is proposed to catalyze sustainable economic development and the high quality of life of citizens, and respond to social needs and economic aspects of society [11,12].
In the smart city, among the urban services that digital technology provides more efficient management, the following stand out: (i) intelligent traffic management to reduce air, light and noise pollution; (ii) the use of big data to improve public health and safety; and the (iii) optimization of available resources through sensors [5,7,13,14].
In a digital context, the elements that generate the visual and artistic effects of IoT technology can go a long way in providing the information that the user needs, when they need it. User interfaces is a solution that is provided to satisfy this need, from the use of a command-line interface in the beginnings of modern computing to futuristic holographic interfaces, depending on the user’s needs. They have been, and will continue to be, the bridge between man and machine [10,11,12,13,14,15]. Integrate visual tools for interactive consultation into smart cities, such as apps or interfaces for urban control, security, and pollution allow citizen participation and interaction with their environment, as well as the detection of opportunities and improvements in city services [16,17,18].
Some examples of IoT devices that generate useful visual effects are light panels that produce visual and audible alerts for better orientation of drivers, notifying in turn that a failure has occurred in a car on a road, and thus alerting drivers, traffic officers and other drivers and avoiding accidents. Likewise, the presence of the police and other urban security authorities that use 3D holographic assistants, collaborates in control and surveillance, serving as assistance for citizen protection in modern urban environments [19,20,21,22].
The purpose of this research is to study the progress of the worldwide knowledge base on the visual and artistic effects of IoT technology in smart cities from.
Therefore, the literature review has made it possible to determine the research questions for this topic:
- What is the global knowledge structure on the visual and artistic effects of IoT technology in smart cities?
- Which are the main actors that promote this research topic (authors, research institutions and countries/territories)?
- What are the lines of the research developed on this subject?
- What are the future directions of the research on this topic?
Accordingly, the aim of this study is to examine the worldwide research on the visual and artistic effects of IoT technology in smart cities during the 2010–2019 period.
As a consequence, to obtain answers to the previous research questions, a sample of 1278 articles from academic journals selected from the Scopus database was examined. Bibliometric techniques were used to integrate the international knowledge base on this topic. The outcomes have allowed the detection of the main driving actors in this research topic, and current and future research directions.
To achieve the stated objective and clarify its understanding, this study is organized as follows: After justifying the relevance of the research topic, delimiting the unit of analysis, and conducting a review of the most relevant aspects of the theoretical principles and base concepts of this study, Section 2 details the process of data selection, analysis, and applied methodology. Section 3 shows the main results and the discussion. Finally, in Section 4, the conclusions are presented.
2. Methodology
The bibliometric method was initiated by E. Garfield in the middle of the 20th century [23], and it has allowed for the evaluation of scientific production, and it has made it possible to evaluate scientific production and examine knowledge in numerous subjects [24,25]. Bibliometrics applies mathematical and statistical methods to scientific literature in order to evaluate the activity of a scientific field.
Bibliometric indicators are the instruments used to determine the results of scientific activity. They have become an essential tool for organizations that develop research or innovation programs [26,27]. Likewise, the bibliometric method has supported the review of various schools of knowledge [28,29,30].
The objective of this study is to determine the general dynamics of IoT in smart city research globally. For this, the terms selected were: “Internet of Things”, “IoT”, “smart city”, “artistic” and “visual”. The predilection of the Scopus database for data analysis is due to the following reasons: it is the deposit that is considered the largest database of peer-reviewed literature; it minimizes the risk of document loss during the search; it offers tools for data visualization and analysis; and it allows one to download the sample in different formats [31].
The period examined was between 2010 and 2019, from the publication of the first document on this topic (2010) to the last full year (2019). This resulted in the sample incorporating 1278 articles. Moreover, in order to avoid distorting the sample, the articles included in the following categories were eliminated: physics and astronomy, biochemistry, genetics and molecular biology, neuroscience, medicine, chemical engineering, Earth and planetary sciences, agricultural and biological sciences, psychology, pharmacology, toxicology and pharmaceutics, health professions and veterinary. In this way, the results obtained are deeply aligned with the analyzed subject matter.
The database used for data analysis was Scopus because it is considered to be the largest repository of peer-reviewed literature. Additionally, it minimizes the risk of document loss during the search, offers tools for data visualization and analysis, and it allows one to download the sample in different formats [31].
Accordingly, the quality indicators used were the number of citations, the h-index, and the indicator that measures the quality of the scientific journals included in Scopus, SCImago Journal Rank (SJR), CiteScore and source normalized impact per paper (SNIP). In addition, the indicators of collaborative structure, which measure the actors of the links, have been analyzed, applying mapping tools and network processing. The productivity of authors, countries/territories and research institutions has also been considered as an indicator of scientific production.
The software tool used is VOSviewer (version 1.6.15, University of Leiden, Leiden, The Netherlands), which allows a co-authorship analysis to be carried out to examine the social structure of this research field and to evaluate patterns of scientific collaboration. Moreover, a co-occurrence analysis has been carried out to provide a graphical visualization of the possible relationships between the key concepts represented in the articles in the sample. The occurrence attribute denotes the number of documents in which a term appears and the total strength of the link, which refers to the number of publications in which two terms appear together. The results obtained are useful for researchers, analysts, managers, and others interested in this field of research.
3. Results and Discussion
3.1. Scientific Production, Subject Areas and Journals
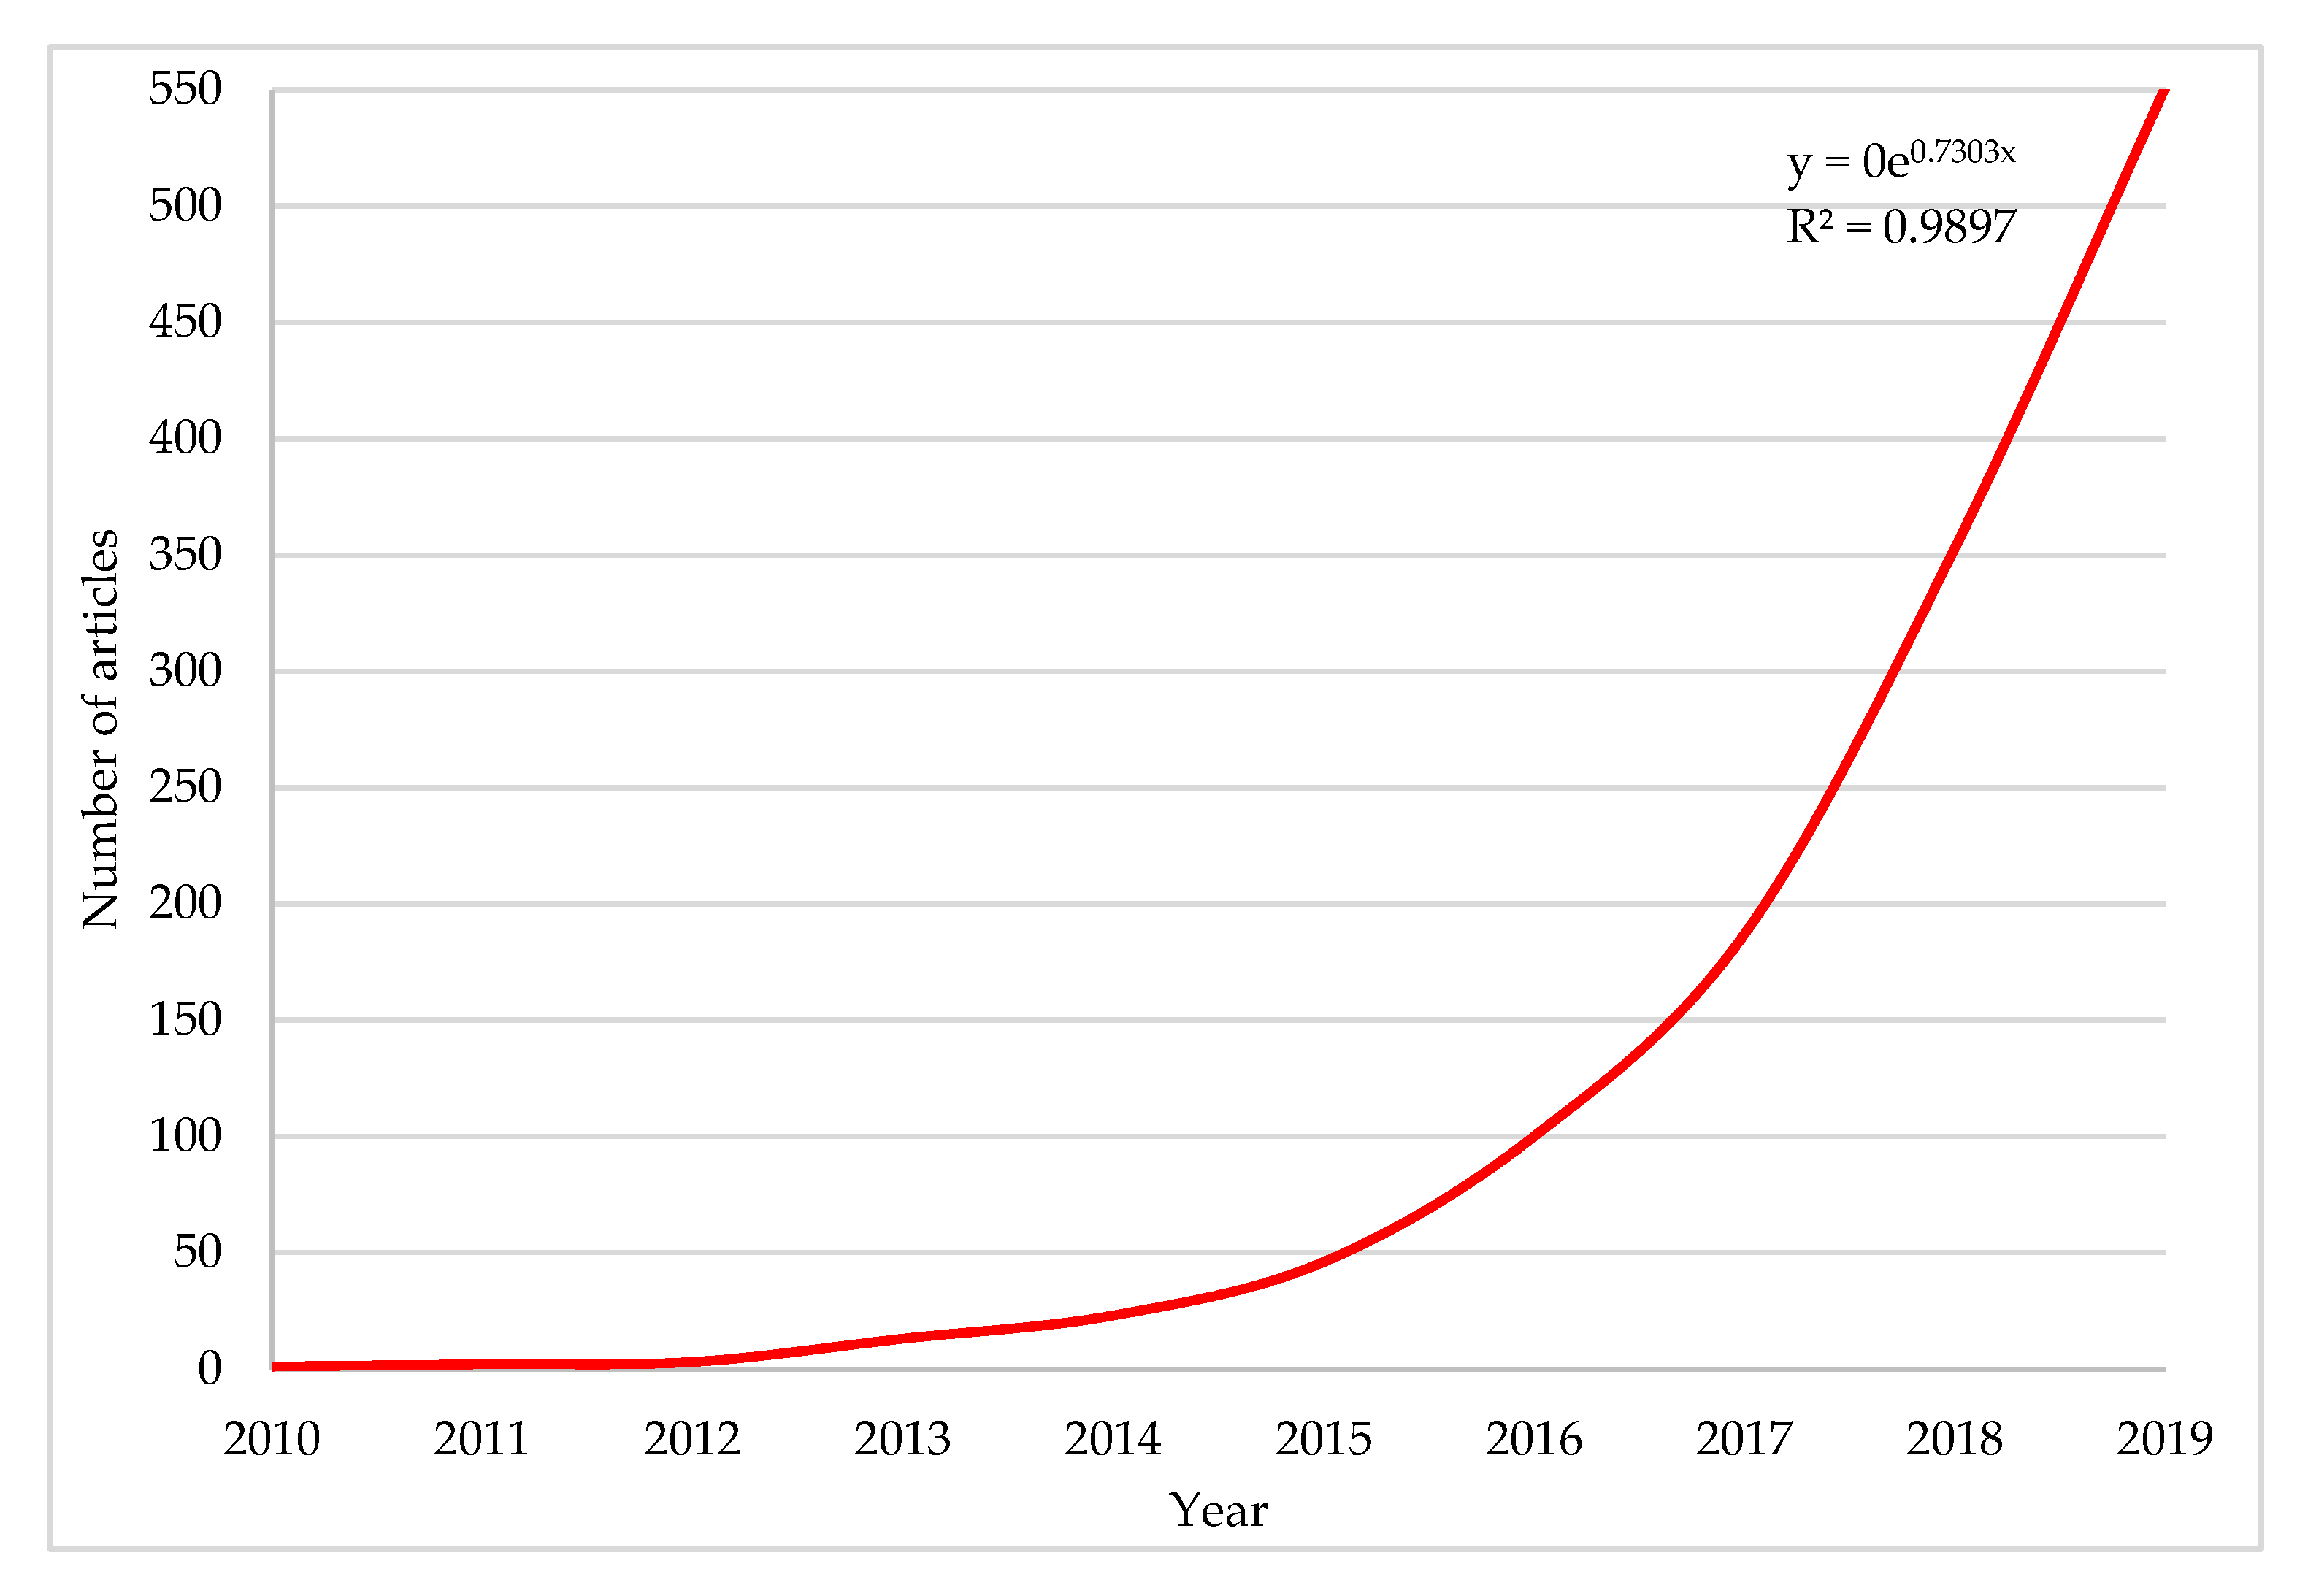
Since 2010, when the first article on this subject was published, there has been a growing interest on the part of the scientific and academic community, publishing 550 articles in the last analyzed year (2019).
The impact of this topic is better understood when it is noted that 96.72% of the total has been published in the last five years (1237 documents), 85.3% (1091) in the last three-year period and in the last year, 43.08% (551).
Figure 1 reveals the evolution of the 1278 articles published between 2010 and 2019. The exponential trend indicates that the scientific production has increased in the examined period, since the values are divided over time into larger and larger intervals. The value of the coefficient of determination R2 is 0.9897, which shows that the values fit perfectly to the line.
The evolution of scientific production is the consequence of the Fourth Industrial Revolution related to computing, sensors, transmission, and data analysis [32]. IoT has connected society with the business world, allowing, among other things, the dynamism of industries and their practices, the presence of new business models, successful health systems, as well as smarter and more sustainable cities [33].
On the other hand, this revolution has influenced research, since in recent years, scientific production has increased globally. Scientific production is known to reflect innovation and changes brought about by unruly technologies. The cooperation between the main actors of scientific activity in this research topic is a key factor in this growth [34].
In this period, 1251 articles were written in English (97.89%). Furthermore, the documents have been published in other less-represented languages: Chinese (1.25%), Persian and Spanish (0.24% each), Japanese and Russian (0.16% each), and Portuguese (0.08%). The publication in the English language is based on the breadth of the audience to which the research is directed, as is the case mainly in the searches carried out in Scopus [35].
According to the Scopus database, the 1278 articles were classified into 13 subject areas. It should be noted that a document can be classified into more than one subject area, depending mainly on the interest of the journal’s editor. Hence, Figure 2 shows the classification of the 10 main subject areas where the articles in world research on this subject were classified.
The two subject areas that accumulate the most published documents are computer science (971 articles, 75.98%) and engineering (636, 49.77%). These are followed by social sciences (136, 10.64%), materials science (132, 10.33%), mathematics (97, 7.59%), business, administration and accounting (118, 7.12%), energy (75, 5.87%), environmental sciences (64, 5.01%), decision science (38, 2.97%), and arts and humanities (19, 1.49%). It is necessary to clarify that the same article can be classified in more than one subject area depending on the criteria of the editor; therefore, the sum of the articles classified in all areas, consequently, add up to more than the total sample (1278).
The transition from urban environments to smart cities is analyzed from a multidisciplinary approach [36]. This subject is initially related to computer science and engineering, although it also has connotations in other disciplines, such as the social sciences, economics, finance, health, arts, and architecture—hence the approach to visual and artistic effects of IoT technology [37].
Table 1 shows the main data of the 10 most prolific journals on the subject examined, during 2010–2019 period. The 1278 selected scientific articles have been published by 383 international journals. Hence, the following are presented for each year: the count of the number of articles, the journal’s country, subject areas, h-index, and the main Scopus quality metrics (CiteScore, SJR and SNIP), in addition to the first and last year of the articles published in order to define the period of contribution to this research topic.
According to the number of articles published and the percentage they represent of the total sample, the most productive journals are IEEE Access (114, 8.92%) followed by the IEEE Internet of Things Journal (94, 7.35%) and Future Generation Computer Systems (69, 5.40%). This is followed in order by the International Journal of Innovative Technology and Exploring Engineering (36, 2.82%) and the International Journal of Recent Technology and Engineering (32, 2.50%). The rest of the journals do not exceed 2% of the total. It stands out that among the top five journals, 20% are of North American origin, 10% are European (The Netherlands) and 20% are Indian.
The North American IEEE Internet of Things Journal, and the Dutch Future Generation Computer Systems present the highest h-index in this period, with 25, in 94 and 69 articles published, respectively. On the other hand, of four journals, it has not been possible to determine the quality metrics of Scopus due to the recent incorporation of the subject.
The journals with the highest CiteScore (2019) were the IEEE Internet of Things Journal (11.33) and the IEEE Communications Magazine (11.27). This latest North American journal is also that which had the highest SJR (2.373) and SNIP (4.681) in 2019. This is also significant due to the attention generated by research in the international scientific community, with the 10 most productive journals published in 2019.
3.2. Authors, Research Institutions and Countries/Territories: Cluster Analysis
This section presents the main actors driving this research topic (authors, research institutions, and countries/territories). In addition, based on the co-authorship method, their collaboration networks are analyzed.
The 1278 selected articles have been composed by 3858 authors. Hence, the five most prolific authors, described with the institution to which they are affiliated, were: Al-Turjman, F. (Antalya Bilim University, Turkey); Choo, K.K.R. (University of Texas at San Antonio, United States); Lloret, J. (Universitat Politècnica de València, Spain); Ahmad, A. (Università degli Studi di Milano, Italy); and Barnaghi, P. (UK Dementia Research Institute, United Kingdom).
These authors classify their articles mainly in the subject areas of computer science, engineering and mathematics. These subject areas indicate the activities of this field, with implications both in technology and innovation and ubiquity. This is linked to the concept of Smart City and IoT as a complex of interrelated elements to improve the quality of life of inhabitants [8,15,38,39].
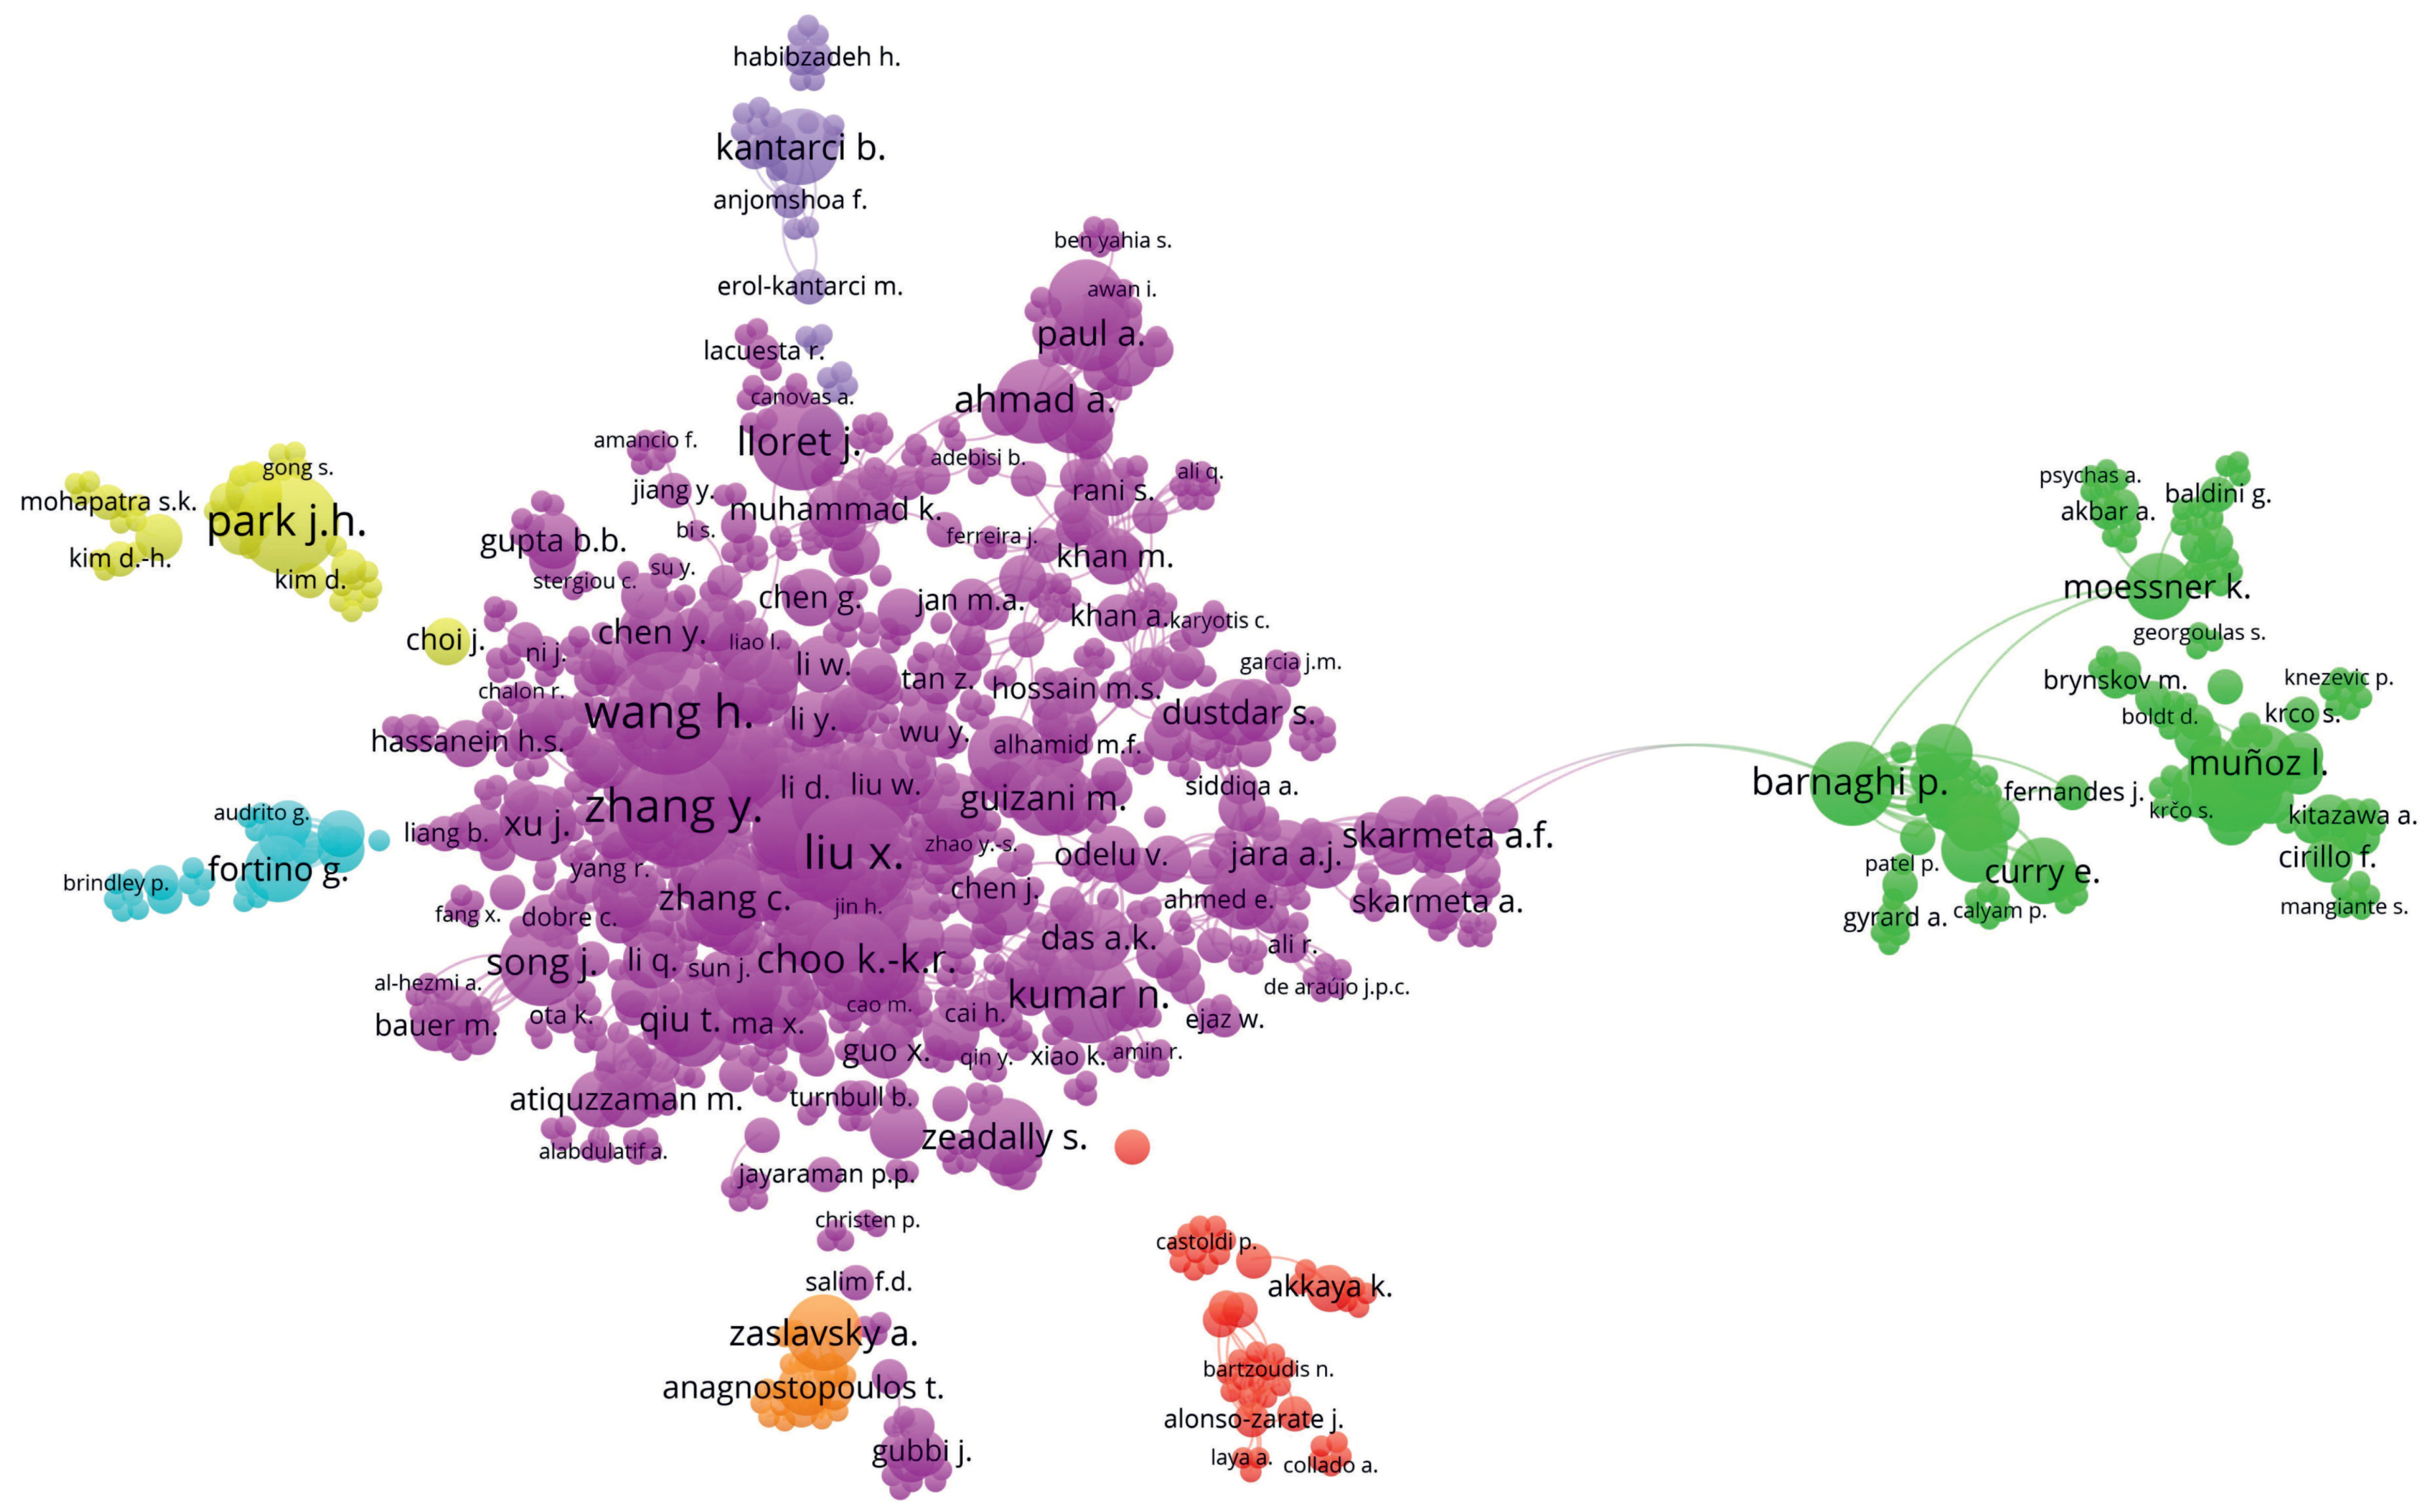
Figure 3 shows the collaboration map between the authors based on the co-authorship method. From VOSviewer, the authors that promote this topic are associated in seven clusters.
Cluster 1 (pink), the most numerous, groups 78.12% of the authors, is led by Yaqoob I. Zhao W., and collaborates, among others, with Zhang N., Yang X., Zhang H., Hashem I.A.T., Lin J., Perera C., Yu W., Gubbi J., Palaniswami M., Jin J., Marusic S., Chang V., Christen P., Georgakopoulos D., Paul A., Rathore M.M., Gani A., Ahmad A., Ahmed E., Jara A.J., Imran M., Gupta B.B., Adewole K., Anuar N.B., and Chiroma H. The centrality of this cluster confirms its potential for research and collaboration among its authors.
Cluster 2 (green) groups 9.59% of the authors, is led by Santana J.R., and collaborates, among others, with Sotres P., Gluhak A., Galache J.A., Sanchez L., Krco S., Theodoridis E., Gutierrez V., Pfisterer D., Ramdhany R., Stavroulaki V., Vlacheas P., Biswas A., Demestichas P., Foteinos V., Giaffreda R., Kelaidonis D., Poulios G., Somov A., Barnaghi P., Gao F., Farajidavar N., Fischer M., Iggena T., Tonjes R., Fernandes J., and Kumper D. Cluster 2 shows its laterality, thus confirming the collaboration between the authors of the same, and less collaboration with the rest.
Cluster 3 (red) links 3.37% of the authors, is led by Çiftler B.S., and collaborates, among others, with Vilalta R., Verikoukis C., Velasco L., Tonyali S., Santana E., Pubill D., Peng S., Ozgur U., Orsini V., Niotaki K., Muñoz R., Munoz R., Morris D., Mayoral A., Markendahl J., Mangues-Bafalluy J., Laya A., Kadri A., Giorgetti A., Ghanbari A., Georgiadis A., Font-Bach O., Dikmese S., Carvalho N.B., Bartzoudis N., and Akkaya K.
Cluster 4 (yellow) groups 2.99% of the authors and is led by Park J.H. The author is associated, among others, with Lee Y., Lee K.J., Kim D.-H., Daneshmand M., Choi J., Behera T.M., Ahmad S., Acharya O.P., Kim D., Khan M.S., Joe D.J., Jo J., Jeong M., Hang L., Gong S., Gandomi A.H., Dutta D., Shin J.H., Shin C.-S., Sharma P.K., Samal U.C., Salim M.M., Ryu J.H., Rathore S., Pradhan A., Wook Kwon B., Tcydenova E., Singh S.K., and Sicato J.C.
Cluster 5 (purple) links 2.32% of the authors and is led by Kantarci B. This author is associated, among others, with Ekenna C., Carr K.G., Capponi A., Cacciatore G., Bouvry P., Boukerche A., Anjomshoa F., Aloqaily M., Habibzadeh H., Granelli F., Giordano S., Fiandrino C., Erol-Kantarci M., Nussbaum B., Matthews J.N., Mao W., Lozano J., Liu C., Li B., Kliazovich D., Kisacikoglu M.C., Wu S., Tang T., Soyata T., Sorger U., Singh N., Schuckers S., Rong B., Pouryazdan M., and Pearsall C.D.
Cluster 6 (cyan) groups 1.80% of the authors and is led by Fortino G. The author associates, among others, with Alinia P., Audrito G., Beal J., Brindley P., Casadei R., Damiani F., Di Mauro M., Erhan L., Ferguson F.J., Ferrara E., Fragale L., Ghasemzadeh H., Gravina R., Liotta A., Ndubuaku M., Perra C., Pianini D., Richardson M., Russo W., Savaglio C., Sheffield D., Shen W., Song W., and Viroli M.
Cluster 7 (orange), the least numerous, links 1.35% of the authors and is led by Zaslavsky A. This author associates, among others, with Amirian P., Anagnostopoulos C., Anagnostopoulos T., Behdad S., Browne C., Fedchenkov P., Hadjiefthymiades S., Hadjieftymiades S., Jatinkumar Shah P., Khoruznikov S., Kolomvatsos K., Medvedev A., Miles A., Morley J., Ntalianis K., Rybin A., Skourlas C., and Sosunova I.
The collaboration network between the authors that promote this theme are of Chinese, North American, Spanish, and Italian origin due to the development of their scientific production in other countries/territories. The financing of research and development (R&D) projects is the cornerstone of the progression of production [40,41].
The 1278 selected articles have been developed by 2763 international research institutions. Regarding the most prolific affiliations on this topic, it is worth noting that 70% are of Asian origin: King Saud University (Saudi Arabia); Chinese Academy of Sciences (China); COMSATS University Islamabad (Pakistan); University of Electronic Science and Technology of China (China); Vellore Institute of Technology (Vellore, India); Kyungpook National University (South Korea); and Shanghai Jiao Tong University (China). The remaining 30% are of European origin: University of Surrey (United Kingdom); Alma Mater Studiorum Università di Bologna (Italy); and Universitat Politècnica de Valencia (Spain). Furthermore, all these research institutions classify their published articles in Computer Science and Engineering categories.
The research affiliations classify the documents in computer science and engineering, in the same way as for the total of the samples. It is observed that the affiliations have a key role in the development of research lines derived from the financing of R&D projects from the administrations. Consequently, scientific production is developed by a wide variety of affiliations from the different configurations that mark the investigations from local, regional, or governmental institutions with their own interests [42,43].
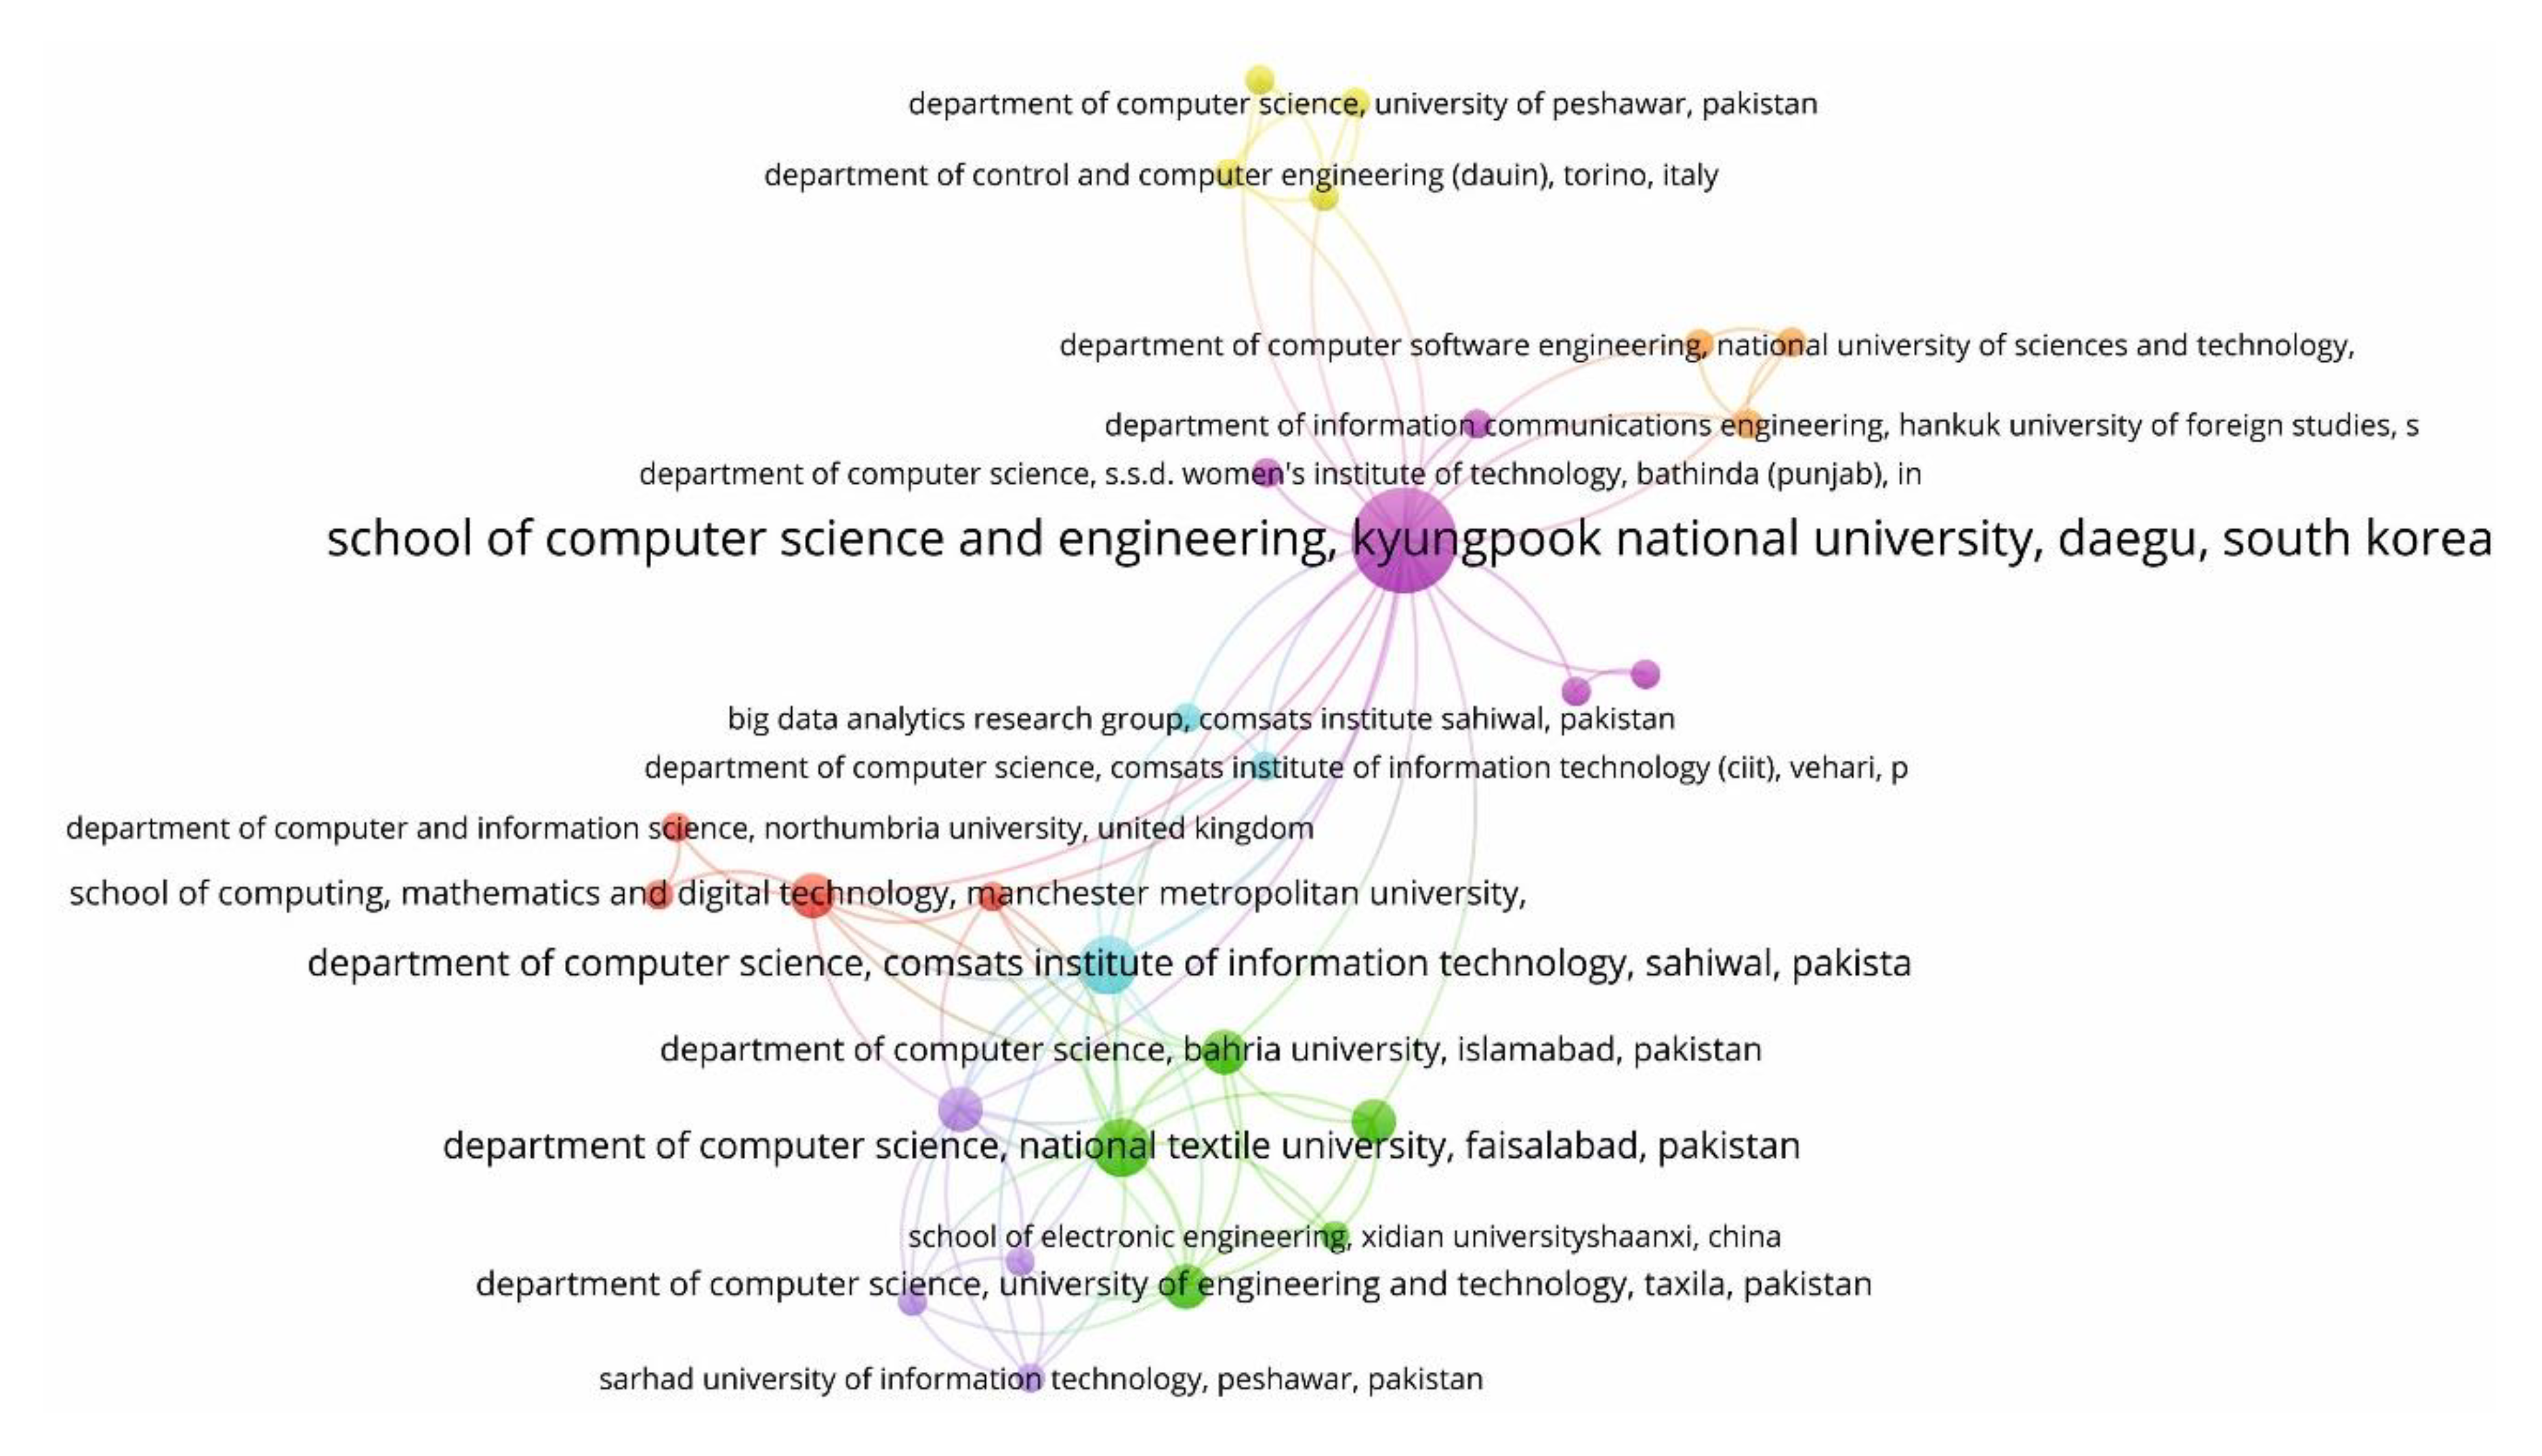
On the other hand, Figure 4 displays the affiliations network based on the co-authorship method. The VOSviewer software tool groups them into seven clusters.
Cluster 1 (pink) is associated, among others, with the Faculty of Computer Science and Engineering of Kyungpook National University (South Korea); the Department of Computer Science, University of Engineering and Technology (Pakistan); the School of Architecture, Civil, Environmental and Energy Engineering, Kyungpook National University (South Korea); and the Department of Computer Science (India).
Cluster 2 (green) is associated with the Department of Integrated Systems Engineering, Incheon National University (South Korea); the Department of Computer Science, University of Bahria (Pakistan); and the Department of Computer Science, National Textile University (Pakistan).
Cluster 3 (red) is associated, among others, with the School of Computing, Mathematics and Digital Technology, Manchester Metropolitan University (United Kingdom); the School of Engineering, Manchester Metropolitan University (United Kingdom); the Department of Computer Science, University of Peshawar (Pakistan); and the Department of Information and Computer Science, University of Northumbria (United Kingdom).
Cluster 4 (yellow) groups and associates with, among other institutions, the Department of Computer Control and Engineering (Dauin) (Italy); the Department of Computer Science, University of Peshawar (Pakistan); and the Faculty of Computing, University of Technology (Malaysia).
Cluster 5 (purple) associates, among others, with the Department of Computer Science of the University of Peshawar (Pakistan) and the Department of Computer Science, Cinvestav-IPN (Mexico).
Cluster 6 (cyan) includes research institutions, such as the Department of Computer Science, the Comsats Institute of Information Technology (Vehari, Pakistan); Big Data Analytics Research Group, Comsats Institute Sahiwal (Pakistan); and the Department of Computer Science, Comsats Institute of Information Technology (Sahiwal, Pakistan).
Finally, cluster seven (orange) groups, among others, the Department of Computer Software Engineering, National University of Sciences and Technology (Pakistan); the Department of Information Communications Engineering, Hankuk University of Foreign Studies (South Korea); and the Department of Computer Science, Sarhad University of Information Science and Technology (Pakistan).
The co-authorship of the affiliations allows for detection of the multidisciplinary approach of this issue, which is linked to the diversity of actors involved, such as researchers, administrations, and funding agencies [44].
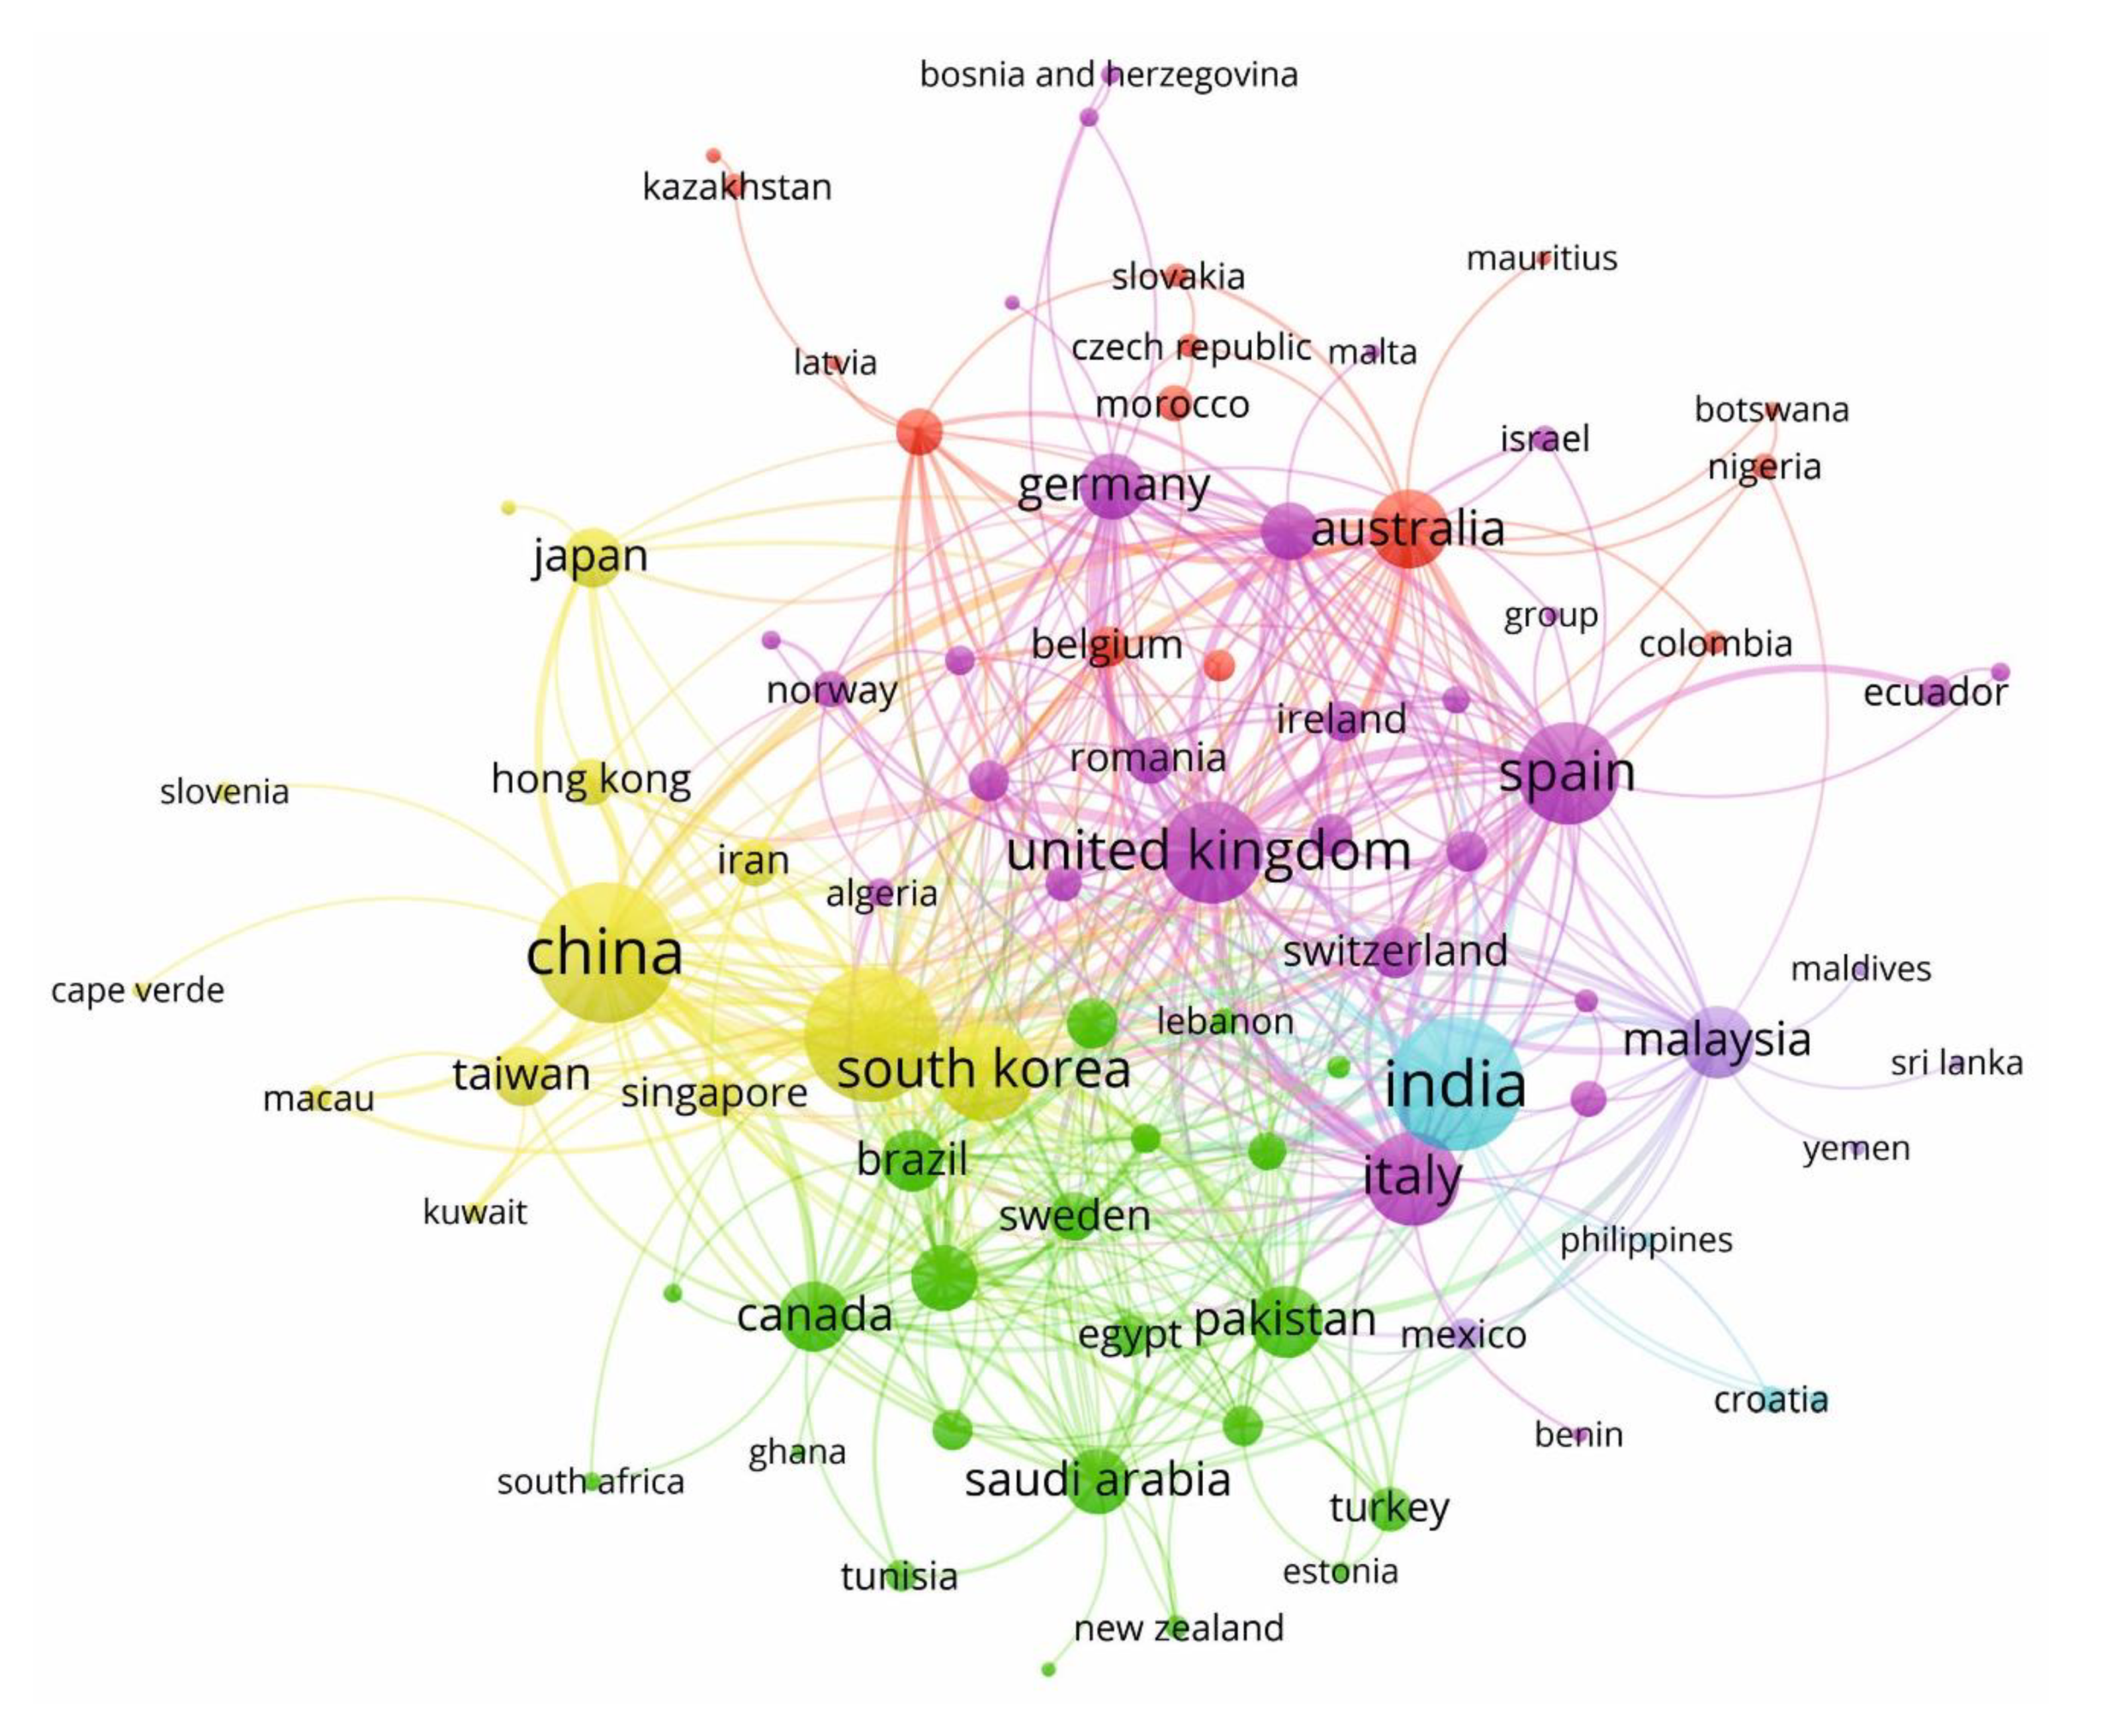
The 1278 selected articles have been composed by 86 international countries/territories. Therefore, the country/territory with the most articles is China (articles: 244; percent of the total: 19.09%), followed by the United States (219, 17.14%), India (218, 17.05%), the United Kingdom (115, 8.99%), Spain (111, 8.68%), South Korea (100, 7.82%), Italy (90, 7.04%), Australia (59, 4.62%), Malaysia (47, 3.68%), and Pakistan (47, 3.68%). Likewise, the main subject areas where articles are classified were computer science and engineering, in the same way that occurs with all scientific production. In the association of countries/territories, as observed in the reviewed literature, a multidisciplinary research of this topic has also been redeveloped. This has impacted the multidisciplinary approach [45].
Figure 5 displays a cooperative network among the main territories based on the co-authorship method. The VOSviewer software has clustered them into six clusters. Cluster 1 (pink), the largest, is made up of 33.33% of all countries/territories and is led by Italy. This country/territory collaborates, among others, with Spain, United Kingdom, Greece, Germany, Switzerland, Serbia, Ireland, Denmark, Austria, Romania, Norway, Netherlands, Finland, Algeria, Israel, Montenegro, Bosnia And Herzegovina, Ecuador, Poland, Viet Nam, Indonesia, Costa Rica, Cyprus, and Malta.
Cluster 2 (green) is made up of 24.14% of all countries/territories and is led by Pakistan. This country/territory collaborates with Canada, Sweden, France, Saudi Arabia, United Arab Emirates, Brazil, Qatar, Turkey, Portugal, Egypt, Luxembourg, South Africa, New Zealand, Argentina, Estonia, and Ghana, among others.
Cluster 3 (red) groups 16.09% of all countries/territories and is headed by Australia. This country/territory collaborates, among others, with the Russian Federation, Belgium, Nigeria, Morocco, Czech Republic., Colombia, Slovakia, and Kazakhstan, among others.
Cluster 4 (yellow) groups 14.94% of all countries/territories and is led by the United States. This country/territory collaborates with China, South Korea, Japan, Taiwan, Iran, Hong Kong, Singapore, and Albania, among others.
Cluster 5 (violet) groups 5.75% of all countries/territories and is headed by Malaysia. This country/territory collaborates with Yemen, Mexico, Sri Lanka, and Maldives. Finally, cluster 6 (blue) is led by India and groups 4.60% of all countries/territories. This country/territory collaborates, among others, with Chile, Croatia, and the Philippines.
The analysis of co-authorship at the country/territory level indicates that more territories will allow a greater acceleration of the investigation. The grouping in 5 clusters represents a value of the international solidity of the application of IoT in smart cities to improve the information of its citizens. The centrality of the United Kingdom indicates the effort of its research activity and the international collaboration of its articles [46,47].
3.3. Keyword Analysis
Next, an analysis of keywords on the research is presented, which allows us to detect the main lines of research developed in the period 2010–2019.
The 1278 selected articles presented 7855 keywords. The 20 most used in the analyzed sample can be counted in more than one journal. Thereby, the most prominent terms are “Internet of Things” (in 1526 articles), and “Smart City” (800). These two keywords were considered in the search query of the Scopus database. Keywords like the main ones appear in the following positions: Internet (96), network security (96), automation (92), and wireless sensor networks (88).
The other keywords of these top 20 are grouped around thematic disciplines such as data intelligence: big data (145), cloud computing (81), intelligent buildings (80), energy efficiency (79), distributed computer systems (74), information management (74), energy utilization (72), network architecture (68), data handling (63), digital storage (60), monitoring (54), decision making (51), fog computing (50), and security (47).
This research topic stands out for its interdisciplinary nature since its analysis from different perspectives (technical and social) is key. This approach will allow the incorporation of new concepts that will broaden this theme [48,49].
The VOSviewer tool offers for each keyword the number of links and their total strength. Links signify a co-occurrence connection between two keywords, while the total link strength indicates the amount of posts in which two terms exist together. Therefore, “Internet of Things” is the one with the most links (692) and the highest total link strength (6396), followed by “smart city” (662, 4532).
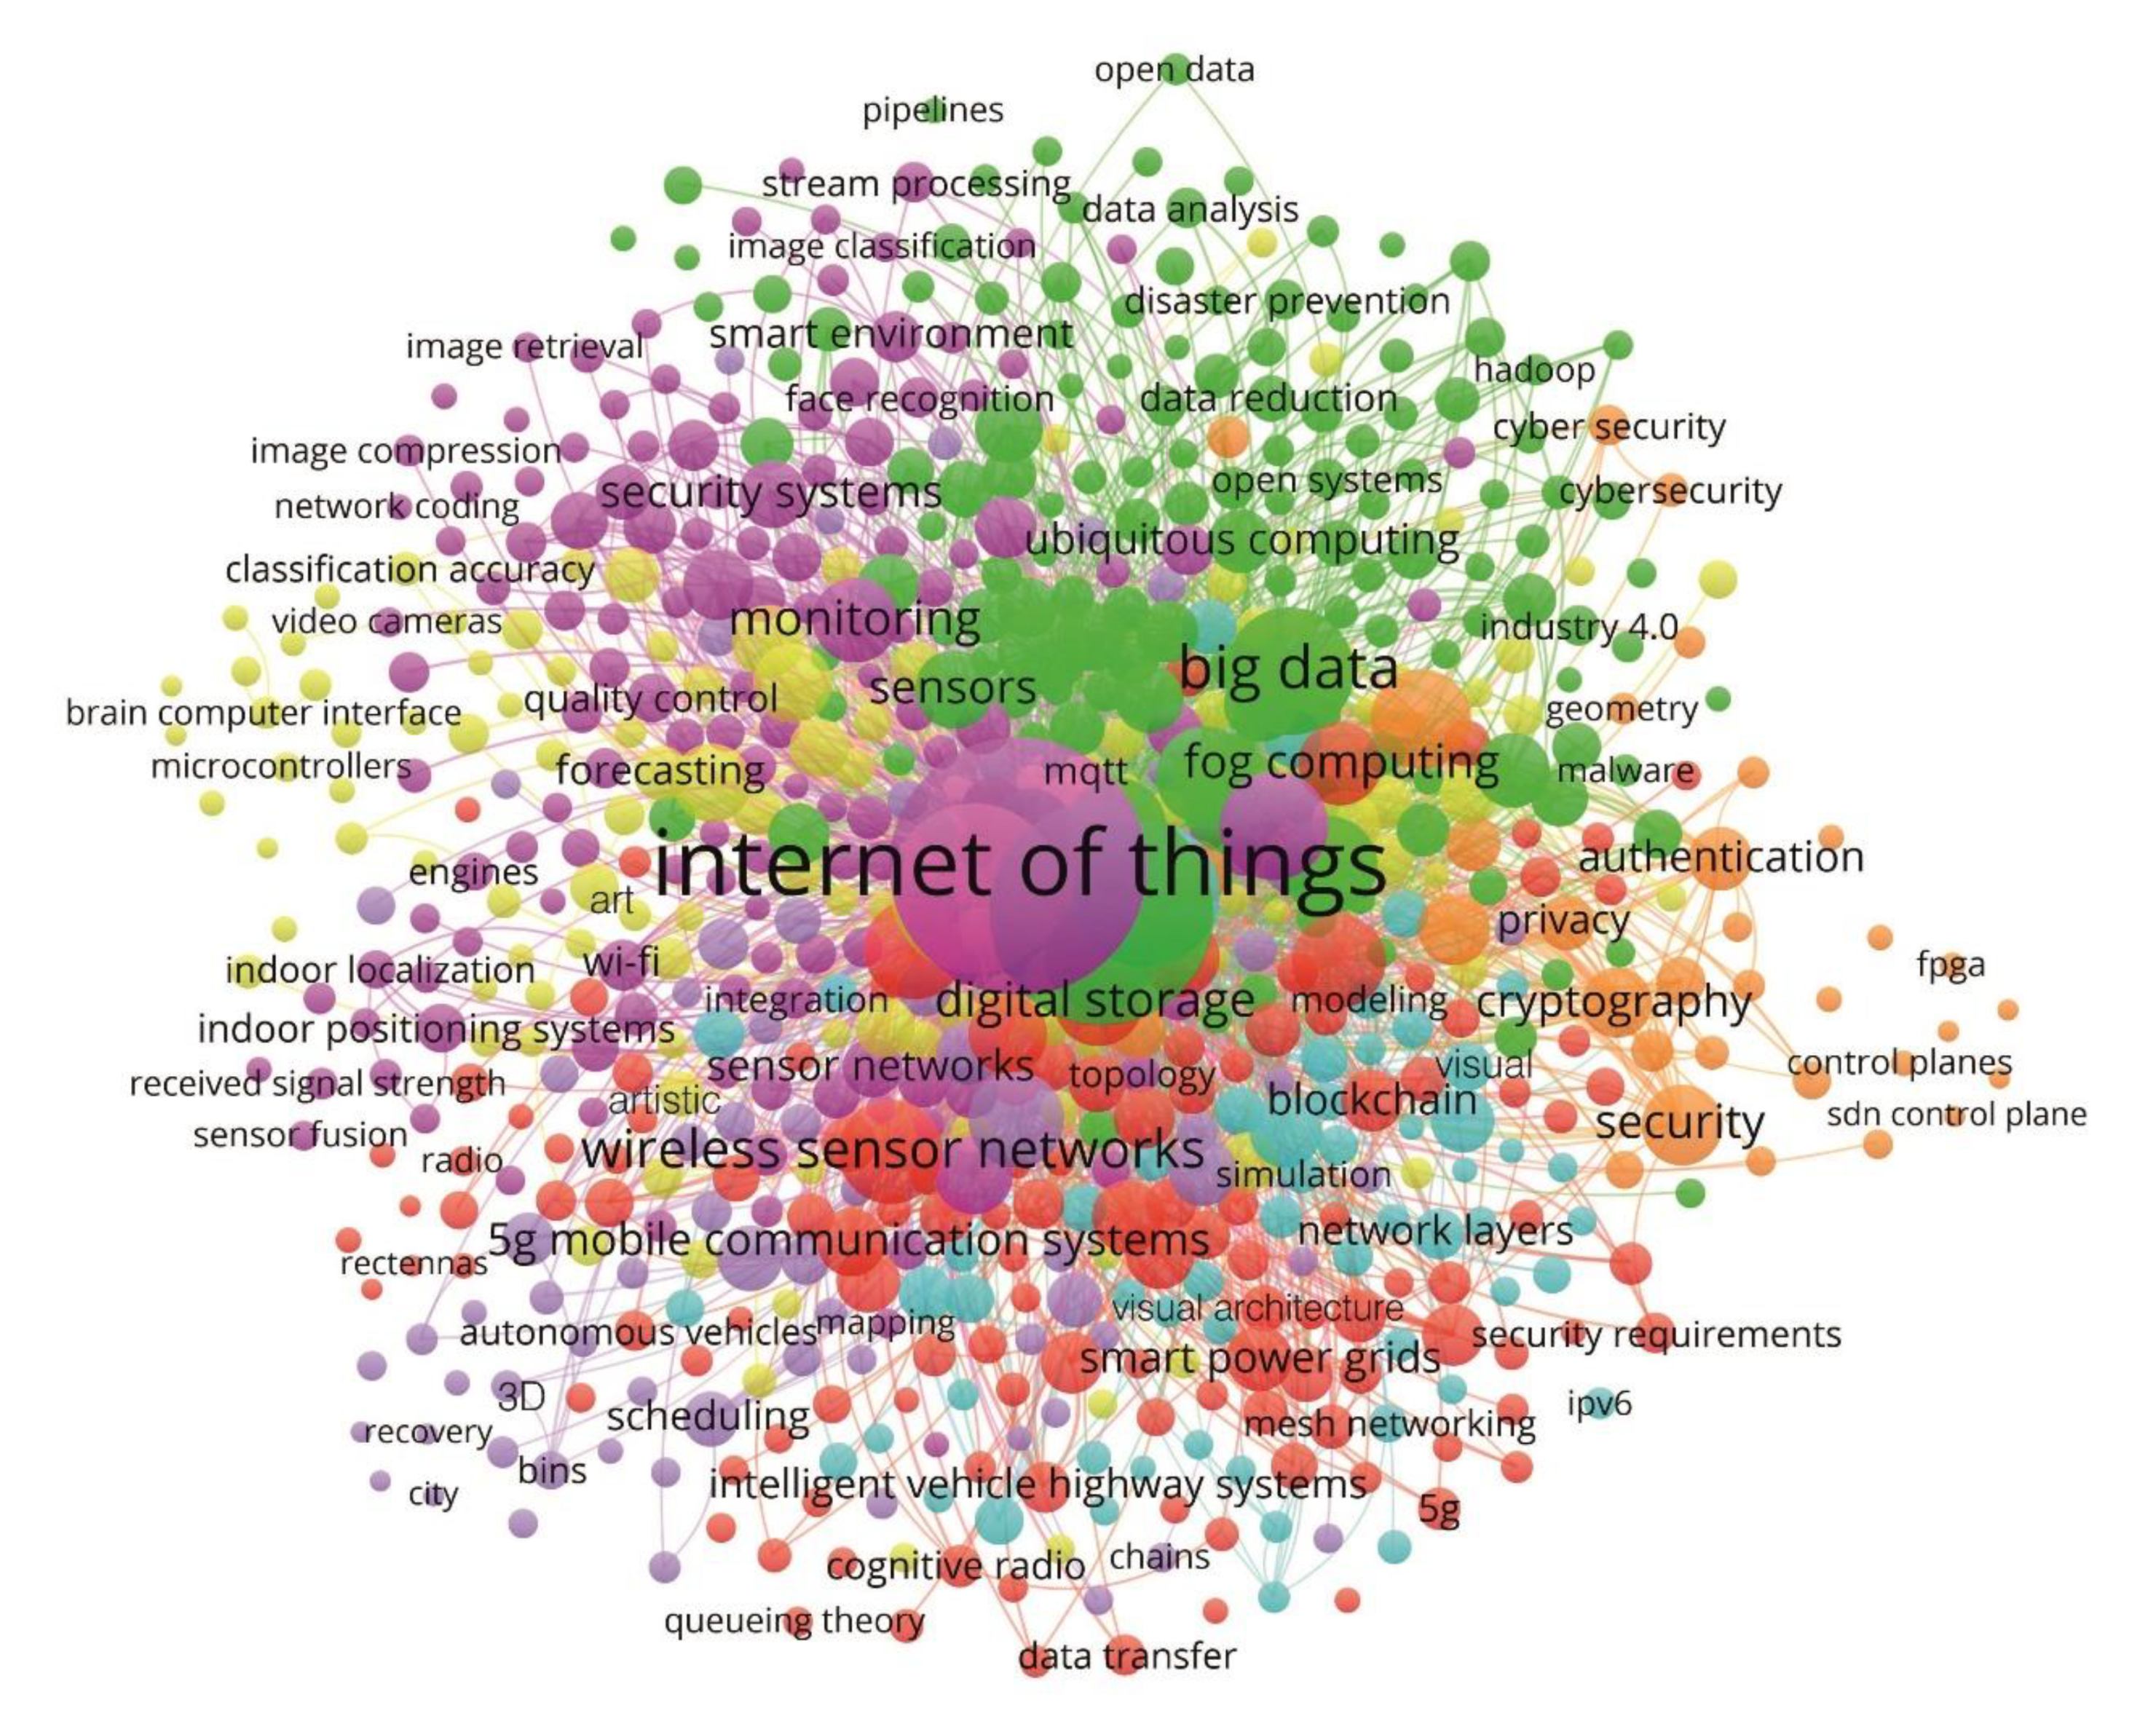
Figure 6 displays the network map for the keywords based on the co-occurrence method. Furthermore, the VOSviewer software identified seven main lines of research of the different keyword communities in visual and artistic effects of IoT in smart cities. The keyword with the highest number of articles within each cluster has allowed us to name and characterize the research axis on which the rest of the terms are associated.
These are “Internet of Things”, “smart city”, “wireless sensor networks”, “learning systems”, “Internet”, “wireless telecommunication systems”, and “cloud computing”. For each of the keywords, the occurrence attribute is revealed.
Cluster 1 (pink) is headed by “Internet of Things”, and groups 20.52% of the keywords. This is associated, among others, with network security, monitoring, sensor nodes, deep learning, security systems, middleware, IoT applications, sensor networks, neural networks, deep neural networks, virtual reality, information services, wireless networks, image processing, telecommunication services, Wi-Fi, digital devices, quality control, mobile computing, global positioning system, sensor data fusion, data fusion, data integration, energy efficient, network infrastructure, robots, testing, cooperative communication, mobile communication networks, multi-media communications, multicasting, device-to-device communications, received signal strength (RSS), indoor environment, surveillance video, network coding and image quality.
Cluster 2 (green) groups 19.94% and is headed by “smart city”. This term is linked to big data, automation, intelligent buildings, distributed computer systems, information management, data handling, sensors, computer architecture, data analytics, interoperability, semantics, ubiquitous computing, real time systems, application programs, urban growth, visualization, data visualization, smart homes, behavioral research, environmental monitoring, urban planning, proposed architectures, architecture, semantic Web, big data analytics, air quality, IoT architectures and smart home, among others.
Cluster 3 (red) is led by “wireless sensor networks”, and groups 18.08%. This is associated, among others, with energy efficiency, network architecture, digital storage, computing, edge computing, quality of service, intelligent systems, 5G mobile communication systems, vehicles, smart power grids, mobile telecommunication systems, electric power transmission networks, intelligent transportation systems, blockchain, smartphones, complex networks, cost effectiveness, vehicular ad hoc networks, transportation, real time processing, queueing networks, intelligent transportation system, multiobjective optimization, wireless sensor, electronic data interchange, next generation networks, distributed architecture, mobile security, performance evaluations, intelligent transport systems and Internet of vehicles, among others.
Cluster 4 (yellow) associates 17.50% and is headed by “learning systems”. This term is associated with machine learning, data mining, artificial intelligence, embedded systems, smart grid, information and communication technologies, learning algorithms, energy conservation, human computer interaction, forecasting, ecosystems, sustainability, population statistics, cyber physical system, energy management, classification (of information), augmented reality, clustering algorithms, efficiency, smart building, classification accuracy, context-awareness, reinforcement learning, building blocks, smart meters, Bayesian networks, analytics, Internet of things applications, building management system, intelligent services, electroencephalography, image segmentation, computational capability, mean square, brain computer interface, light emitting diodes, remote sensing, wearable devices and body sensor networks, among others.
Cluster 5 (purple) is led by “Internet” and groups 9.90%. This is associated with communication technologies, energy utilization, decision making, data acquisition, optimization, sustainable development, economics, waste management, sensor, sensors and actuators, multi agent systems, urban transportation, electronic commerce, design and implementations, urban environments, trees (mathematics), temperature sensors, real time, smart objects, computer programming, iterative methods, computer aided software engineering, network, structural health monitoring, urban development, dynamic scheduling, uncertainty analysis, priority journal, online systems, decision making process, constrained optimization and application requirements, among others.
Cluster 6 (cyan) is led by “wireless telecommunication systems”, and groups 8.46%. This is associated, among others, with, Internet protocols, communication technologies, radio frequency identification (rfid), low power electronics, network layers, data communication systems, wireless sensor network, security of data, Internet of Things technologies and network protocols, among others.
Finally, cluster 7 (orange) associates 4.74% and is headed by “cloud computing”. This cluster is associated, among others, with security, data privacy, cryptography, green computing, authentication, wireless communications, privacy, security and privacy, intrusion detection, computer crime, research challenges, cyber security, sensitive information, machine-to-machine communication, denial-of-service attack, intrusion detection systems, cybersecurity, public key cryptography, geometry and security and privacy issues.
Integrating visual and artistic effects to smart cities include having app designs for all audiences. Of great interest are those whose purpose is people with hearing dysfunction, who, by integrating videos and descriptive images and subtitles, can make relevant information about news or other topics of interest known to those who need it most. In this manner, it is observed that the identified research lines gather all the concepts related to the research topic. These lines of research include the different approaches analyzed by the distinct actors that make up this field of research.
3.4. Keyword Evolution
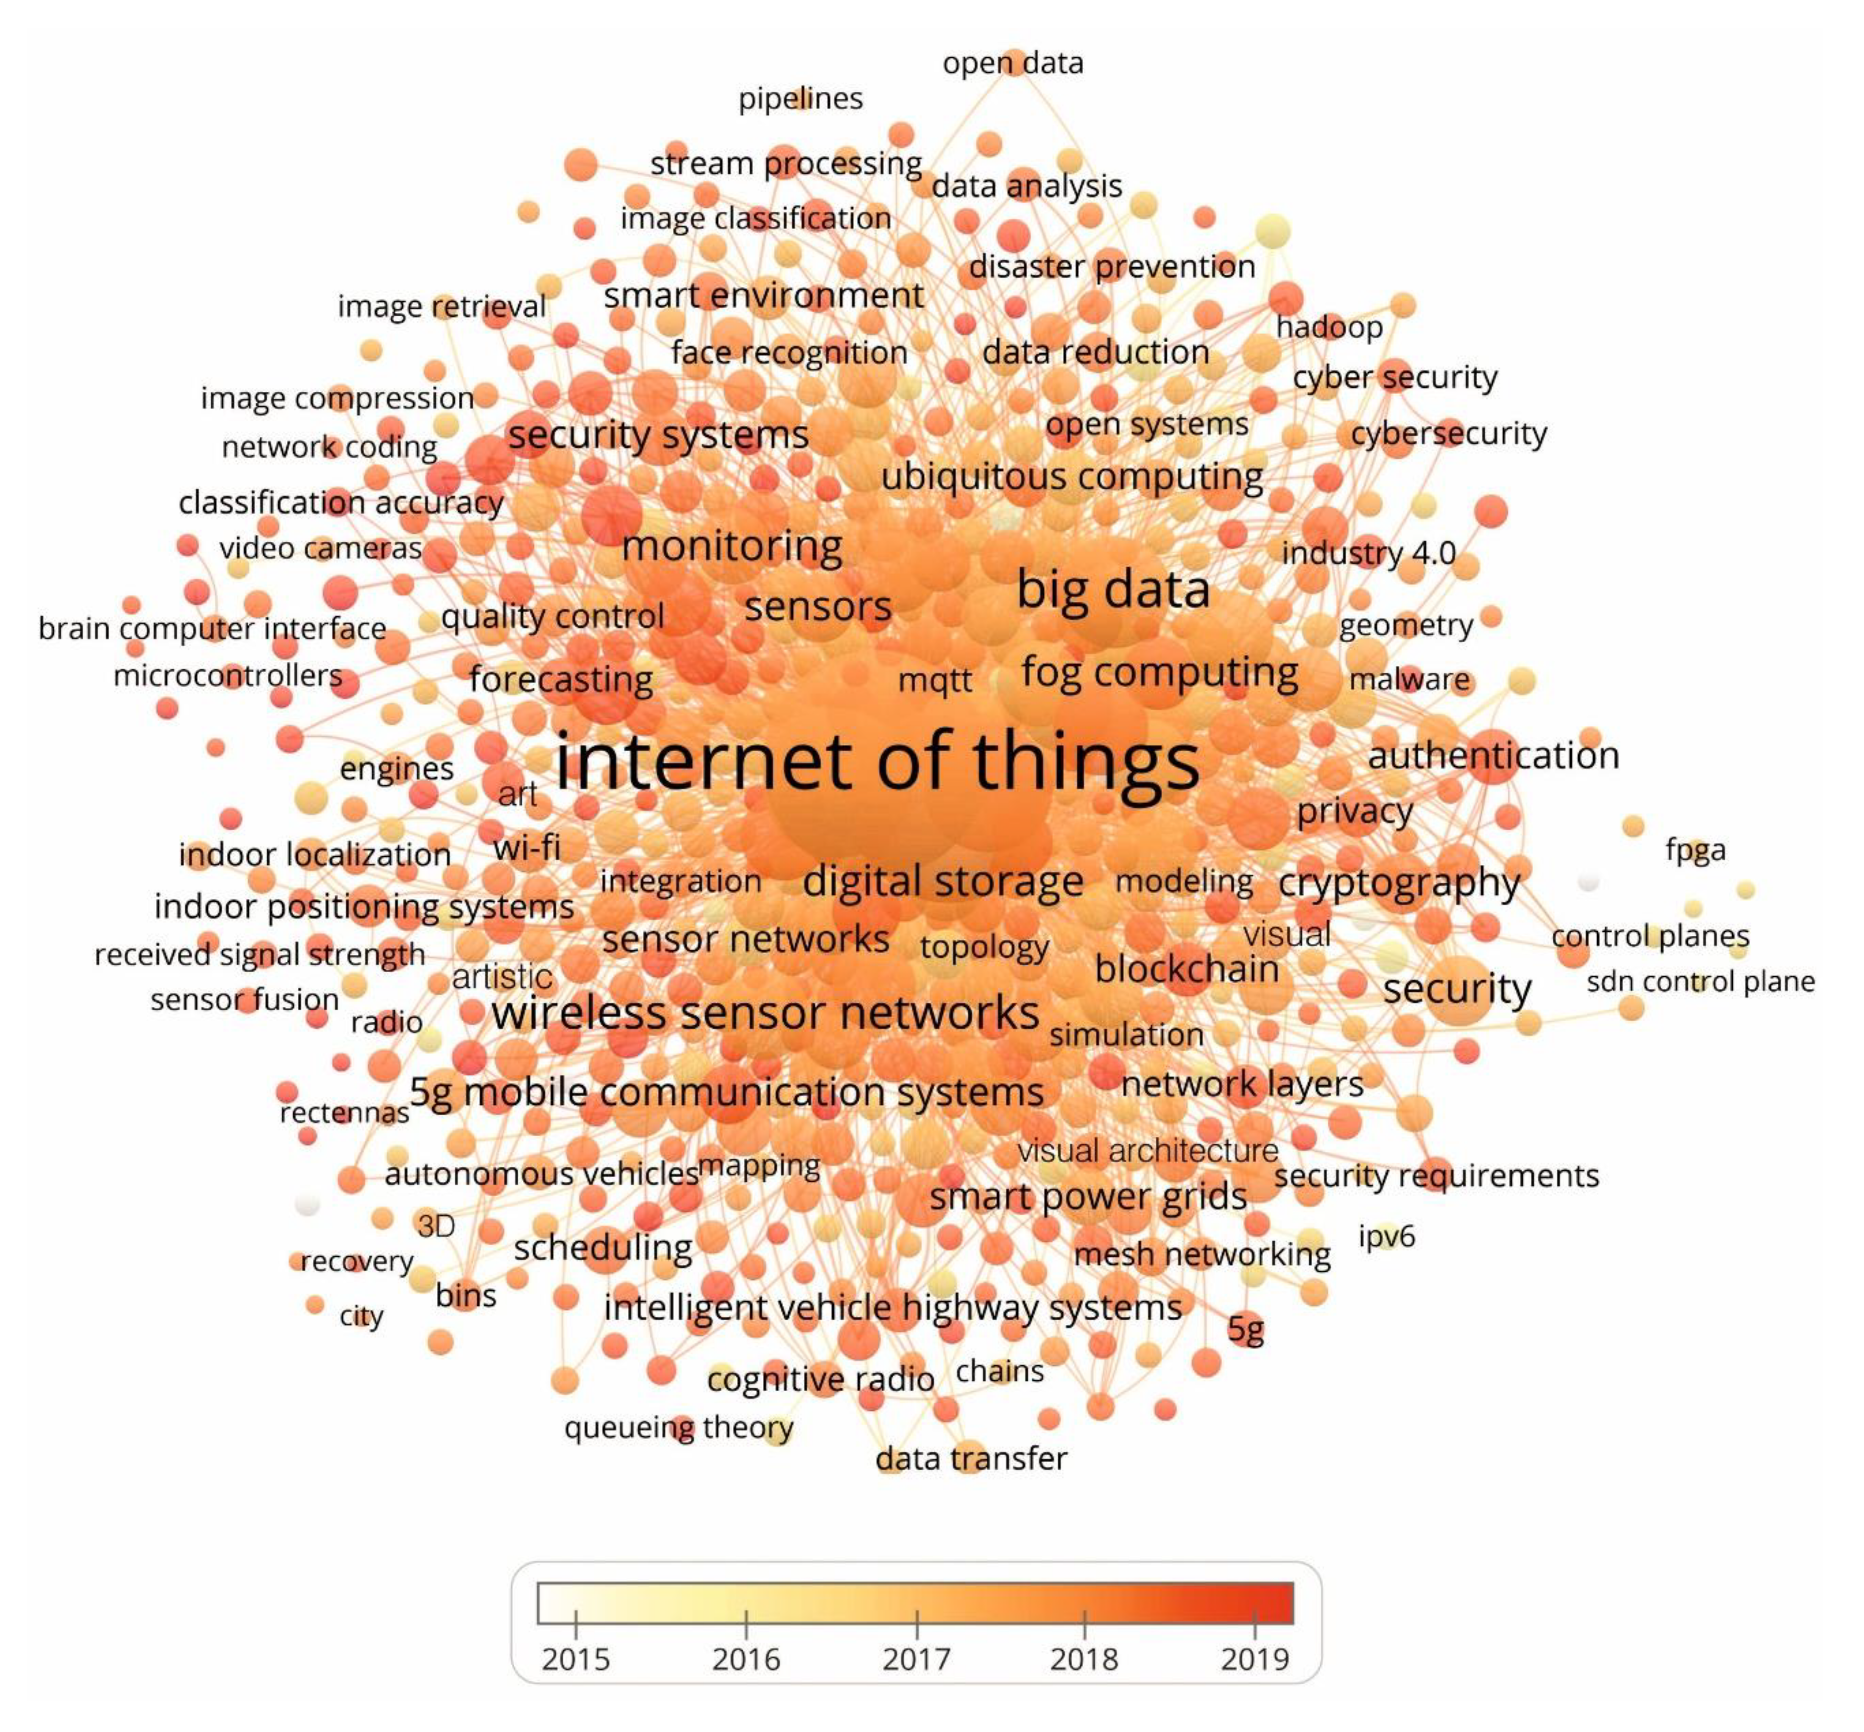
The evolution of the keywords linked to this research during the period examined is shown in Figure 7. The pioneering keywords are observed from the increase in published documents. Likewise, the progression and maturity of each cluster differentiated by the period in which each of the articles has been analyzed is observed. It is confirmed that there has been a breakthrough in terminology about IoT and visual and artistic effects in smart city research.
Additionally, in this evolution of keywords, Figure 7 shows that, from 2010 to mid-2016 (light color), the first keywords appear on this topic. As of mid-2017 (medium orange color), the group of pioneering terms that have advanced since 2018 (dark orange color) towards new terms and research and that have allowed the study of this topic to be formed are incorporated. The leading 15 keywords for this period are deep learning, neural networks, convolutional neural network, object detection, home health care, media streaming, optical character recognition, emerging technologies, extensive simulations computing architecture, data analysis, visual, art, 3d, artistic and visual architecture.
In the first stage, the analysis has mainly been devoted to the study of the application of AI in the visual effects in smart cities, in addition to extra-connectivity [3,50,51]. In this last period, the research focuses on the analysis of smart cities as a process that includes deep learning, IoT applications, and neural networks. Deep learning architectures have been employed to fields including computer vision, speech recognition, speech processing natural language, audio recognition, social media filtering, machines, etc. [52,53].
The high number of keywords allows one to confirm the variety of the developed research lines. Likewise, Figure 7 shows the keywords based on the moment in which they were linked to the topic. This allows us to observe that the pioneering keywords have been a reference for those that have been incorporated later, allowing for the development of this field of research [54,55,56].
Another advantageous effect that images offer in cities is related to expanding and improving the tourist experience by offering individualized information. Currently, the tourist requires audiovisual content and interacts digitally with the destination before, during and after their stay. In this way, the new pattern seeks to offer the traveler a more personalized service.
The city must create the conditions to take advantage of its full potential; a smart city and IoT technology can offer both citizens and tourists a comfortable and safe communication and information network with relevant content to interact with their mobile devices or also offer real-time information relevant to the trip, such as cultural offers, public services, maps, or information related to museums, creating an offer of digital content and a sales platform from a city app that provides personalized information according to different profiles.
3.5. Future Research Directions
At an international level, this theme continues to evolve from the scientific production of the different actors that make it up. Due to the development of research, new terms are incorporated that propose new schools of thought.
This research has detected the set of the latest concepts related to this topic; thus, this allows one to detect the new directions in the research. Based on the relevance of the terms provided by VOSviewer, five future lines of research have been detected:
- Machine learning: scientific area in the field of AI that generates systems that learn automatically. In this context, learning means identifying complex patterns in millions of items of data.
- Smart community: compared to large smart city projects, the smart community is presented as the basic unit for building a smart city. It is the concept of the community of software developers applied to the territory, that is, to the physical space.
- Sensor-Imitation Learning: imitative learning is a type of social learning whereby new behaviors are acquired through imitation. Imitation aids in communication, social interaction, and the ability to modulate one’s emotions to account for the emotions of others, and is essential for healthy sensorimotor development and social functioning.
- Green IoT: this is seen as the future of IoT that is friendly to the environment. The concept of reducing the energy consumption of IoT devices and making the environment safe is envisioned, inspired by achieving a sustainable environment for IoT.
- Systematic mapping: systematic mapping studies or scoping studies are designed to provide an overview of a research area through ranking and counting of contributions relative to the categories of that ranking.
The progress of the research allows recognizing various aspects related to the visual and artistic effects in smart cities. These focus on technological, sustainable, financial aspects and digital literacy to improve the understanding of the digital transformation process [57,58]. The visualization of specific elements provides information and news to the citizens of smart cities from the IoT system. The presence of open electronic platforms for prototyping for artists, designers, hobbyists, and anyone interested in creating interactive environments or objects, favors experimentation with visual effects. These flexible and easy-to-use software and hardware allow them to take information from the environment through the input pins of a wide range of sensors, thereby controlling lights, motors, and other actuators.
In this way, it seeks to offer a complete visual design environment to simplify and accelerate data preparation and modelling. The application of these technological resources to smart cities will be reflected in improvements in citizen services, sustainability in all its spheres and, ultimately, in people’s quality of life and in a more informed society [59,60,61].
4. Conclusions
The aim of this study was to examine the worldwide research on visual and artistic effects of IoT technology in smart cities during the 2010–2019 period. Bibliometric techniques have been applied to 1278 articles selected from the Scopus database. The evolution of the number of articles, the subject areas where they are classified, the journals where articles are published, the authors, the research institutions and the most productive countries/territories, and their collaborative relationships have been fundamentally identified. On the other hand, the research has made it possible to identify the main current and future lines of research.
The number of publications has increased especially in the last 3 years, where a total of 1089 articles have been published (85.21%), which confirms the worldwide relevance and impact of this research topic. This study has also detected the most influential subject areas where articles are classified. These were computer science, engineering and education sciences as a multidisciplinary field. On the other hand, the main journal in terms of the number of articles was a North American one, IEEE Access (114). The most prolific authors, affiliations and countries/territories linked their articles to the subject areas of computer science, engineering and education sciences.
The research lines observed to be developing worldwide refer to: (i) Internet of Things; (ii) smart cities; (iii) wireless sensor networks; (iv) learning systems; (v) Internet; (vi) wireless telecommunications systems; and (vii) cloud computing.
At an international level, research on this topic continues to evolve, which is why new directions in research have been detected: (i) machine learning; (ii) smart communities; (iii) sensor imitation learning; (iv) green IoT; and (v) systematic mapping. It seeks to work from the design and development of projects and electronic platforms that enhance citizen projection and its relationship with objects that allow interaction with an open technological world, increasing the practical and creative possibilities of the individual in terms of social and citizen evolution.
This study is not without limitations that have conditioned the results obtained, such as the Scopus database used to obtain the sample; the time horizon; and the applied bibliometric techniques. Finally, the development of this field of research has been detected from the clusters of authors, institutions, countries/territories and lines of research, and the intensity of their relationships. In this way, the results obtained are a complement to the knowledge about the visual and artistic effects of IoT systems in smart cities. Furthermore, these results allow one to determine the relationship between technology and the practical application that enables more information in the decision-making process.
Author Contributions
Conceptualization, methodology, software, formal analysis, resources, data curation and writing—original draft preparation; investigation, validation, writing—review and editing, supervision, funding acquisition, E.A.-S. and M.-D.G.-Z.; project administration, E.A.-S.; visualization, M.-D.G.-Z.; All authors have read and agreed to the published version of the manuscript.
Funding
The APC was funded by IoT—Open Access Journal.
Conflicts of Interest
The authors declare no conflict of interest.
References
- Kim, T.; Ramos, C.; Mohammed, S. Smart City and IoT. Future Gener. Comput. Syst. 2017, 76, 159–162. [Google Scholar] [CrossRef]
- Misra, S.; Mondal, A.; Khajjayam, S. Dynamic Big-Data Broadcast in Fat-Tree Data Center Networks with Mobile IoT Devices. IEEE Syst. J. 2019, 13, 2898–2905. [Google Scholar] [CrossRef]
- Austin, M.; Delgoshaei, P.; Coelho, M.; Heidarinejad, M. Architecting Smart City Digital Twins: Combined Semantic Model and Machine Learning Approach. J. Manag. Eng. 2020, 36, 04020026. [Google Scholar] [CrossRef]
- Park, J. Advances in Future Internet and the Industrial Internet of Things. Symmetry 2019, 11, 244. [Google Scholar] [CrossRef] [Green Version]
- Ferrag, M.A.; Maglaras, L.; Ahmim, A.; Derdour, M.; Janicke, H. RDTIDS: Rules and Decision Tree-Based Intrusion Detection System for Internet-of-Things Networks. Future Internet 2020, 12, 44. [Google Scholar] [CrossRef] [Green Version]
- Lass, S.; Gronau, N. A factory operating system for extending existing factories to Industry 4.0. Comput. Ind. 2020, 115, 103128. [Google Scholar] [CrossRef]
- Olabi, A.G. Circular economy and renewable energy. Energy 2019, 181, 450–454. [Google Scholar] [CrossRef]
- Moazami, A.; Carlucci, S.; Nik, V.M.; Geving, S. Towards climate robust buildings: An innovative method for designing buildings with robust energy performance under climate change. Energy Build. 2019, 202, 109378. [Google Scholar] [CrossRef]
- Lytras, M.; Visvizi, A. Who Uses Smart City Services and what to Make of it: Toward Interdisciplinary Smart Cities Research. Sustainability 2018, 10, 1998. [Google Scholar] [CrossRef] [Green Version]
- Chandrasekaran, Y.J.; Gunamony, S.L.; Chandran, B.P. Integration of 5G Technologies in Smart Grid Communication-A Short Survey. Int. J. Renew. Energy Dev. 2019, 8, 275–283. [Google Scholar] [CrossRef] [Green Version]
- Praharaj, S.; Han, H. Cutting through the clutter of smart city definitions: A reading into the smart city perceptions in India. Citycult. Soc. 2019, 18, 100289. [Google Scholar] [CrossRef]
- Hammons, R.; Myers, J. Smart Cities. IEEE Internet Things Mag. 2019, 2, 8–9. [Google Scholar] [CrossRef]
- González-Zamar, M.-D.; Abad-Segura, E.; Vázquez-Cano, E.; López-Meneses, E. IoT Technology Applications-Based Smart Cities: Research Analysis. Electronics 2020, 9, 1246. [Google Scholar] [CrossRef]
- Kravchenko, A. The Practical Side of IoT Implementation in Smart Cities. Intellect. Arch. 2019, 8, 15–18. [Google Scholar] [CrossRef]
- Montori, F.; Bedogni, L.; Di Felice, M.; Bononi, L. Machine-to-machine wireless communication technologies for the Internet of Things: Taxonomy, comparison and open issues. Pervasive Mob. Comput. 2018, 50, 56–81. [Google Scholar] [CrossRef]
- Kölsch, J.; Heinz, C.; Ratzke, A.; Grimm, C. Simulation-Based Performance Validation of Homomorphic Encryption Algorithms in the Internet of Things. Future Internet 2019, 11, 218. [Google Scholar] [CrossRef] [Green Version]
- Maskeliūnas, R.; Damaševičius, R.; Segal, S. A Review of Internet of Things Technologies for Ambient Assisted Living Environments. Future Internet 2019, 11, 259. [Google Scholar] [CrossRef] [Green Version]
- Abad-Segura, E.; González-Zamar, M.-D.; Luque-de la Rosa, A.; Morales Cevallos, M.B. Sustainability of Educational Technologies: An Approach to Augmented Reality Research. Sustainability 2020, 12, 4091. [Google Scholar] [CrossRef]
- Trček, D.; Trček, G. SonicLamination-from a concept to artistic binding of visual and sound domains by using advanced technology. Int. J. Arts Technol. 2019, 11, 219–229. [Google Scholar] [CrossRef]
- Aurigi, A.; Odendaal, N. From “Smart in the Box” to “Smart in the City”: Rethinking the Socially Sustainable Smart City in Context. J. Urban Technol. 2020, 1–16. [Google Scholar] [CrossRef]
- Bhandari, R.; Swapnil, R.; Nidhi, S.; Dhruvi, D.; Harsh, K. IoT based Smart City Bin. Int. J. Comput. Appl. 2020, 176, 26–29. [Google Scholar] [CrossRef]
- Caird, S. City approaches to smart city evaluation and reporting: Case studies in the United Kingdom. Urban Res. Pract. 2017, 11, 159–179. [Google Scholar] [CrossRef]
- Kretschmer, H.; Kretschmer, T.; Asundi, A.Y.; Ravichandra Rao, I.K. Dr. Eugene Garfield A humble Homage to a great information scientist. COLLNET J. Sci. Inf. Manag. 2017, 11, 5–10. [Google Scholar] [CrossRef] [Green Version]
- Abad-Segura, E.; González-Zamar, M.-D. Global Research Trends in Financial Transactions. Mathematics 2020, 8, 614. [Google Scholar] [CrossRef]
- López-Meneses, E.; Vázquez-Cano, E.; González-Zamar, M.-D.; Abad-Segura, E. Socioeconomic Effects in Cyberbullying: Global Research Trends in the Educational Context. Int. J. Environ. Res. Public Health 2020, 17, 4369. [Google Scholar] [CrossRef]
- Abad-Segura, E.; González-Zamar, M.-D.; Infante-Moro, J.C.; Ruipérez García, G. Sustainable Management of Digital Transformation in Higher Education: Global Research Trends. Sustainability 2020, 12, 2107. [Google Scholar] [CrossRef] [Green Version]
- Belmonte-Ureña, L.J.; Garrido-Cardenas, J.A.; Camacho-Ferre, F. Analysis of World Research on Grafting in Horticultural Plants. HortScience 2020, 55, 112–120. [Google Scholar] [CrossRef]
- Abad-Segura, E.; Cortés-García, F.J.; Belmonte-Ureña, L.J. The Sustainable Approach to Corporate Social Responsibility: A Global Analysis and Future Trends. Sustainability 2019, 11, 5382. [Google Scholar] [CrossRef] [Green Version]
- González-Zamar, M.-D.; Ortiz Jiménez, L.; Sánchez Ayala, A.; Abad-Segura, E. The Impact of the University Classroom on Managing the Socio-Educational Well-being: A Global Study. Int. J. Environ. Res. Public Health 2020, 17, 931. [Google Scholar] [CrossRef] [Green Version]
- Bornmann, L.; Haunschild, R.; Hug, S.E. Visualizing the Context of Citations Referencing Papers Published by Eugene Garfield: A New Type of Keyword Co-Occurrence Analysis. Scientometrics 2017, 114, 427–437. [Google Scholar] [CrossRef] [Green Version]
- Van Eck, N.J.; Waltman, L. Software survey: VOSviewer, a computer program for bibliometric mapping. Scientometrics 2009, 84, 523–538. [Google Scholar] [CrossRef] [PubMed] [Green Version]
- Levchaev, P.A.; Khezazna, B. Transformation of Management Technologies in the Digital Economy. Digit. Transform. 2019, 3, 39–47. [Google Scholar] [CrossRef] [Green Version]
- Ruggeri, G.; Loscrí, V.; Amadeo, M.; Calafate, C.T. The Internet of Things for Smart Environments. Future Internet 2020, 12, 51. [Google Scholar] [CrossRef] [Green Version]
- Xing, L. Reliability in Internet of Things: Current Status and Future Perspectives. IEEE Internet Things J. 2020, 7, 6704–6721. [Google Scholar] [CrossRef]
- Vera-Baceta, M.-A.; Thelwall, M.; Kousha, K. Web of Science and Scopus language coverage. Scientometrics 2019, 121, 1803–1813. [Google Scholar] [CrossRef]
- Stankovic, J.A. Research Directions for the Internet of Things. IEEE Internet Things J. 2014, 1, 3–9. [Google Scholar] [CrossRef]
- Vasudavan, H. A Review of Smart City Index’s Success Factors. J. Adv. Res. Dyn. Control. Syst. 2020, 12, 654–665. [Google Scholar] [CrossRef]
- Kumar, H.A.; Rakshith, J.; Shetty, R.; Roy, S.; Sitaram, D. Comparison of IoT Architectures Using A Smart City Benchmark. Procedia Comput. Sci. 2020, 171, 1507–1516. [Google Scholar] [CrossRef]
- Shushrutha, D.; Reddy, G.K. A Study on IoT Based Smart Garbage and Waste in Smart City. Int. J. Comput. Sci. Eng. 2020, 7, 629–631. [Google Scholar] [CrossRef]
- Montori, F.; Bedogni, L.; Fiandrino, C.; Capponi, A.; Bononi, L. Performance evaluation of hybrid crowdsensing systems with stateful CrowdSenSim 2.0 simulator. Comput. Commun. 2020, 161, 225–237. [Google Scholar] [CrossRef]
- Mahase, E. Covid-19: Trump threatens to stop funding WHO amid “China-centric” claims. BMJ 2020, 369, m1438. [Google Scholar] [CrossRef] [Green Version]
- Mahbub, M. A smart farming concept based on smart embedded electronics, internet of things and wireless sensor network. Internet Things 2020, 9, 100161. [Google Scholar] [CrossRef]
- Kumawat, D.V.; Umamaheswari, B. Internet of Things IoT Based Smart Environment Integrating Various Business Applications and Recent Research Directions. Int. J. Trend Sci. Res. Dev. 2019, 3, 422–425. [Google Scholar] [CrossRef] [Green Version]
- Badshah, A.; Ghani, A.; Ahsan Qureshi, M.; Shamshirband, S. Smart Security Framework for Educational Institutions using Internet of Things (IoT). Comput. Mater. Contin. 2019, 61, 81–101. [Google Scholar] [CrossRef]
- Gremban, K. IoT and “Smart” Technology. IEEE Internet Things Mag. 2019, 2, 2. [Google Scholar] [CrossRef]
- Minoli, D. Positioning of blockchain mechanisms in IoT-powered smart home systems: A gateway-based approach. Internet Things 2019, 10, 100147. [Google Scholar] [CrossRef]
- Fallis, E.; Spachos, P.; Gregori, S. A power-efficient audio acquisition system for smart city applications. Internet Things 2020, 9, 100155. [Google Scholar] [CrossRef]
- Ma, X.; Xue, H. Intelligent smart city parking facility layout optimization based on intelligent IoT analysis. Comput. Commun. 2020, 153, 145–151. [Google Scholar] [CrossRef]
- Hosahalli, D.; Srinivas, K.G. Cross-layer routing protocol for event-driven M2M communication in IoT-assisted Smart City Planning and Management: CWSN-eSCPM. IET Wirel. Sens. Syst. 2020, 10, 1–12. [Google Scholar] [CrossRef]
- Lynggaard, P.; Skouby, K. Complex IoT Systems as Enablers for Smart Homes in a Smart City Vision. Sensors 2016, 16, 1840. [Google Scholar] [CrossRef]
- Nam, K.; Dutt, C.S.; Chathoth, P.; Khan, M.S. Blockchain Technology for Smart City and Smart Tourism: Latest Trends and Challenges. Available online: https://0-www-tandfonline-com.brum.beds.ac.uk/doi/abs/10.1080/10941665.2019.1585376 (accessed on 27 February 2019).
- Rathore, P.; Rao, A.S.; Rajasegarar, S.; Vanz, E.; Gubbi, J.; Palaniswami, M. Real-time urban microclimate analysis using internet of things. IEEE Internet Things J. 2017, 5, 500–511. [Google Scholar] [CrossRef]
- Kohli, M.; Tiwari, R. IoT—An Exquisitely Adequate Technology to Reinforce the “City of Future—Smart City”. IJARCCE 2018, 7, 11–14. [Google Scholar] [CrossRef]
- Alam, M.K.; Ahmed, M.; Naz, F. Internet of Things Technologies for Smart Towns: A Remote System for Making Town Smart. Int. J. Trend Sci. Res. Dev. 2018, 2, 1366–1370. [Google Scholar] [CrossRef] [Green Version]
- Zhu, Y.; Zuo, J. Research on Security Construction of Smart City. Int. J. Smart Home 2015, 9, 197–204. [Google Scholar] [CrossRef] [Green Version]
- Allam, Z. The Emergence of Anti-Privacy and Control at the Nexus between the Concepts of Safe City and Smart City. Smart Cities 2019, 2, 96–105. [Google Scholar] [CrossRef] [Green Version]
- Park, M. Surface Display Technology for Biosensor Applications: A Review. Sensors 2020, 20, 2775. [Google Scholar] [CrossRef]
- Konovalova, T.A. The Perception of—A Smart City in Terms of Cognitive Interpretation on the Example of the Notion and Image of—A Smart City among Students (Future Architects). Int. J. Psychosoc. Rehabil. 2020, 24, 4954–4972. [Google Scholar] [CrossRef]
- Ghasemi, A.; Saberi, M. The key factors in transforming Birjand city to a smart city: Smart mobility, smart government. Indones. J. Electr. Eng. Comput. Sci. 2020, 19, 317. [Google Scholar] [CrossRef]
- Hoang Viet Bach, K.; Kim, S.-K. Towards Evaluation the Cornerstone of Smart City Development: Case Study in Dalat City, Vietnam. Smart Cities 2019, 3, 1–16. [Google Scholar] [CrossRef] [Green Version]
- Rocha, C.; Fernandes Narcizo, C.; Gianotti, E. Internet of Management Artifacts: Internet of Things Architecture for Business Model Renewal. Int. J. Innov. Technol. Manag. 2019, 16, 1950062. [Google Scholar] [CrossRef]
Figure 1.
Evolution of scientific activity in regard to the research on visual and artistic effects of IoT systems in smart cities (2010–2019).
Figure 1.
Evolution of scientific activity in regard to the research on visual and artistic effects of IoT systems in smart cities (2010–2019).

Figure 2.
Main subject areas of scientific production in regard to the research on visual and artistic effects of IoT systems in smart cities (2010–2019). Note: An article can be classified in more than one subject area.
Figure 2.
Main subject areas of scientific production in regard to the research on visual and artistic effects of IoT systems in smart cities (2010–2019). Note: An article can be classified in more than one subject area.

Figure 3.
Network of authors based on the co-authorship method (2010–2019).

Figure 4.
Network of research institutions based on the co-authorship method (2010–2019).

Figure 5.
Network of countries/territories based on the co-authorship method (2010–2019).

Figure 6.
Keywords network based on co-occurrence method (2010–2019).

Figure 7.
Evolution of keywords network based on the co-occurrence method (2010–2019).


Table 1.
Main journals of the scientific production of the research topic (2010–2019).
| Journal | A | Country | Subject Area | h * | CiteScore * | SJR * | SNIP * | 1A * | LA * |
|---|---|---|---|---|---|---|---|---|---|
| IEEE Access | 114 | USA | CS-EN-PA | 20 | 4.96 | 0.609 | 1.718 | 2015 | 2019 |
| IEEE Internet of Things Journal | 94 | USA | CS | 25 | 11.33 | 1.396 | 3.874 | 2014 | 2019 |
| Future Generation Computer Systems | 69 | Netherlands | CS | 25 | 6.30 | 0.835 | 2.464 | 2016 | 2019 |
| International Journal of Innovative Technology and Exploring Engineering | 36 | India | CS-EN | 1 | NA | NA | NA | 2019 | 2019 |
| International Journal of Recent Technology and Engineering | 32 | India | BMA-EN | 1 | NA | NA | NA | 2018 | 2019 |
| IEEE Communications Magazine | 28 | USA | CS-EN | 15 | 11.27 | 2.373 | 4.681 | 2013 | 2019 |
| International Journal of Engineering and Advanced Technology | 21 | India | CS | 2 | NA | 0.104 | 0.087 | 2019 | 2019 |
| Sustainability | 19 | Switzerland | EY-ES-SS | 7 | 3.01 | 0.549 | 1.169 | 2016 | 2019 |
| International Journal of Advanced Computer Science and Applications | 18 | UK | BGM-CH-EN-PA | 2 | NA | NA | 1.576 | 2013 | 2019 |
| Sustainable Cities and Society | 17 | Netherlands | EY-EN-SS | 9 | 5.22 | 1.100 | 1.745 | 2017 | 2019 |
A: number of articles; CS: computer science; EN: engineering; BMA: business, management and accounting; EY: energy; ES: environmental science; SS: social sciences; BGM: biochemistry, genetics and molecular biology; CH: chemistry; PA: physics and astronomy; h: h-index or Hirsch index; CiteScore: CiteScore metric (2019); SJR: Scimago Journal Rank (2019); SNIP: source normalized impact per paper (2019); 1A: first article; LA: last article; NA: not available; (*) in this research topic.
© 2020 by the authors. Licensee MDPI, Basel, Switzerland. This article is an open access article distributed under the terms and conditions of the Creative Commons Attribution (CC BY) license (http://creativecommons.org/licenses/by/4.0/).
Share and Cite
MDPI and ACS Style
González-Zamar, M.-D.; Abad-Segura, E. Visual and Artistic Effects of an IoT System in Smart Cities: Research Flow. IoT 2020, 1, 161-179. https://0-doi-org.brum.beds.ac.uk/10.3390/iot1020011
AMA Style
González-Zamar M-D, Abad-Segura E. Visual and Artistic Effects of an IoT System in Smart Cities: Research Flow. IoT. 2020; 1(2):161-179. https://0-doi-org.brum.beds.ac.uk/10.3390/iot1020011
Chicago/Turabian StyleGonzález-Zamar, Mariana-Daniela, and Emilio Abad-Segura. 2020. "Visual and Artistic Effects of an IoT System in Smart Cities: Research Flow" IoT 1, no. 2: 161-179. https://0-doi-org.brum.beds.ac.uk/10.3390/iot1020011