Article

Molecular Docking and Molecular Dynamics Simulation Studies of Quinoline-3-Carboxamide Derivatives with DDR Kinases–Selectivity Studies towards ATM Kinase

by
Srimadhavi Ravi
1,
Bhanu Priya
2,†,
Pankaj Dubey
1,†,
Vijay Thiruvenkatam
2,3,* and
Sivapriya Kirubakaran
1,*
1
Chemistry, Indian Institute of Technology Gandhinagar, Palaj Campus, Gujarat 382355, India
2
Biological Engineering, Indian Institute of Technology Gandhinagar, Palaj Campus, Gujarat 382355, India
3
Physics, Indian Institute of Technology Gandhinagar, Palaj Campus, Gujarat 382355, India
*
Authors to whom correspondence should be addressed.
These authors contributed equally to this work.
Submission received: 23 February 2021 / Revised: 1 April 2021 / Accepted: 6 April 2021 / Published: 11 April 2021
(This article belongs to the Special Issue Molecular Docking in Drug Discovery)

Abstract

:
Quinoline-3-carboxamides are an essential class of drug-like small molecules that are known to inhibit the phosphatidylinositol 3-kinase-related kinases (PIKK) family kinases. The quinoline nitrogen is shown to bind to the hinge region of the kinases, making them competitive inhibitors of adenosine triphosphate (ATP). We have previously designed and synthesized quinoline-3-carboxamides as potential ataxia telangiectasia mutated (ATM) kinase inhibitors to function as an adjuvant treatment with DNA damaging agents. This article discusses the molecular docking studies performed with these derivatives with the DNA damage and response (DDR) kinases-ATM, ataxia telangiectasia and rad3 related (ATR), and DNA dependent protein kinase catalytic subunit (DNA-PKcs) and highlights their selectivity towards ATM kinase. Docking studies were also performed with mTOR and PI3Kγ, which are close homologs of the DDR kinases. Molecular dynamics simulations were performed for one of the inhibitors against all the enzymes to establish the stability of the interactions involved. Finally, the absorption, distribution, metabolism, and excretion (ADME) properties of the inhibitors were predicted using the QikProp manual in Maestro. In conclusion, the molecules synthesized showed high selectivity towards the ATM kinase in comparison with the other kinases, though the sequence similarity between them was relatively high.

1. Introduction

Synthesizing selective inhibitors for kinases belonging to the same family can be challenging, owing to the similarity in their sequences. One such family is the phosphatidylinositol 3-kinase-related kinases (PIKK) family of kinases, which comprises the DNA damage and response (DDR) pathway of kinases [1,2]. These kinases play a crucial role in mediating the detection and repair of damages imposed on DNA, thereby helping in the faithful transfer of genetic information from the parent cell to the daughter cell [3,4]. On the other hand, cancer cells exploit these kinases to repair their DNA damages, thereby eluding cell death. It is known that radiotherapy and most of the chemotherapeutic agents destroy cancer cells by causing DNA damage. Thus, the overexpression of the DDR kinases in cancer cells creates resistance to DNA damaging treatments [5,6,7]. Therefore, it is essential that these kinases are inhibited to avoid resistance towards the existing modes of treatment.
The three major kinases involved in the DDR pathway are the ataxia telangiectasia mutated (ATM), the ataxia telangiectasia and rad3 related (ATR), and the DNA dependent protein kinase catalytic subunit (DNA-PKcs) [1]. These three kinases belong to the PIKK family, along with the mammalian target of rapamycin (mTOR), the suppressor of morphogenesis in genitalia (SMG1), and the transformation/transcription domain-associated protein (TRRAP) [8,9]. We aimed to inhibit the ATM kinase, since it is involved in DNA double-stranded break (DSB) repair. On inhibiting ATM kinase, the DSBs remain unrepaired, causing genomic instability and finally leading to cell death [10,11,12,13].
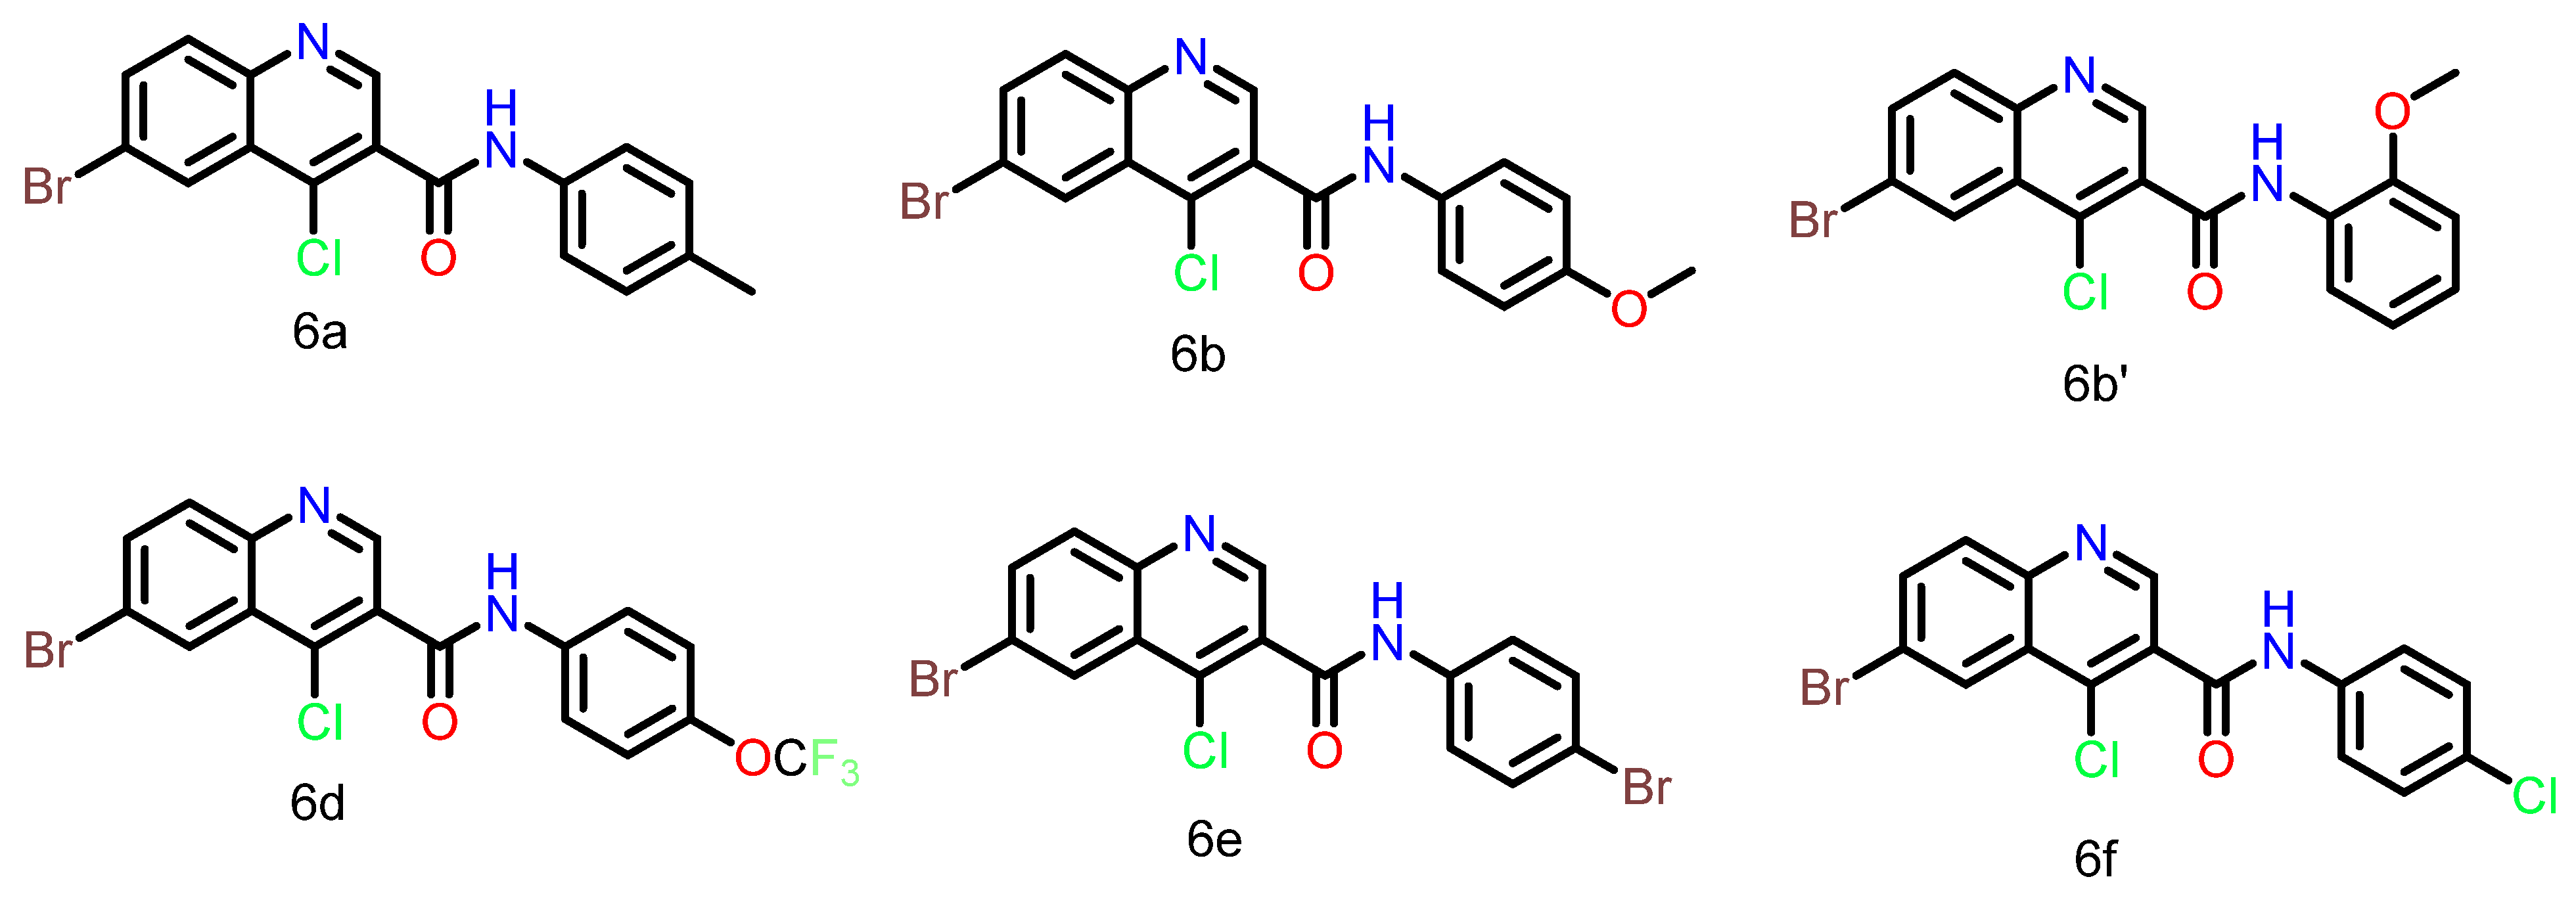
We had designed and synthesized quinoline-3-carboxamide derivatives for the targeting of the ATM kinase [14]. The synthesized inhibitors were tested for their cytotoxicity against cancer cell lines like HCT116, MDA-MB-468, and MDA-MB-231. KU60019, a known ATM kinase inhibitor, was used as the positive control. The structures of some of the synthesized compounds are shown in Figure 1, and Table 1 illustrates the GI50 (µM) values of the compounds. Structure–activity relationship (SAR) studies were carried out for compound 6b by synthesizing its regioisomers. The results suggested that when the -OCH3 is at the para position, the molecule has the best activity. Additionally, we have also done the molecular docking and molecular dynamics (MD) simulation studies for PI3Kγ, since it is also a close homologue of the ATM kinase [15].
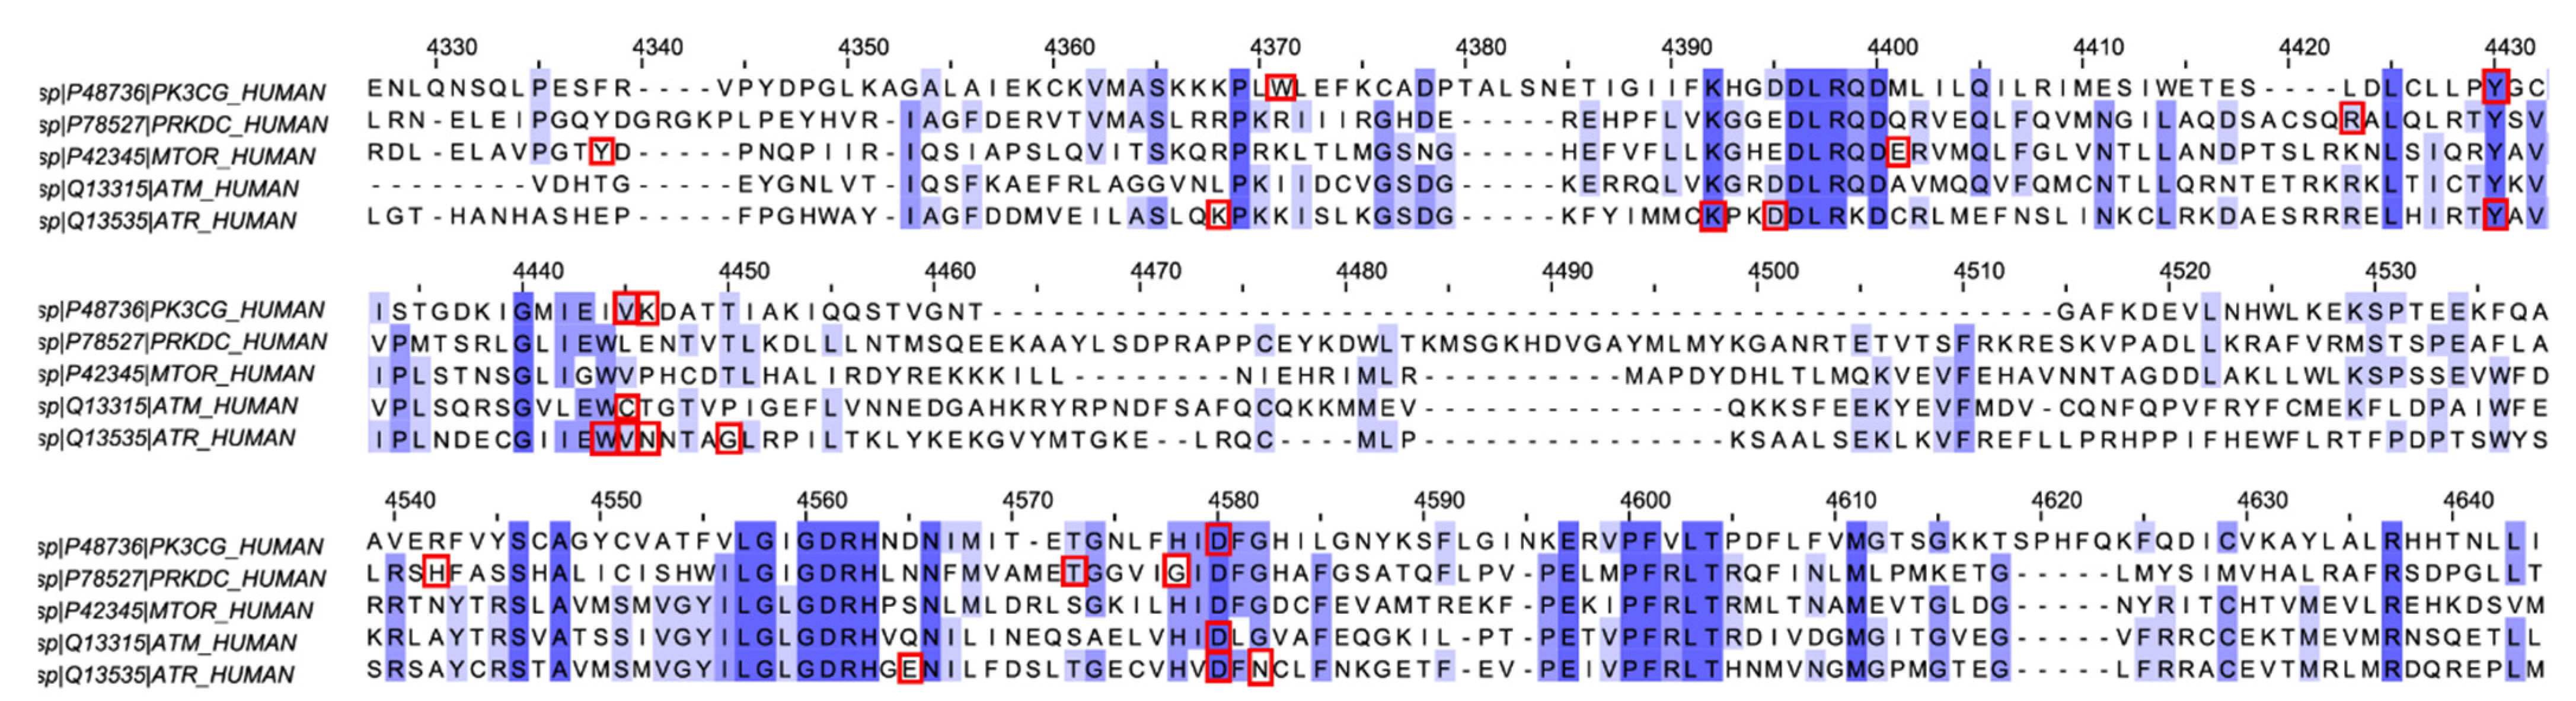
The kinase domain of ATM, ATR, DNA-PKcs, mTOR, and PI3Kγ share 25–40% of similarity in their sequence. Therefore, we decided to carry out molecular docking analysis for the synthesized molecules against all the mentioned kinases. In this article, we report the molecular docking and molecular dynamics simulation (MD simulation) studies of the synthesized molecules against the kinases of the DDR pathway (ATM, ATR, and DNA-PKcs), mTOR and PI3Kγ. The multiple sequence alignment (MSA) analysis for the proteins was also performed. Compound 6f showed the highest docking score against ATM, and thus, MD simulation was performed for the same with all the mentioned proteins. QikProp analysis was also done using Maestro 12.6 to quantify the absorption, distribution, metabolism, and excretion (ADME) properties of the molecules. The properties were all in the agreeable region. Finally, a brief analysis of the selectivity of the molecules towards the ATM kinase was also accomplished using the values obtained from the XP Visualizer module of Maestro 12.6.

2. Materials and Methods

A Swiss modeling tool was used to model the structure of the kinase domain of DNA-PKcs. The template used to model DNA-PKcs was 7k0y.1, which corresponds to the Cryo-EM structure of the activated form of DNA-PK (complex VI) [16]. The model was validated using the Ramachandran plot. The kinase domains of ATM and ATR were used from previously available data [14,17]. The protein data bank (PDB) files for mTOR and PI3Kγ are 5WBY and 5G55, respectively [14,17]. Molecular docking and the QikProp studies for all the synthesized inhibitors (Figure 1) were performed using Maestro 12.6 (Schrödinger, LLC, New York, NY, 2020). Molecular dynamics simulations were performed using NAMD 2.13 [18]. The key features of the proteins are highlighted in Table S1 in the Supplementary Materials.

Tools and Software

Molecular docking and image generation—Maestro 12.6 (Schrödinger, LLC, New York, NY, USA, 2020).
MD simulation and image generation—NAMD 2.13 and VMD, respectively.
Plot generation for RMSD—Origin 2017. Origin 9.4. (OriginLab Corp., Northampton, MA, USA).
MSA analysis and image generation—Clustal Omega and Jalview.

3. General Procedure

3.1. Molecular Docking

Protein structures and crystal structures, both modeled (details of the proteins included in Table 2), were subjected to the protein preparation module to fix the structural defects in the basic structures and make them compatible for further applications. The structures of the ligands were sketched using 2D Sketcher, and they were then subjected to the LigPrep module to obtain their energy minimized forms. Following this, SiteMap analysis was performed on every protein to identify the best druggable site. The best druggable site came out to be either the hinge region (where ATP binds) and/or a site in proximity to the hinge region. Thus, the best druggable site was chosen for every protein of interest for docking analysis.
Further on, the 3D space where the docking was to be performed was confined to the site obtained. This was carried out in the receptor grid generation module. The ligands were docked in the grid generated using the outputs received from the LigPrep. The docking scores, penalties and rewards were analyzed in the XP Visualizer platform. Additionally, the LigPrep output file was subjected to ADME analysis by using the QikProp module.

3.2. Molecular Dynamics Simulation

Molecular dynamics simulations were performed on ATM, ATR, PI3Kγ, DNA-PKcs, and mTOR. The docked structures of the protein with an inhibitor were taken as a starting point for simulations. Simulations were conducted in a periodic water box for 100 ns using the CHARMM36 force field the and NAMD package version 2.13. The force field for ligands was generated from the CHARMM-GUI server. The water box (including 150 mM NaCl) was created by adding water for 20 Å in the positive and negative x, y, and z directions around the protein, yielding a cuboidal box. LJ cutoff was defined at a distance of 12 Å, with a switching distance of 10 Å. Long-range electrostatic interactions were handled using the particle mesh Ewald (PME) method. Before the production run, the systems were minimized for 5000 steps using a conjugate gradient algorithm. The simulations were performed in an NPT ensemble; the temperature and the pressure of the system were fixed at 300 K and 1 bar, respectively, using a Langevin thermostat and barostat. Post simulation analyses were performed using VMD (root-mean square deviation (RMSD) and secondary structure timeline analyses) [19].

3.3. Multiple Sequence Alignment Analysis

Multiple sequence alignment (MSA) of the kinase domains of the ATM(Q13315), ATR(Q13535), DNA-PKcs(P78527), mTOR(P42345), and PI3Kγ(P48736) proteins were performed using Clustal Omega [20]. The sequence of the kinase domain of the proteins was taken for analysis from the UniProt database. The results of Clustal Omega were further analyzed using Jalview software (version 2.11.1.4) [21].

4. Results

4.1. Molecular Docking Studies

Prior to performing molecular docking, we carried out the in silico analysis of the pharmacokinetic properties of the synthesized small molecules (Figure 1). This highlighted some of the critical parameters (like bioavailability and the aqueous solubility of the molecules). Table 3 lists some of the vital ADME properties of the molecules. As evident from the table, the values for the selected properties were well within range, and the molecules showed an excellent percentage of human oral absorption.
After performing the ADME analysis, we carried out the docking studies for the molecules. Table 4 displays the docking score of the molecules with all the proteins of interest. From Table 4, it can be concluded that all of the molecules have a significantly lower docking score with ATM compared to those of other proteins (the more negative the docking score, the better the binding). Since molecule 6f had the highest docking score against ATM, the docking poses of 6f with ATM, ATR, DNA-PKcs, mTOR, and PI3Kγ are illustrated in Figure 2. Similar docking poses of the ligands for all the proteins have been attached in the Supplementary Materials (Figures S1–S5). The π-π stacking interactions, halogen bonding, hydrogen bonding, and aromatic hydrogen bonding are the typical interactions being observed. Further analysis in order to understand the differences in the docking scores was carried out using MD simulations and reward/penalty analysis.
The interactions of molecule 6f with ATM, ATR, mTOR, DNA−PKcs, and PI3Kγ are abridged in Table 5. Similar tables for all the ligands with the remaining proteins have been added in the Supplementary Materials (Tables S1–S5). As seen from Table 5, either tyrosine or tryptophan is shown to have π−π stacking interaction in all four proteins, except for DNA−PKcs, which exhibited only aromatic hydrogen bonding with the ligand. MD simulation analyses to establish the stability of the protein−6f complexes have been performed, and the stabilities of the most common interactions between the proteins and compound 6f were also analyzed.

4.2. Molecular Dynamics Simulation

Molecular dynamics simulation was performed to provide insight into the protein−ligand stability and protein structural flexibility of the docked complexes. The simulations for the 6f−bound forms of ATM, ATR, DNA−PKcs, mTOR, and PI3Kγ were carried out using the docked structure as a starting geometry. Figure 3a shows the RMSD value of the protein−ligand, protein, and ligand for ATM−6f complex. The visual analysis of the protein−ligands and protein trajectory confirms that the protein’s secondary structure is stable throughout the simulation (100 ns). Figure 3b presents the timeline analysis secondary structure of ATM protein during the simulation, and it was observed that the secondary structure does not show a significant variation protein throughout the simulations. However, some protein regions manifest structural fluctuation and interchange from one form to another in the simulation process, thus adding to the RMSD value observed (Figure 3b). In the ATM−6f complex, the critical binding site residue (Tyr (73) and Asp (207)) exhibits a coil structure and does show fluctuation in the simulation process. The ligand’s RMSD value shows periodic fluctuations, as shown in Figure 3a, due to conformational switching owing to the rotation of the amide N−C (benzene) bond (Figure 3d).
The RMSD and secondary structure timeline analysis for ATR−6f, DNA−PKcs−6f, and mTOR−6f complexes are shown in Figures S6–S8 (Supplementary Materials). In all three cases, the trajectory analysis suggests that the protein was stable during simulations. Likewise, the secondary structure analysis (frame by frame) showed that the secondary structure remains the same for most of the proteins’ regions (all three). Simultaneously, some flexible regions manifest secondary structure changes and thus contribute to the global RMSD of the protein. Interestingly, the RMSD of the ligand (6f) in all these cases shows similar behavior to that of those observed in the ATM−6f complex (i.e., a periodic fluctuation in the RMSD value resulted because of the conformational switching due to the rotation around amide N−C bond (Figure 3d)).
For the PI3Kγ−6f complex, the trajectory analysis suggests that the protein is stable throughout the simulation (Figure 4a). Moreover, the RMSD value was observed to be in the range of 2.5 Å, half of that observed in other protein−6f complexes. The secondary structure timeline analysis suggests that the secondary structure of the protein remains the same during the simulation, with some minor fluctuations. The trajectory visualization of the ligand (6f) shows a nearly constant RMSD throughout the simulation process, unlike the other protein−6f complexes, wherein periodic fluctuations of the ligand RMSD were observed, as discussed above. A constant ligand RMSD in the case of the PI3Kγ−6f complex suggests no conformational switching of the ligand during simulations. The observation is opposite to that seen in other protein−ligand complexes, where conformational interconversion was seen due to free rotation around the amide N−C bond (Figure 3d). The restriction in the free rotation could possibly be due to the rigid packing of the inhibitor−binding site and, hence, an enhanced energy barrier of free rotation around the amide N−C bond of the ligand.

4.3. Multiple Sequence Alignment (MSA) Analysis

MSA analysis was conducted to understand the differences in docking score of all the synthesized inhibitors with the proteins under consideration. These proteins share an amino acid sequence similarity of 25−40% in their kinase domain. MSA analysis helped us to understand the conservation of residue across all the proteins. Furthermore, it also gave us an idea of whether the inhibitors are causing an interaction with the conserved or the nonconserved residue in the protein. Though all the proteins share a good sequence similarity, they have differences in preference for the druggable site in their kinase domain. The result showed us that most of the interactions made by the inhibitors do not target the conserved residues of all the mentioned proteins (Figure 5). There is a difference in the inhibitor binding sites and the type of interactions for all the proteins with the ligands. This variance might be one of the key reasons contributing to the differences in their binding affinity. This was shown in the docking and MD simulation studies for all the proteins with the inhibitor 6f.

5. Discussion

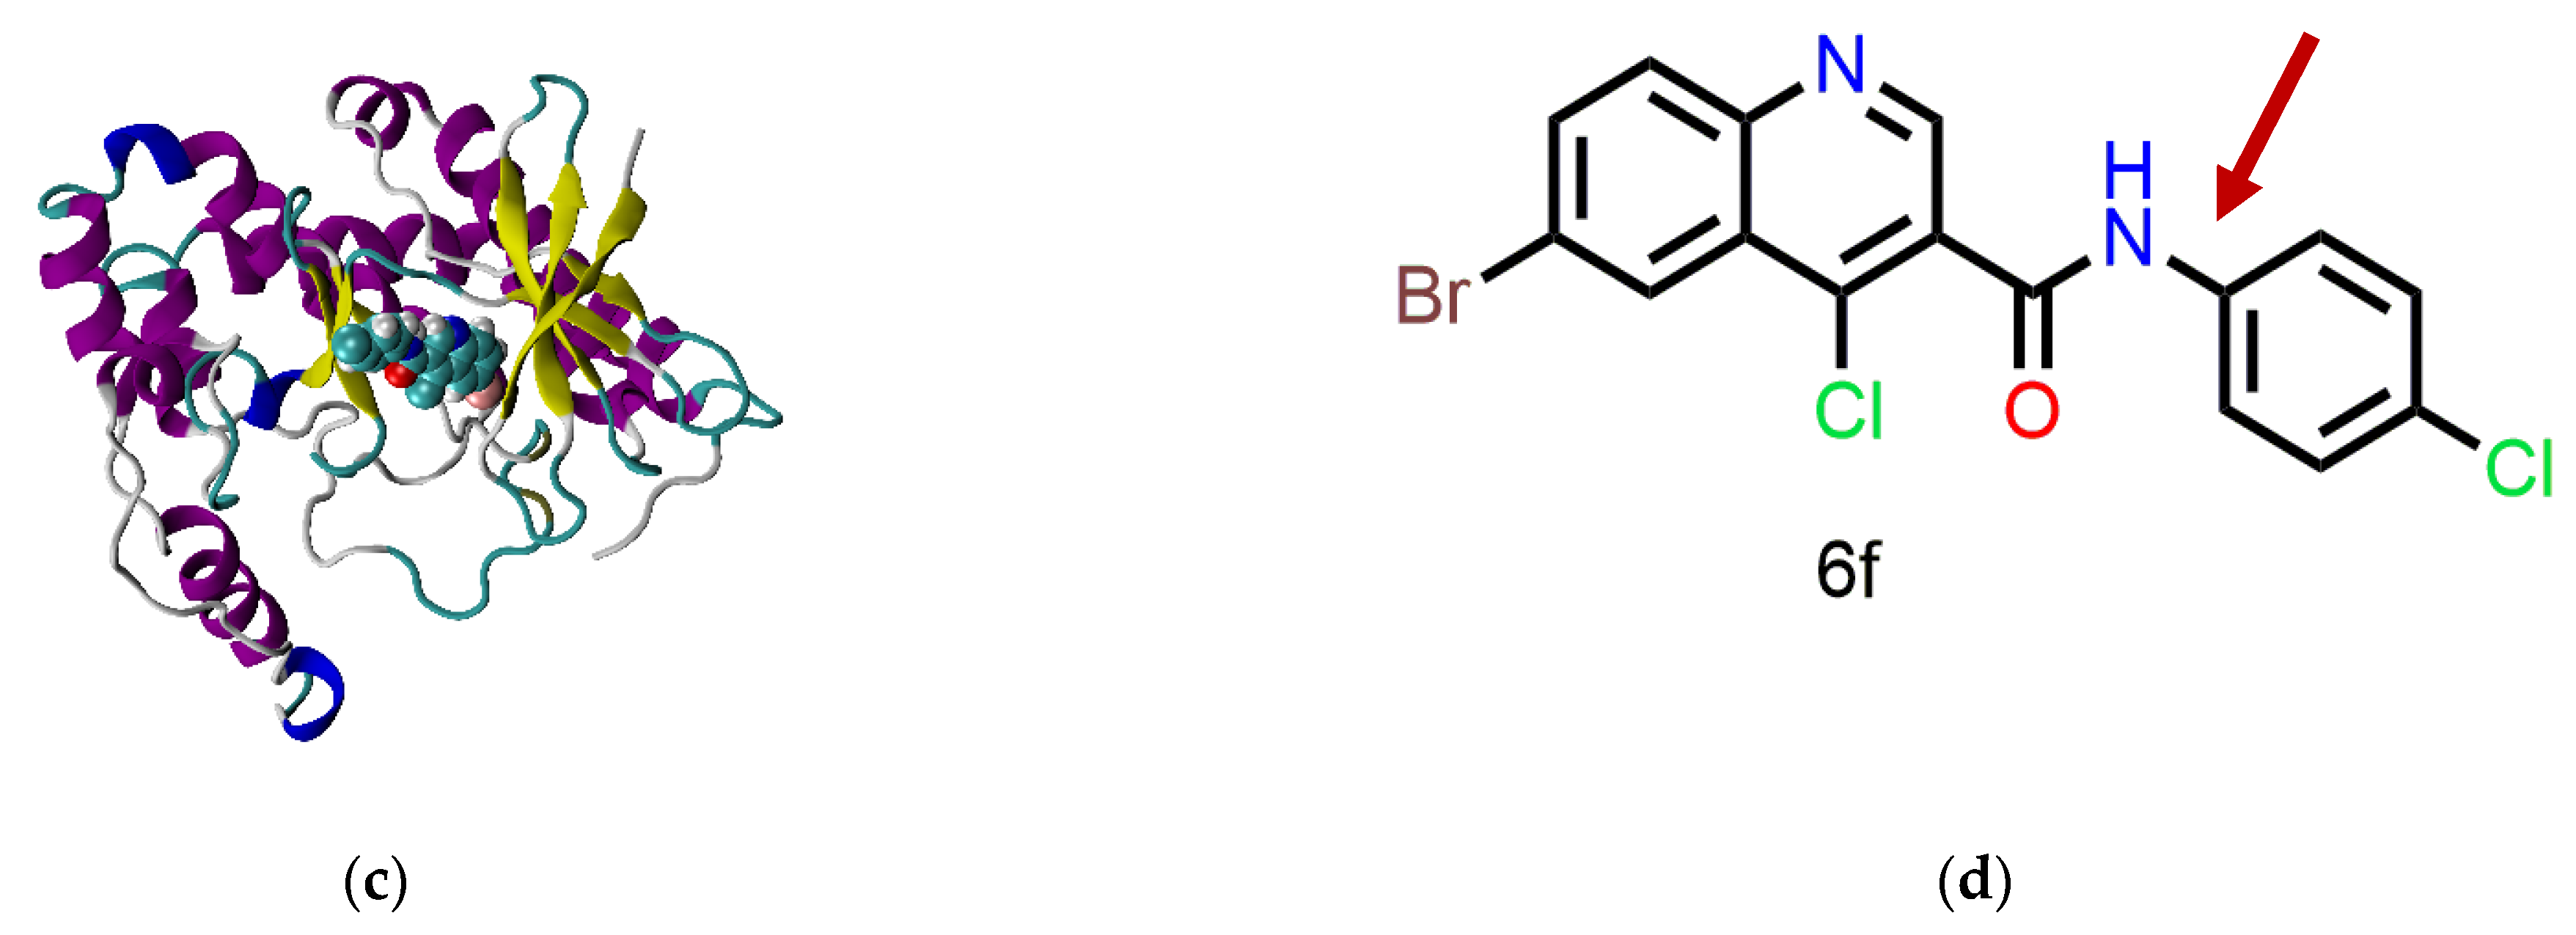
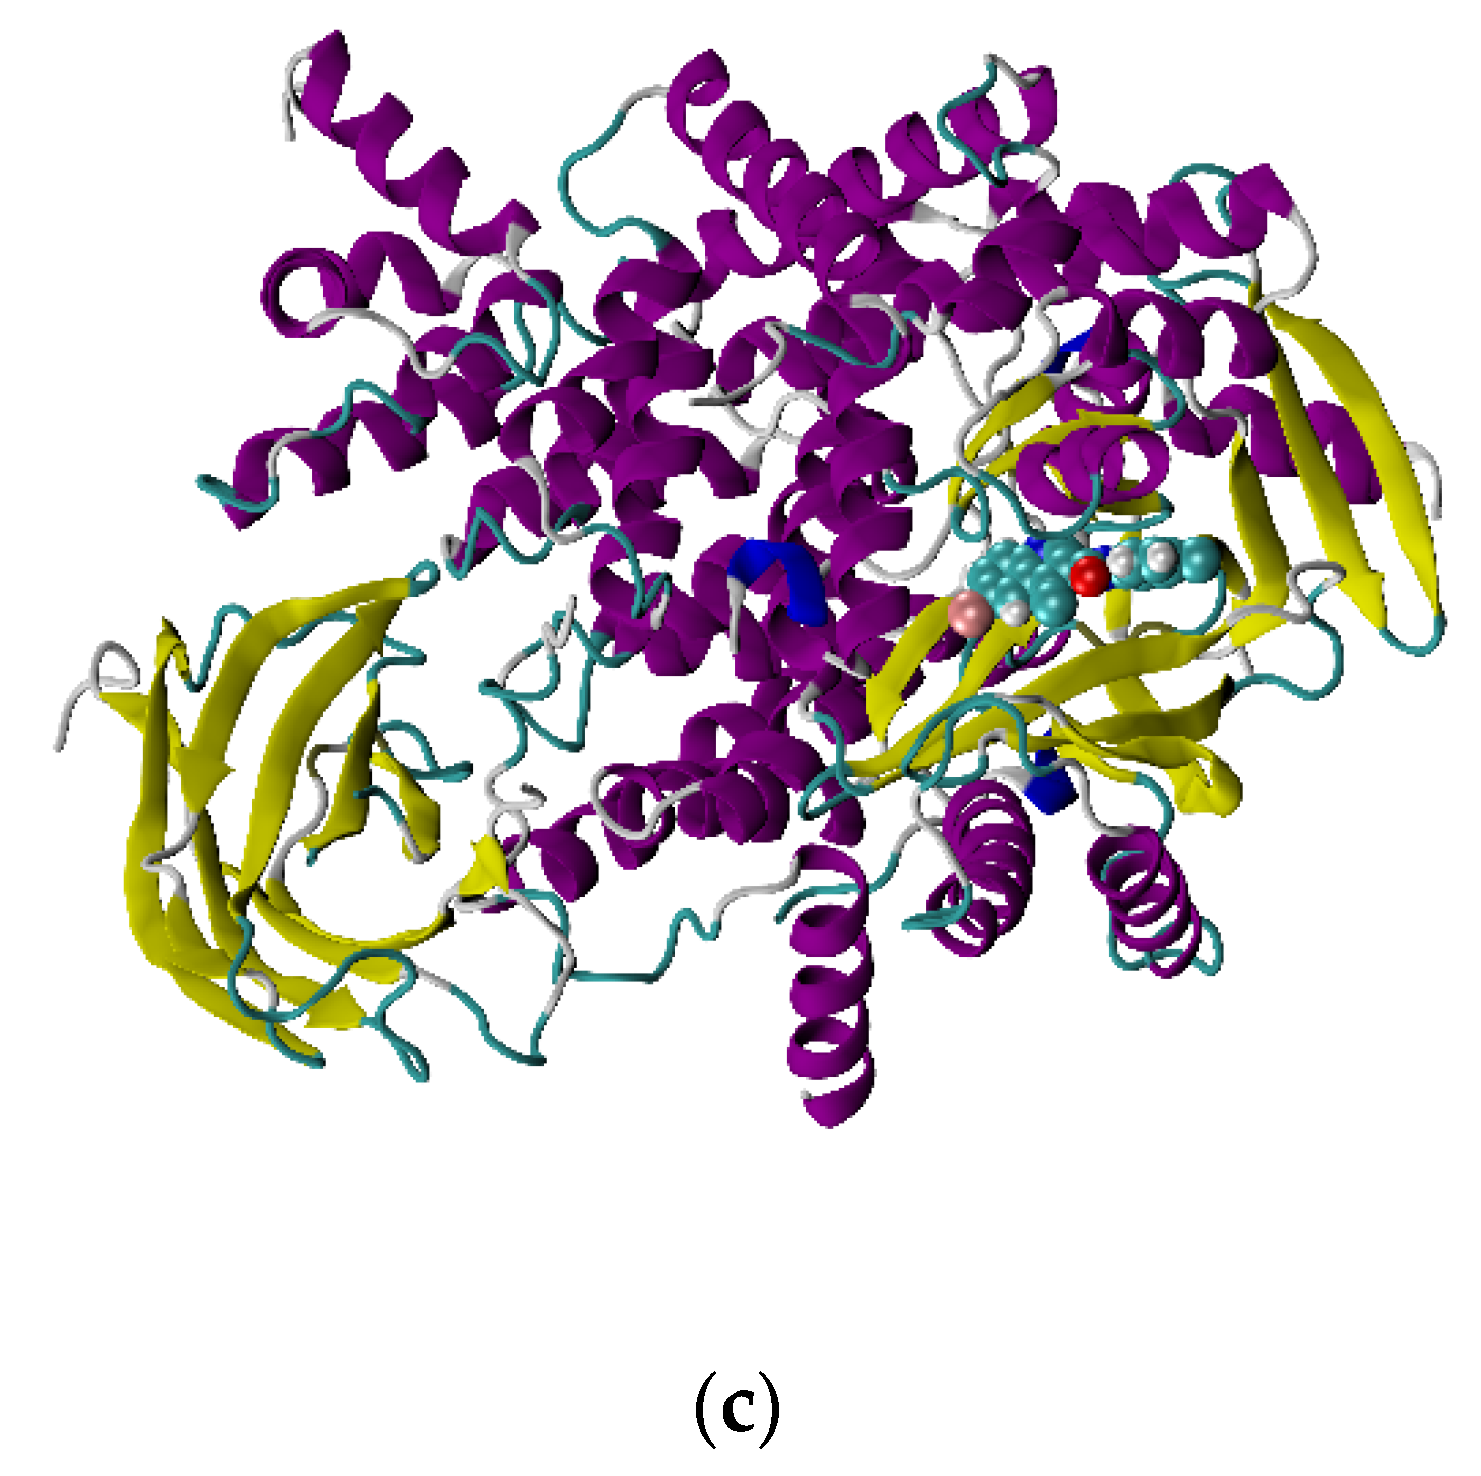
From the docking poses of 6f with ATM and PI3Kγ in Figure 2, it is evident that PI3Kγ makes better contact with the ligand. However, the docking score for all the ligands is higher than those for ATM. Analyzing the values of the rewards and penalties obtained from the XP visualizer panel of Maestro yielded a possible cause for the molecules to have a better binding affinity towards ATM. Table 6 gives a comparison of both the rewards and penalties for ATM and PI3Kγ. Similarly, the penalties and rewards for the remaining three proteins with 6f have been included in Table S6 in the Supplementary Materials. Even though the rewards for the protein−ligand Van der Waal energy and hydrogen bond interactions that are hydrophobically packed are almost similar for these two proteins, the penalties for buried polar atoms, intraligand contacts, and exposed hydrophobic ligand groups are much higher for PI3Kγ. Therefore, the ligands are more stabilized when interacting with ATM, leading to a significantly higher docking score.
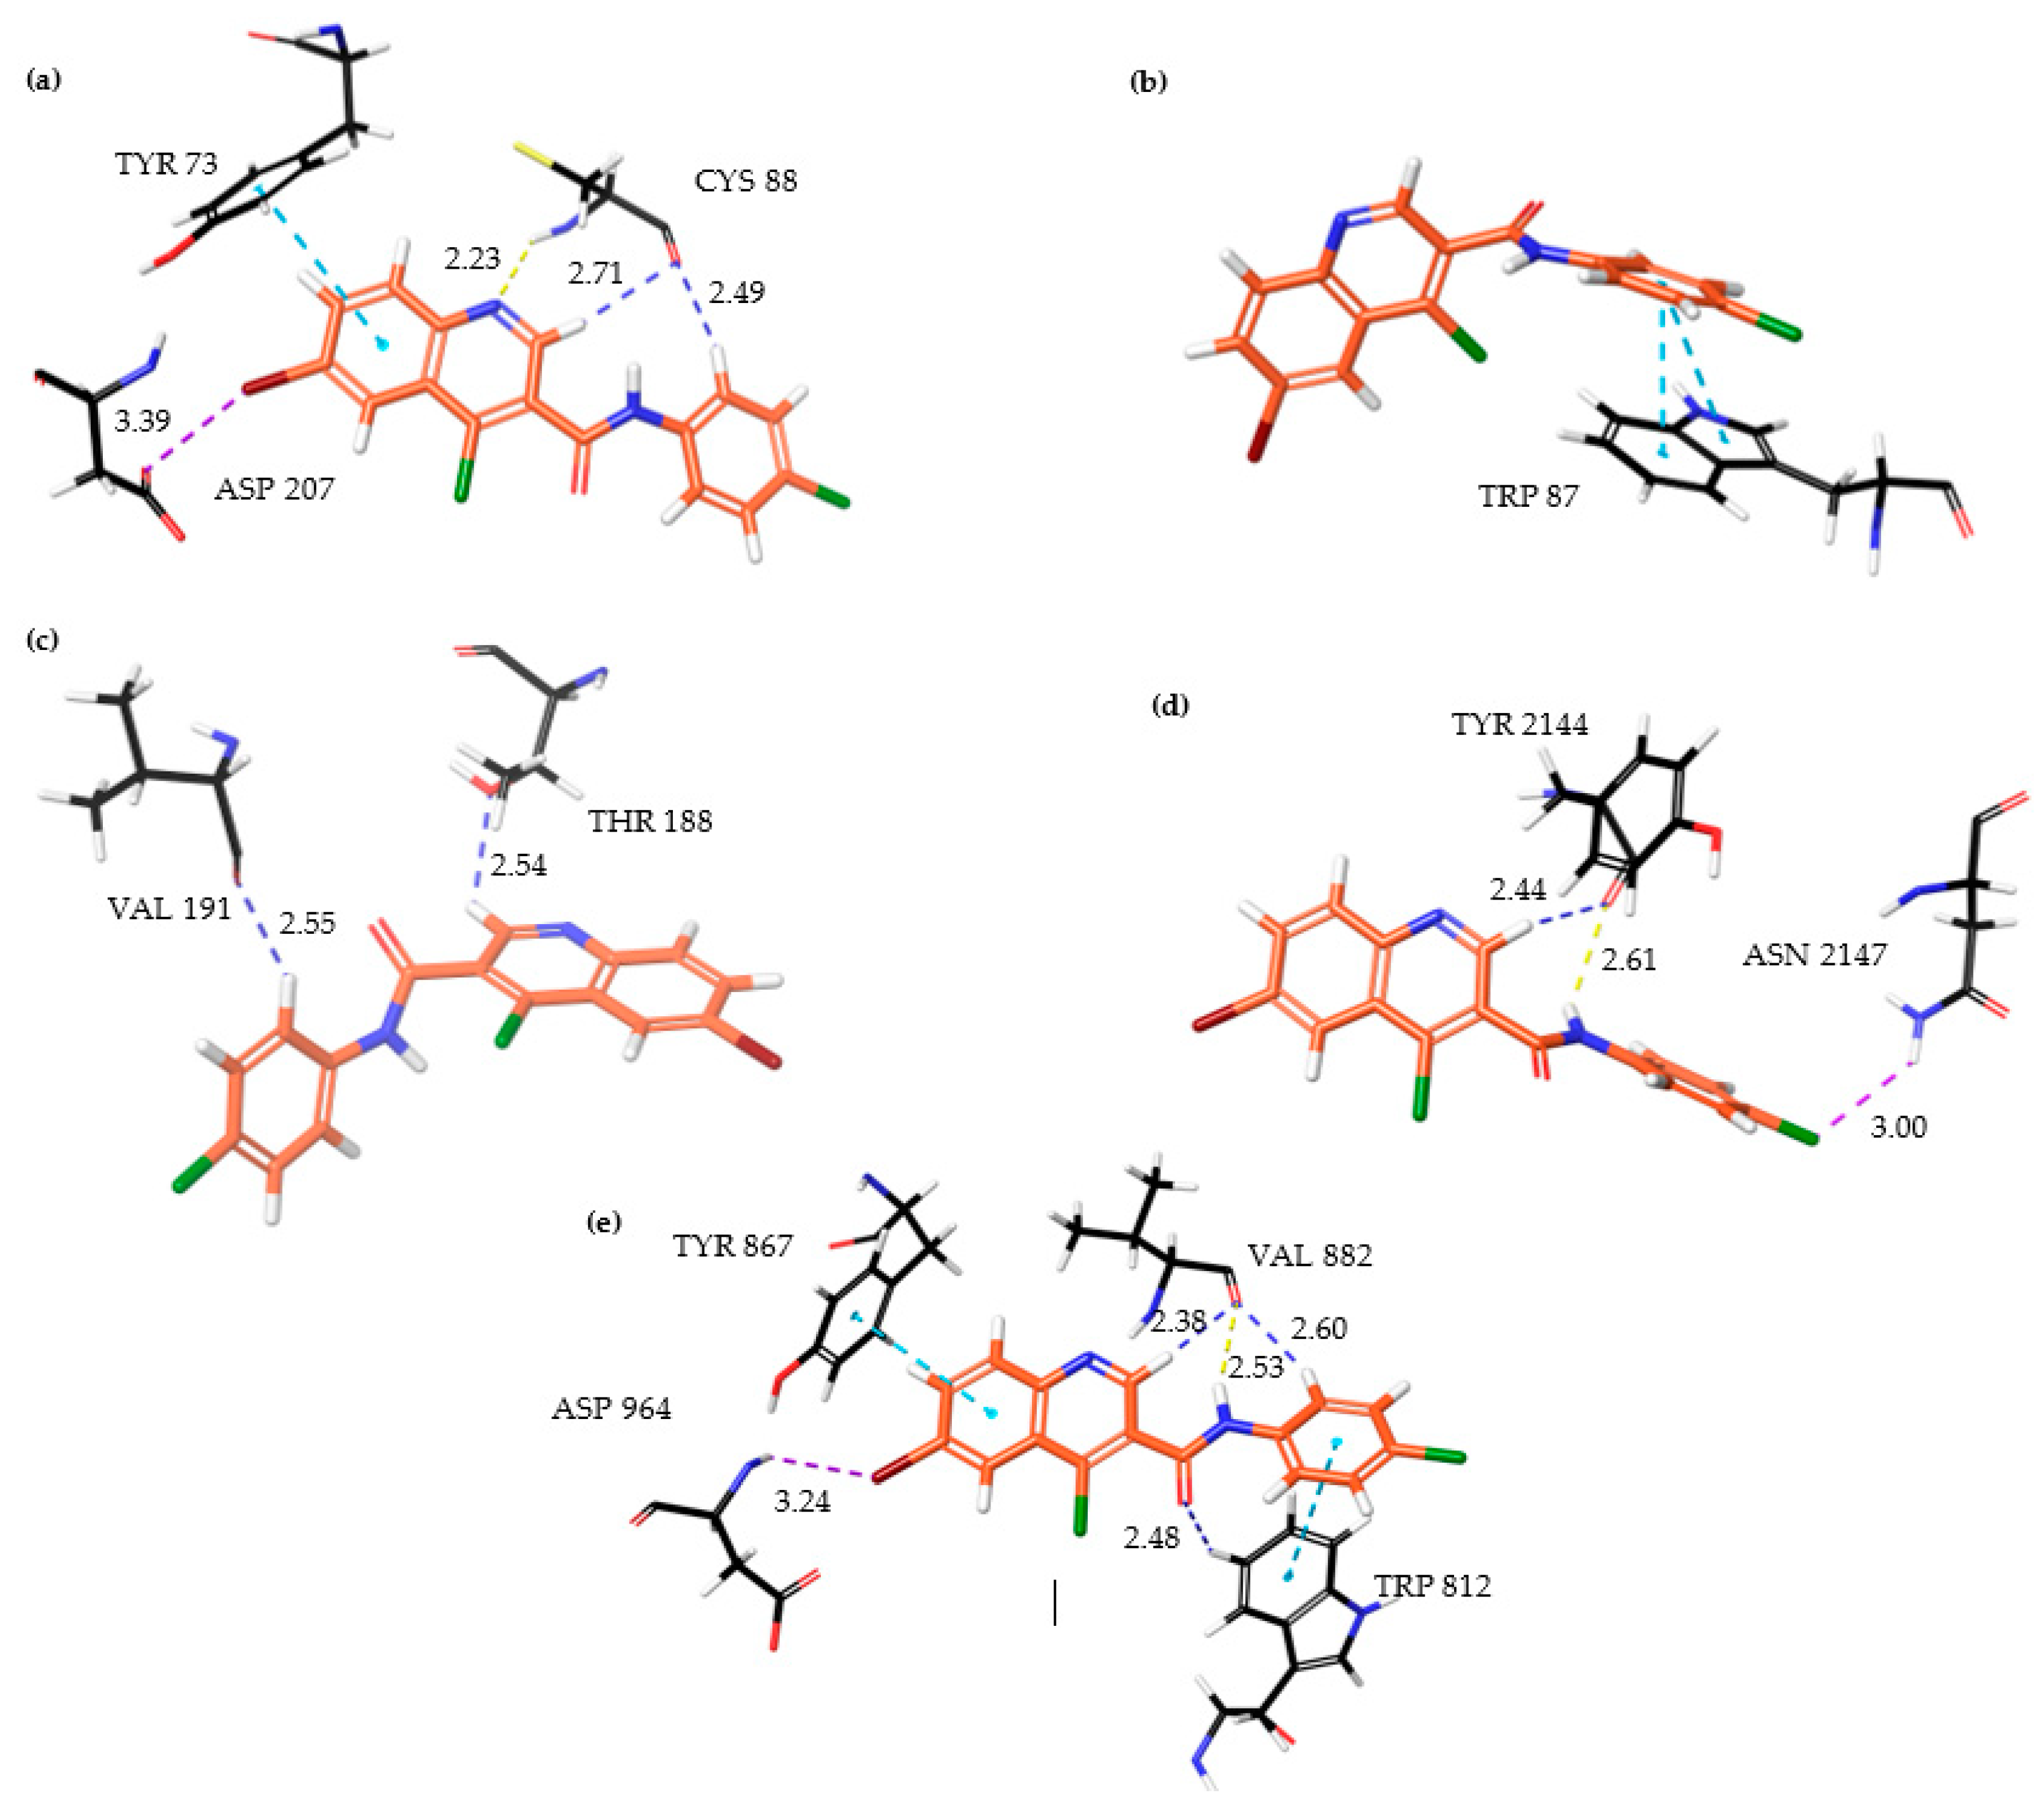
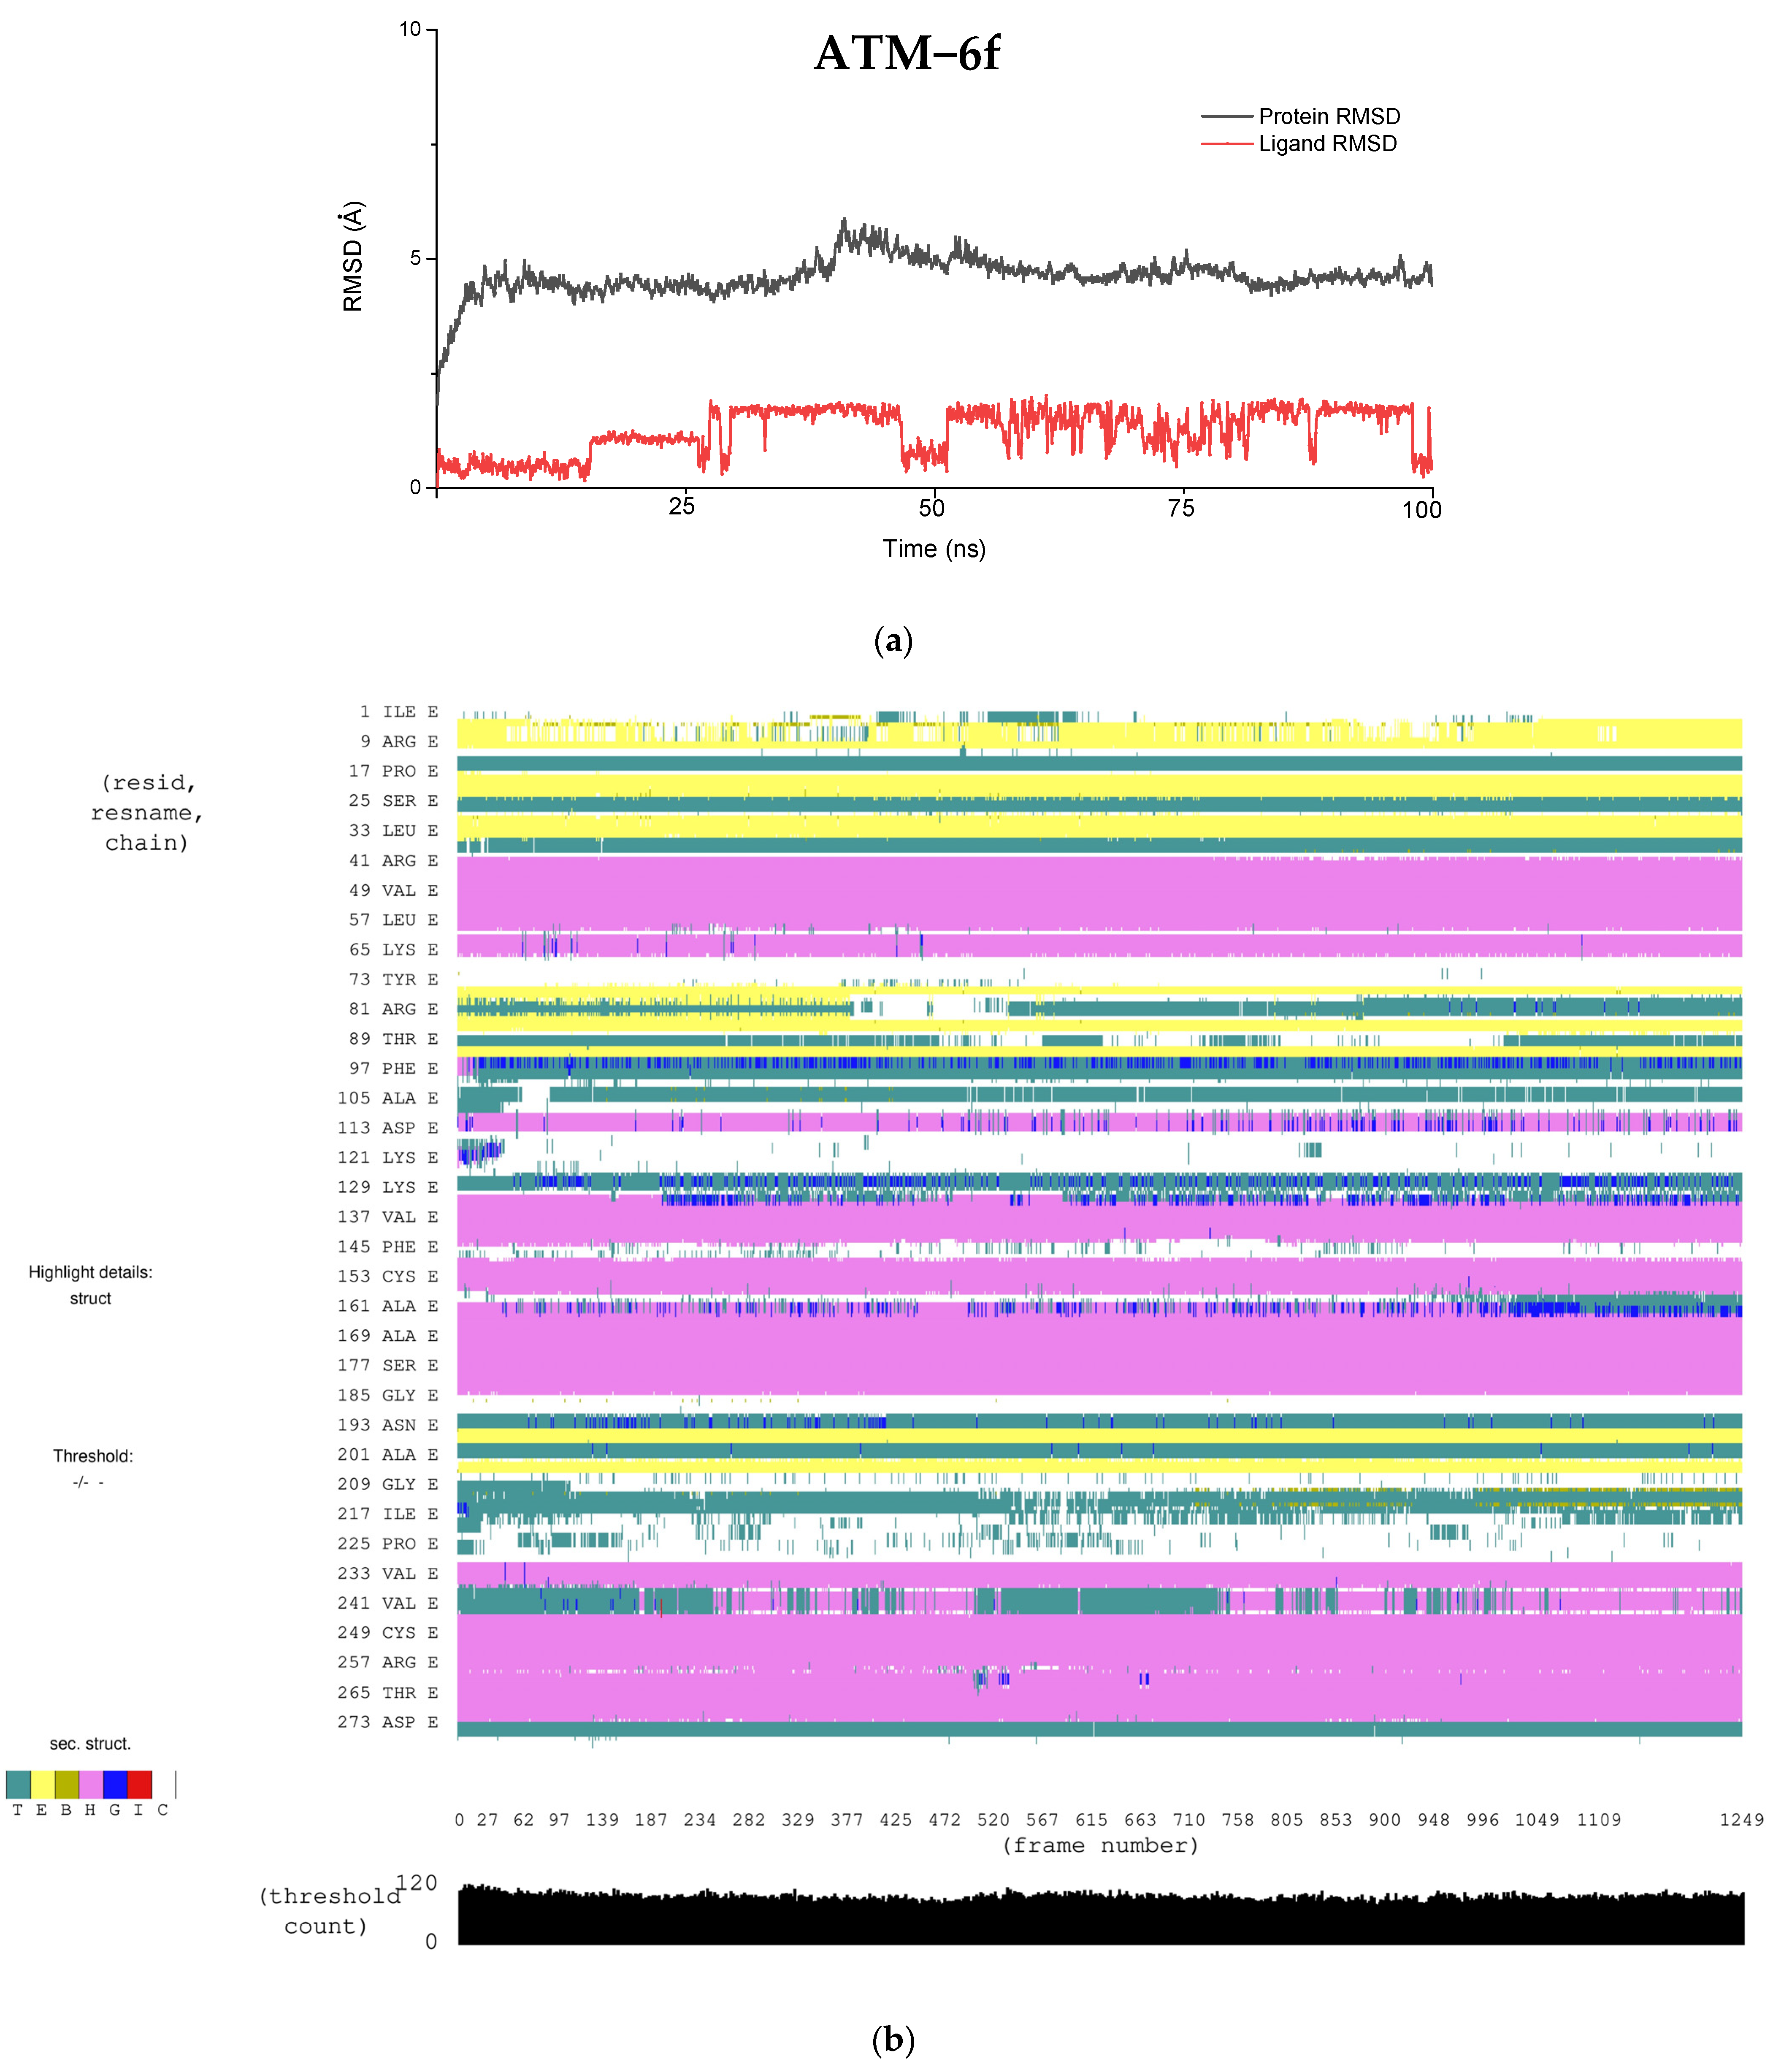
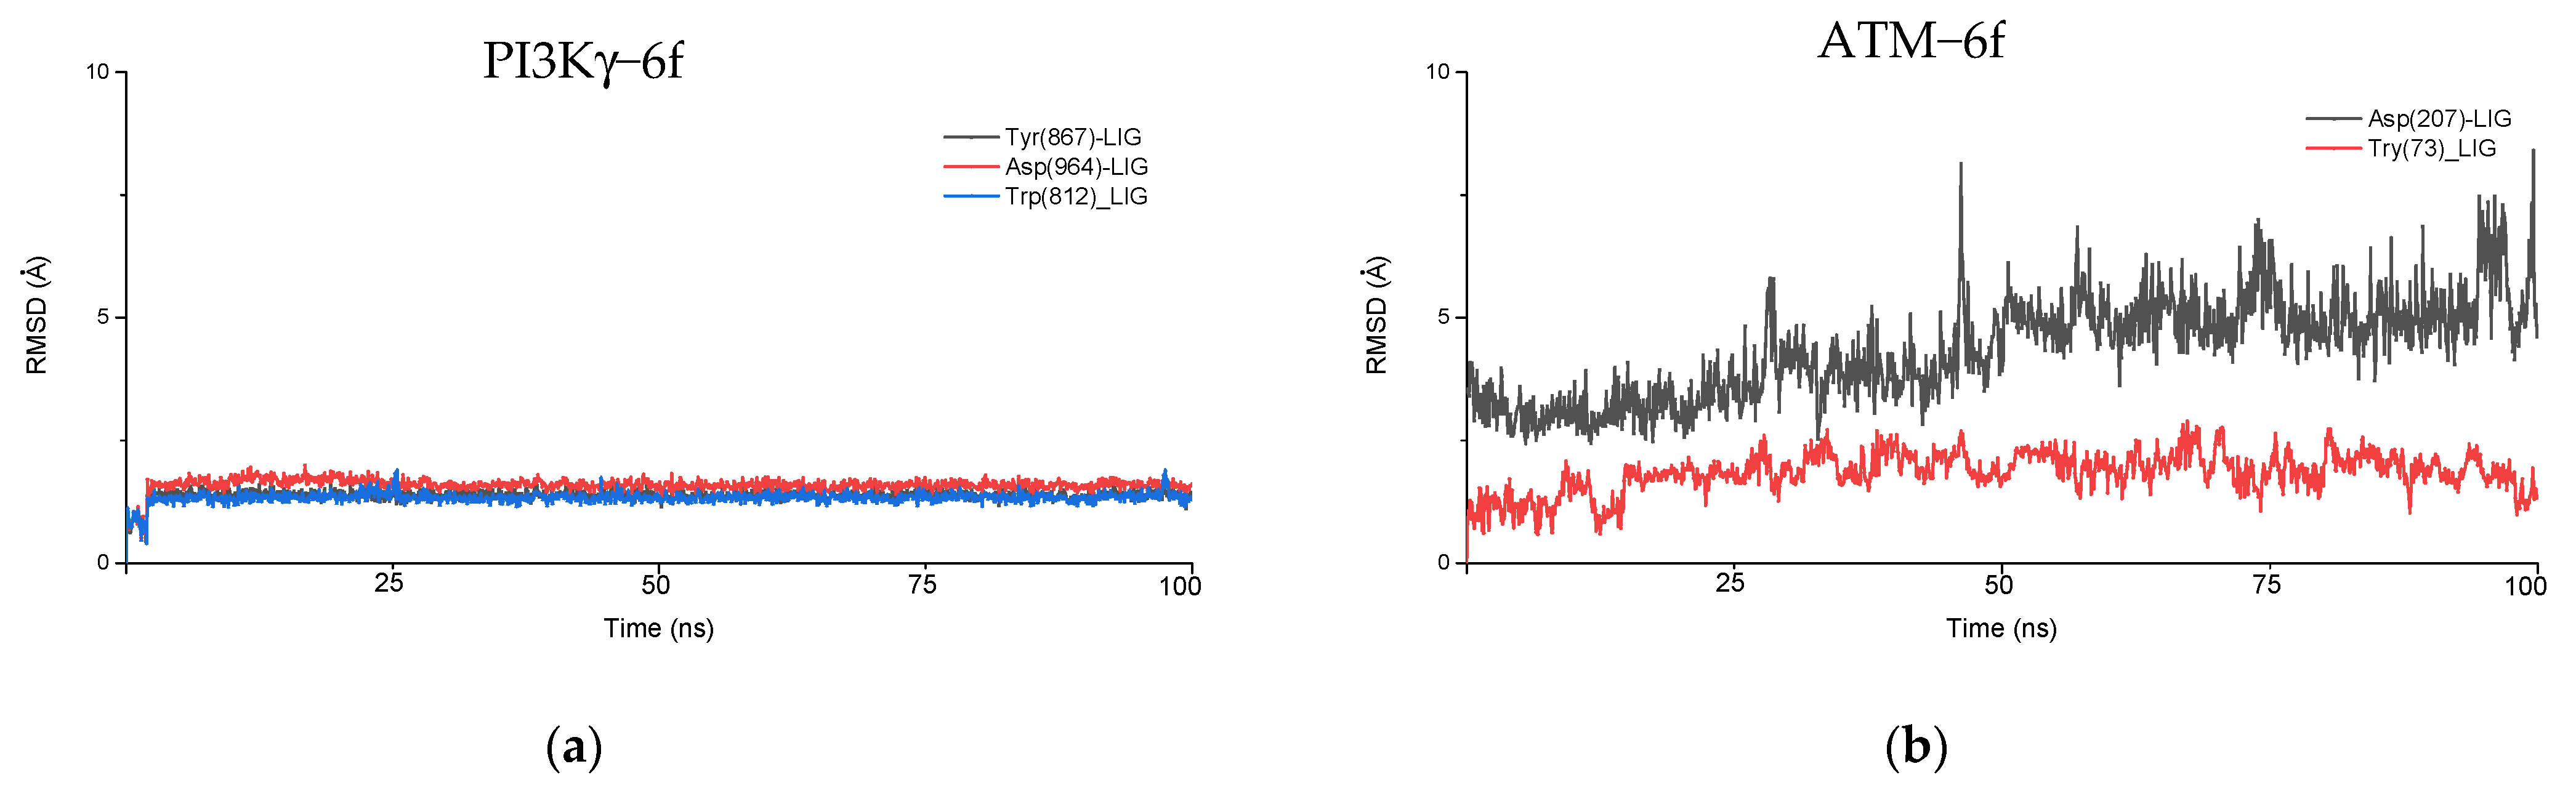
As discussed above, due to the large penalties resulting from intraligand contact, PI3Kγ shows a reduced binding affinity for the ligand, which results in a lower docking score. We analyzed the RMSD fluctuations of key binding site residues that interact with ligands to understand them further. In the PI3Kγ−6f complex, our docking study suggests that Trp(812), Tyr (867), and Asp(964) are the three key residues interacting with the ligand. The RMSD plot of these residues, along with ligand (6f), is shown in Figure 6a. Interestingly, in all three cases, the RMSD remains constant at around 1.5 Å, implying a stronger intermolecular interaction between these residues and ligands. This observation is consistent with our docking results, where the rewards (stabilization energy) for PI3Kγ are nearly the same as those seen in ATM (Table 6). However, such a shorter distance between active site residues and ligands may likely result in steric clashes between the atoms present, resulting in large penalties. Moreover, constant RMSD between key residues and ligands, with a magnitude of around 1.5 Å, exemplifies the rigidity of the PI3Kγ binding site. It is probably because of this rigidness that ligand molecules cannot undergo conformational interconversion, which was generally observed in the other four proteins.
In the ATM−6f complex, two interacting residues are Tyr (73) and Asp (207), forming π−π stacking and halogen bonding with the ligand, respectively. RMSD fluctuations for Tyr(73)−6f (ligand) and Asp(207)−6f(ligand) are shown in Figure 6b. For Tyr(73)−6f (ligand), the RMSD value shows a variation in the range of 1.5−2 Å, indicating a strong π−π stacking which remains stable during the simulation. Meanwhile, in the case of Asp(207)−6f(ligand), the RMSD shows larger variation, implying the dynamic formation and breakage of weaker halogen bonds, probably due to conformational interconversion of the ligand. Overall, the RMSD fluctuations between these residues and the ligand suggest a flexibility of binding sites, large enough to allow for the free conformational interconversion of the ligand. It is due to the flexibility of the binding site; the penalties due to intraligand contacts are negligible in the ATM−6f complex.
Similarly, for the ATR−6f complex and the mTOR−6f complex, the critical binding site residue shows similar fluctuations in RMSD (Figure S9), implying binding site flexibility. This observation is also consistent with the ligands’ conformational switching observed in all four proteins (except PI3Kγ, as discussed earlier). Furthermore, MSA analysis demonstrated that though the binding sites of all the proteins are confined to the kinase domain and its nearby region, the interacting residues were not a part of the conserved region. This factor can contribute to the differential selectivity of the inhibitors even though the nature of some of the residues were similar.
In summary, the docking affinity of 6f (ligand) with PIKK family kinases is determined by a subtle interplay of the natures of active site residues, stabilizing interactions, and penalties resulting from the rigidity/flexibility of the binding site.
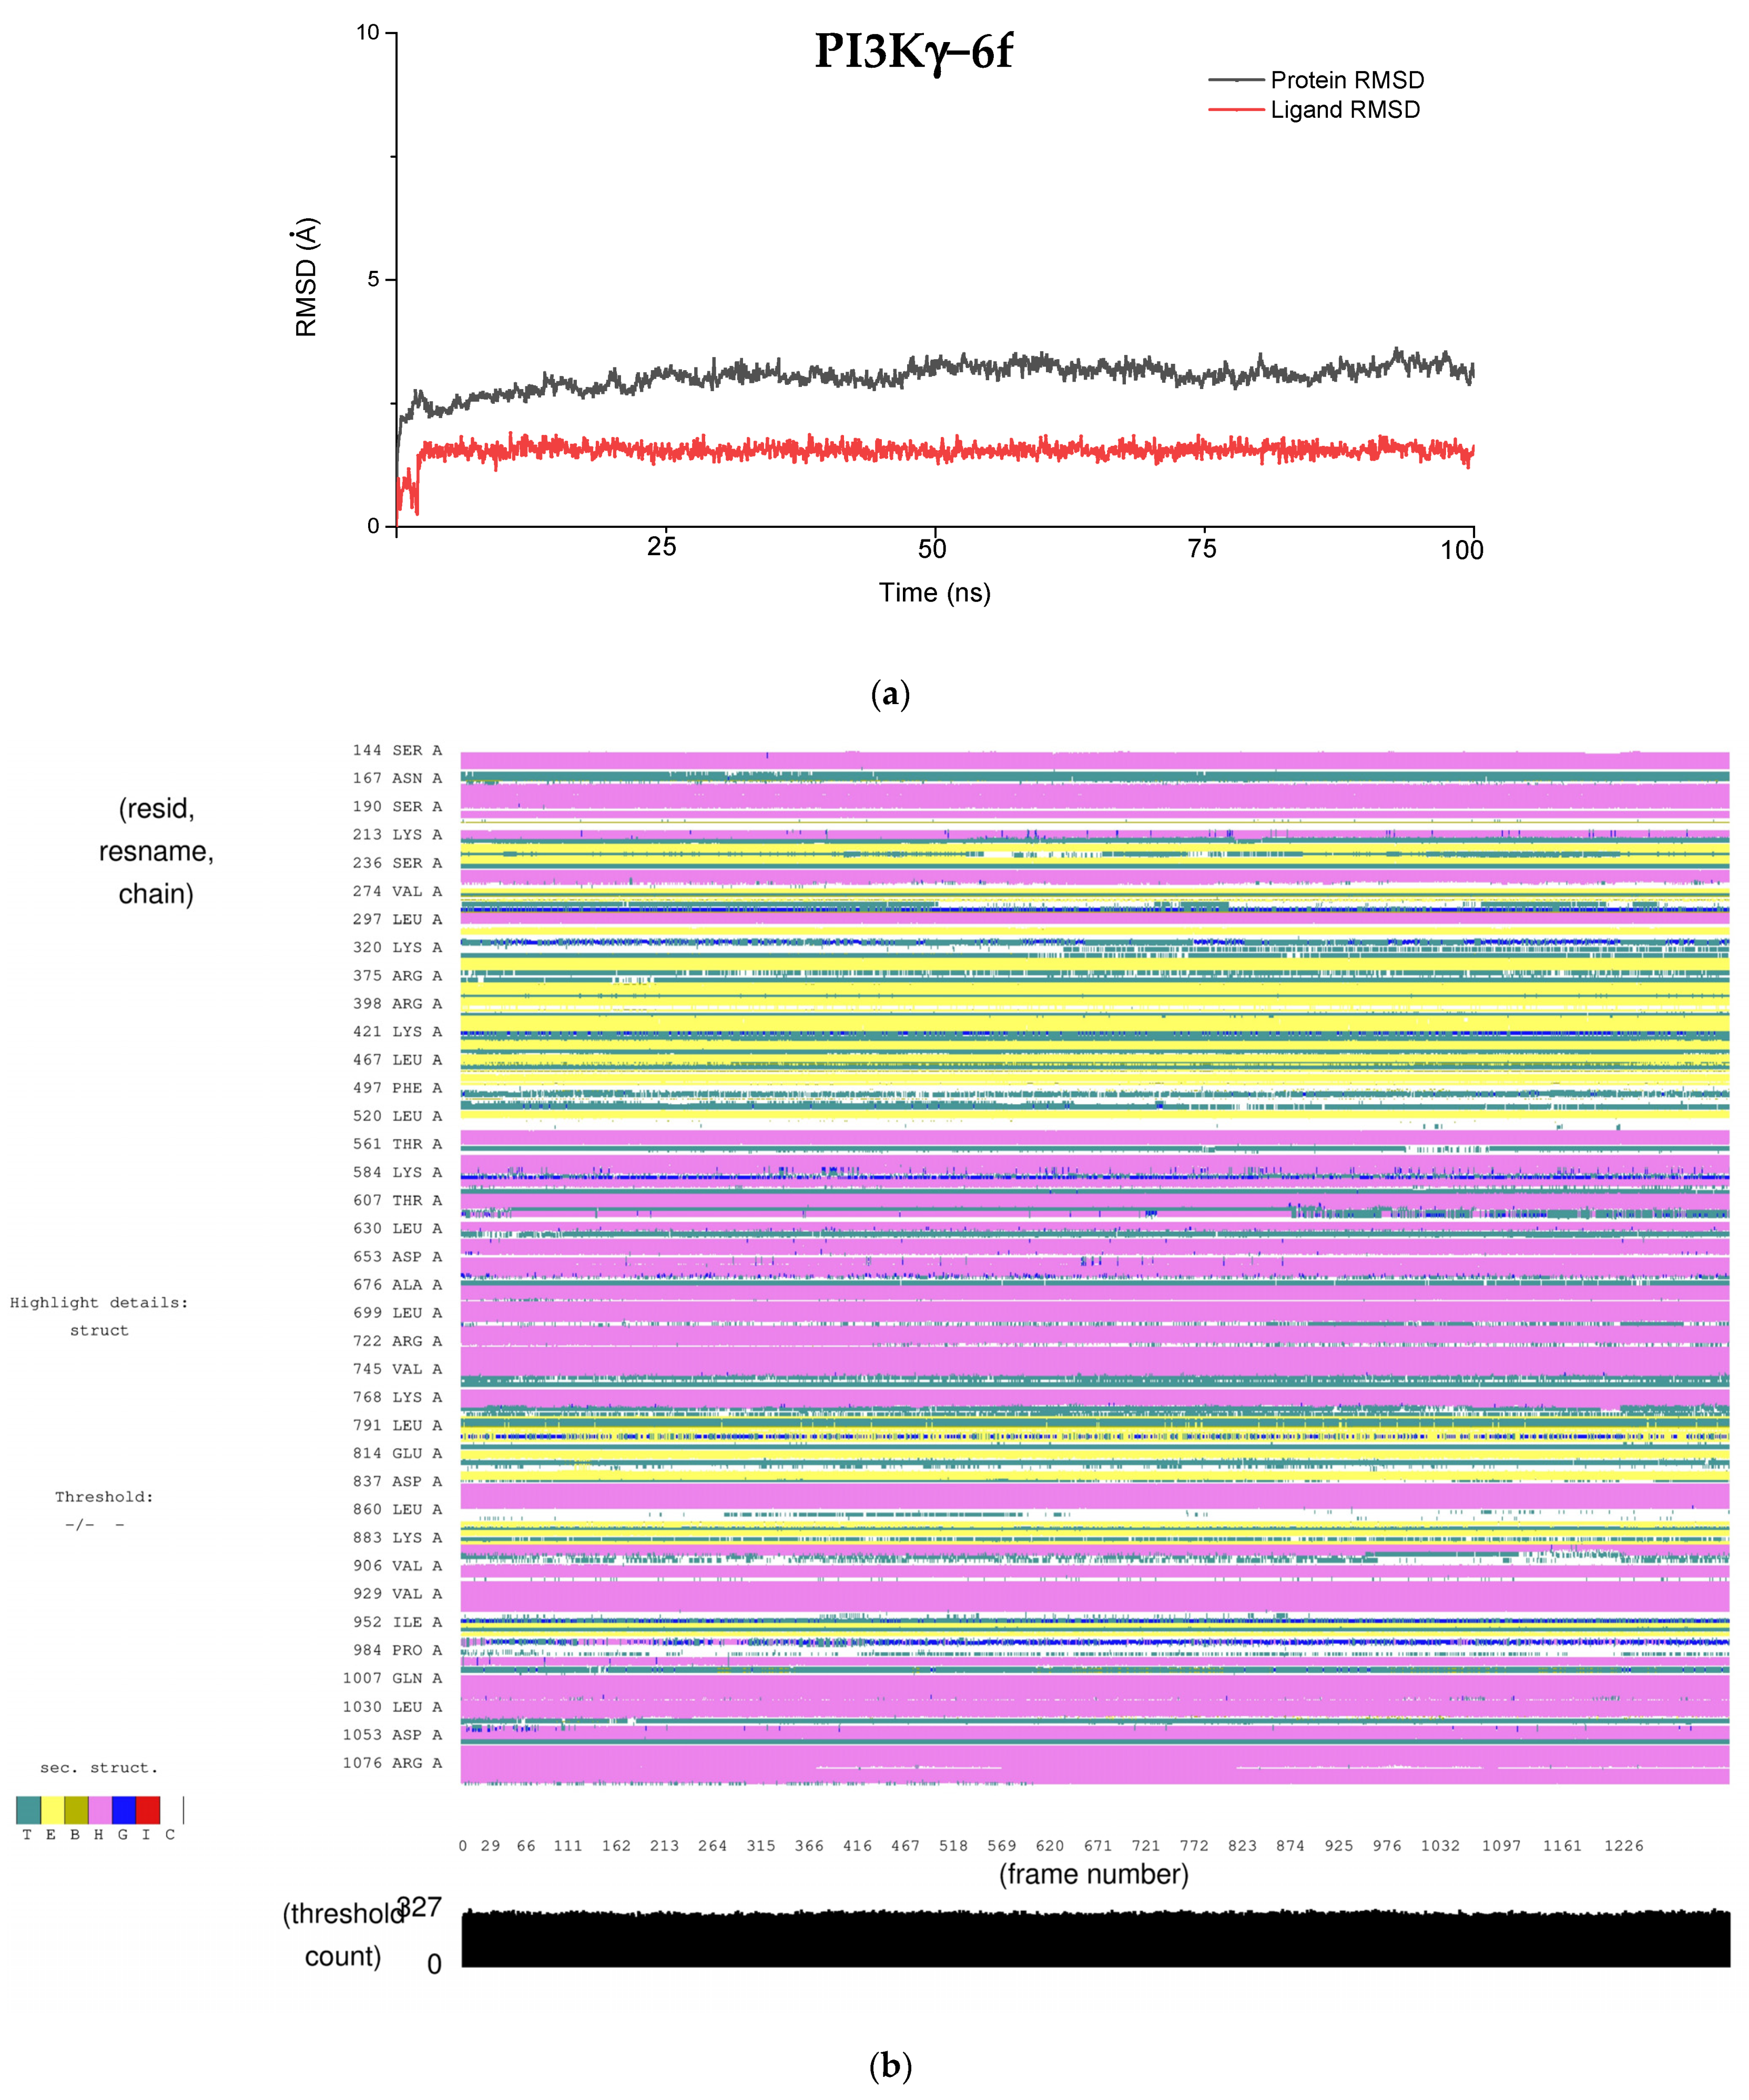
6. Conclusions

One of the major problems in kinase drug discovery is the off−target kinase inhibition. Therefore, predicting the off−target binding of the inhibitors would help in fast−tracking the process of drug development. In this study, we analyzed the binding affinity of compound 6f against five different kinases sharing a reasonable sequence similarity. 6f was shown to bind selectively to ATM in comparison with the other proteins of interest. MD simulation showed that all of the protein−ligand complexes were stable and that secondary structure variations during the simulation were minimal. Interestingly, the trajectory analysis of the ligand (6f) in all cases suggested the ligand’s conformational interconversion (except for in the case of the PI3Kγ−6f complex). The conformational changes observed in the ligand were attributed to the free rotation of the C–N bond and the binding site flexibility of the proteins. In the case of the PI3Kγ−6f complex, the binding site was found to be very rigidly packed, thus prohibiting the free rotation of the C–N bond. Moreover, the binding site rigidity in the PI3Kγ−6f complex resulted in steric clashes between active site residues and ligands, thus yielding a higher penalty and a lower docking score. Finally, MSA analysis also aided us in understanding the residue conservation across the proteins and rationalizing the selectivity of the molecules towards ATM.
To conclude, the molecules synthesized have higher binding affinity and selectivity towards ATM compared to the other kinases of interest. The proteins share a reasonable sequence similarity in the kinase domain where the designed inhibitors are speculated to bind. The interacting residues do not fall in the conserved region, thereby resulting in selectivity towards ATM. This result can be considered as a preliminary investigation, which warrants further validation using in vitro assays.

Supplementary Materials

The following are available online at https://0-www-mdpi-com.brum.beds.ac.uk/article/10.3390/chemistry3020036/s1, Figure S1: Interaction of the ligands with ATM (a) 6a (b) 6b (c) 6b’ (d) 6d (e) 6e, Table S1: Summary of interactions of the ligands with ATM, Figure S2: Interaction of the ligands with ATR (a) 6a (b) 6b (c) 6b’ (d) 6d (e) 6e, Table S2: Summary of interactions of the ligands with ATR, Figure S3: Interaction of the ligands with DNA-PKcs (a) 6a (b) 6b (c) 6b’ (d) 6d (e) 6e, Table S3: Summary of interactions of the ligands with DNA-PKcs, Figure S4: Interaction of the ligands with mTOR (a) 6a (b) 6b (c) 6b’ (d) 6d (e) 6e, Table S4: Summary of interactions of the ligands with mTOR, Figure S5: Interaction of the ligands with PI3Kγ (a) 6a (b) 6b (c) 6b’ (d) 6d (e) 6e, Table S5: Summary of interactions of the ligands with PI3Kγ, Table S6: Rewards and penalties for the ligand 6f against ATR, DNA-PKcs, and mTOR, Figure S6: MD simulation analysis of 6f with the ATR (a) RMSD (b) Timeline analysis of Protein Secondary structure (c) Representative structure of ATR-6f complex (after 100 ns simulation), Figure S7: MD simulation analysis of 6f with the DNA-PKcs (a) RMSD (b) Timeline analysis of Protein Secondary structure (c) Representative structure of DNA-PKsc-6f complex (after 100 ns simulation), Figure S8: MD simulation analysis of 6f with the mTOR (a) RMSD (b) Timeline analysis of Protein Secondary structure (c) Representative structure of mTOR-6f complex (after 100 ns simulation), Figure S9: RMSD plot for binding site residues and ligand (6f) a) ATR-6f complex; RMSD plot for key binding residues and ligand (6f) b) mTOR-6f complex; RMSD plot for key binding residues and ligand (6f).

Author Contributions

Conceptualization, S.R., B.P., V.T. and S.K.; methodology, S.R., B.P. and P.D.; validation: S.R., B.P. and P.D.; formal analysis, S.R., B.P. and P.D.; investigation, S.R., B.P., P.D., V.T. and S.K.; writing—original draft preparation, S.R.; writing—review and editing, S.R., B.P., P.D., V.T. and S.K.; supervision, V.T. and S.K. All authors have read and agreed to the published version of the manuscript.

Funding

The authors thank IIT Gandhinagar and DRDO for the funding (ERIP/ER/201903004/M/01/1763).

Institutional Review Board Statement

Not Applicable.

Informed Consent Statement

Not Applicable.

Data Availability Statement

The data presented in this study are available in this article and the Supplementary Materials.

Acknowledgments

The authors would like to acknowledge IIT Gandhinagar for the facilities. The authors would also like to acknowledge Kishore and Vinod from the Schrodinger team for their constant support.

Conflicts of Interest

The authors declare no conflict of interest.

Abbreviations

PIKKsPhosphatidylinositol 3−kinase−related kinases
ATPAdenosine triphosphate
ATMAtaxia−Telangiesctasia Mutated
DNADeoxyribonucleic acid
DDRDNA Damage and Response
ATRAtaxia Telangiectasia and Rad3−related
DNA-PKcsDNA dependent Protein Kinase catalytic subunit
mTORmammalian Target of Rapamycin
PI3KγPhosphoinositide 3−kinaseγ
ADMEAdsorption, Distribution, Metabolism, Excretion
MDMolecular Dynamics
SMG1Suppressor of Morphogenesis in Genitalia
TRRAPTransformation/transcription domain−associated protein
DSBDouble−stranded break
SARStructure Activity Relationship
MSAMultiple Sequence Alignment
CryoEMCryo−Electron Microscopy
NAMDNanoscale Molecular Dynamics
CHARRM36Chemistry at Harvard Macromolecular Mechanics 36
CHARMMGUI−Chemistry at Harvard Macromolecular Mechanics–Graphic User Interface
LJ cutoffLennard Jones
PMEParticle Mesh Ewald
NPTIsothermal−Isobaric ensemble
VMDVisual Molecular Dynamics
RMSDRoot Mean Square Deviation

References

  1. Blackford, A.N.; Jackson, S.P. ATM, ATR, and DNA-PK: The Trinity at the Heart of the DNA Damage Response. Mol. Cell 2017, 66, 801–817. [Google Scholar] [CrossRef] [PubMed] [Green Version]
  2. Liu, Y.; Li, Y.; Lu, X. Regulators in the DNA damage response. Arch. Biochem. Biophys. 2016, 594, 18–25. [Google Scholar] [CrossRef]
  3. Falck, J.; Coates, J.; Jackson, S.P. Conserved modes of recruitment of ATM, ATR and DNA-PKcs to sites of DNA damage. Nature 2005, 434, 605–611. [Google Scholar] [CrossRef]
  4. Yang, J.; Yu, Y.; Hamrick, H.E.; Duerksen-Hughes, P.J. ATM, ATR and DNA-PK: Initiators of the cellular genotoxic stress responses. Carcinogenesis 2003, 24, 1571–1580. [Google Scholar] [CrossRef] [Green Version]
  5. Weber, A.M.; Ryan, A.J. ATM and ATR as therapeutic targets in cancer. Pharmacol. Ther. 2015, 149, 124–138. [Google Scholar] [CrossRef] [Green Version]
  6. Velic, D.; Couturier, A.M.; Ferreira, M.T.; Rodrigue, A.; Poirier, G.G.; Fleury, F.; Masson, J.Y. DNA damage signalling and repair inhibitors: The long-sought-after achilles’ heel of cancer. Biomolecules 2015, 5, 3204–3259. [Google Scholar] [CrossRef] [Green Version]
  7. Davidson, D.; Amrein, L.; Panasci, L.; Aloyz, R.; Batist, G.; Wu, J.H. Small molecules, inhibitors of DNA-PK, targeting DNA repair, and beyond. Front. Pharmacol. 2013, 4, 5. [Google Scholar] [CrossRef] [Green Version]
  8. Finlay, M.R.V.; Griffin, R.J. Modulation of DNA repair by pharmacological inhibitors of the PIKK protein kinase family. Bioorg. Med. Chem. Lett. 2012, 22, 5352–5359. [Google Scholar] [CrossRef] [PubMed] [Green Version]
  9. Rivera-Calzada, A.; López-Perrote, A.; Melero, R.; Boskovic, J.; Muñoz-Hernandez, H.; Martino, F.; Llorca, O. Structure and Assembly of the PI 3 K-like Protein Kinases (PIKKs) Revealed by Electron Microscopy. AIMS Biophys. 2015, 2, 36–57. [Google Scholar] [CrossRef]
  10. Stracker, T.H.; Roig, I.; Knobel, P.A.; Marjanović, M. The ATM signaling network in development and disease. Front. Genet. 2013, 4, 37. [Google Scholar] [CrossRef] [PubMed] [Green Version]
  11. Ca, C.; Behrens, A. ATM signalling and cancer. Oncogene 2014, 33, 3351–3360. [Google Scholar] [CrossRef] [Green Version]
  12. Li, K.; Yan, H.; Guo, W.; Tang, M.; Zhao, X.; Tong, A.; Peng, Y.; Li, Q.; Yuan, Z. ATM inhibition induces synthetic lethality and enhances sensitivity of PTEN-deficient breast cancer cells to cisplatin. Exp. Cell Res. 2018, 366, 24–33. [Google Scholar] [CrossRef]
  13. Khalil, H.; Tummala, H.; Chakarov, S.; Zhelev, N.; Lane, D. Targeting ATM pathway for therapeutic intervention in cancer. Biodiscovery 2012, 1, e8920. [Google Scholar] [CrossRef] [Green Version]
  14. Ravi, S.; Barui, S.; Kirubakaran, S.; Duhan, P.; Bhowmik, K. Synthesis and Characterization of Quinoline-3-Carboxamide Derivatives as Inhibitors of the ATM Kinase. Curr. Top. Med. Chem. 2020, 20, 2070–2079. [Google Scholar] [CrossRef]
  15. Degorce, S.L.; Barlaam, B.; Cadogan, E.; Dishington, A.; Ducray, R.; Glossop, S.C.; Hassall, L.A.; Lach, F.; Lau, A.; McGuire, T.M.; et al. Discovery of Novel 3-Quinoline Carboxamides as Potent, Selective, and Orally Bioavailable Inhibitors of Ataxia Telangiectasia Mutated (ATM) Kinase. J. Med. Chem. 2016, 59, 6281–6292. [Google Scholar] [CrossRef] [PubMed]
  16. Chen, X.; Xu, X.; Chen, Y.; Cheung, J.C.; Wang, H.; Jiang, J.; de Val, N.; Fox, T.; Gellert, M.; Yang, W. Structure of an activated DNA-PK and its implications for NHEJ. Mol. Cell 2021, 81, 801–810.e3. [Google Scholar] [CrossRef]
  17. Shaik, A.; Bhakuni, R.; Kirubakaran, S. Design, synthesis, and docking studies of New Torin2 analogs as potential ATR/mTOR kinase inhibitors. Molecules 2018, 23, 992. [Google Scholar] [CrossRef] [PubMed] [Green Version]
  18. Phillips, J.C.; Hardy, D.J.; Maia, J.D.C.; Stone, J.E.; Ribeiro, J.V.; Bernardi, R.C.; Buch, R.; Fiorin, G.; Hénin, J.; Jiang, W.; et al. Scalable molecular dynamics on CPU and GPU architectures with NAMD. J. Chem. Phys 2020, 153, 44130. [Google Scholar] [CrossRef] [PubMed]
  19. Humphrey, W.; Dalke, A.; Schulten, K. VMD: Visual molecular dynamics. J. Mol. Graph. 1996, 14, 33–38. [Google Scholar] [CrossRef]
  20. Madeira, F.; Park, Y.M.; Lee, J.; Buso, N.; Gur, T.; Madhusoodanan, N.; Basutkar, P.; Tivey, A.R.N.; Potter, S.C.; Finn, R.D.; et al. The EMBL-EBI search and sequence analysis tools APIs in 2019. Nucleic Acids Res. 2019, 47, W636–W641. [Google Scholar] [CrossRef] [Green Version]
  21. Waterhouse, A.M.; Procter, J.B.; Martin, D.M.A.; Clamp, M.; Barton, G.J. Jalview Version 2-A multiple sequence alignment editor and analysis workbench. Bioinformatics 2009, 25, 1189–1191. [Google Scholar] [CrossRef] [PubMed] [Green Version]
Figure 1. Structures of the reported quinoline-3-carboxamides.
Chemistry 03 00036 g001
Figure 2. Interaction of 6f with the proteins (a) ataxia telangiectasia mutated (ATM), (b) ataxia telangiectasia and rad3 related (ATR), (c) DNA dependent protein kinase catalytic subunit (DNA−PKcs), (d) mTOR, and (e) PI3Kγ. The yellow dotted lines represent the hydrogen bond, the blue dotted lines represent the aromatic hydrogen bond, the cyan dotted lines represent the π−π stacking interaction, and the purple dotted lines represent the halogen bond.
Chemistry 03 00036 g002
Figure 3. Molecular dynamics (MD) simulation analysis of 6f with the ATM. (a) root-mean square deviation (RMSD); (b) timeline analysis of the protein secondary structure; (c) the representative structure of the ATM−6f complex (after 100 ns simulation); (d) the molecular structure of 6f and the red arrow point to the rotatable single bond, thus resulting in fluctuation of the ligand RMSD.
Chemistry 03 00036 g003aChemistry 03 00036 g003b
Figure 4. MD simulation analysis of 6f with the PI3Kγ and (a) RMSD. (b) Timeline analysis of the protein secondary structure. (c) The representative structure of the PI3Kγ−6f complex (after 100 ns simulation).
Chemistry 03 00036 g004aChemistry 03 00036 g004b
Figure 5. Multiple sequence alignment of the kinase domain of ATM, ATR, DNA−PKcs, mTOR, and PI3Kγ. Residues causing interactions with synthesized small molecules are highlighted with the red boxes, the conserved residue across the kinase domain is highlighted in blue, and the color intensity indicates the percentage conservation.
Chemistry 03 00036 g005
Figure 6. RMSD plot for binding site residues and ligand (6f). (a) The PI3Kγ−6f complex; RMSD plot for key binding residues and ligand (6f). (b) ATM−6f complex; RMSD plot for key binding residues and ligand (6f).
Chemistry 03 00036 g006
Table 1. GI50 (µM) values of the reported quinoline-3-carboxamides.
CompoundHCT116MDA-MB-468MDA-MB-231
6a14.3120.1627.14
6b11.8017.5123.74
6b’21.03Not availableNot available
6d33.2435.6031.81
6e57.4985.84192.5
6f53.5143.4739.20
KU600199.808.048.21
Table 2. Details of the proteins under consideration.
ATMATRDNA-PKcsmTORPI3Kγ
PDB IDModeled using 5G55 and 5NP0Modeled using 4JSPModeled using 7k0y.15WBY5G55
Residues used for docking2683–2962 2293–2567 3747–4015Full lengthFull length
OrganismHumanHumanHumanHumanHuman
Table 3. List of the selected absorption, distribution, metabolism, and excretion (ADME) properties.
LigandQPlogSQPPCaCo% Human Oral AbsorptionQPlogKhsaQLogBBMol. Wt.HBDHBAQPlogP
(o/w)
6a−5.9922599.9501000.5700.143375.65213.504.498
6b−5.7392601.4971000.4280.080391.65114.254.308
6b’−5.6812513.7981000.4430.063391.65114.254.315
6d−6.9372612.7621000.6870.368445.62313.505.337
6e−6.2622594.0351000.5500.332440.52113.504.754
6f−6.1432590.8071000.5260.321396.07013.504.675
QPlogS–predicted aqueous solubility, S in mol/L (acceptable range; −6.5–0.5); QPPCaCo–predicted apparent Caco-2 cell permeability in nm/sec. Caco-2 cells are a model for the gut–blood barrier. QikProp predictions are for nonactive transport (<25 poor, >500 great); Percentage of human oral absorption (<25% is poor and >80% is high); QPlogKhsa–prediction of binding to human serum albumin (acceptable range; −1.0–1.5); QLogBB–prediction of brain/blood partition coefficient (acceptable range; −3.0–1.2); molecular weight (<500 Da); HBD–Hydrogen bond donor (<5); HBA–Hydrogen bond acceptor (<10); QPlogP(o/w)–predicted octanol/water partition co-efficient logP (acceptable range; −2.0–6.5).
Table 4. Docking scores for the ligands with the proteins.
LigandsATMATRDNA-PKcsmTORPI3Kγ
6a−9.8−3.9−3.7−3.6−4.6
6b−10.1−2.5−4.0−2.7−5.0
6b’−10.2−3.0−1.7−2.7−6.1
6d−10.3−3.3−3.0−3.2−4.8
6e−10.1−3.0−3.8−2.6−4.5
6f−10.4−3.5−3.8−2.1−4.7
Table 5. Summary of the interactions of 6f with the proteins.
ProteinInteracting ResiduesType of Interactions
ATMASP 207, TYR 73, CYS 88Halogen bonding, π−π stacking interaction, hydrogen bonding, aromatic hydrogen bonding
ATRTRP 87π−π stacking interaction
DNA−PKcsTHR 188, VAL 191Aromatic hydrogen bonding
mTOR TYR 2144, ASN 2147 Aromatic hydrogen bonding, hydrogen bonding, halogen bonding
PI3Kγ ASP 964, TYR 867, VAL 882, TRP 812 Halogen bonding, π−π stacking interaction, aromatic hydrogen bonding, hydrogen bonding
Table 6. Rewards and penalties for the ligand 6f against ATM and PI3Kγ.
PropertyATM (6f)PI3Kγ (6f)
LipophilicEvdW−4.87−3.76
PhobEnHB−1.5−1.5
HBond−1.03−0.7
Electro−0.31−0.49
Penalties0.171.81
ExposPenal00.2
LipophilicEvdW—ChemScore lipophilic pair term and fraction of the total protein−ligand vdW energy; PhobEnHB—Reward for hydrophobically packed hydrogen bond; HBond—ChemScore H—bond pair term; Electro—Electrostatic reward; Penalties—Polar atom burials and desolvation penalties and penalty for intra−ligand contacts; ExposPenal—Penalty for exposed hydrophobic ligand groups.
Publisher’s Note: MDPI stays neutral with regard to jurisdictional claims in published maps and institutional affiliations.

