1. Introduction
New Zealand dairy herds are usually spring-calving and have a mean replacement rate of 22% [
1,
2], which is usually achieved by breeding around 60% of the herd to high-genetic-merit, dairy-breed, bulls. The remaining cows in the herd could be bred to beef-breed bulls to increase the value of the non-replacement calves for beef production. The primary interest of the dairy farmer when choosing a service sire to generate non-replacement calves, is the health and production of the dairy cow [
2]. Therefore, key traits of importance for these service bulls include birth weight of the calf, as a determinant of calving difficulty, and gestation length, as a determinant of subsequent calving date. In addition, artificial rearing systems in New Zealand usually involve weaning calves at a fixed live weight, and the period of milk feeding is the most expensive phase in the lifecycle of dairy-beef calves. Therefore, age at weaning is an important contributor to the cost of rearing dairy-origin calves for beef production, with fast-growing calves consuming less feed.
Surplus dairy-breed calves from the dairy industry are typically processed for beef at less than 2 weeks of age [
2,
3,
4,
5]. There is an opportunity to repurpose the surplus calves born every year by using beef-breed bulls to sire the calves and rearing the calves for beef production, alleviating welfare concerns around the fate of these surplus calves. Beef-breed bulls can be used to produce a calf of greater value than that of a dairy-bull sired calf [
4]. Angus and Hereford are the most common beef breeds in New Zealand [
6] and both breeds are used over dairy cows in industry.
Many of the beef bulls used to mate dairy cows are not pedigree-recorded and are of unknown genetic merit. Selection of these bulls is based on breed alone, and there is considerable variation in the birth weight, gestation length, and weaning age of the resulting calves. Dystocia caused by large calves deters dairy farmers from using beef-breed bulls, and slow-growing beef-cross-dairy calves deter finishers from rearing the calves. There are many recorded beef-breed bulls available to the dairy industry, which have performance-based estimated breeding values (EBV). Therefore, recorded bulls could be selected for use over dairy cows to produce smaller calves to minimise the risk of calving difficulty, and to shorten gestation length. In addition, the bulls could be selected for growth potential to improve the rearing potential of the progeny.
Birth weight is positively genetically correlated with weaning weight, and gestation length [
7,
8,
9,
10,
11,
12,
13]. The ideal for beef bulls used over dairy cows is low birth weight, short gestation, and high weaning weight or rapid pre-weaning growth. Given the nature of the genetic correlations among these traits, individual bulls are unlikely to excel in all traits. Nevertheless, some breeders have been applying multiple trait selection for these traits for many years and identifying bulls that perform well in all traits, these bulls would be beneficial to the industry.
The aim of this study was to quantify the effect of sire on birth weight, gestation length, and age at weaning achieved by progeny born to mixed-aged dairy cows bred to a selection of Angus and Hereford bulls on a single dairy farm.
2. Materials and Methods
This study was conducted at Limestone Downs, near Port Waikato, New Zealand (37°28′S, 174°45′E). The study and all handling procedures were approved by the Massey University Animal Ethics Committee (MUAEC 15/65).
2.1. Animals
The study included 980 singleton calves, born over a three-month period (July to September) in each of two consecutive years (2016, n = 512; 2017, n = 468). Calves were born to mixed-aged, multiparous dairy cows artificially bred using semen from Angus and Hereford bulls.
There were 701 and 749 lactating, mixed-aged cows mated to generate calves for the study in 2015 and 2016, respectively; these cows comprised the entire dairy herd at Limestone Downs that were observed in oestrus during the period of artificial breeding. The cows were predominantly Holstein-Friesian or Holstein-Friesian-Jersey crossbred cows, typical of a New Zealand dairy herd, however, pedigrees and breed proportions of individual cows were not recorded.
The Angus and Hereford bulls used in this study were selected from bulls nominated for progeny testing by breeders, where selection was based on within-breed EBV generated by BreedPlan [
14]. Bulls were selected to achieve a spread of gestation length and 600-day weight EBV across the breed percentiles, while birth weight was restricted to a spread within the lighter half of each breed at the time of selection, to minimise calving difficulty. Semen used in the study was donated by the bull breeders.
Sixty-five bulls (Angus n = 31, Hereford n = 34) were selected. The EBV for the bulls are continually updated as part of the Breedplan analysis as more information is recorded, however, the data recorded on the progeny measured in this study were not included in the generation of EBV for the sires. At April 2020, the Angus bulls ranged from −0.3 to 5.7 kg (accuracy 71–99%) for birth weight EBV (representing the 0–85th percentile within breed for 2018 born calves), −10.1 to −0.4 days (accuracy 61–99%) for gestation length (1–95th percentile), and 23 to 59 kg (accuracy 70–99%) for 200 d weight (1–100th percentile). The Hereford bulls ranged from −2.5 to 6.8 kg (accuracy 74–99%) for birth weight EBV (representing 0–95th percentile), −9.8 to 4.6 days (accuracy 45–99%) for gestation length (0–100th percentile), and 18 to 48 kg (accuracy 69–99%) for 200 d weight (0–99th percentile). There were 25 bulls used in both years, 23 bulls used only in 2016, and 17 bulls used only in 2017.
2.2. Management
2.2.1. Generation of Case Study Calves
Lactating mixed-aged cows were artificially bred to Hereford and Angus bulls over a 63-day and 54-day breeding period in 2015 and 2016, respectively. Bulls in each year were allocated to one of 8 (2015) or 7 (2016) mating teams, which were rotated each day of mating. Cows submitted for insemination were allocated at random to the bulls in the team assigned for that day. Cows inseminated on more than one occasion were randomly assigned to a sire each day that they were inseminated, with no consideration of which bulls had been previously used over that cow. Bulls used in a single year were used for 39 inseminations each. Bulls used over both seasons were used for 20 inseminations in the first year, and the number of straws for the second year was adjusted based on conception rate in the first year, with the aim of generating 15 calves per sire. All inseminations were carried out by commercial technicians, and recorded in herd management software (MINDA™, LIC, Hamilton, New Zealand).
2.2.2. Calving
Each day during the calving period, all calves born in the previous 24 h (alive or dead) were brought into the calf shed at approximately 10 am. Live calves were tagged with visual and electronic tags upon arrival at the shed. Parentage and, therefore, sire-breed was determined by DNA parentage assignment (Zoetis, Dunedin, New Zealand), using ear-punch tissue samples (Allflex, Palmerston North, New Zealand).
Cows due to calve were checked first in the morning and last in the afternoon, and assistance was provided at the discretion of the farm staff. With the exception of DNA parentage assignment, these practices were typical of New Zealand dairy farm management.
2.2.3. Calf Rearing
Calves were reared under commercial management in group housing. Due to restrictions on space available in the rearing shed, 119 calves born in the first three weeks of the 2016 calving season were moved to an alternative commercial calf rearing facility at 7–14 days of age, returning after weaning. All other calves were reared on-site at Limestone Downs. As calves approached weaning, they were weighed at approximately weekly intervals. Calves were weaned off milk when they reached a minimum of 85 kg live weight at Limestone Downs, or 75 kg live weight at the off-site rearing facility, in accordance with standard practice for each farm. In 2016, bull calves were castrated after weaning off milk, whereas in 2017, bull calves were castrated at approximately 8 weeks of age. These practices are consistent with calf rearing practices in New Zealand.
2.3. Measurements
Calving assistance was scored as unassisted, assisted with normal presentation, or assisted with abnormal presentation.
Date of birth was recorded as the date which the calf was brought into the rearing shed. Sex and birth weight were recorded on arrival to the shed, prior to being fed. Birth weight was recorded using a Pratley calf weigh crate (Prattley Industries LTD., Temuka, New Zealand) and a Tru-Test weigh-head (EziWeigh7i, Tru-Test, Auckland, New Zealand) and load bars (MP600, Tru-Test, Auckland, New Zealand). Dead calves were disposed of after recording birth weight, birth date and sex.
Calf conception date was determined using the artificial breeding records (recorded in MINDA™ software) to identify the date when the DNA-assigned dam was inseminated using semen from the DNA-assigned sire. Gestation length was calculated as date of birth less conception date.
Live weight at weaning and date of weaning was recorded for each calf. Calf deaths were recorded for the calving (prior to calf collection) and rearing (calf collection to weaning) periods.
Cows were weighed twice daily after milking, using a walk-over-weigh system (ProTrack, LIC, Hamilton, New Zealand) until 30 days after the last cow had calved. Cow body condition score (BCS) was recorded prior to calving (14 June 2016 and 29 June 2017) on a 1–10 scale (DairyNZ, 2012) by the same certified assessor each time.
All data except walk-over-weights and artificial breeding records were recorded by the authors or associated research technicians. Artificial breeding records were recorded by the artificial breeding technician using herd management software, and walk-over-weights were recorded automatically. Some mating records were incomplete and some walk-over-weights were missed due to faulty or missing tags in those cows. Incomplete mating records were the result of cows missing tags and having no mating records at all, or of visual tags being mis-read or mis-entered into the records. Ideally, research staff would have been present on farm throughout mating to ensure precise records were kept, but there would still have been potential for mis-assignment of calves to dams (and therefore, to sires) due to mis-mothering in a herd-calving situation. Therefore, DNA parentage assignment was necessary regardless of the reliability of mating records. The use of DNA parentage assignment allowed incorrect mating records to be identified. This approach meant gestation length could not be assigned to some calves for which there was no correct mating record, however, this was a random selection of calves and would not bias the record of affected sires.
2.4. Statistical Analysis
2.4.1. Data Cleaning
Over the two years, of the study 1019 calves were born. Data from 39 calves were removed prior to analysis. The 39 excluded calves consisted of 7 with no sire assigned by DNA parentage analysis; 30 twin-born calves; and 2 calves born prematurely (<260 days gestation).
Dam was unassigned for 8 calves, and age of dam was unknown for a further 19 calves for which dam was known. These calves were included in the dataset, but not included in models that included age of dam as an explanatory variable. A further 84 calves were born to dams that did not have a recorded mating that matched the DNA-verified sire of their calf, due to the missing mating records for some cows. These calves were not included in the analysis of gestation length, but remained in the analyses of other traits.
Deviation from median date of birth and deviation from mean date of conception were calculated within year. A negative value indicated that the calf was born or conceived before the median date.
A 30-day mean post-calving live weight for each cow each year was calculated using all weights recorded in the 30 days after calving. Live weights were cleaned to remove outliers by calculating the mean and standard deviation for each cow within year. Live weight records for individuals which were more than four standard deviations from the mean within year were removed, and the mean recalculated [
15]. This method was iterated until no more records were deleted [
15]. This left a dataset comprising 36,751 liveweight records (261 records removed) from 927 cow-years.
Pre-calving body condition score (BCS) was grouped into ≤4, 4.5, and ≥5, because few cows scored less than 4 or more than 5. Cows aged 7 years or older were grouped into 7+ years of age.
2.4.2. Statistical Models
Data were analysed using SAS (Version 9.4, SAS Institute Inc., Carey, NC, USA). Descriptive statistics were calculated for birth weight, gestation length, age at weaning, calving assistance, and live weight of the cows. There were too few calves requiring assistance at birth to warrant statistical analysis.
Birth Weight, Gestation Length, and Age at Weaning
Least squares means for progeny birth weight, gestation length and age at weaning for each sire were obtained using a general linear model that included the fixed effects of sire nested within breed of sire, calving year, and sex of calf. Age of dam and pre-calving body condition score of the dam were considered as fixed effects, and removed where not significant (p > 0.05), leaving age of dam in the models for birth weight and gestation length. Post-calving live weight of the dam and deviation from mean date of birth (or date of conception for gestation length) were considered as covariates and retained only in the model for birth weight. The model for age at weaning also included the covariate of weaning weight, and calving year was replaced with contemporary group (defined as the group of calves reared in the same location and year; three groups in total).
Phenotypic and Genetic Correlations
Variance components required for the calculation of genetic and phenotypic correlations were obtained using a linear mixed model with the same fixed effects and covariates as for the general linear model except that sire nested within breed was fitted as a random effect.
The estimated residual variance from the linear model was used to calculate an estimate of genetic variance for the Angus and Hereford bulls using the equation
where σ
2g is the genetic variance, h
2 is the heritability estimate, and σ
2e is the residual variance calculated in the linear model. The heritability estimates used in this calculation were 0.32 for birth weight, 0.65 for gestation length, and 0.12 for age at weaning (heritability of 200-day weight), which are the New Zealand Angus estimates published by BreedPlan [
16]. The Angus estimates were used because the New Zealand Hereford estimates are not published but are likely to be similar.
Genetic and phenotypic correlations between birth weight, gestation length, and age at weaning were obtained using ASReml (Version 4, [
17]) with a multitrait animal model including three generations of the sires’ pedigrees. Models for birth weight and gestation length included the contemporary group of year, the fixed class effects of sire-breed, sex, and age of dam and random effect of animal. The birth weight model also included the covariate of deviation from median date of birth and dam post-calving live weight. The model for age at weaning included the contemporary group of location-year, the fixed effects of sire-breed and sex, random effect of animal, and covariate of weaning weight. The residual and genetic variances were fixed in the models.
4. Discussion
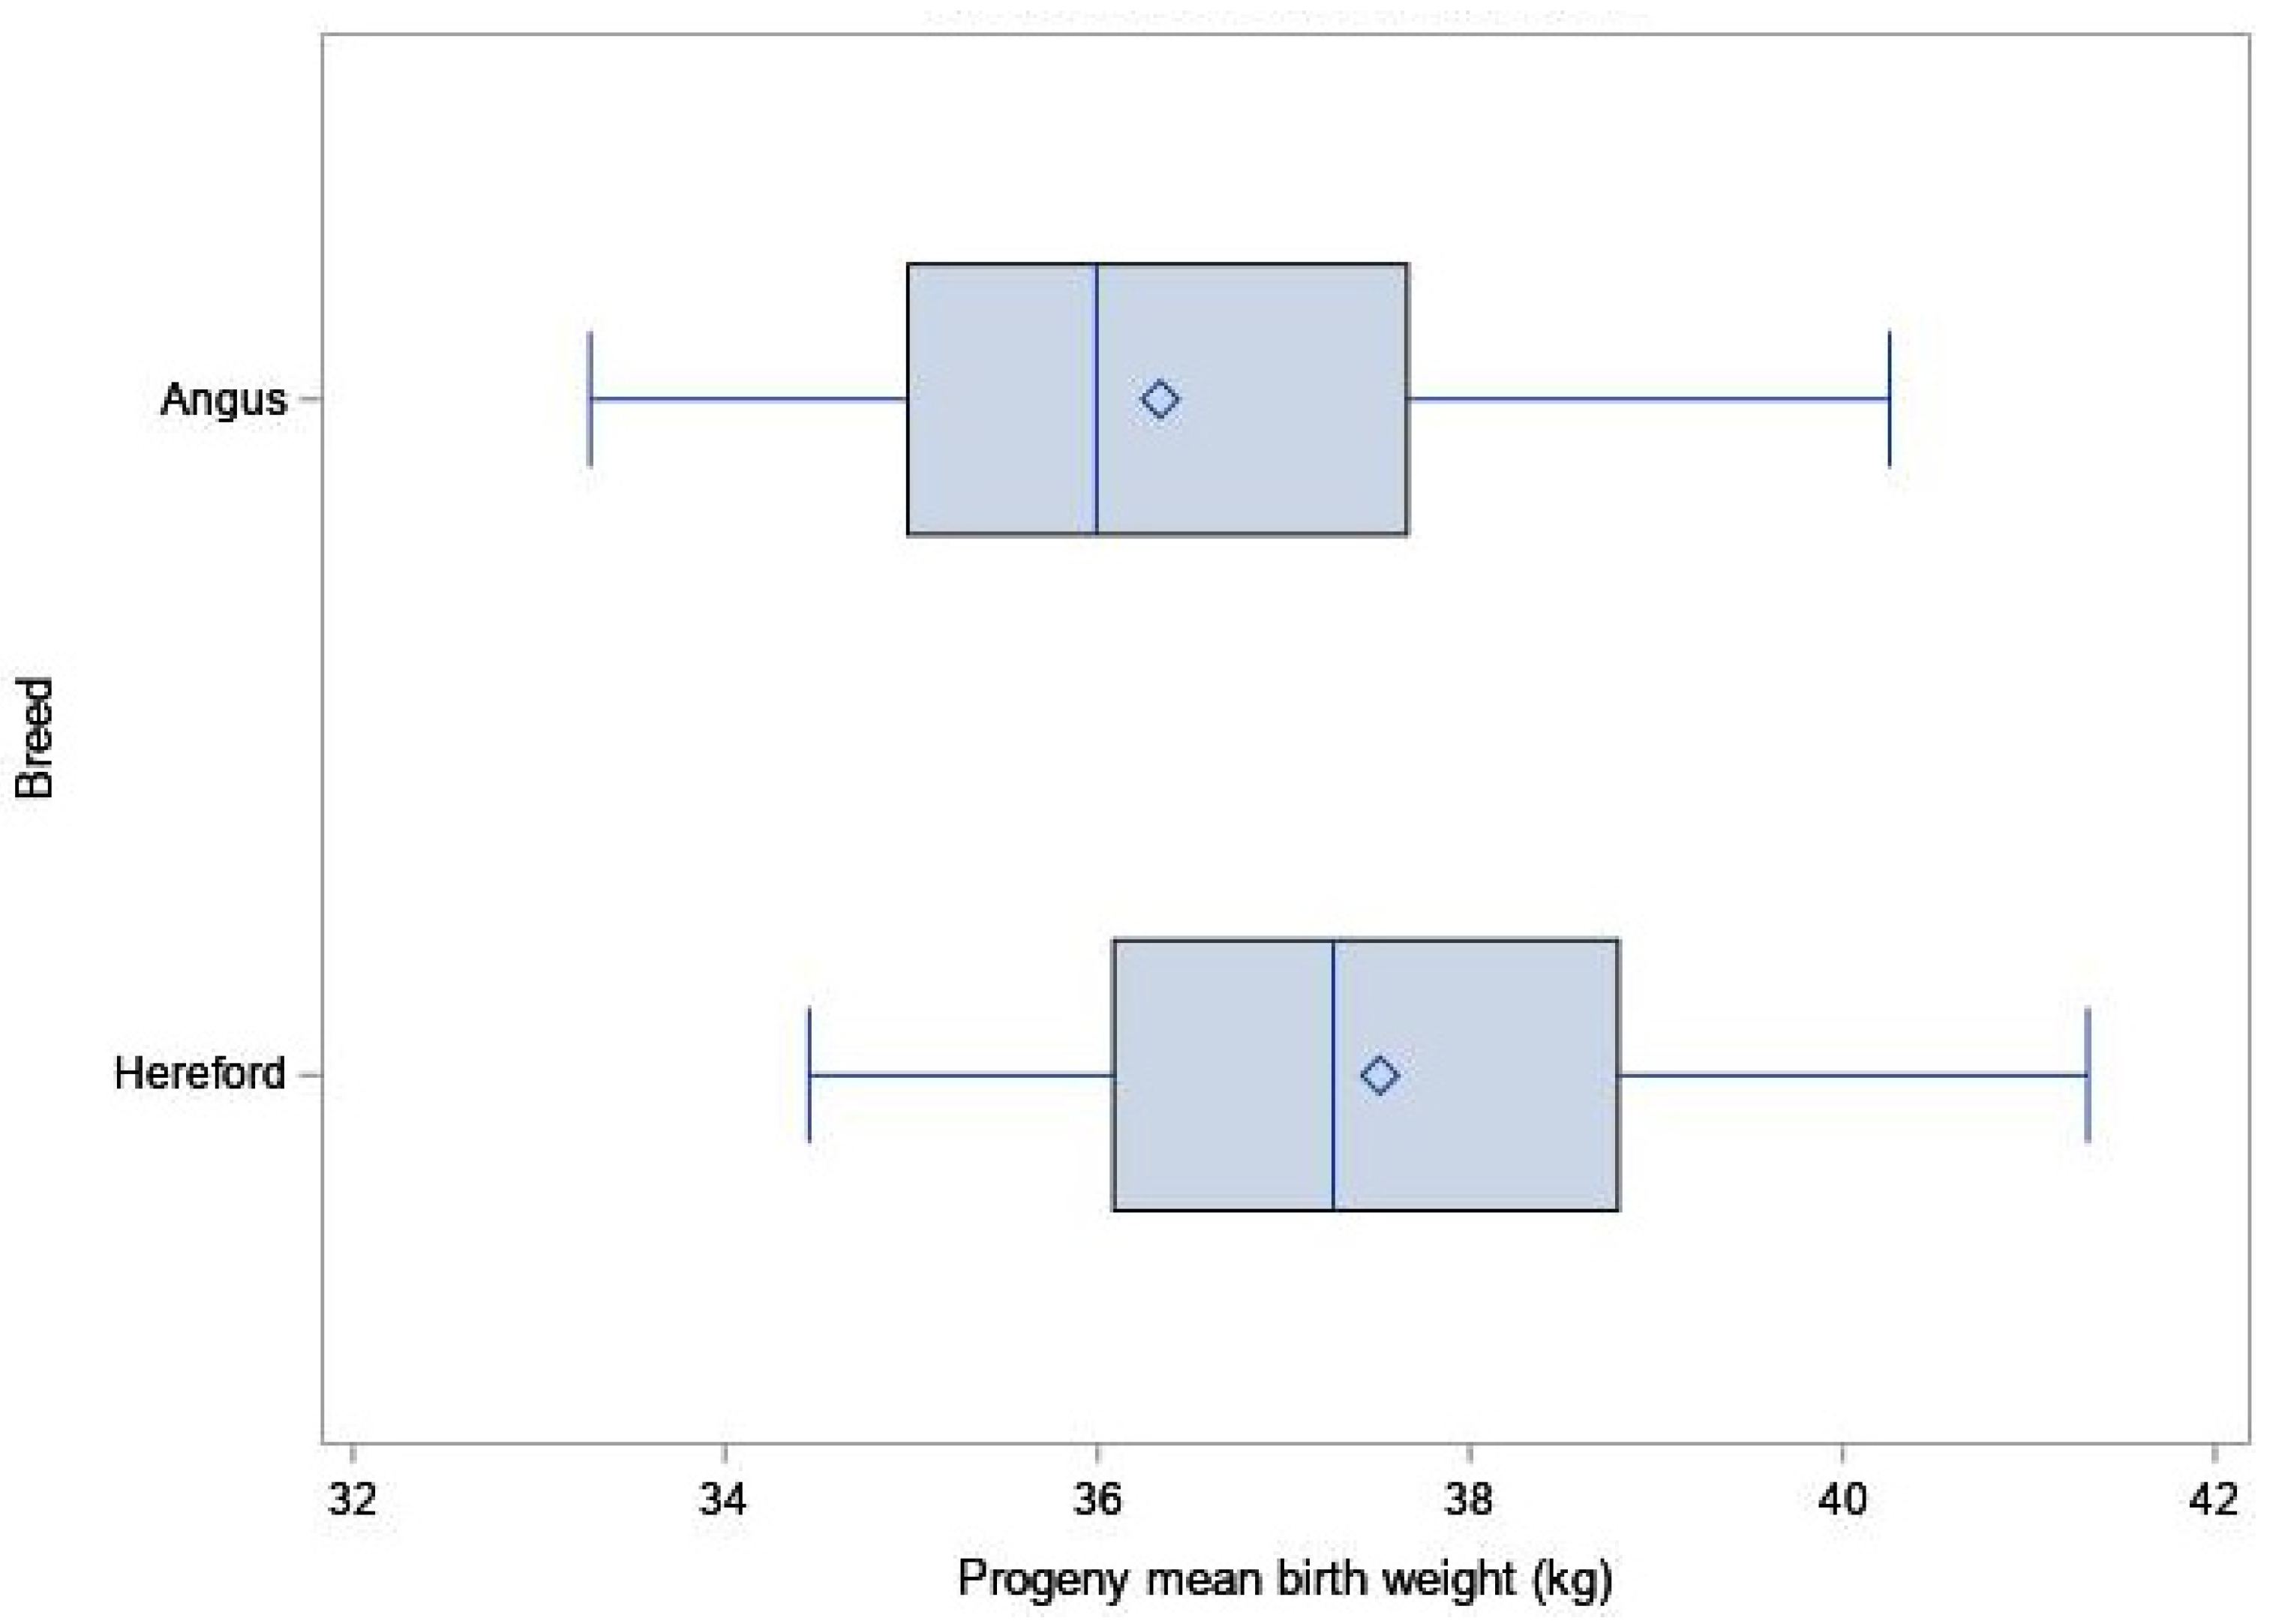
The variation among the sires for progeny birth weight indicated that choice of sire could change birth weight by as much as 8 kg in spring-calving herds, even when selecting sires from within the same breed. The lighter calves from Angus bulls than from the Hereford bulls used in this case study was consistent with previous literature that reported a 1.4–3.5 kg greater birth weight for Hereford than Angus calves [
12,
19,
20,
21,
22]. It should be highlighted that the current study was not a breed comparison, because individual bulls were selected to achieve a spread of EBV and were not a random sample from the breed, and, therefore, may not accurately represent the breed as a whole.
There are few reports of birth weight for calves born in dairy herds in New Zealand. A 2015 study [
4], reported mean birth weight of female calves to be 36.1 kg for Holstein Friesian calves, 31.7 kg for Holstein Friesian-cross-Jersey calves and 27.6 for Jersey calves. The current herd was a mix of Holstein Friesian and Holstein Friesian-cross-dairy cows, so the likely birth weight expectation, had they been mated to similar dairy-breed bulls, would have been around 35–36 kg, allowing for an increase in weight due to male calves. Therefore, the Angus bulls used in the current study likely produced similar-sized calves as if the herd had been bred to dairy-breed bulls, whilst the Hereford bulls sired calves with heavier birth weights. Nevertheless, there were sires within each breed that produced light calves.
The rate of assisted births in this case study (0.72%) was lower than the reported assistance rates (range 2.0–20.9%) for New Zealand mixed-aged, dairy- and beef-breed, cattle [
23,
24,
25,
26]. There is a greater incidence of calving difficulty in Hereford (cross and straight bred) calves compared with Angus (cross and straight bred) calves; and in calves with greater birth weights [
13,
20,
22,
27]. The low incidence of assisted births in this study illustrated that the bulls used were suitable to be used over mixed-aged dairy cows, and it can be expected that bulls with a similar birth weight EBV should also be suitable for use in the New Zealand dairy industry.
In New Zealand, industry recommendations for calf rearers purchasing four-day-old, dairy-origin, calves for rearing for beef production recommend that calves should ideally be at least 40 kg, with a minimum purchase weight of 35 kg [
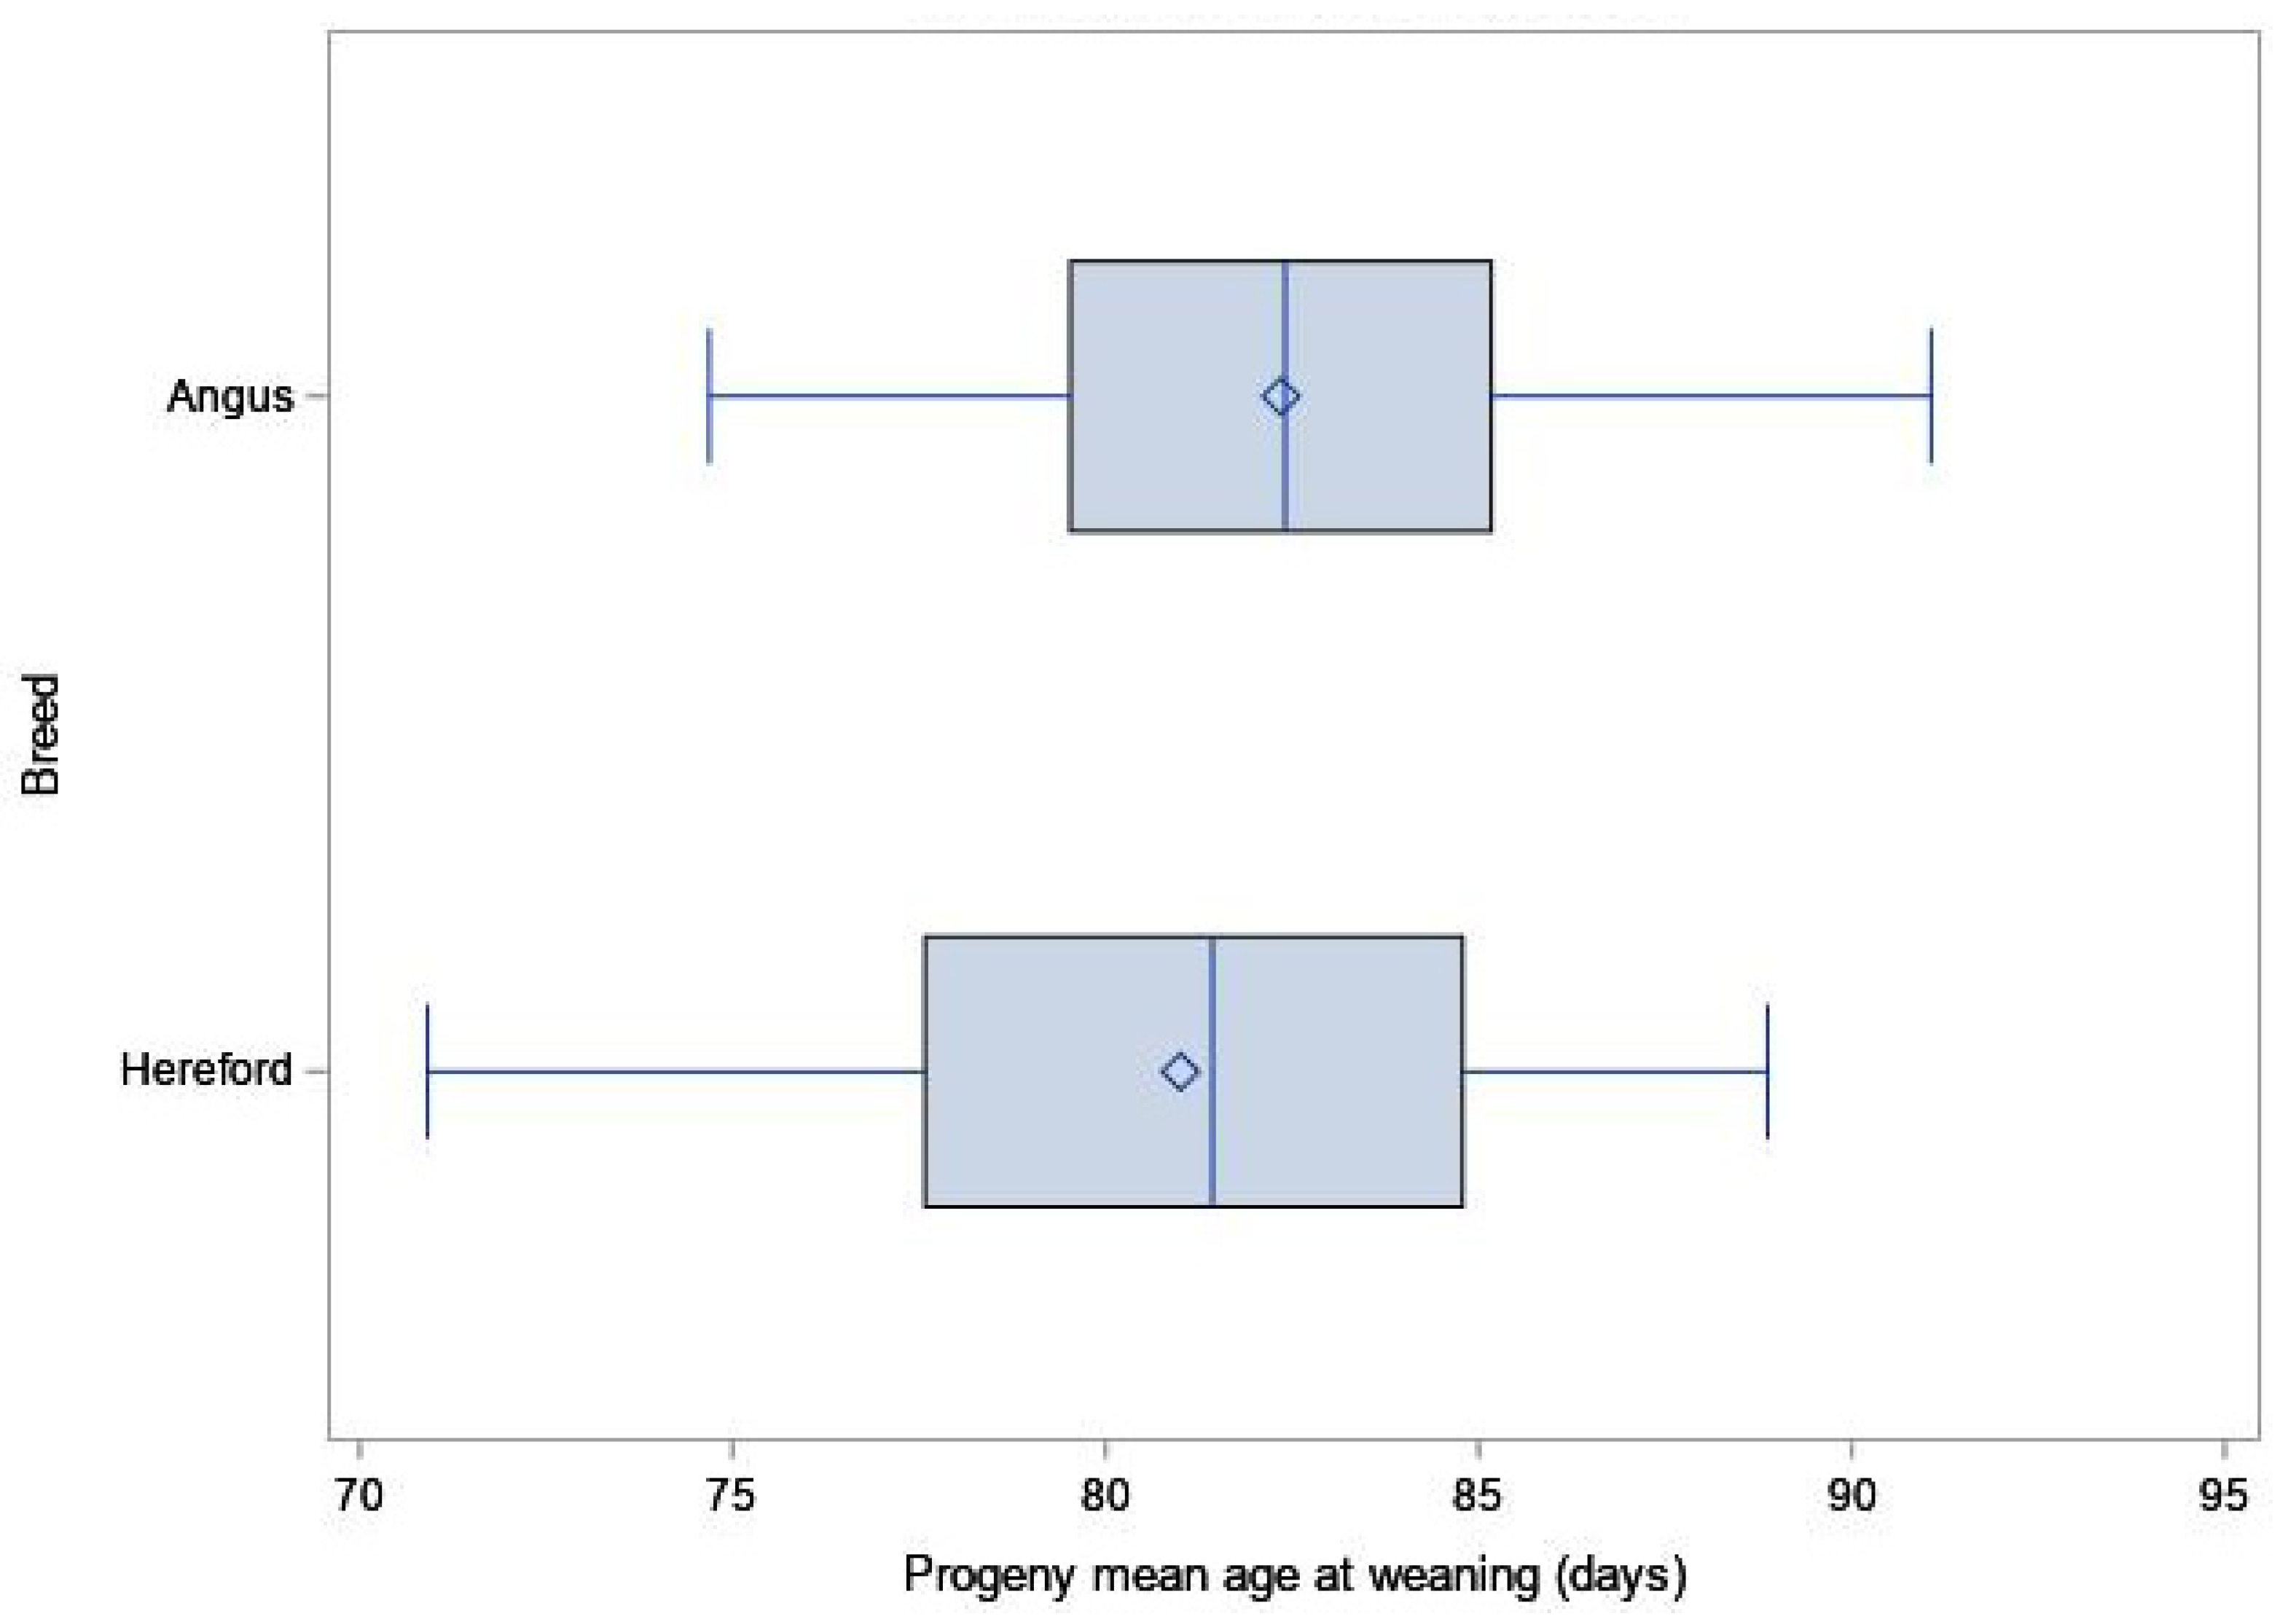
28]. The mean birth weight of calves in this study was only 1.8 kg greater than the recommended minimum, and only 26% of calves were at or above the ideal 40 kg weight. Under the current recommendations, 34% of the calves in this study would not be recommended to purchase for rearing for beef production (<35 kg). This highlights the tension between the need to ensure calves are small enough to be born easily without impacting the dairy cow, and the need to ensure calves are large enough at birth that they can reach the target weaning weight in a reasonable time. The positive phenotypic correlation between birth weight and age at weaning confirms the need to be cautious about the economics of rearing lighter calves, which underpin the industry recommendations. Further research is needed to determine the optimum birth weight to achieve calves that reach weaning weight early without causing calving difficulty, or alternatively, to explore the impact on post-weaning growth if calves that are light at birth are weaned off milk at lighter weights, but at a similar age to calves that were heavier at birth.
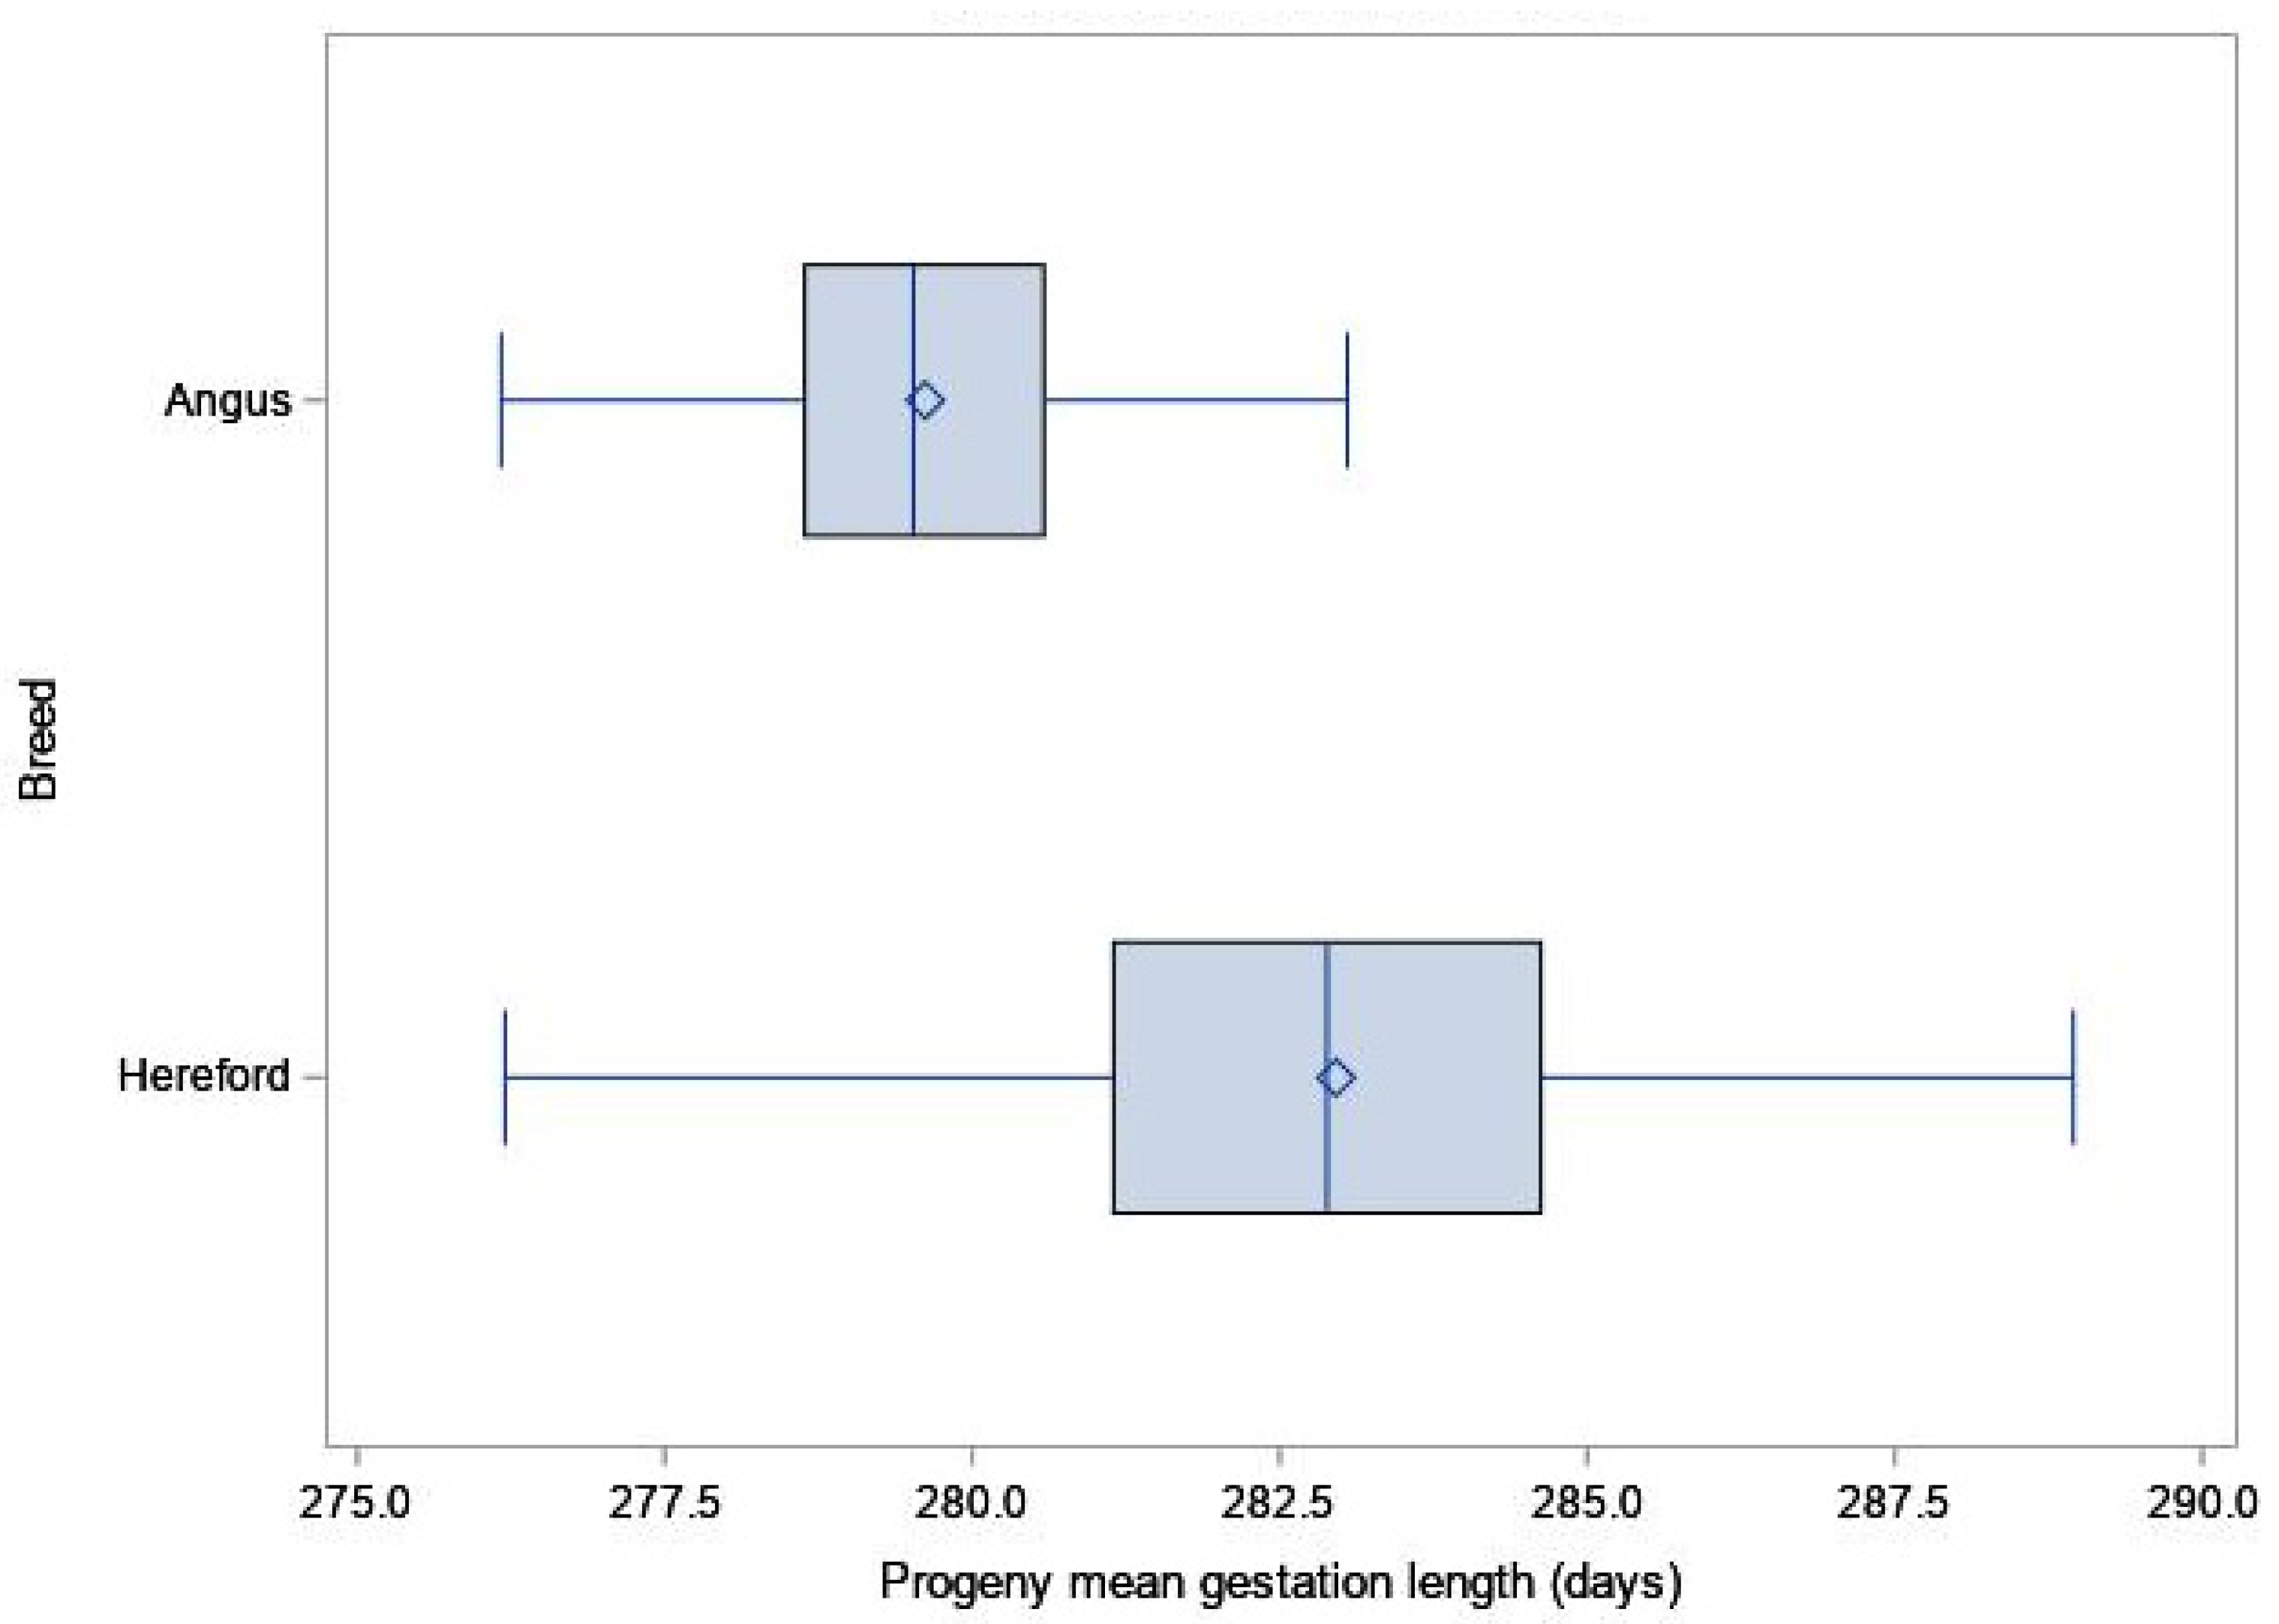
More Angus bulls than Hereford bulls used in this study produced calves with shorter gestation length than the dairy average gestation length (<281 days; 25 Angus bulls versus 8 Hereford bulls). The difference in gestation length of calves between sire-breeds in this analysis is consistent with the literature, which reports that straight-bred or cross-bred Angus calves have a shorter gestation than Hereford breed calves (range 1–5.4 days) [
12,
13,
20,
21,
22,
27,
29,
30]. A shorter gestation length benefits the dairy industry by decreasing the calving interval, which would reduce the calving spread, and due to calving earlier in the season, there is the potential for cows to have more days in milk [
18,
31,
32,
33,
34].
The genetic correlation between birthweight and gestation length was negative, indicating that selecting for shorter gestation is likely to result in increased birthweight, in the absence of selection pressure on other traits. This negative correlation conflicts with previous reports for both dairy-breed and beef-breed cattle, (genetic correlations range 0.15–0.63 [
7,
8,
9,
10,
11,
12,
13]), and indicates further investigation using a larger population with known maternal pedigree, and the inclusion of purebreds as well as crossbreds, would be worthwhile. In contrast, the moderate positive phenotypic correlation between birth weight and gestation length, is consistent with other studies which report a positive correlation [
8,
10,
13,
35].
There was variation among the bulls used in this case study for progeny birth weight, gestation length, and age at weaning, indicating selection of appropriate bulls could be used to improve performance of beef-cross-dairy calves in dairy herds. Sire means ranged from 33.3 to 41.4 kg for birth weight, 276.1 to 288.6 days for gestation length, and 70.3 to 88.3 days for age at weaning, which is sufficient variation to have on-farm economic implications. The rate of assistance at birth in this study was very low, indicating that despite the variation among bulls for birth weight, the Angus and Hereford bulls used were acceptable for use over mixed-aged dairy cows. Birth weight was unfavorably genetically correlated with gestation length and age at weaning, indicating that given all bulls achieved satisfactory calving ease at these birth weights, selection of beef bulls for use over dairy cows in spring-calving seasonal dairy herds should emphasize gestation length and pre-weaning growth among bulls that have sufficiently low birth weight to prevent calving difficulty.
Dairy farmers wishing to use beef bulls over their dairy herd should consider their choice of sire, within their choice of breed. They will need to be conscious of the tradeoffs between calving traits and growth traits, with the relative importance of these traits specific to the herd scenario. The goal should be to produce calves that are born without assistance that strike the right balance between income from calf sales and income from extra days in milk, for the herd in question.


