Article

Diesel Particle Filter Requirements for Euro 7 Technology Continuously Regenerating Heavy-Duty Applications

by
Athanasios Mamakos
1,
Dominik Rose
1,
Anastasios Melas
2,
Roberto Gioria
2,
Ricardo Suarez-Bertoa
2 and
Barouch Giechaskiel
2,*
1
Corning GmbH, 65189 Wiesbaden, Germany
2
European Commission, Joint Research Centre, 21027 Ispra, Italy
*
Author to whom correspondence should be addressed.
Submission received: 16 September 2023 / Revised: 23 October 2023 / Accepted: 4 November 2023 / Published: 7 November 2023

Abstract

:
The upcoming Euro 7 regulation for Heavy-Duty (HD) vehicles is calling for a further tightening of the Solid Particle Number (SPN) emissions by means of both lowering the applicable limits and shifting the lowest detectable size from 23 nm (SPN23) to 10 nm (SPN10). A late-technology diesel HD truck was tested on a chassis dynamometer in order to assess the necessary particle filtration requirements for a continuously regenerating system. The study showed that passive regeneration under real-world operating conditions can lead to a significant release of SPN10 particles from the current technology Diesel Particulate Filter (DPF) when soot-loaded, even exceeding the currently applicable emission limits. The actual emissions during passive regeneration and following the clean-up of the DPF exceeded the proposed Euro 7 limits by more than an order of magnitude. A prototype DPF, exhibiting a 99% filtration efficiency when clean, was shown to effectively control SPN10 emissions under both operating conditions. The shift to SPN10 also necessitates control of nanoparticles forming inside the Selective Catalytic Reduction (SCR) system, which for the tested truck exceeded the proposed (hot) limit by up to 56%. A dedicated particle filter specifically designed to capture these particles was also evaluated, showing a better than 60% efficiency. The key message of this study is that SPN emissions can be kept at low levels under all conditions.

1. Introduction

The introduction of progressively tighter emission standards in the European Union (EU) has brought significant reductions in automotive exhaust emissions since their first implementation in the early 90s. The continuous development of emission control systems was of paramount importance in achieving the set emission targets. However, road transport remains a major source of air pollution, accounting for 39% of NOx, 11% of fine particulate matter (PM2.5) and 26% of black carbon [1]. Consequently, a proposal for a new (Euro 7) emission standard was recently published, calling for further emission reduction over a wider range of operating conditions and an extended useful life, taking advantage of state-of-the-art emission control technologies [2,3]. With respect to particulate emissions, the elevated solid particle number (SPN) levels during and immediately after the regeneration of the Diesel Particulate Filter (DPF), as well as the emission of sub-23 nm nanoparticles, were identified among the most relevant unregulated conditions [2].
The SPN regulation was introduced in 2011 for Euro 5 light-duty cars [4] and in 2013 for Euro VI Heavy-Duty (HD) engines [5] as a more sensitive technique from the conventional gravimetric method (PM), with the intention to require the installation of DPFs in all diesel-fueled vehicles to reduce particulate emissions. The SPN methodology is targeting solid particles (defined as those surviving thermodilution at 300 °C to 400 °C). Currently, the regulation requires particle counters with a lower detection size at 23 nm (SPN23), mainly due to concerns about volatile artifacts typically residing at sizes below 20 nm [6]. However, following extensive investigations, the necessary modifications that would allow robust measurements down to 10 nm (SPN10) have been incorporated in the recently updated Global Technical Regulation to which the Euro 7 regulation will be referring [7].
All modern light-duty and HD diesel vehicles homologated in the EU are equipped with DPFs in order to meet the SPN23 limit [8,9]. DPF systems can regenerate either actively or passively, depending on the means of oxidizing the accumulated particles (predominantly soot) [10,11]. Active systems rely on active management of the exhaust gas temperature to periodically regenerate the DPF. Passive systems utilize catalysts to promote soot oxidation (mainly with NO2) at temperatures encountered during normal vehicle operation. Since the two approaches can complement each other, combined systems are also common. Purely passive systems are only encountered in the HD sector.
The current EU HD regulation [12] classifies emission control devices as periodic or continuous, depending on whether the regeneration process occurs periodically in less than 100 h of normal operation. Continuously regenerating emission systems need to comply with the emissions limits under all operating conditions (even during passive regeneration events). For periodically regenerating systems, a procedure is defined to weigh the emissions during active regeneration and during normal operation based on the frequency of regeneration events, allowing exceedance of the regulatory limits during regeneration. However, this procedure is currently applicable only to PM and not to SPN23, effectively implying that SPN emissions during active regenerations are not considered.
A number of publications have investigated the SPN emissions during active regeneration of HD diesel vehicles and trucks [13,14,15,16,17,18,19,20,21,22,23]. Dedicated hot start tests on two HD engines suggested that SPN23 emissions during regenerations exceeded 1013 #/kWh, constituting 43% to 81% of what would be a weighted certification value [15]. It should be noted, however, that the specific engines were certified only for PM and not for SPN23 (Japanese 2009 regulation). Such high SPN levels during active regenerations have also been reported by other studies [19,20]. One study measured the SPN23 emissions of two Euro VI HD trucks over a period of more than a month each, including active regeneration events [19]. The calculated weighted SPN23 emissions were reported to be below but close to the Euro VI limit. With a further tightening of the SPN limits, some improvements in the DPF filtration efficiency would be required even when weighing the results.
Limited information is available in the literature on emissions during HD passive regeneration [6,24,25]. This is partly due to the difficulty in identifying such events since no signal from the engine Electronic Control Unit (ECU) is available for these operating conditions. Dedicated experiments on a model–year 2021 HD diesel engine highlighted the importance of DPF soot load as well as the relative concentration of NOx to soot (NOx to soot ratio–NSR) on the SPN emissions downstream of the DPF during passive regeneration. More specifically, operation at high NSR and exhaust temperatures in the 300 to 400 °C range (typical for passive systems) led to very fast soot oxidation rates in a soot-loaded DPF that resulted in significant SPN emissions [24]. In contrast, SPN emissions from an initially clean DPF remained at low levels following some soot built up at the beginning of the tests [24]. Still, SPN10 emissions from current technology DPFs were found to exceed the proposed Euro 7 limits during passive regeneration, even when tested clean [6]. The importance of soot load on particle emissions during passive regeneration was also highlighted in dedicated tests using commercial carbon black (Printex-U) [25].
The shift to SPN10 has also highlighted the importance of controlling particles emitted from Selective Catalytic Reduction (SCR) systems. Size distribution measurements suggested that the mean size lies below 20 nm [26,27], while typical exhaust SPN10 concentrations are in the order of several tenths of thousand #/cm−3 [26,28,29,30,31]. Brake-specific SPN10 emissions from the SCR system were reported to range between 0.2 × 10¹¹ to 2 × 10¹¹ #/kWh [6,27,29], that is between 10 and 100% of the proposed Euro 7 90th percentile limit of 2 × 10¹¹ #/kWh.
The main objective of this work was to investigate the effect of SCR and DPF regeneration on the SPN10 emissions of a continuously regenerating Euro VI step E HD diesel truck in order to establish the necessary filtration requirements for Euro 7 applications. To this end, two dedicated Euro 7 filters designed to address the SPN10 emission during regeneration and the SPN10 emissions forming in the SCR, respectively, were evaluated. The study suggested that an improvement of more than an order of magnitude in the filtration efficiency of the Euro VI DPFs will be required to address the SPN10 emissions during and following passive regeneration. The SPN10 emissions originating from the SCR system led to an exceedance of the 90th percentile limit of 2 × 10¹¹ #/kWh by 25% to 55%. The two Euro 7 filters tested were effective in controlling the SPN10 emissions of the truck within the new limits under all operating conditions studied.

2. Materials and Methods

2.1. Vehicle

The test vehicle was a 4 × 2 tractor equipped with a 13 l, 500 hp diesel engine homologated to Euro VI step E. The reference work (Wref) over the World Harmonized Transient Cycle (WHTC) was 34 kWh [32]. The vehicle and the Original Equipment Manufacturer (OEM) filter had an accumulated mileage of ~44,500 km and 20,000 km, respectively, at the start of the campaign. Commercial diesel fuel (fulfilling EN590 specifications) and urea solution were used in the tests.

2.2. Emission Control Systems

The OEM after-treatment of the truck utilized a diesel oxidation catalyst, SCR, and catalyzed DPFOEM technologies to control exhaust emissions. The specific vehicle relied on passive regeneration of the DPF.
A prototype high filtration efficiency cordierite (HFC) wall flow filter (DPFHFC3.0) of the same size and cell density (18 l, 300 cpsi) with the DPFOEM was also evaluated. Both filters had asymmetric cell designs for increased ash storage capacity. The prototype DPFHFC3.0 was processed via Corning’s proprietary Accelerated Purification Technology (APT), resulting in a hierarchical microstructure with smaller pore sizes at the surface compared to the bulk of the wall [33]. This technology offers improved filtration efficiency of clean filters at a target pressure drop and has been widely employed in filters installed on direct injection gasoline vehicles since the Euro 6 step E [33]. An oxidation catalyst-based washcoat was also applied to the DPFHFC3.0.
A second, brand-new (no ash accumulated) DPFOEM was also specifically purchased for this study and was pre-loaded with soot at a level of 3 g/L on an engine test bench at Corning Inc. (Painted Post, NY, USA).
A 4.6 l Ø9.5″ × 4″ long, rear-plugged particle filter of 300 cpsi cell density was also evaluated as a dedicated filter targeting particles forming inside the SCR. The specific filter is referred to here as the Corning® DuraTrap® Emissions Finishing Cordierite (EFC) component. It is intended to be integrated with the SCR system downstream of the DPF, which, in the case of the test truck, is a dual-leg system within the same after-treatment box and may also be washcoated. However, in the present study, a single uncoated EFC was installed in a dedicated canning downstream of the after-treatment box.

2.3. Test Cell

All measurements were conducted at the HD vehicle laboratory of the Joint Research Centre (JRC) of the European Commission, located in Ispra (Italy). The laboratory is equipped with a four-wheel drive, two-axis roller chassis dynamometer specifically designed for HD vehicles. All tests were conducted at a climatically controlled ambient temperature of 23 °C. The temperature was well controlled within ±1 °C, with some parts of the cycle with high engine demands reaching +2 °C from the set point. The exhaust tailpipe was connected to a full dilution tunnel with a Constant Volume Sampler (CVS) operating at a total flow rate of 100 m3/h.

2.4. Test Protocol

The truck was tested under a pre-determined In-Service-Conformity (ISC) cycle developed at JRC for N3 category trucks [34]. The cycle is compliant with the Euro VI step E regulation [35] requirements. It contains distinct urban, rural, and highway sections, with relative time shares of 27.1%, 26.4%, and 46.5%, respectively. The corresponding average speeds are 23, 59, and 80 km/h. The vehicle speed and road slope profiles, as well as the corresponding engine map, are illustrated in Figure 1. The slopes of the urban part were very low because the area was quite flat. We decided not to include them as the values were close to the experimental uncertainty of determining them. All ISC tests were performed with the engine cold and the coolant temperature below 30 °C as prescribed in the Euro VI step E regulation.
A sequence of steady speed tests at 30, 60, and 90 km/h under road load were also performed twice (following the ISC cycle), focusing on the characterization of the EFC filtration efficiency at different exhaust flows.
The after-treatment system was conditioned at the end of each measurement day by running the truck at 80 km/h and full load to regenerate the DPFs. No information on the soot load of the DPF was available from the ECU. Therefore, the SPN recordings were used to monitor the progress of the soot clean-up. The test was stopped upon stabilization of SPN emissions for at least 5 min, following a rise indicative of soot cake consumption. This conditioning process lasted between 25 and 35 min. Following the conditioning, the vehicle was soaked at 23 °C for at least 12 h.
Table 1 summarizes the exact test sequence. Both the ISC and the steady speed tests were performed with a simulated gross vehicle weight of 29 tn on the dyno, corresponding to ~66% of the maximum permissible gross weight of the truck (44 tn). The road load coefficients (inertia m = 29 tn, F0 = 1815 N, F2 = 0.205 N/(km/h)2 were estimated from the equations in the literature [36] for the aerodynamic drag F2 = 0.5 × Cd × A × ρair and friction coefficient F0 = m × g × μ, where ρair is the air density and g = 9.8 m/s2. The Cd × A value (4.4 m2) is representative of a long-haul truck with aerodynamic features in the European fleet, according to [37]. The average value of the fuel efficiency class of the tires mounted on the vehicle was chosen for the rolling resistance μ = 6.5 N/kN, according to Regulation (EU) 2020/740.

2.5. Measurement Instrumentation

Two Advanced Particle Counters (APC model 489) (AVL GmbH, Graz, Austria) were employed for the measurement of the SPN emissions. Each APC was equipped with both a 10 nm and a 23 nm Condensation Particle Counter (CPC). The APC incorporates a primary chopper diluter operating at 150 °C, a volatile particle remover at 350 °C, and a secondary mixer diluter operating at ambient temperature. Both APCs were equipped with a catalytic stripper as required in the recent specifications for 10 nm SPN measurements for HD vehicles [7]. An AVL pressure reduction unit was installed on each device to ensure that inlet pressure remained within the specifications of ±25 kPa. The APCs were connected to the pressure reduction unit with a metal transfer line heated to 100 °C. The length of the heated line was 0.5 m at all sampling locations besides the outlet of the turbocharger, where, due to space limitations, a 1 m long heated line was used instead. The Particle Concentration Reduction Factor (PCRF) was set to 500, except at turbocharger out sampling, where a PCRF of 3000 was necessary to maintain concentrations at the inlet of the CPC within its specifications (<30,000 #/cm3). The actual sampling position during each test is provided in Table 1.
An AVL Micro Soot Sensor (MSS) was installed at the outlet of the turbocharger through a dedicated AVL pressure reduction unit to monitor in real-time the mass concentration of the emitted soot. The MSS is a photoacoustic sensor calibrated to report the soot mass concentration [38].
Additional thermocouples and pressure sensors were installed to monitor the temperature and pressures at the outlet of the turbocharger as well as at the inlet and outlet of the first DPF and the downstream SCR. Engine speed, torque, and fuel consumption were recorded from the truck ECU using a dedicated data logger (UniCAN 2, CSM GmbH, Filderstadt, Germany). Exhaust flow rate was calculated from the measured dilution air and total flow through the CVS tunnel.

2.6. Evaluation Methodology

The reported APC concentrations are corrected for the calibrated average Particle Concentration Reduction Factors (PCRF) at 30, 50, and 100 nm and the calibration factors of the connected CPCs. Particle concentrations and exhaust flows were normalized to 0 °C and 1 atm, time aligned, and subsequently multiplied to calculate the instantaneous emissions rates in s−1. The necessary brake power was calculated from the engine speed and torque signals recorded from the ECU.
The SPN emissions over the ISC cycle were calculated following both the Euro VI step E and the proposed Euro 7 methodologies.

2.6.1. Euro VI Step E Analysis

The Moving Average Window (MAW) methodology forms the basis for the assessment of the SPN23 emissions in the Euro VI step E regulation [35]. All recordings during the first 10 min of the test where the coolant temperature was below 30 °C were discarded. The cumulative number of particles over each segment of the remaining test for which the engine work equals Wref was then calculated, proceeding at increments of 1 s. The ratio of the cumulative particle numbers to the reference work yielded the emission rates of the individual MAW segment. The average brake power exceeded the regulatory threshold of 10%, the maximum engine power for all MAW, so all of them were included in the analysis. The largest emission rate for the MAWs starting at a coolant temperature of less than 70 °C constitutes the cold start emissions, while the 90th percentile of the remaining MAWs corresponds to the hot start emissions. The regulated emissions are determined by a 14% and 86% weighing of the cold and hot start results, respectively. The weighted average results should be below 6 × 10¹¹ #/kWh, with an extra 1.63 conformity factor for on-board measurements of SPN23 (i.e., 9.78 × 10¹¹ #/kWh).

2.6.2. Euro 7 Analysis

The proposed Euro 7 regulation is also based on analyzing segments of the test where brake work matches the reference work (provided that the engine brake work over the test trip is longer than 3 × Wref, as was the case with the ISC cycle). These segments are now referred to as Moving Windows (MW). However, in Euro 7, the analysis starts from engine ignition while the minimum average power requirement is tightened to 6%. The brake-specific SPN10 emissions overall MWs are calculated, and the 90th and 100th percentiles should be below 2 × 10¹¹ #/kWh and 5 × 10¹¹ #/kWh, respectively.

3. Results

3.1. Emission Performance of the OEM Aftertreatment Layout Following the Euro VI Step E Methodology

Figure 2 summarizes the emission results evaluated in accordance with the Euro VI step E calculation methodology for the tests with the DPFOEM. The SPN23 emissions of the vehicle in its OEM configuration (downstream of the SCR) for the first two repetitions were at 75% and 57% of the applicable limit. SPN23 emissions over the cold start phase for these two tests were 3.5 × 10¹² #/kWh and 2.9 × 10¹² #/kWh, with the corresponding hot start emissions being 3.4 × 10¹¹ #/kWh and 2.5 × 10¹¹ #/kWh, respectively. The elevated cold start emissions reflect the clean state of the DPFOEM, as both tests were conducted having regenerated the filter the day before. The SCR increased the SPN23 emissions downstream of the DPFOEM by ~1.0 × 10¹¹ #/kWh.
The corresponding emissions over the third repetition, where the DPFOEM was loaded with 3 g/L soot, showed a completely different pattern. The cold start SPN23 emissions were more than three orders of magnitude lower, at 1.1 × 10⁹ #/kWh. The DPFOEM regenerated during this test, starting from the rural section of the cycle (Section 4.1). The regeneration led to a large slip of soot particles, manifested as an increase of the SPN23 emissions with the 90th percentile reaching 2.1 × 10¹² #/kWh downstream of the DPFOEM. APC was not available downstream of the SCR in the specific test, but tailpipe emissions are expected to have been higher by the additional contribution of particles forming inside the SCR (~1.0 × 10¹¹ #/kWh for SPN23). Effectively, the soot slip during the regeneration led to an exceedance of the regulatory limit by at least 88%, as the weighted SPN23 emissions were 1.8 × 10¹² #/kWh at the outlet of the DPFOEM.

3.2. Emission Performance of the OEM Aftertreatment Layout Following the Proposed Euro 7 Methodology

Figure 3 summarizes the emission results from the same tests (DPFOEM) shown in Figure 2, evaluated in accordance with the proposed Euro 7 calculation methodology. The SPN10 emissions of the vehicle in its OEM configuration (SCR out) were above the proposed Euro 7 limits in all tests.
Focusing on the first two repetitions, which were performed with the DPFOEM in a clean state, the 100th and 90th percentile results were ~1.2 and 2.2 times higher than the corresponding cold and hot start results evaluated following the Euro VI step E methodology (Figure 2). This is a consequence of the shift from 23 nm to 10 nm and the inclusion of all MW (starting from engine ignition) for the evaluation of both percentiles. Under the specific test conditions (tests performed following regeneration of the DPFOEM), the 100th percentile proposed limit of 5 × 10¹¹ #/kWh represents a more demanding performance criterion, with the two tests exceeding it by 10.3 and 8.5 times. The 90th percentile results are above the corresponding proposed limit of 2 × 10¹¹ #/kWh by 5.3 and 3.2 times, respectively. The effect of SCR was more pronounced on the 90th percentile results, with SPN10 emissions increasing by 2.1 × 10¹¹ #/kWh to 2.4 × 10¹¹ #/kWh, representing a 42 to 76% increase over SPN23. The 100th percentile results were less affected, with the percentage differences (+3% and −2%) being within the measurement uncertainty of SPN measurement equipment.
The results over the third repetition with the DPFOEM filter loaded to 3 g/L show a distinctly different pattern from the preceding tests. The 100th and 90th percentile results were 2.6 × 10¹² #/kWh and 2.0 × 10¹² #/kWh, exceeding the corresponding limits by 6 and 11 times, respectively. Thus, the 90th percentile limit was the most demanding criterion when a loaded DPFOEM regenerated during the ISC. Both percentiles corresponded to MWs from the highway section of the test and not the beginning of the urban section, which was the case in the previous two repetitions.

3.3. Emission Performance of DPFHFC3.0 and EFC Following the Euro 7 Evaluation Methodology

Figure 4 summarizes the results from the three ISC repetitions with the DPFHFC3.0, following the Euro 7 calculation methodology.
The 100th and 90th percentile SPN10 emissions at the outlet of the DPFHFC3.0 averaged at 1.2 × 10¹¹ #/kWh and 4.5 × 10⁹ #/kWh, respectively. These levels were 38 and 130 times lower compared to the tests with the clean DPFOEM (Figure 3) and well within the proposed Euro 7 limits. However, particles forming inside the SCR increased the SPN10 levels in the 2.6 × 10¹¹ #/kWh to 4.8 × 10¹¹ #/kWh range for the 100th percentile and 2.5 × 10¹¹ #/kWh to 3.1 × 10¹¹ #/kWh for the 90th percentile. These results suggest that ~3 × 10¹¹ #/kWh are forming inside the SCR. This emission level is already on its own above the proposed Euro 7 90th percentile limit of 2 × 10¹¹ #/kWh.
To meet the Euro 7 requirements, the specific SCR system would require some dedicated filter solution. The EFC evaluated in the study reduced the SPN10 results by 50% and 60% for the 100th and 90th percentile, respectively. The actual emission levels downstream of the EFC were at 26% and 52% of the corresponding thresholds of 5 × 10¹¹ #/kWh and 2 × 10¹¹ #/kWh.

4. Discussion

4.1. High Soot Emission Events

Figure 5 summarizes the SPN10 moving windows from all ISC tests at each of the four different measurement locations. All tests performed following conditioning of the after-treatment system at full load revealed a decrease of SPN10 emissions downstream of the DPF with time (as evident in the unsorted MW results). The elevated cold start emissions observed at the engine-out position partly contributed to the observed emission reduction. The decline in emissions was much sharper downstream of the DPF, however, suggesting an improvement in the filtration efficiency of both filters with time. This emission pattern is indicative of soot built up in and on the filter walls, resulting in a gradual increase in the filtration efficiency [39].
The tests with the DPFHFC3.0 started at ~40 times lower level and dropped significantly faster compared to those with the DPFOEM. This performance improvement is a direct consequence of the hierarchical microstructure in the DPFHFC3.0. The reduced porosity at the surface of the filter wall improves the overall filtration efficiency. At the same time, this hierarchical microstructure limits the accessibility of the larger wall pores for the soot particles, thus leading to a faster build-up of the soot cake that drastically improves the filtration efficiency [33]. It should be stressed that the APT is tunable, allowing for further performance improvements if needed [24].
The tests with the soot-loaded DPFOEM showed a distinctly different emission pattern. SPN10 emissions were more than three orders of magnitude lower at the start of the ISC compared to the tests where the DPFOEM was conditioned over full load. Emissions started increasing gradually from the 1200th MW, reaching a maximum after 6800 MWs (during highway driving). This emission behavior is indicative of regeneration, where accumulated soot, which is very efficient in trapping particles, is oxidized [40].
Figure 6 provides some more insights into the performance of the two filters. The real-time SPN10 slip, defined as the ratio of downstream to upstream SPN10 concentrations, is compared for the different filters over all ISC and full load tests. The duration of the full-load testing was sufficient to stabilize the SPN10 slip at the same levels between repetitions with the same type of filter. In the case of the DPFHFC3.0, SPN10 slip stabilized at ~0.01, corresponding to 1 − 0.01 = 99% filtration efficiency, which matches the clean filtration efficiency for the specific prototype. This suggests that the conditions prevailing at the specific mode (DPF inlet temperature and NOx concentration of ~475 °C and 1000 ppm, respectively) suffice for a nearly complete clean-up of the DPF. The corresponding filtration efficiencies of the DPFOEM dropped to 1 − 0.28 = 72% for the original DPFOEM, and 1 − 0.4 = 60% for the soot loaded new DPFOEM. The ash accumulating on the original DPFOEM over 20,000 km could explain the improved filtration efficiency. These filtration efficiencies are representative of unloaded Euro VI step E technology DPFs [41].
As expected, the SPN10 slip at the start of the ISC test was at the same levels as that at the end of the preceding full load cycle and then gradually dropped as soot accumulated, improving the filtration efficiency over time. In the case of the loaded DPFOEM, the SPN10 slip starts from as low as 10−5 and exhibits some sharp rises that coincide with sharp increases in the DPF inlet temperature above 375 °C, at 3000, 4300, and 6300 s, approximately. Interestingly, the temperature profiles indicate that over the specific test, the exhaust temperatures increased by an average of ~50 °C after approximately 2000 s of operation. It appears that the thermal management of the engine changed to support the regeneration of the filter. This was most probably triggered by the elevated pressure drop measured at the start of the cycle (see also Section 4.5).
It has been previously reported that SPN10 slip during passive regeneration is higher for a soot-loaded DPF [24]. Depending on exhaust temperature and the NSR, regeneration in a soot-loaded DPF can lead to non-uniform soot distribution and even local exposure of the wall microstructure. This results in a higher fraction of the exhaust flowing through these low-flow resistance segments, where filtration efficiency is lower. The NSR at the inlet of the first DPF was ~290:1, suggesting very fast soot oxidation that can promote such high SPN10 slip levels [24]. The soot oxidation rates (proportional to accumulated soot mass [42]) would be considerably lower in a relatively clean DPF, thus inhibiting the consumption of soot cake. This could explain why no increase in the soot slip was observed over the highway section of the cycle for any of the other ISC tests performed with the DPF clean.
Overall, both DPFOEM states led to an exceedance of the proposed Euro 7 90th and 100th percentile limits. However, the regeneration of the loaded DPFOEM was found to be a more demanding operating condition in the sense that it resulted in prolonged operation at elevated SPN10 emissions compared to cold start operation with clean DPF, albeit with a 25% to 35% 100th percentile result. This is reflected in the sorted MW results in Figure 5 (bottom panel). Namely, it took ~4100 and 4600 windows for the SPN10 results to reach the proposed Euro 7 limits of 5 × 10¹¹ #/kWh and 2 × 10¹¹ #/kWh, respectively, with the regeneration of the DPFOEM. With an empty DPFOEM, the corresponding thresholds were reached after 1050 and 2050 MWs, respectively.
While the DPFHFC3.0 was not tested pre-loaded, it is expected that it would still fulfill the Euro 7 requirements since the 100th percentile results lay below 2 × 10¹¹ #/kWh (at 1 and 1.4 × 10¹¹ #/kWh, respectively) starting from a clean state.

4.2. High SPN10 Emissions from the SCR System

A comparison of the emissions downstream of the SCR to those downstream of the preceding DPF in Figure 5 reveals a relatively stable release of SPN10 inside the SCR at a level of 2.5 × 10¹¹ #/kWh to 3 × 10¹¹ #/kWh. This emission level is already above the proposed 90th percentile Euro 7 threshold of 2 × 10¹¹ #/kWh, implying that a dedicated filter would be necessary to tackle particles forming inside the specific SCR system.
The observed tailpipe SPN10 emissions were at similar levels with previously published data [6,27,29,30,31,43]. Tests of another Euro VI step E truck of the same after-treatment layout, displacement, and power rating under the same operating conditions (simulated 29 tn gross weight on the same chassis dyno) resulted in 1.3 × 10¹¹ #/kWh SPN10 emissions over the same test cycle [6]. Tailpipe concentrations were as high as 3 × 10⁴ #/cm3 [6], compared to 5.5 × 10⁴ #/cm3 in the present work. The ratio of SPN10 to SPN23 emissions was also similar, reaching ~3:1 in both campaigns, suggesting a mean particle size in the range of 15 nm [6]. A recent study on a 12 l China VI certified diesel HD engine observed a 1.5 × 10¹¹ #/kWh increase in SPN23 emissions when activating urea dosing [43], which is even higher than the ~1 × 10¹¹ #/kWh increase observed here. An earlier study on a 5 l Euro VI diesel HDE and a 13 l Euro VI diesel HD truck reported up to 3.5 × 10⁴ #/cm3 SPN10 emissions forming on the SCR systems [27]. Similarly, scanning mobility particle sizer measurements suggested a mean size peaking below 20 nm [27]. Published data on the effect of urea dosing on SPN10 emissions of Euro VI HD engines suggest contributions to tailpipe concentrations that span from 1 × 10⁴ #/cm3 [29] to 8 × 10⁴ #/cm3 [31]. Significantly higher emissions, indicative of measurement artifacts, were observed under some conditions in some studies [30,31], although using equipment that did not utilize a catalytic stripper as required in the SPN10 regulation [7]. Measurements of SCR particles with and without a catalytic stripper revealed that the latter are prone to volatile artifacts at high exhaust temperatures [6].
While some progress was made in understanding the effect of spray formation [43], mixing and decomposition processes [44], and urea solution composition [45] on particle formation, the potential offered in reducing SPN10 emissions forming in SCR systems is still not well understood. Unless the emissions are reduced to a level below the proposed threshold within a safe engineering margin, a dedicated filter will be required.

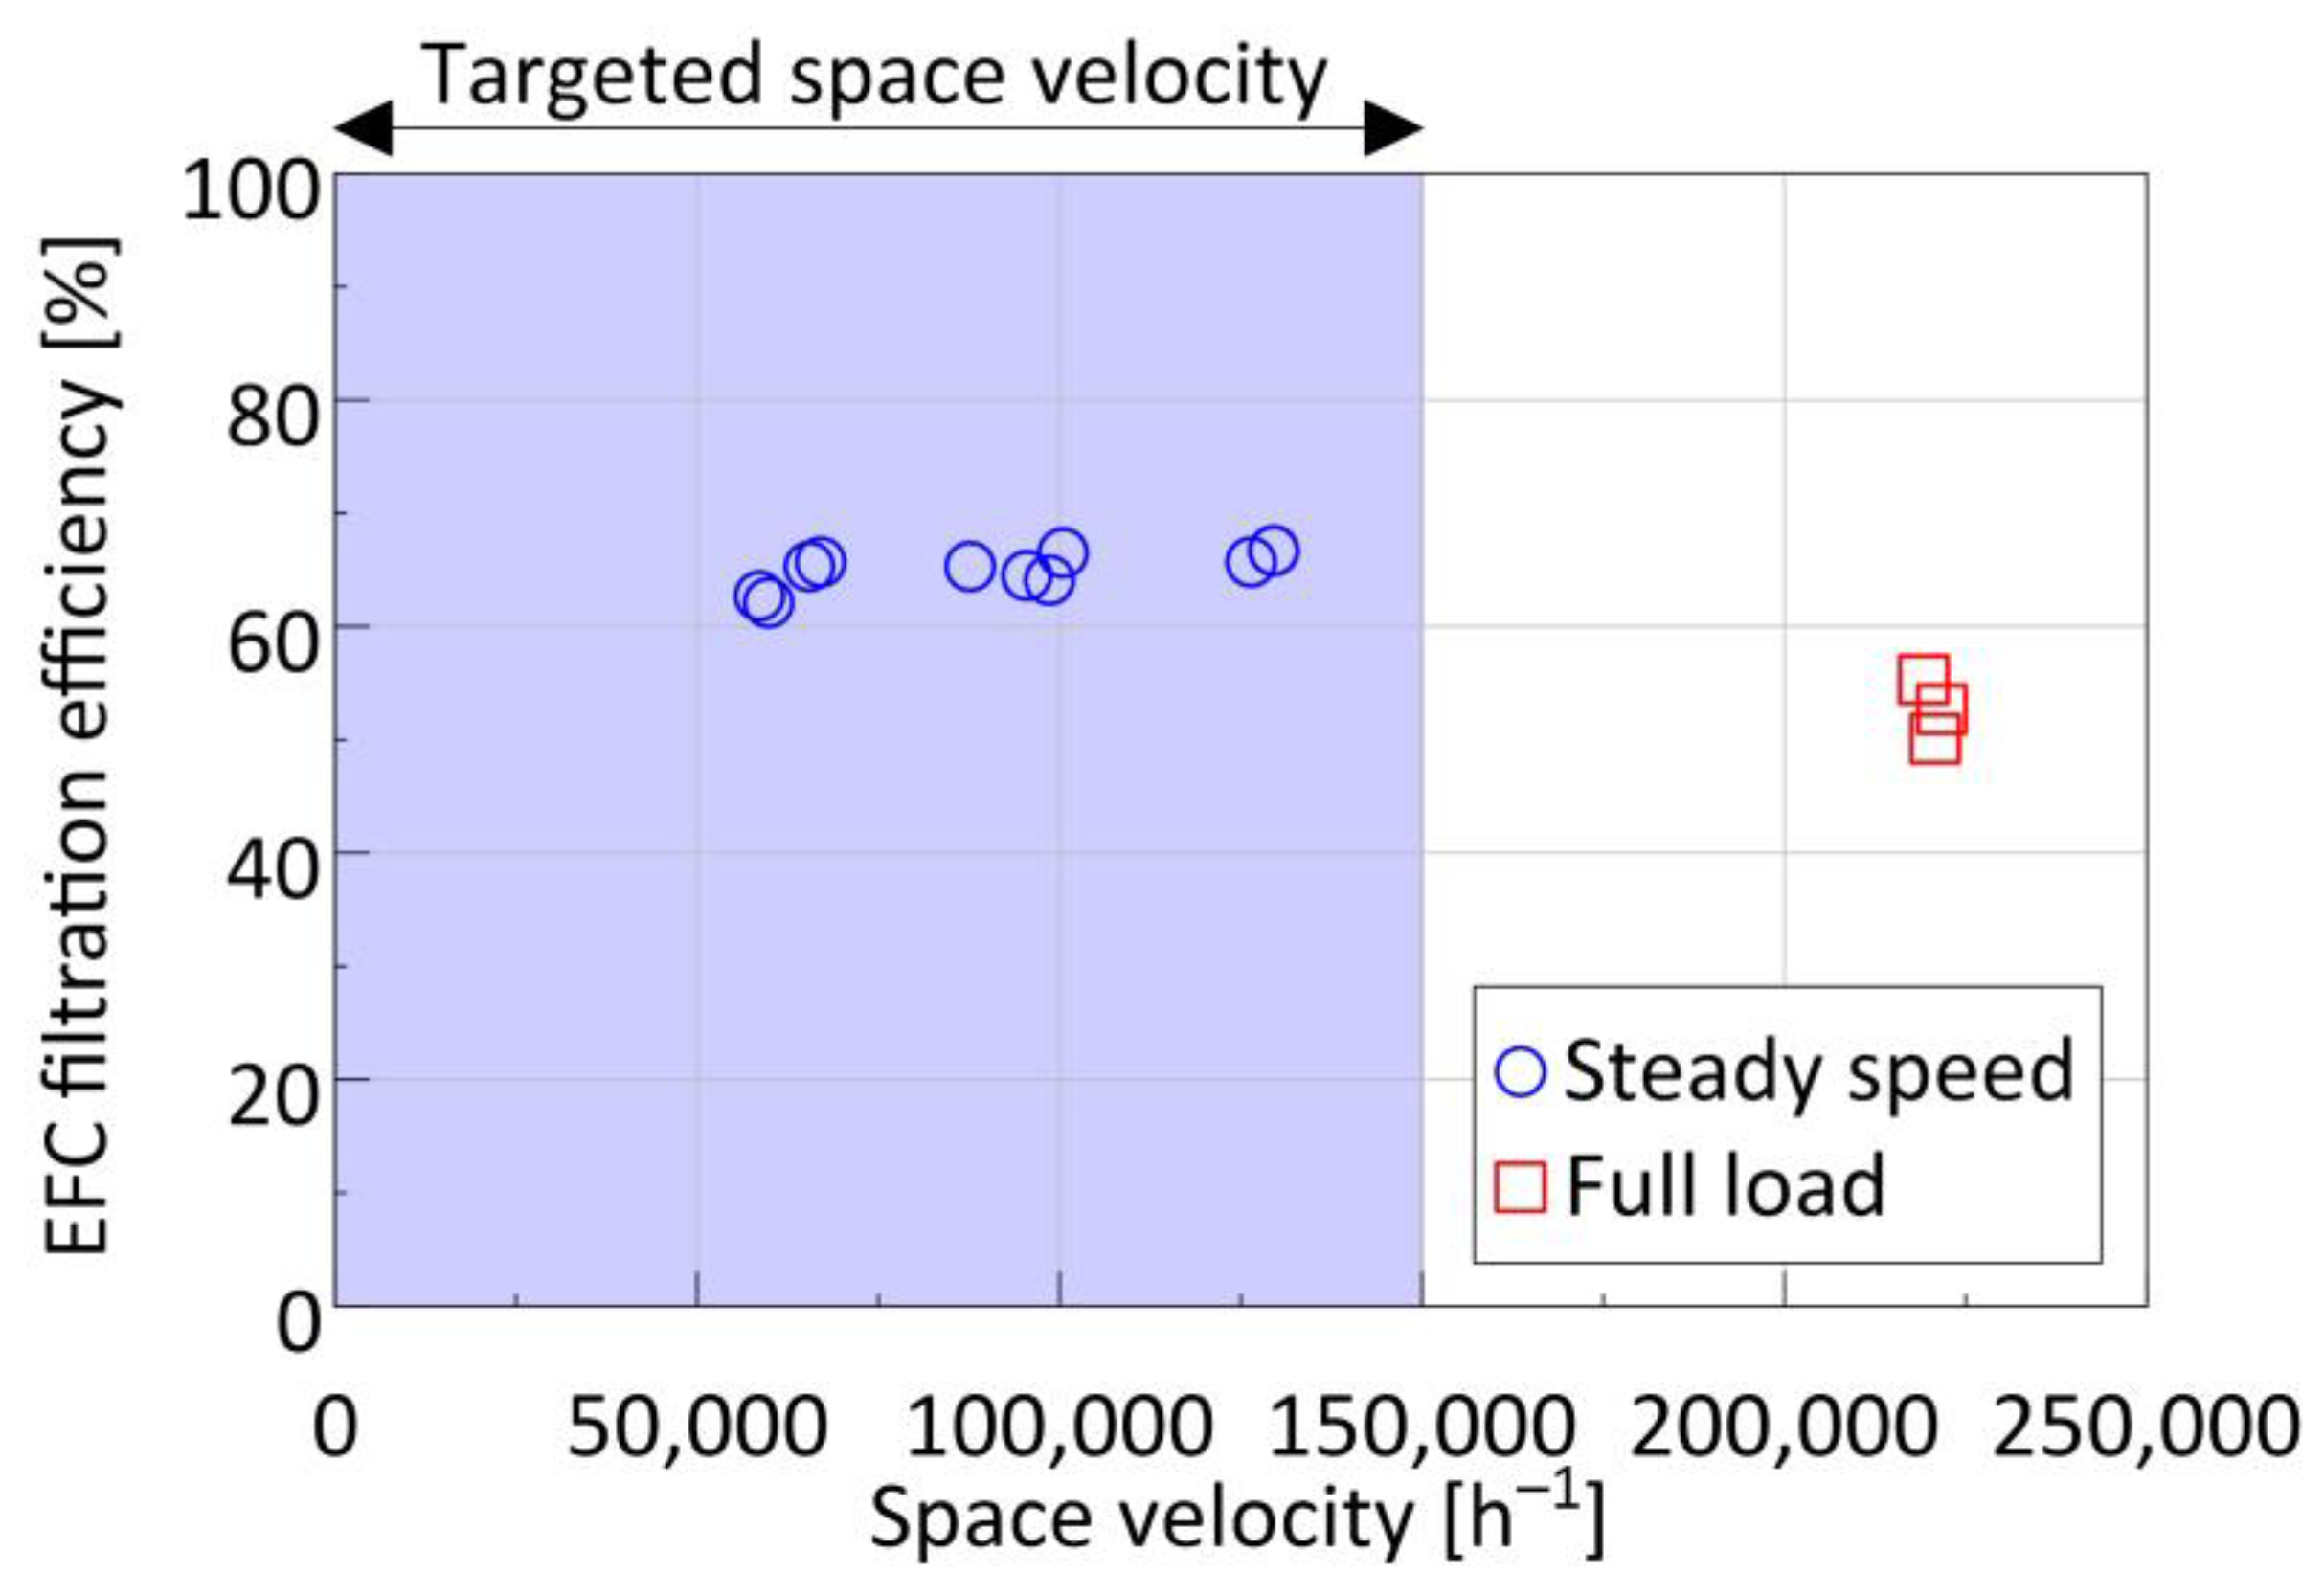
4.3. Performance of the EFC

Figure 7 compares the measured filtration efficiency of the EFC overall steady speed and full load tests. Results are plotted as a function of the space velocity defined as the ratio of the volumetric flow rate (calculated at standard conditions of 21 °C and 1 atm) to the EFC volume. Filtration efficiency ranged between 62% and 67% up to 125,000 h−1. At the highest tested space velocity of ~225,000 h−1, the filtration efficiency dropped to 47–55%. It should be stressed that the specific condition falls outside the targeted range of space velocities owing to the use of a single EFC instead of two in parallel.
Rear-plugged filters should be relatively insensitive to the operating flow rates [46]. The filtration efficiency of rear-plugged filters is proportional to the fraction of exhaust gas flowing through the walls, which in turn depends on the relative magnitude of the pressure drop along the open channel, Δpch, and the pressure drop through the wall, Δpw [11,46]:
Δpch = 2∙f0μL/dch2vch
Δpw = μ/kwvww + βρvw2
where f0 is the friction coefficient and equal to 14.2 for square channels, L is the channel length, dch is the channel diameter, w the wall thickness, ρ is the gas density, μ the gas viscosity, kw the wall permeability, β the inertial (Forchheimer) resistance coefficient, vch the channel velocity and vw the velocity through the wall. The latter is defined as the ratio of the total flow rate to the total filtration surface area and, thus, is proportional to the volumetric flow. Consequentially, both pressure drops exhibit a first-order dependence on the volumetric flow rate, provided that flow remains low enough for second-order inertial effects to become important. At high flows, Δpw increases disproportionally to Δpch, resulting in relatively lower fractions of inlet flow passing through the walls and, thus, a reduction in the filtration efficiency. The experimental data suggest that this transition happens at space velocities outside the targeted operating range of the EFC.
The performance of the EFC will be affected, however, by the accumulation of particles on its walls, reducing the effective wall permeability (kw in Equation (2)). Published experimental data on the filtration efficiency of rear-plugged filters suggested a drop from 60% to 30% as soot loading increases up to 4.5 g/L [46].

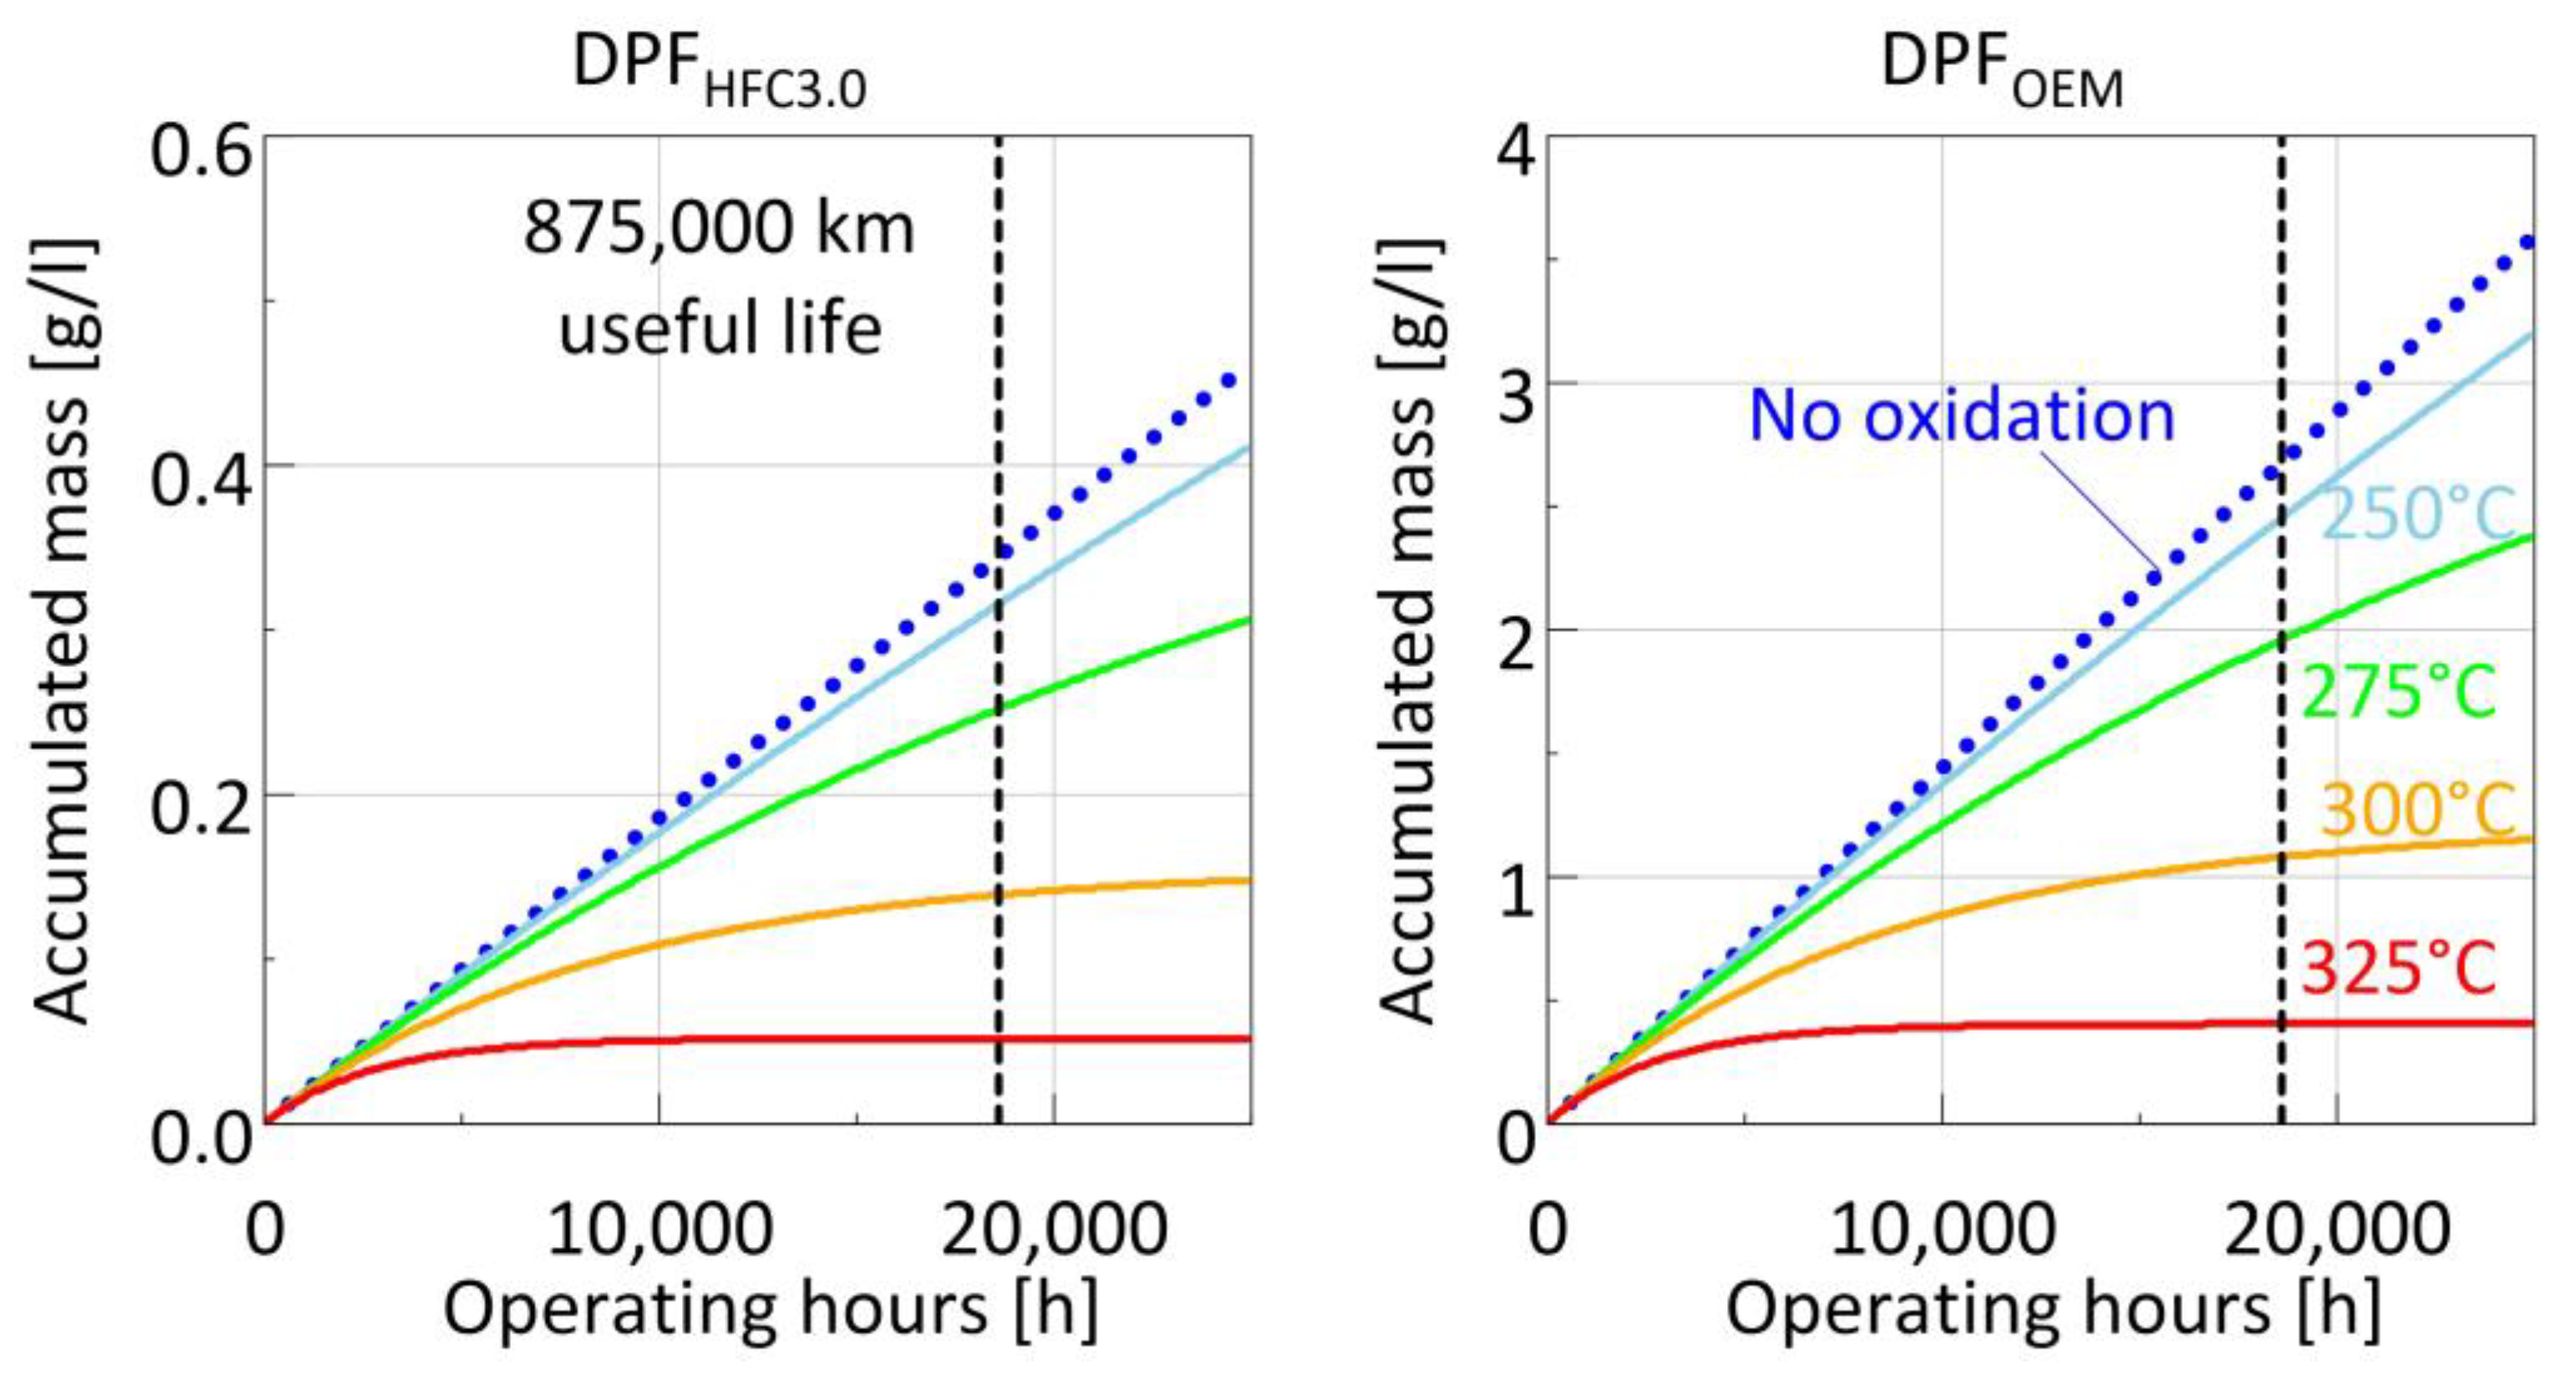
4.4. Estimations on the Mass Accumulated in the EFC

Two distinct types of particles will be collected on the EFC, namely, soot particles escaping the upstream DPF and particles forming inside the SCR system. Based on the total number of particles forming inside the SCR system (taken as the difference between those measured at the outlet of the SCR to those measured at the outlet of the upstream DPF) and assuming a lognormal distribution with a mode at 15 nm and a density of 2000 kg/m3 [6,26,27], a total emitted mass of 0.55 mg was calculated over the ISC. This would correspond to an average emission rate of 0.55/9300 = 5.9 × 10⁻⁵ mg/s.
The actual soot emissions reaching the EFC will depend on the filtration efficiency of the upstream DPF. Figure 6 suggests that the filtration efficiency of an initially clean DPF will reach 99.99% (i.e., 10−4 slip) within 600 s for DPFHFC3.0 and ~9000 s for DPFOEM. Elevated soot slip emissions during passive regeneration were reported to last ~6000 s [24] in reasonable agreement with what was observed with the ISC test using a soot-loaded DPFOEM (Figure 6). Since soot concentration measurements were only performed at the outlet of the turbocharger, the ratio of SPN10 emissions downstream to that upstream of the first DPF was used to estimate the soot mass emission rates reaching the EFC under these conditions (Table 2). In the case of the DPFOEM, the total soot mass and number of particles emitted during the passive regeneration event (considered to be the last 5000 s of the ISC) and the soot built up over an entire ISC (9300 s) were 2.6 + 5.3 = 7.9 g and 4.3 × 10¹⁵ + 9.5 × 1015 = 1.4 × 10¹⁶ #, respectively. The corresponding total number of particles at the outlet of the first DPF was 2.1 × 10¹⁴ + 1.5 × 1014 = 3.6 × 10¹⁴ #. Therefore, the total soot mass at the outlet of the first DPF was estimated to be 7.9 × 3.6 × 1014/(1.4 × 1016) ≈ 0.2 g, which would correspond to an average emission rate of 0.015 mg/s over a period of (9300 + 5000)/3600 ≈ 4 h. In the case of the DPFHFC3.0, the soot build-up took ~600s, and the total mass and number of particles emitted from the engine over these 5600 s would be 2.6 + 0.7 = 3.3 g and 4.3 × 10¹⁵ + 1.6 × 1015 = 5.9 × 10¹⁵ #, respectively. In lack of experimental data on the SPN slip during regeneration for the DPFHFC3.0 filter, the ratio of its clean state filtration efficiency to that of the DPFOEM was used, suggesting a 2.1 × 1014 × (1 − 0.99)/(1 − 0.72) = 7.5 × 10¹² # over a similar passive regeneration event. The total mass and number of soot particles emitted over the first 600 s of the ISC were 0.7 g and 1.4 × 10¹⁵ #, while the total particles escaping an initially clean DPFHFC3.0 over the same period was 4.7 × 10¹² #. Accordingly, the total mass of soot reaching the EFC over a high SPN slip regeneration event using DPFHFC3.0 is estimated to be (2.6 + 0.7) × (7.5 × 1012 + 4.7 × 10¹²)/(4.3 × 1015 + 1.4 × 10¹⁵) = 0.007 g. This would correspond to an average emission rate of 0.002 mg/s over a duration of (600 + 5000)/3600 ≈ 1.6 h. In between such high SPN slip events, the filtration efficiency of the DPF is expected to be 99.99%, irrespective of its technology. Based on the average engine out soot mass emission rate over the ISC of 0.65 mg/s, the corresponding emission rate at the inlet of the EFC is expected to be 0.65 × (1 − 0.9999) = 6.5 × 10⁻⁵ mg/s.
Establishing a representative average soot emission rate reaching the EFC over the useful life of the vehicle is rather challenging. On the one hand, the frequency of passive regeneration would strongly depend on the operating conditions. On the other hand, not all passive regeneration events would lead to high soot slip. As a worst-case condition, the minimum interval of 100 h specified in the definition of continuously regenerating systems in the European regulation [12] was assumed. For reference, based on data from field operation of several long-haul trucks (most suited for passive regeneration systems) in the United States of America, the frequency of active regeneration typically falls in the 50 to 100 h of engine operation [24,47]. As a consistency check, at an average engine-out emission rate of 0.65 mg/h, it would have taken ~23 h to accumulate 3 g/L of soot on the 18 l DPFOEM if no significant oxidation took place. With a 100 h interval between high soot slip regeneration events, the weighted average soot mass emission rates reaching the EFC would be (6.5 × 10−5 × 100/104 + 0.014 × 4/104) = 6 × 10⁻⁴ mg/s for the DPFOEM and (6.5 × 10−5 × 100/101.6 + 1 × 10−4 × 2.5/101.6) = 8 × 10⁻⁵ mg/s for the DPFHFC3.0.
Assuming a useful life of 875,000 km (based on the Euro 7 proposal) and the average ISC speed of 47 km/h, the total operating hours are calculated to be 875,000/47 ≈ 18,600 h. At an average emission rate of 6 × 10⁻⁵ mg/s, a total mass of 4 g, or equivalently 0.43 g/L, originating from the SCR system would have reached the two parallel EFCs. The corresponding soot mass escaping the upstream DPF would be 0.57 g/L in the case of DPFHFC3.0 (with an average emission rate of 8 × 10⁻⁵ mg/s) and 4.3 g/L in the case of the DPFOEM (with an average emission rate of 6 × 10⁻⁴ mg/s). Given the finite filtration efficiency of the EFC, at a maximum, 60% of the above masses would eventually be trapped. The results suggest that even if no oxidation takes place, the accumulated mass on the EFC is expected to be at maximum (0.43 + 0.57) × 0.6 = 0.6 g/L when a DPFHFC3.0 is employed upstream. These levels are too low to have any significant impact on the filtration efficiency of the EFC [46]. With the DPFOEM, however, some deterioration in the filtration performance is to be expected unless the accumulated soot can be oxidized.
Some oxidation of particles collected on the EFC is to be expected. The exact positioning of the EFC in the SCR system layout will define whether NO2 will be available. Under the worst-case condition, the EFC will be located at the outlet of the SCR catalyst, where O2 would be the only relevant oxidant.
A simple 0D oxidation kinetics model can help establish rough estimates of the anticipated oxidation of soot accumulating in the EFC. Assuming a single global reaction kinetic equation, being first order in oxygen and in total accumulated soot, the rate of mass accumulation would be described by [11,48]:
dms/dt = ηfs,inkmsxO2
where ms is the mass of accumulated soot on the filter, s,in the soot emission rate at the inlet of the EFC, ηf is the filtration efficiency of the EFC, xO2 the molar fraction of O2, and k the reaction rate constant. Equation (3) is a first-order differential equation which, under fixed operating conditions (emission rate, filtration efficiency, and exhaust temperature) starting from a clean state, has the analytical solution:
ms = ηfs,in/(xO2k)∙(1 − exp(−xO2kt))
Figure 8 shows the calculated evolution of accumulated soot on the EFC for the two DPFs based on published reaction constants [42]. The graphs also include the limiting case for which soot oxidation is negligible (in which case Equation (3) has the solution ms = ηfs,int). The results indicate that even in the absence of NO2, some oxidation is anticipated, although this is rather limited at temperatures below 300 °C. Minimizing soot mass concentrations at the inlet of the EFC would be the preferable path in safeguarding against excessive soot accumulation that could impair the performance of the EFC. It is necessary, however, to support these findings with experimental data. Some research work is currently underway in this direction. In commercializing such a solution, it is also important to consider potential failures of the upstream filter or even coarse deposits from the urea dosing system that may increase the mass load and potentially necessitate maintenance requirements.

4.5. Pressure Drop and Fuel Consumption

Figure 9 compares the pressure drop over the first DPF for all six ISC tests performed. The test with the soot-loaded DPFOEM led to a more than two times higher pressure drop at the start of the cycle. As the regeneration of the DPF progressed, the pressure drop gradually decreased, reaching the levels of the other two tests with the conditioned DPFOEM at approximately 5000 s. Considering the relatively low exhaust flow rates over the urban part of the cycle, these elevated pressure drops are registered as excessive flow resistance by the ECU. This triggered the latter to modify the thermal management of the engine to increase exhaust temperatures (Figure 6) and support the regeneration of the DPF.
The installation of the DPFHFC3.0 in place of the DPFOEM resulted in an approximately 55% increase in the pressure drop at empty soot load conditions. This rather large change is due to the use of an early washcoated prototype. Previous tests with uncoated DPFHFC3.0 showed equivalent pressure drops to Euro VI technology DPFs [6]. There are ongoing development projects with washcoaters to optimize the pressure drop penalty, targeting similar levels with Euro VI step E DPFs. Despite the nonideal pressure drop performance, no penalty could be observed on the measured CO2 and the ECU-reported fuel consumption over the ISC, being on average 1.7% and 0.3% lower, respectively, with the DPFHFC3.0.
The pressure drop over the EFC was not monitored in the campaign. This would be a subject of a future campaign with an EFC of the appropriate size to meet the targeted space velocity range and potentially washcoated and integrated with the DeNOx system.

5. Conclusions

A Euro VI step E technology diesel truck, relying on a continuously regenerating DPF system, was tested over a test cycle designed for compliance with the applicable regulatory requirements for real driving emission measurements [35]. The vehicle was able to clean up the original DPFOEM during the 2.5 h of the test cycle when pre-loaded with 3 g/L of soot. The regeneration led to elevated particle emissions, exceeding the currently applicable SPN23 limit of 9.8 × 10¹¹ #/kWh (which includes a 1.63 factor for the measurement equipment on the road) by approximately 90%. This was found to be the most demanding operating condition for an otherwise Euro VI step E-compliant truck, even when tested with a clean, full-load-conditioned DPF.
Controlling particle emissions during regeneration would be even more demanding in Euro 7 applications. The introduction of separate limits for both the 90th and 100th percentile requires more than an order of magnitude improvement in the filtration efficiency at a clean state to address both the actual emissions during regeneration and cold start emissions during follow-up tests. It was demonstrated here, as well as in our previous study [6], that advanced filters such as the tested DPFHFC3.0 can meet these requirements.
The shift of the lowest detection size from 23 to 10 nm also introduces additional requirements for the control of nanosized particles forming in the SCR system. These were found to be 26 to 56% above the proposed 90th percentile limit for the tested truck (i.e., around 2–3 × 10¹¹ #/kWh). The use of a DPFHFC3.0 downstream of the SCR would be beneficial, as it would effectively relax the required particle emission performance improvements in SCR systems. A dedicated filter specifically designed to address these nanoparticles was also evaluated in the study. Based on theoretical calculations, only limited soot accumulation on such a “2nd Filter” is anticipated when used in combination with an upstream DPFHFC3.0. Nevertheless, more experimental work is needed to assess long-term performance and maintenance requirements.

Author Contributions

Conceptualization, A.M. (Athanasios Mamakos), D.R., A.M. (Anastasios Melas) and B.G.; formal analysis, A.M. (Athanasios Mamakos) and D.R.; data curation, A.M. (Athanasios Mamakos) and A.M. (Anastasios Melas); writing—original draft preparation, A.M. (Athanasios Mamakos); writing—review and editing, D.R., A.M. (Anastasios Melas), R.G., R.S.-B. and B.G.; project administration, D.R., R.S.-B. and B.G.; funding acquisition, D.R. and R.S.-B. All authors have read and agreed to the published version of the manuscript.

Funding

This research received no external funding.

Data Availability Statement

Data are available from the corresponding author upon request.

Acknowledgments

The authors would like to acknowledge the JRC VELA technical staff (M. Cadario, D. Zanardini, R. Quarto) and AVL’s resident engineer, A. Bonamin, for their support in the experimental activities. The authors would also like to acknowledge M. C. Besch for organizing the soot pre-loading of the DPFs used in the study.

Conflicts of Interest

A.M. (Athanasios Mamakos) and D.R. are employed by Corning GmbH. The DPFHFC3.0 and the EFC evaluated in this study served as demonstrator prototypes for the development of commercial, technical solutions by Corning Inc. The opinions expressed in this manuscript are those of the authors and should not in any way be considered to represent an official opinion of the European Commission. The mention of trade names or commercial products does not constitute endorsement or recommendation by the authors or the European Commission. The other authors declare no conflict of interest.

Abbreviations

Acronyms
APCAVL Particle Counter
CFConformity Factor
CO2Carbon Dioxide
CPCCondensation Particle Counter
CVSConstant Volume Sampler
dDiameter
DPFDiesel Particulate Filter
ECUElectronic Control Unit
EFCEmissions Finishing Cordierite
EUEuropean Union
HDHeavy Duty
ISCIn-Service Conformity
JRCJoint Research Centre
kPermeability–reaction rate constant
MAWMoving Average Window
MSSMicro Soot Sensor
MWMoving Window
OEMOriginal Equipment Manufacturer
mAccumulated Mass
Mass Emission Rate
ηEfficiency
NO2Nitrogen Dioxide
NOxNitrogen Oxides
NSRNOx to Soot Ratio
PMParticulate Matter
PCRFParticle Concentration Reduction Factor
SCRSelective Catalytic Reduction
SPNSolid Particle Number
vVelocity
WWork
wWall Thickness
WHTCWorld Harmonized Transient Cycle
xMolar Fraction
Greek
βInertial (Forchheimer) Resistance Coefficient
ΔpPressure Drop
μGas viscosity
ρGas density
Subscripts
1010 nm
2323 nm
chChannel
fFiltration
HFC3.0High Filtration Cordierite
inInlet
O2Oxygen
OEMOriginal Equipment Manufacturer
outOutlet
refReference
sSoot
wWall

References

  1. Gonzalez Ortiz, A.; Guerreiro, C.; Soares, J.; European Environment Agency. Air Quality in Europe: 2020 Report; European Environment Agency: Copenhagen, Denmark, 2020; ISBN 978-92-9480-292-7.
  2. Samaras, Z.C.; Kontses, A.; Dimaratos, A.; Kontses, D.; Balazs, A.; Hausberger, S.; Ntziachristos, L.; Andersson, J.; Ligterink, N.; Aakko-Saksa, P.; et al. A European Regulatory Perspective towards a Euro 7 Proposal. SAE Int. J. Adv. Curr. Prac. Mobil. 2023, 5, 998–1011. [Google Scholar] [CrossRef]
  3. European Commission COM(2022) 586 Proposal for a Regulation of the European Parliament and of the Council on Type-Approval of Motor Vehicles and Engines and of Systems, Components and Separate Technical Units Intended for Such Vehicles, with Respect to Their Emissions and Battery Durability (Euro 7) and Repealing Regulations (EC) No 715/2007 and (EC) No 595/2009. Available online: https://single-market-economy.ec.europa.eu/publications/euro-7-standard-proposal_en (accessed on 16 September 2023).
  4. Commission Regulation (EC) No 692/2008 of 18 July 2008 Implementing and Amending Regulation (EC) No 715/2007 of the European Parliament and of the Council on Type-Approval of Motor Vehicles with Respect to Emissions from Light Passenger and Commercial Vehicles (Euro 5 and Euro 6) and on Access to Vehicle Repair and Maintenance Information (Text with EEA Relevance); European Union: Brussels, Belgium, 2008.
  5. Commission Regulation (EU) No 582/2011 of 25 May 2011 Implementing and Amending Regulation (EC) No 595/2009 of the European Parliament and of the Council with Respect to Emissions from Heavy Duty Vehicles (Euro VI) and Amending Annexes I and III to Directive 2007/46/EC of the European Parliament and of the Council Text with EEA Relevance; European Union: Brussels, Belgium, 2011.
  6. Mamakos, A.; Rose, D.; Besch, M.C.; He, S.; Gioria, R.; Melas, A.; Suarez-Bertoa, R.; Giechaskiel, B. Evaluation of Advanced Diesel Particulate Filter Concepts for Post Euro VI Heavy-Duty Diesel Applications. Atmosphere 2022, 13, 1682. [Google Scholar] [CrossRef]
  7. UNECE Global Technical Regulation (GTR) ECE/TRANS/180/Add.15/Amend.6. Addendum 15: United Nations Global Technical Regulation No. 15. United Nations Global Technical Regulation on Worldwide Harmonized Light Vehicles Test Procedures (WLTP). Amendment 6. 18 January 2021. Geneve, Switzerland. 2021. Available online: https://unece.org/sites/default/files/2022-06/ECE-TRANS-180a15am6e.pdf (accessed on 16 September 2023).
  8. Fiebig, M.; Wiartalla, A.; Holderbaum, B.; Kiesow, S. Particulate Emissions from Diesel Engines: Correlation between Engine Technology and Emissions. J. Occup. Med. Toxicol. 2014, 9, 6. [Google Scholar] [CrossRef] [PubMed]
  9. Johnson, T.; Joshi, A. Review of Vehicle Engine Efficiency and Emissions. SAE Int. J. Engines 2018, 11, 1307–1330. [Google Scholar] [CrossRef]
  10. Majewski, W.A.; Khair, M.K. Diesel Emissions and Their Control; SAE International: Warrendale, PA, USA, 2006; ISBN 978-0-7680-0674-2. [Google Scholar]
  11. Boger, T.; Cutler, W. Reducing Particulate Emissions in Gasoline Engines; SAE International: Warrendale, PA, USA, 2019; ISBN 978-0-7680-9543-2. [Google Scholar]
  12. UNECE Regulation 49. Uniform Provisions Concerning the Measures to Be Taken against the Emission of Gaseous and Particulate Pollutants from Compressionignition Engines and Positive Ignition Engines for Use in Vehicles. Available online: https://unece.org/transport/vehicle-regulations-wp29/standards/addenda-1958-agreement-regulations-41-60 (accessed on 16 September 2023).
  13. Bergmann, M.; Kirchner, U.; Vogt, R.; Benter, T. On-Road and Laboratory Investigation of Low-Level PM Emissions of a Modern Diesel Particulate Filter Equipped Diesel Passenger Car. Atmos. Environ. 2009, 43, 1908–1916. [Google Scholar] [CrossRef]
  14. Millo, F.; Vezza, D.; Vlachos, T.; Fino, D.; Russo, N.; De Filippo, A. Particle Number and Size Distribution from a Small Displacement Automotive Diesel Engine during DPF Regeneration. SAE Int. J. Fuels Lubr. 2010, 3, 404–413. [Google Scholar] [CrossRef]
  15. Yamada, H. PN Emissions from Heavy-Duty Diesel Engine with Periodic Regenerating DPF. SAE Int. J. Engines 2013, 6, 1178–1189. [Google Scholar] [CrossRef]
  16. Quiros, D.C.; Yoon, S.; Dwyer, H.A.; Collins, J.F.; Zhu, Y.; Huai, T. Measuring Particulate Matter Emissions during Parked Active Diesel Particulate Filter Regeneration of Heavy-Duty Diesel Trucks. J. Aerosol Sci. 2014, 73, 48–62. [Google Scholar] [CrossRef]
  17. Rothe, D.; Knauer, M.; Emmerling, G.; Deyerling, D.; Niessner, R. Emissions during Active Regeneration of a Diesel Particulate Filter on a Heavy Duty Diesel Engine: Stationary Tests. J. Aerosol Sci. 2015, 90, 14–25. [Google Scholar] [CrossRef]
  18. Ko, J.; Si, W.; Jin, D.; Myung, C.-L.; Park, S. Effect of Active Regeneration on Time-Resolved Characteristics of Gaseous Emissions and Size-Resolved Particle Emissions from Light-Duty Diesel Engine. J. Aerosol Sci. 2016, 91, 62–77. [Google Scholar] [CrossRef]
  19. Giechaskiel, B. Solid Particle Number Emission Factors of Euro VI Heavy-Duty Vehicles on the Road and in the Laboratory. Int. J. Environ. Res. Public Health 2018, 15, 304. [Google Scholar] [CrossRef] [PubMed]
  20. Giechaskiel, B.; Gioria, R.; Carriero, M.; Lähde, T.; Forloni, F.; Perujo, A.; Martini, G.; Bissi, L.M.; Terenghi, R. Emission Factors of a Euro VI Heavy-Duty Diesel Refuse Collection Vehicle. Sustainability 2019, 11, 1067. [Google Scholar] [CrossRef]
  21. Meng, Z.; Li, J.; Fang, J.; Tan, J.; Qin, Y.; Jiang, Y.; Qin, Z.; Bai, W.; Liang, K. Experimental Study on Regeneration Performance and Particle Emission Characteristics of DPF with Different Inlet Transition Sections Lengths. Fuel 2020, 262, 116487. [Google Scholar] [CrossRef]
  22. Meng, Z.; Chen, C.; Li, J.; Fang, J.; Tan, J.; Qin, Y.; Jiang, Y.; Qin, Z.; Bai, W.; Liang, K. Particle Emission Characteristics of DPF Regeneration from DPF Regeneration Bench and Diesel Engine Bench Measurements. Fuel 2020, 262, 116589. [Google Scholar] [CrossRef]
  23. Zhao, X.; Jiang, J.; Zuo, H.; Jia, G. Soot Combustion Characteristics of Oxygen Concentration and Regeneration Temperature Effect on Continuous Pulsation Regeneration in Diesel Particulate Filter for Heavy-Duty Truck. Energy 2023, 264, 126265. [Google Scholar] [CrossRef]
  24. Viswanathan, S.; He, S.; Reddy, V.; Sadek, G. Challenges and Solutions to Meeting Eu VII Particle Number Requirements during Aggressive Field Operation; SAE International: Detroit, MI, USA, 2023; SAE Technical Paper 2023-01-0386. [Google Scholar]
  25. Meng, Z.; Wang, W.; Zeng, B.; Bao, Z.; Hu, Y.; Ou, J.; Liu, J. An Experimental Investigation of Particulate Emission Characteristics of Catalytic Diesel Particulate Filters during Passive Regeneration. Chem. Eng. J. 2023, 468, 143549. [Google Scholar] [CrossRef]
  26. Amanatidis, S.; Ntziachristos, L.; Giechaskiel, B.; Bergmann, A.; Samaras, Z. Impact of Selective Catalytic Reduction on Exhaust Particle Formation over Excess Ammonia Events. Environ. Sci. Technol. 2014, 48, 11527–11534. [Google Scholar] [CrossRef]
  27. Mamakos, A.; Schwelberger, M.; Fierz, M.; Giechaskiel, B. Effect of Selective Catalytic Reduction on Exhaust Nonvolatile Particle Emissions of Euro VI Heavy-Duty Compression Ignition Vehicles. Aerosol Sci. Technol. 2019, 53, 898–910. [Google Scholar] [CrossRef]
  28. Czerwinski, J.; Zimmerli, Y.; Mayer, A.; D’Urbano, G.; Zürcher, D. Emission Reduction with Diesel Particle Filter with SCR Coating (SDPF). Emiss. Control Sci. Technol. 2015, 1, 152–166. [Google Scholar] [CrossRef]
  29. Giechaskiel, B.; Schwelberger, M.; Kronlund, L.; Delacroix, C.; Locke, L.A.; Khan, M.Y.; Jakobsson, T.; Otsuki, Y.; Gandi, S.; Keller, S.; et al. Towards Tailpipe Sub-23 Nm Solid Particle Number Measurements for Heavy-Duty Vehicles Regulations. Transp. Eng. 2022, 9, 100137. [Google Scholar] [CrossRef]
  30. Legala, A.; Premnath, V.; Chadwell, M.; Weber, P.; Khalek, I. Impact of Selective Catalytic Reduction Process on Nonvolatile Particle Emissions; SAE International: Detroit, MI, USA, 2021; SAE Technical Paper 2021-01-0624. [Google Scholar]
  31. Arun, P.; Bernemyr, H.; Erlandsson, A. On the Effects of Urea and Water Injection on Particles across the SCR Catalyst in a Heavy—Duty Euro VI Diesel Engine; SAE International: Detroit, MI, USA, 2020; SAE Technical Paper 2020-01-2196. [Google Scholar]
  32. Regulation (EC) No 595/2009 of the European Parliament and of the Council of 18 June 2009 on Type-Approval of Motor Vehicles and Engines with Respect to Emissions from Heavy Duty Vehicles (Euro VI) and on Access to Vehicle Repair and Maintenance Information and Amending Regulation (EC) No 715/2007 and Directive 2007/46/EC and Repealing Directives 80/1269/EEC, 2005/55/EC and 2005/78/EC (Text with EEA Relevance); European Union: Brussels, Belgium, 2009.
  33. Joshi, A. Review of Vehicle Engine Efficiency and Emissions. SAE Int. J. Adv. Curr. Prac. Mobil. 2022, 4, 1704–1733. [Google Scholar] [CrossRef]
  34. Selleri, T.; Gioria, R.; Melas, A.D.; Giechaskiel, B.; Forloni, F.; Mendoza Villafuerte, P.; Demuynck, J.; Bosteels, D.; Wilkes, T.; Simons, O.; et al. Measuring Emissions from a Demonstrator Heavy-Duty Diesel Vehicle under Real-World Conditions—Moving Forward to Euro VII. Catalysts 2022, 12, 184. [Google Scholar] [CrossRef]
  35. Commission Regulation (EU) 2019/1939 of 7 November 2019 Amending Regulation (EU) No 582/2011 as Regards Auxiliary Emission Strategies (AES), Access to Vehicle OBD Information and Vehicle Repair and Maintenance Information, Measurement of Emissions during Cold Engine Start Periods and Use of Portable Emissions Measurement Systems (PEMS) to Measure Particle Numbers, with Respect to Heavy Duty Vehicles (Text with EEA Relevance); European Union: Brussels, Belgium, 2019.
  36. Fontaras, G.; Dilara, P.; Berner, M.; Volkers, T.; Kies, A.; Rexeis, M.; Hausberger, S. An Experimental Methodology for Measuring of Aerodynamic Resistances of Heavy Duty Vehicles in the Framework of European CO2 Emissions Monitoring Scheme. SAE Int. J. Commer. Veh. 2014, 7, 102–110. [Google Scholar] [CrossRef]
  37. European Commission. Joint Research Centre. CO2 Emissions of the European Heavy-Duty Vehicle Fleet: Analysis of the 2019 2020 Reference Year Data; Publications Office: Luxembourg, 2022. [Google Scholar]
  38. Schindler, W.; Haisch, C.; Beck, H.A.; Niessner, R.; Jacob, E.; Rothe, D. A Photoacoustic Sensor System for Time Resolved Quantification of Diesel Soot Emissions; SAE International: Detroit, MI, USA, 2004; SAE Technical Paper 2004-01-0968. [Google Scholar]
  39. Tandon, P.; Heibel, A.; Whitmore, J.; Kekre, N.; Chithapragada, K. Measurement and Prediction of Filtration Efficiency Evolution of Soot Loaded Diesel Particulate Filters. Chem. Eng. Sci. 2010, 65, 4751–4760. [Google Scholar] [CrossRef]
  40. Konstandopoulos, A.G.; Johnson, J.H. Wall-Flow Diesel Particulate Filters—Their Pressure Drop and Collection Efficiency; SAE International: Detroit, MI, USA, 1989; SAE Technical Paper 890405. [Google Scholar]
  41. Nakagoshi, Y.; Mori, K.; Tanaka, K.; Furuta, Y.; Aoki, T.; Yoshioka, F.; Kato, K. New Generation Diesel Particulate Filter for Future Euro7 Regulation; SAE International: Detroit, MI, USA, 2023; SAE Technical Paper 2023-01-0389. [Google Scholar]
  42. Yezerets, A.; Currier, N.W.; Eadler, H.A. Experimental Determination of the Kinetics of Diesel Soot Oxidation by O2—Modeling Consequences; SAE International: Detroit, MI, USA, 2003; SAE Technical Paper 2003-01-0833. [Google Scholar]
  43. Shen, B.; Li, Z.; Kong, X.; Li, M.; Li, Z.; Shuai, S.; Liu, S. Experimental and Numerical Investigations into Effects of Urea-Water Solution Injection on Tailpipe Particulate Matter Emissions. Process Saf. Environ. Prot. 2021, 148, 927–938. [Google Scholar] [CrossRef]
  44. Urea-SCR Technology for DeNOx after Treatment of Diesel Exhausts. In Fundamental and Applied Catalysis; Nova, I.; Tronconi, E. (Eds.) Softcover Reprint of the Original 1st Edition 2014; Springer: New York, NY, USA; Berlin/Heidelberg, Germany; Dordrecht, The Netherlands; London, UK, 2016; ISBN 978-1-4899-8070-0. [Google Scholar]
  45. Wang, H.; Zhai, T.; Zhang, L.; Li, J.; Xue, Z.; Wang, J.; Ji, Z.; Li, W.; Wang, Y. The Effect of Various Urea-in-Water Solution Types on Exhaust Particle Number Emission. Environ. Sci. Pollut. Res. 2023, 30, 108825–108831. [Google Scholar] [CrossRef]
  46. Basu, S.; Henrichsen, M.; Tandon, P.; He, S.; Heibel, A. Filtration Efficiency and Pressure Drop Performance of Ceramic Partial Wall Flow Diesel Particulate Filters. SAE Int. J. Fuels Lubr. 2013, 6, 877–893. [Google Scholar] [CrossRef]
  47. Ruehl, C.; Smith, J.D.; Ma, Y.; Shields, J.E.; Burnitzki, M.; Sobieralski, W.; Ianni, R.; Chernich, D.J.; Chang, M.-C.O.; Collins, J.F.; et al. Emissions During and Real-World Frequency of Heavy-Duty Diesel Particulate Filter Regeneration. Environ. Sci. Technol. 2018, 52, 5868–5874. [Google Scholar] [CrossRef]
  48. Joshi, A.; Johnson, T.V. Gasoline Particulate Filters—A Review. Emiss. Control Sci. Technol. 2018, 4, 219–239. [Google Scholar] [CrossRef]
Figure 1. (Top panel): Vehicle speed (blue curve) and road slope (grey curve) profiles of the ISC cycle. (Bottom panel): Operating engine map over the ISC cycle (red dots), the steady speed points (blue dots), and the full load conditioning (green dot). ISC = In-Service-Conformity cycle.
Vehicles 05 00089 g001
Figure 2. Summary of Solid Particle Number (SPN) emissions following the Euro VI step E evaluation methodology for the tests where DPFOEM was used. Charts on the left and right planes correspond to emission levels at DPF out and SCR out positions, respectively. Charts on the top, middle, and bottom panels correspond to the three ISC repetitions, the last one (depicted with white stripes) being performed with a pre-loaded DPFOEM. Blue bars correspond to SPN23, while red bars to SPN10. The dashed lines indicate the applicable limit (1.63 × 6 × 1011 = 9.78 × 10¹¹ #/kWh), while the numbers on top correspond to the conformity factors (ratio of average emissions over applicable limit). Owing to the swapping of APC sampling positions (Table 1), SPN measurements were not available (n.a.) for some tests. HFC = High Filtration efficiency Cordierite; CF = Conformity Factor; DPF = Diesel Particulate Filter; OEM = Original Equipment Manufacturer; SCR = Selective Catalytic Reduction.
Vehicles 05 00089 g002
Figure 3. Summary of Solid Particle Number (SPN) emissions following the proposed Euro 7 evaluation methodology for the tests where DPFOEM was used. Charts on the left and right planes correspond to emission levels at DPF out and SCR out positions, respectively. Charts on the top, middle, and bottom panels correspond to the three ISC repetitions, the last one (depicted with white stripes) being performed with a pre-loaded DPFOEM. Blue bars correspond to SPN23, while red bars to SPN10. The dashed lines indicate the proposed limit (5 × 10¹¹ #/kWh for the 100th percentile and 2 × 10¹¹ #/kWh for the 90th percentile), while the numbers on top correspond to the conformity factors (ratio of average emissions over applicable limit). Owing to the swapping of APC sampling positions (Table 1), SPN measurements were not available (n.a.) for some tests. HFC = High Filtration efficiency Cordierite; CF = Conformity Factor; DPF = Diesel Particulate Filter; OEM = Original Equipment Manufacturer; SCR = Selective Catalytic Reduction.
Vehicles 05 00089 g003
Figure 4. Summary of Solid Particle Number (SPN) emissions following the proposed Euro 7 evaluation methodology for the tests where DPFHFC3.0 was used. Charts on the left, middle, and right planes correspond to emission levels at DPF, SCR, and EFC out positions, respectively. Charts on the top, middle, and bottom panels correspond to the three ISC repetitions. Blue bars correspond to SPN23, while red bars to SPN10. The dashed lines indicate the proposed limit (5 × 10¹¹ #/kWh for the 100th percentile and 2 × 10¹¹ #/kWh for the 90th percentile), while the numbers on top correspond to the conformity factors (ratio of average emissions over applicable limit). Owing to the swapping of APC sampling positions (Table 1), SPN measurements were not available (n.a.) for some tests. HFC = High Filtration efficiency Cordierite; CF = Conformity Factor; DPF = Diesel Particulate Filter; OEM = Original Equipment Manufacturer; SCR = Selective Catalytic Reduction; EFC = Emissions Finishing Cordierite.
Vehicles 05 00089 g004
Figure 5. Calculated SPN10 MWs (top panels) and sorted SPN10 MWs (bottom panels) from all ISC tests at the different sampling positions. Dots on the bottom panels show the 90th percentile, while the intersection of the curves with the y-axis corresponds to the 100th percentile. HFC = High Filtration efficiency Cordierite; DPF = Diesel Particulate Filter; OEM = Original Equipment Manufacturer; SCR = Selective Catalytic Reduction; EFC = Emissions Finishing Cordierite.
Vehicles 05 00089 g005
Figure 6. DPF inlet temperatures (top panels) and SPN10 slip (bottom panels) over the ISC (left-hand panels) and the Full load (right-hand panels) tests. DPF = Diesel Particulate Filter; HFC = High Filtration efficiency Cordierite; OEM = Original Equipment Manufacturer; ISC = In-Service-Conformity cycle.
Vehicles 05 00089 g006
Figure 7. Filtration efficiency of the EFC as measured over the steady speed (blue dots) and the full load (red dots) tests. The shaded blue area indicates the targeted space velocity for the EFC. EFC = Emissions Finishing Cordierite.
Vehicles 05 00089 g007
Figure 8. Calculated accumulated soot mass on the EFC in the absence of NO2 as a function of operating temperature and hours, based on the worst-case weighted average inlet mass concentrations using DPFHFC3.0 (left-hand panel) or DPFOEM (right-hand panel). Dotted blue line indicates the upper boundary corresponding to insignificant oxidation. Estimated useful life in operating hours was based on the 47 km/h average speed over the ISC. DPF = Diesel Particulate Filter; OEM = Original Equipment Manufacturer; HFC = High Filtration efficiency Cordierite; EFC = Emissions Finishing Cordierite.
Vehicles 05 00089 g008
Figure 9. Measured pressure drops over the first DPF (top panel) and CO2 (bottom left panel) and brake-specific fuel consumption (bottom right panel) over the six repetitions of the ISC cycle. DPF = Diesel Particulate Filter; HFC = High Filtration efficiency Cordierite; OEM = Original Equipment Manufacturer; ISC = In-Service-Conformity cycle; BSFC = Brake Specific Fuel Consumption.
Vehicles 05 00089 g009
Table 1. Test protocol. ISC = In-Service-Conformity cycle; DPF = Diesel Particulate Filter; OEM = Original Equipment Manufacturer; SCR = Selective Catalytic Reduction; HFC = High Filtration efficiency Cordierite; EFC = Emissions Finishing Cordierite.
DayCycleDPF1APC1 PositionAPC2 Position
1ISCDPFOEMDPFOEM outSCR out
1Full LoadDPFOEMDPFOEM outSCR out
2ISCDPFOEMDPFOEM outSCR out
2Steady SpeedsDPFOEMDPFOEM outEFC out
2Full LoadDPFOEMDPFOEM outSCR out
3ISCDPFOEM (3 g/L)Turbo outDPFOEM out
3Full LoadDPFOEM (3 g/L)Turbo outDPFOEM out
4ISCDPFHFC3.0DPFHFC3.0 outSCR out
4Steady SpeedsDPFHFC3.0SCR outEFC out
4Full LoadDPFHFC3.0DPFHFC3.0 outSCR out
5ISCDPFHFC3.0DPFHFC3.0 outSCR out
5Full LoadDPFHFC3.0DPFHFC3.0 outSCR out
6ISCDPFHFC3.0DPFHFC3.0 outSCR out
Table 2. Estimations of soot mass emission rates reaching the EFC during a sequence of passive regeneration and cake built-up. DPF = Diesel Particulate Filter; OEM = Original Equipment Manufacturer; HFC = High Filtration efficiency Cordierite.
DPF Regeneration“Soot Cake” Built-UpCombined
DPFOEMDuration [s]5000930014,300
Total soot DPFin [g]2.65.37.9
Total SPN10 DPFin [#]4.3 × 10159.5 × 101513.8 × 1015
Total SPN10 DPFout [#]2.1 × 10141.5 × 10143.6 × 1014
Total mass DPFout [g]0.130.080.21
Emission DPFout [mg/s] 0.015
DPFHFC3.0Duration [s]50006005600
Total soot DPFin [g]2.60.73.3
Total SPN10 DPFin [#]4.3 × 10151.4 × 10155.7 × 1015
Total SPN10 DPFout [#]7.5 × 10124.7 × 10121.2 × 1013
Total mass DPFout [g]0.0050.0020.007
Emission DPFout [mg/s] 0.001
Disclaimer/Publisher’s Note: The statements, opinions and data contained in all publications are solely those of the individual author(s) and contributor(s) and not of MDPI and/or the editor(s). MDPI and/or the editor(s) disclaim responsibility for any injury to people or property resulting from any ideas, methods, instructions or products referred to in the content.

