Article

Transfer-to-Transfer Learning Approach for Computer Aided Detection of COVID-19 in Chest Radiographs

by
Barath Narayanan Narayanan
1,2,*,
Russell C. Hardie
1,
Vignesh Krishnaraja
3,
Christina Karam
2 and
Venkata Salini Priyamvada Davuluru
1,2
1
Department of Electrical and Computer Engineering, University of Dayton, 300 College Park, Dayton, OH 45469, USA
2
Sensors and Software Systems Division, University of Dayton Research Institute, 1700 South Patterson Blvd., Dayton, OH 45409, USA
3
Blue Eye Soft Corp., 44 Parkway Commons Way, Greer, SC 29650, USA
*
Author to whom correspondence should be addressed.
Submission received: 19 October 2020 / Revised: 10 November 2020 / Accepted: 12 November 2020 / Published: 13 November 2020
(This article belongs to the Section Medical & Healthcare AI)

Abstract

:
The coronavirus disease 2019 (COVID-19) global pandemic has severely impacted lives across the globe. Respiratory disorders in COVID-19 patients are caused by lung opacities similar to viral pneumonia. A Computer-Aided Detection (CAD) system for the detection of COVID-19 using chest radiographs would provide a second opinion for radiologists. For this research, we utilize publicly available datasets that have been marked by radiologists into two-classes (COVID-19 and non-COVID-19). We address the class imbalance problem associated with the training dataset by proposing a novel transfer-to-transfer learning approach, where we break a highly imbalanced training dataset into a group of balanced mini-sets and apply transfer learning between these. We demonstrate the efficacy of the method using well-established deep convolutional neural networks. Our proposed training mechanism is more robust to limited training data and class imbalance. We study the performance of our algorithm(s) based on 10-fold cross validation and two hold-out validation experiments to demonstrate its efficacy. We achieved an overall sensitivity of 0.94 for the hold-out validation experiments containing 2265 and 2139 marked as COVID-19 chest radiographs, respectively. For the 10-fold cross validation experiment, we achieve an overall Area under the Receiver Operating Characteristic curve (AUC) value of 0.996 for COVID-19 detection. This paper serves as a proof-of-concept that an automated detection approach can be developed with a limited set of COVID-19 images, and in areas with scarcity of trained radiologists.

1. Introduction

The recent coronavirus disease 2019 (COVID-19) has impacted many lives, and changed the world drastically. The World Health Organization declared COVID-19 a global pandemic on 11 March 2020 [1]. By the end of October 2020, more than 43.3 million cases had been confirmed globally, with over 1.15 million deaths reported [2] related to the novel virus. The reported illnesses from people infected include fever, shortness of breath, dry cough, as well as loss of taste and smell. Many people with underlying conditions (particularly heart and lung diseases) seem to be at higher risk of developing serious complications according to the Center for Disease Control and Prevention. Many researchers are currently looking for early detection methods for COVID-19, to help reduce the spread of this disease [3,4].
Several testing methods are being used for diagnostic purposes, including the Reverse-Transcription-Polymerase Chain Reaction (RT-PCR). These tests have proven to have high specificity but variable sensitivity for the detection of the diseases [3,4]. Unfortunately, obtaining the results takes about 24 h or more, and these kits are in limited supply across the globe [4]. Currently, the world is in need of rapid solutions that would assist radiologists and doctors in identifying COVID-19.
Patients with COVID-19 often develop pneumonia caused by lung opacities. Thus, another strategy is to detect this form of pneumonia in chest radiographs and Computed Tomography (CT) scans. Both CT scans and chest radiographs are widely used imaging modalities for various diseases associated with the lungs. In this paper, we solely focus on chest radiographs because these are more widely available than CT scans. Chest radiographs require far less data memory, disk space and processing time. Furthermore, they have a much lower radiation dose than CT scans [5]. Hence, a Computer Aided Detection (CAD) system on chest radiographs to detect COVID-19 would be a valuable tool to enhance the workflow of radiologists. This type of CAD system would provide a rapid and objective second opinion to radiologists. We believe this could be particularly helpful in areas with a scarcity of COVID-19 test kits. CAD tools have been a research area attracting great interest in the past decade [5,6,7,8,9,10,11,12,13,14,15,16,17,18,19,20,21,22,23,24,25,26,27,28,29,30]. Computer-vision based machine learning and deep learning approaches have been proposed in the literature for various applications including lung cancer, pneumonia, and tuberculosis detection, as well as pneumonia diagnosis on chest radiographs.
In this paper, we present three training methodologies using deep learning to detect COVID-19 on chest radiographs without any traditional data augmentation. These systems include:
(i)
Baseline method using traditional transfer learning approach using four different established Convolutional Neural Networks (CNNs)
(ii)
Enhanced baseline method adds preprocessing and lung segmentation to the baseline method
(iii)
Recommended system further adds our novel transfer-to-transfer learning approach to mitigate class imbalance.
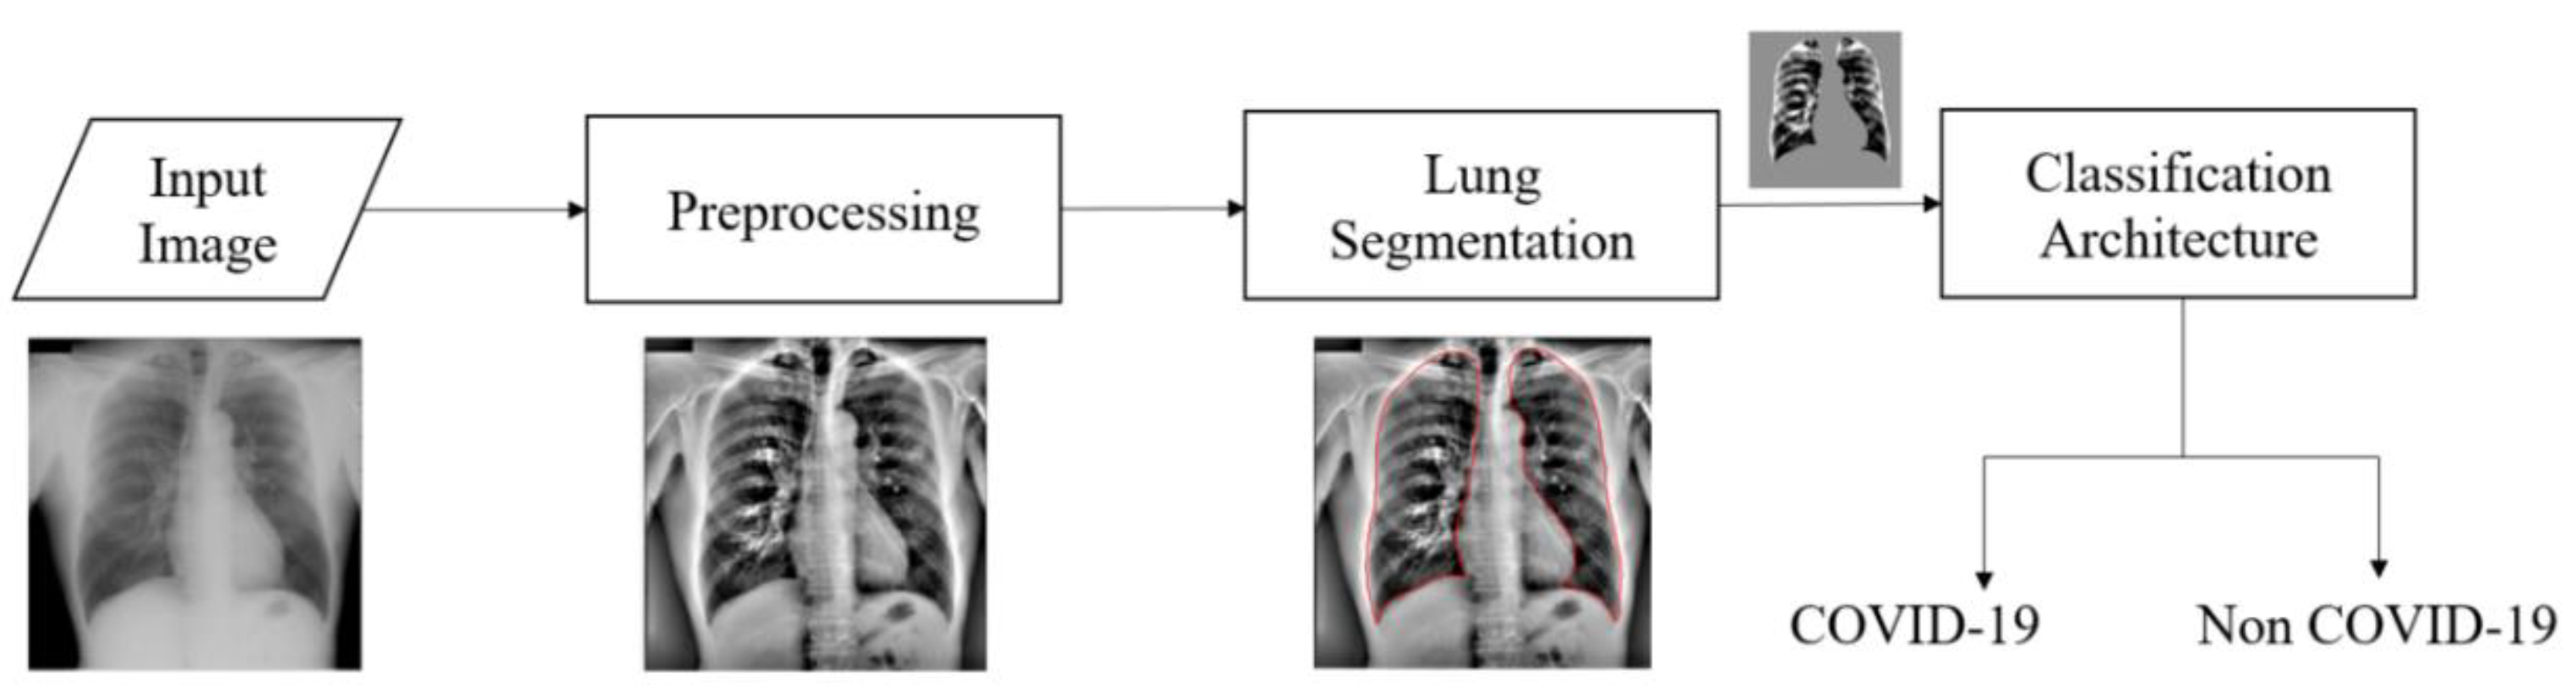
For the enhanced baseline method and recommended system, we preprocess the chest radiographs to enhance the contrast and segment the lungs. Only the segmented lung region is used by the classification architecture for both these methods.
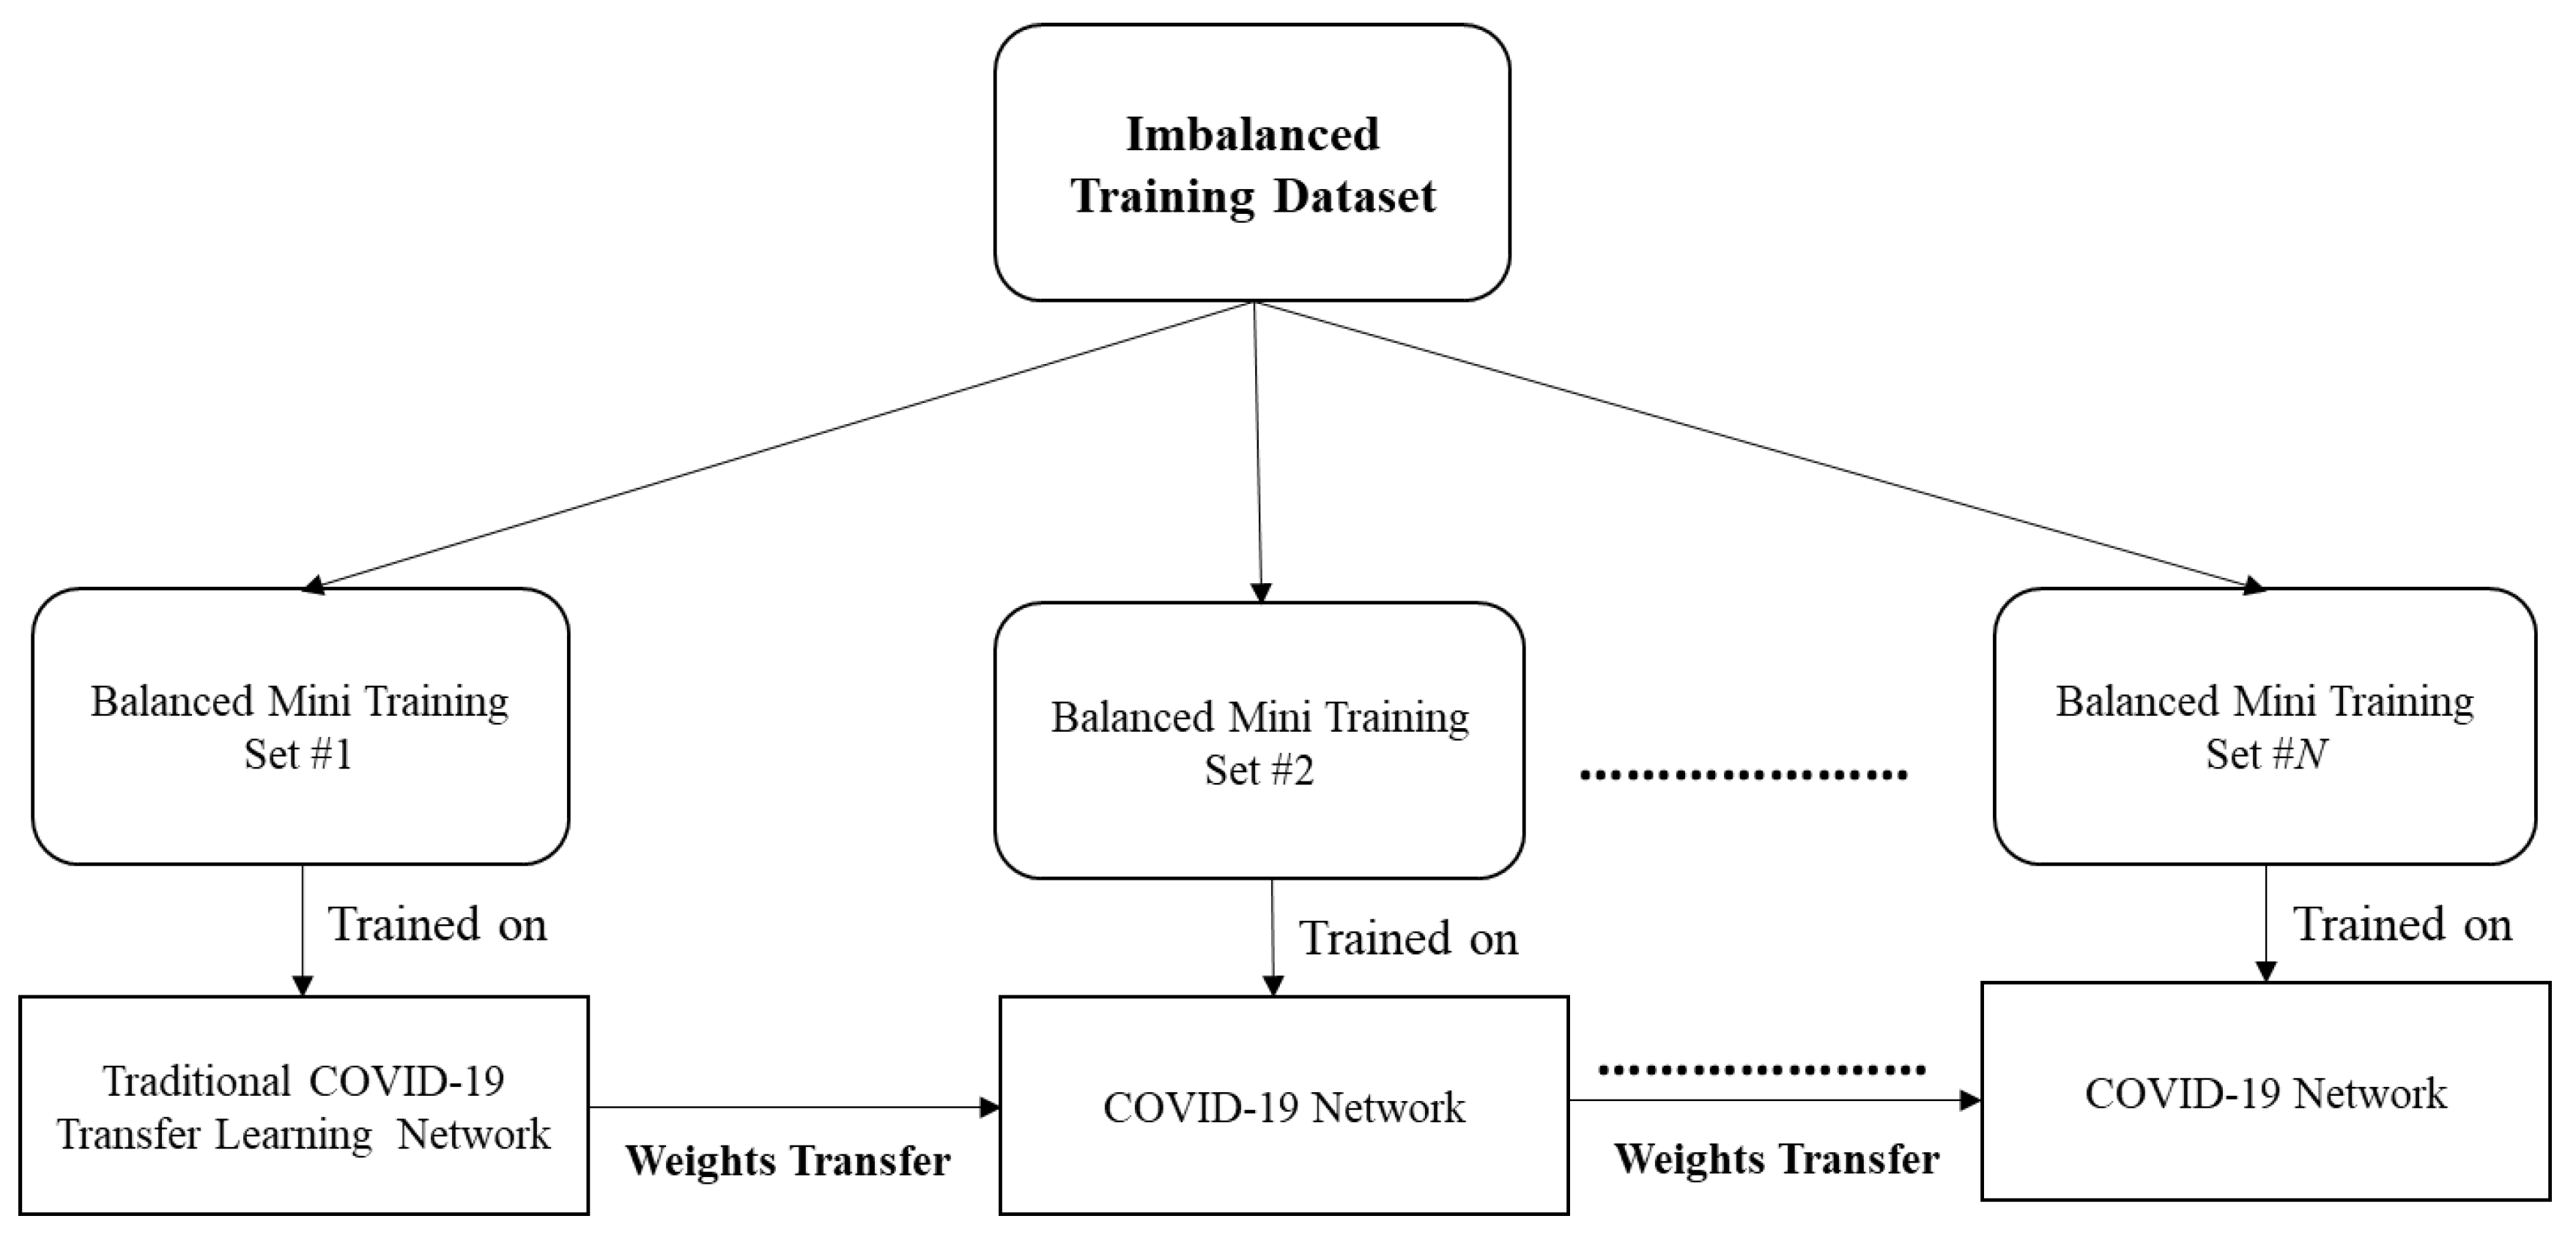
The training dataset used in this research suffers from class imbalance. Traditionally, this issue is tackled by data augmentation, weighted cross entropy loss, or by removing the samples from the majority class to match the quantity of minority class. Data augmentation is not a preferred approach for medical imaging applications. Randomly removing samples from the majority class (i.e., the non-COVID-19 class) in this scenario might lead to loss of critical information. The weighted cross entropy loss approach has not been effective for training datasets with high class imbalance ratio. Therefore, to overcome class imbalance, we introduce a novel transfer-to-transfer learning approach. In our recommended system, we split the training dataset into mini-sets. Each mini training set contains the entire training suite of COVID-19 images and approximately the same quantity of non-COVID-19 images. The weights are then transferred to the next sets subsequently and this process is repeated until we process through every non COVID-19 class image present in our training dataset. We studied and compared the performance of the recommended system with the baseline and enhanced baseline methods. We studied the performance of these methods using four established CNNs: ResNet50 [31], Xception [32], Inception-v3 [33,34], and DenseNet201 [35].
The primary novel contribution of this research is in the proposed computationally efficient transfer-to-transfer training mechanism to combat class imbalance. This includes demonstration of its efficacy in COVID-19 detection in chest radiographs. Our study here also demonstrates the importance of preprocessing and lung segmentation for COVID-19 detection. We present the results in terms of classification accuracy, sensitivity, recall, specificity, precision, F1 score, and Area under the Receiver Operating Characteristic curve (AUC). We also present the class activation mapping results to show the key image structures influencing the decision making of each method. We studied the performance of our proposed approaches both in terms of 10-fold cross validation and hold-out validation.
The remainder of this paper is organized as follows. Section 2 presents a brief background on CAD tools. Section 3 presents the datasets utilized for this research. Section 4 describes the three CAD systems studied here for COVID-19 detection on chest radiographs. Section 5 presents the experimental results. In Section 6, a discussion of the results is presented. Finally, conclusions are offered in Section 7.

2. Background and Related Works

Research on the diagnosis and treatment of the novel coronavirus is in high demand in both the medical imaging and machine learning fields. However, due to its sudden emergence and with limited publicly available data for developing machine learning models, it is a challenging problem to address. Fortunately, several CAD tools have been developed in the literature for chest radiographs, and we build on those approaches for detecting COVID-19.
In [5], chest radiographs are preprocessed using Local Contrast Enhancement (LCE) and are segmented using an Active Shape Model. Next, a set of 114 handcrafted features is computed and fisher linear discriminant classifier is utilized to detect lung nodules on chest radiographs. A novel optimized set of features determined for both clustering and classification for detecting lung nodules on chest radiographs is presented in [6]. The ‘N-Quoit’ filter is studied for CAD of lung nodules on chest radiographs in [7]. A set of classification approaches are studied and compared for the detection of lung nodules in [8]. A U-Net architecture is presented for automated lung segmentation in chest radiographs in [9]. In [10], a novel two-stage architecture to detect and diagnose pneumonia is presented using transfer learning approaches. Independent architectures are used for pneumonia detection and diagnosis. Detection of pneumonia is implemented using established transfer learning approaches [10] and later lung regions are segmented using U-Net architecture before passing it to classification architecture for diagnosing pneumonia patients as bacterial or viral. A CAD tool based on wavelet transforms is presented to detect pneumonia in [11]. Multiple CAD tools for various diseases have been discussed, as well as how chest radiography can be utilized to detect various diseases [12,13]. A CAD algorithm to detect interstitial opacities in chest radiographs is presented in [14]. A radiologist-level CAD algorithm to detect pneumonia is presented using deep learning approaches in [15]. This paper also presents a gradient-based visualization method to localize the region of interest [15]. An attention guided mask algorithm to locate the region of interest for pneumonia detection is presented in [16]. Several CNN-based approaches are studied for the detection and diagnosis of pneumonia [17]. Transfer learning-based approaches using established networks such GoogLeNet [36] and ResNet50 [31] are studied to detect tuberculosis along with the class activation mapping results [18]. Some of the other related notable CAD papers are available in [19,20,21,22,23,24,25,26,27,28,29,30].
Recent research work clearly indicates that deep learning has proven to be highly effective for CAD tools in chest radiographs [3,9,10,15,16,17,18]. However, balanced sets of chest radiographs with COVID-19 markings are available in limited quantity, making it a difficult problem to address using traditional deep learning approaches. Data augmentation is one method to overcome the limited quantity of images. However, traditional augmentation techniques such as flipping, rotating, color jittering, and random cropping [37] cannot be applied to chest radiographs. Moreover, medical imaging applications tend to have different visual characteristics exhibiting high inter-class variability and hence traditional augmentation methods are found to be less effective [38]. Generative Adversarial Networks (GANs) are often used for synthetic data generation [39]. However, these models are computationally complex, and to date, have not proven efficacious in medical imaging. Moreover, GAN models are highly sensitive to model architecture and parameter choice, and might even degrade the classification performance after creating synthetic data. In [40], a COVID-19 detection study is conducted utilizing traditional CNN approaches after segmenting the lungs. A novel CNN architecture for detection of COVID-19 in chest radiographs is presented in [41]. Authors in [41] utilize a Projection-Expansion-Projection technique for classification of COVID-19 from pneumonia and other normal classes. In this paper, we propose a novel training mechanism using transfer learning approach to mitigate class imbalance with limited training images.

3. Materials and Methods

In this section, we present the publicly available datasets used for this study. In total, we used six different datasets and these are described in Table 1. Two of the datasets contained COVID-19 cases. The other four were previously established datasets for non-COVID-19 cases. These included cases marked by radiologists for various other lung disorders (lung cancer, tuberculosis, bacterial pneumonia and viral pneumonia) as well as cases that had been marked as normal (i.e., free of these diseases). We included these cases so that the algorithm was able to distinguish COVID-19 from other lung diseases.
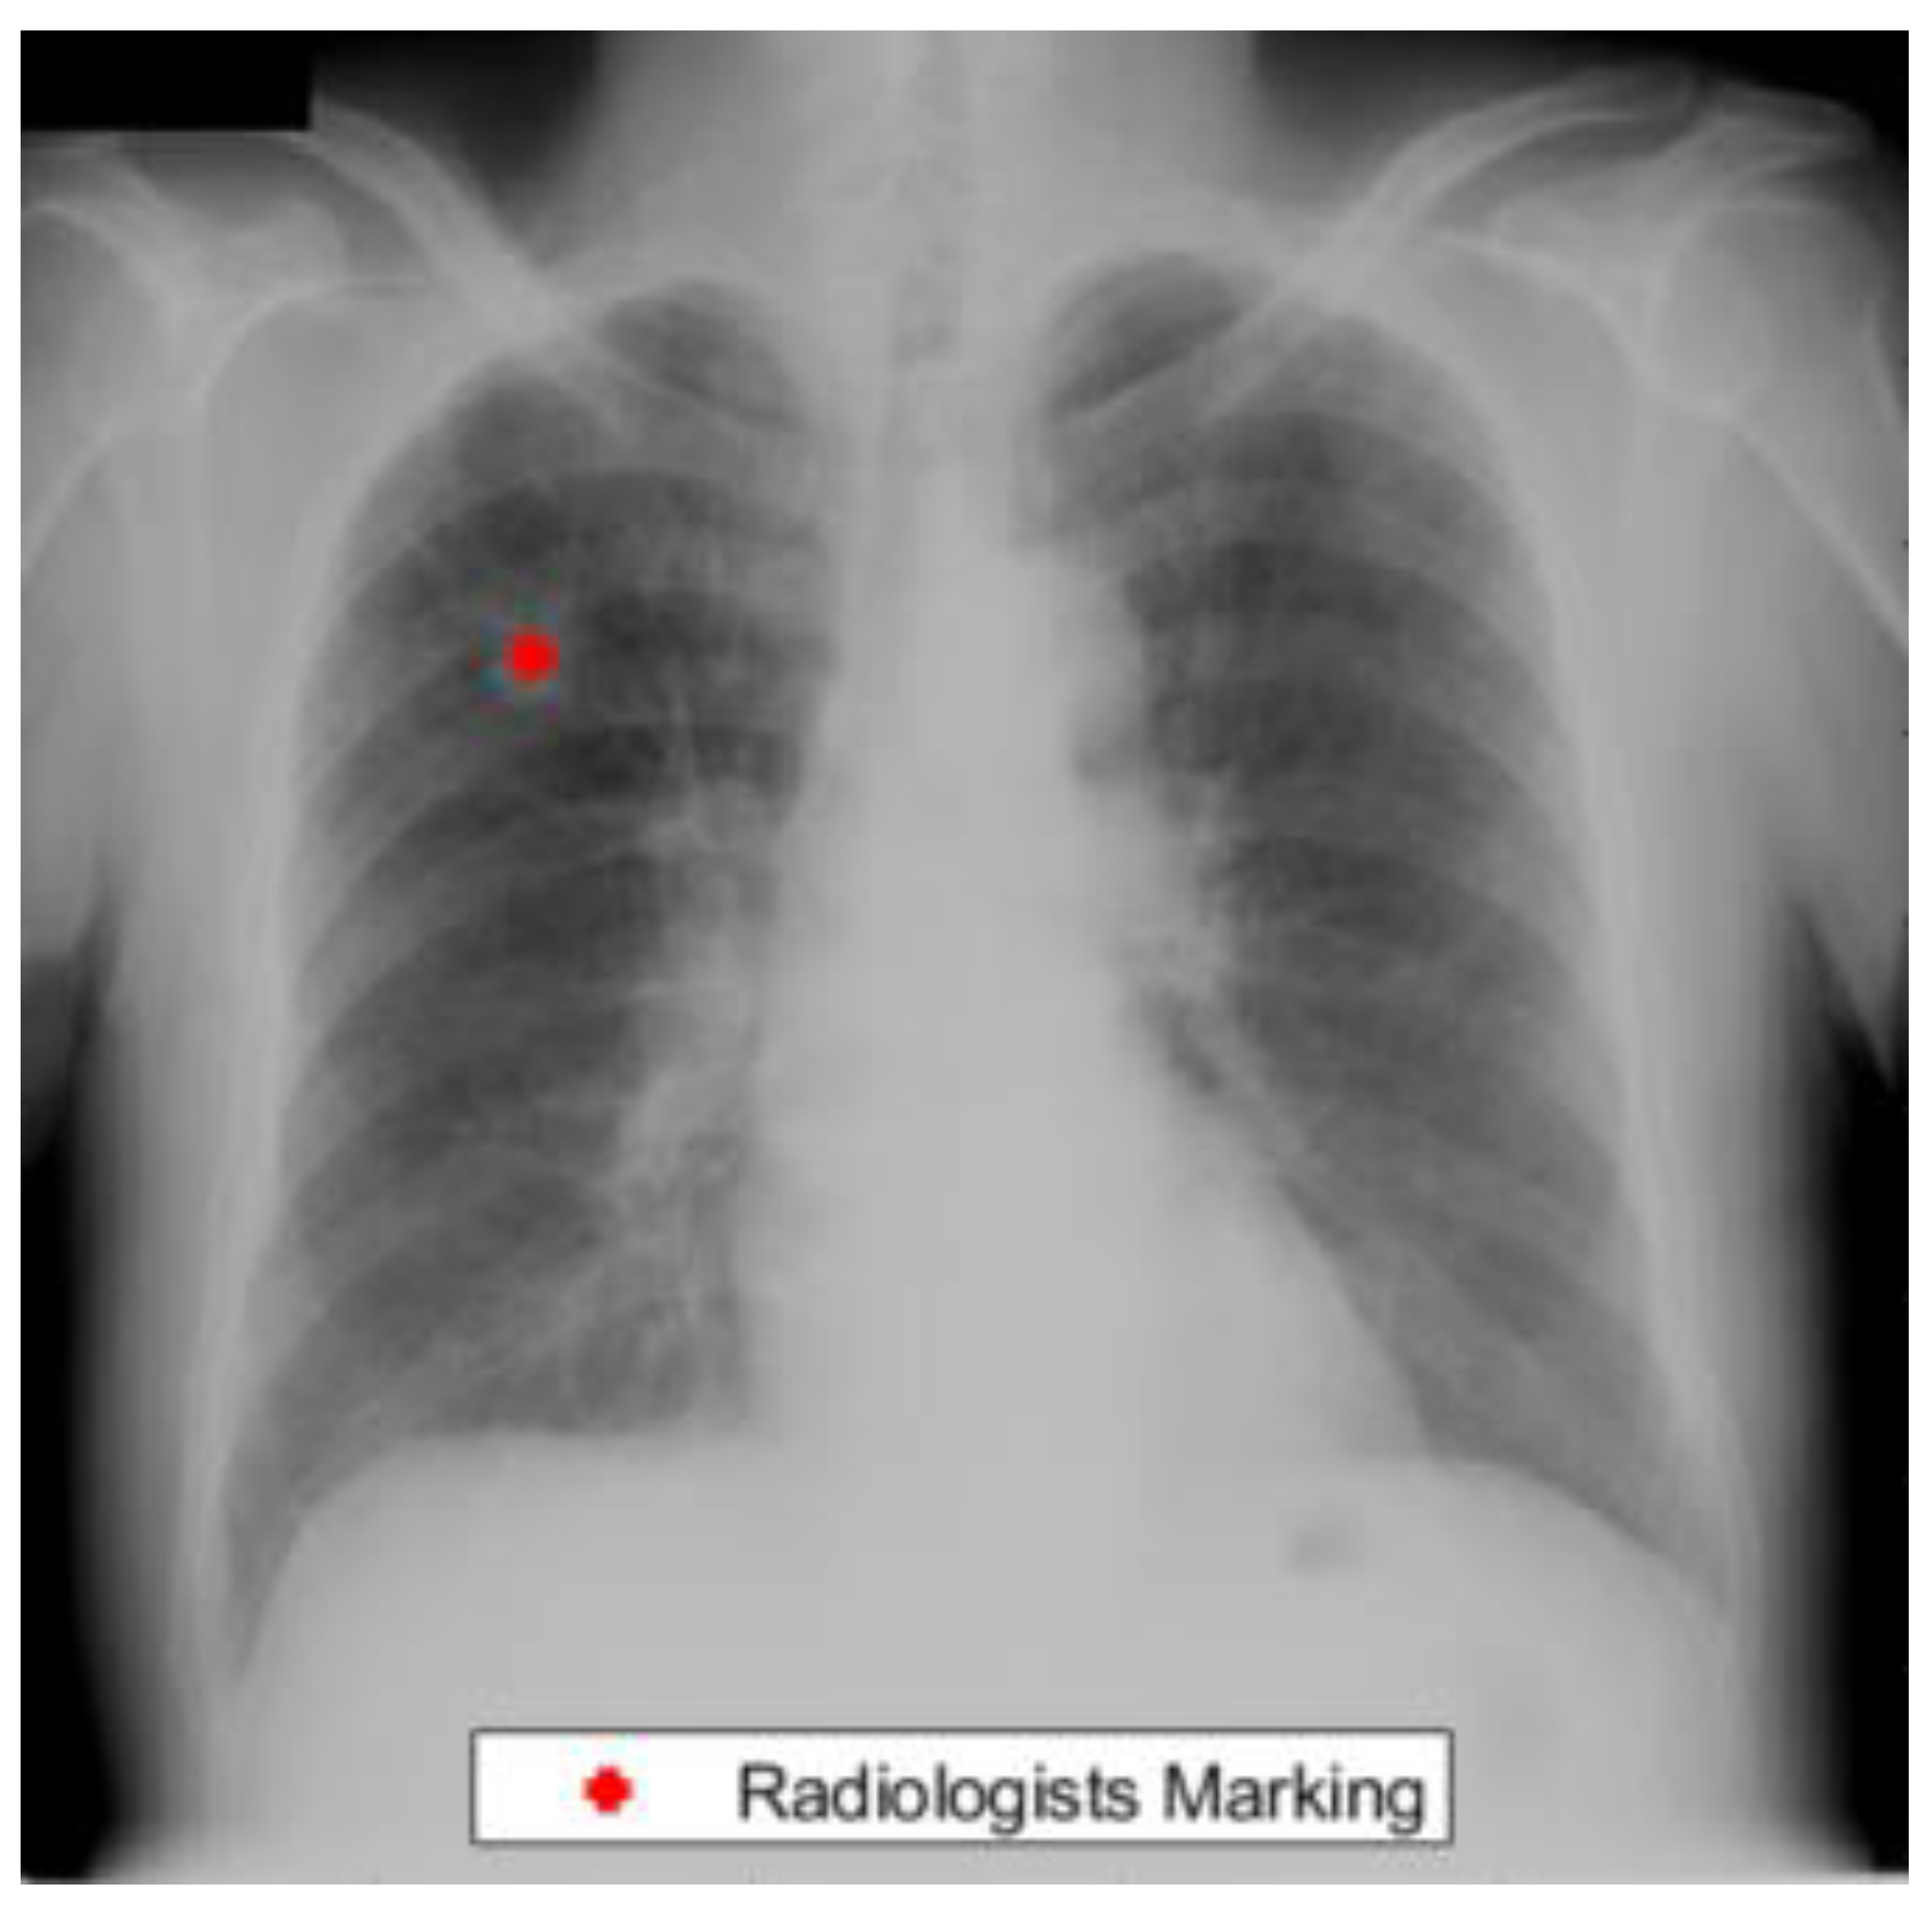
The Japanese Radiological Scientific Technology (JRST) dataset was marked by radiologists for the detection of lung nodules [42]. This dataset contained 247 chest radiographs out of which 154 cases contained nodule markings. In addition, lung masks are provided by [43] which can be used to study the performance of our lung segmentation algorithm. Figure 1 presents an example from the JRST dataset with a radiologist’s lung nodule marking.
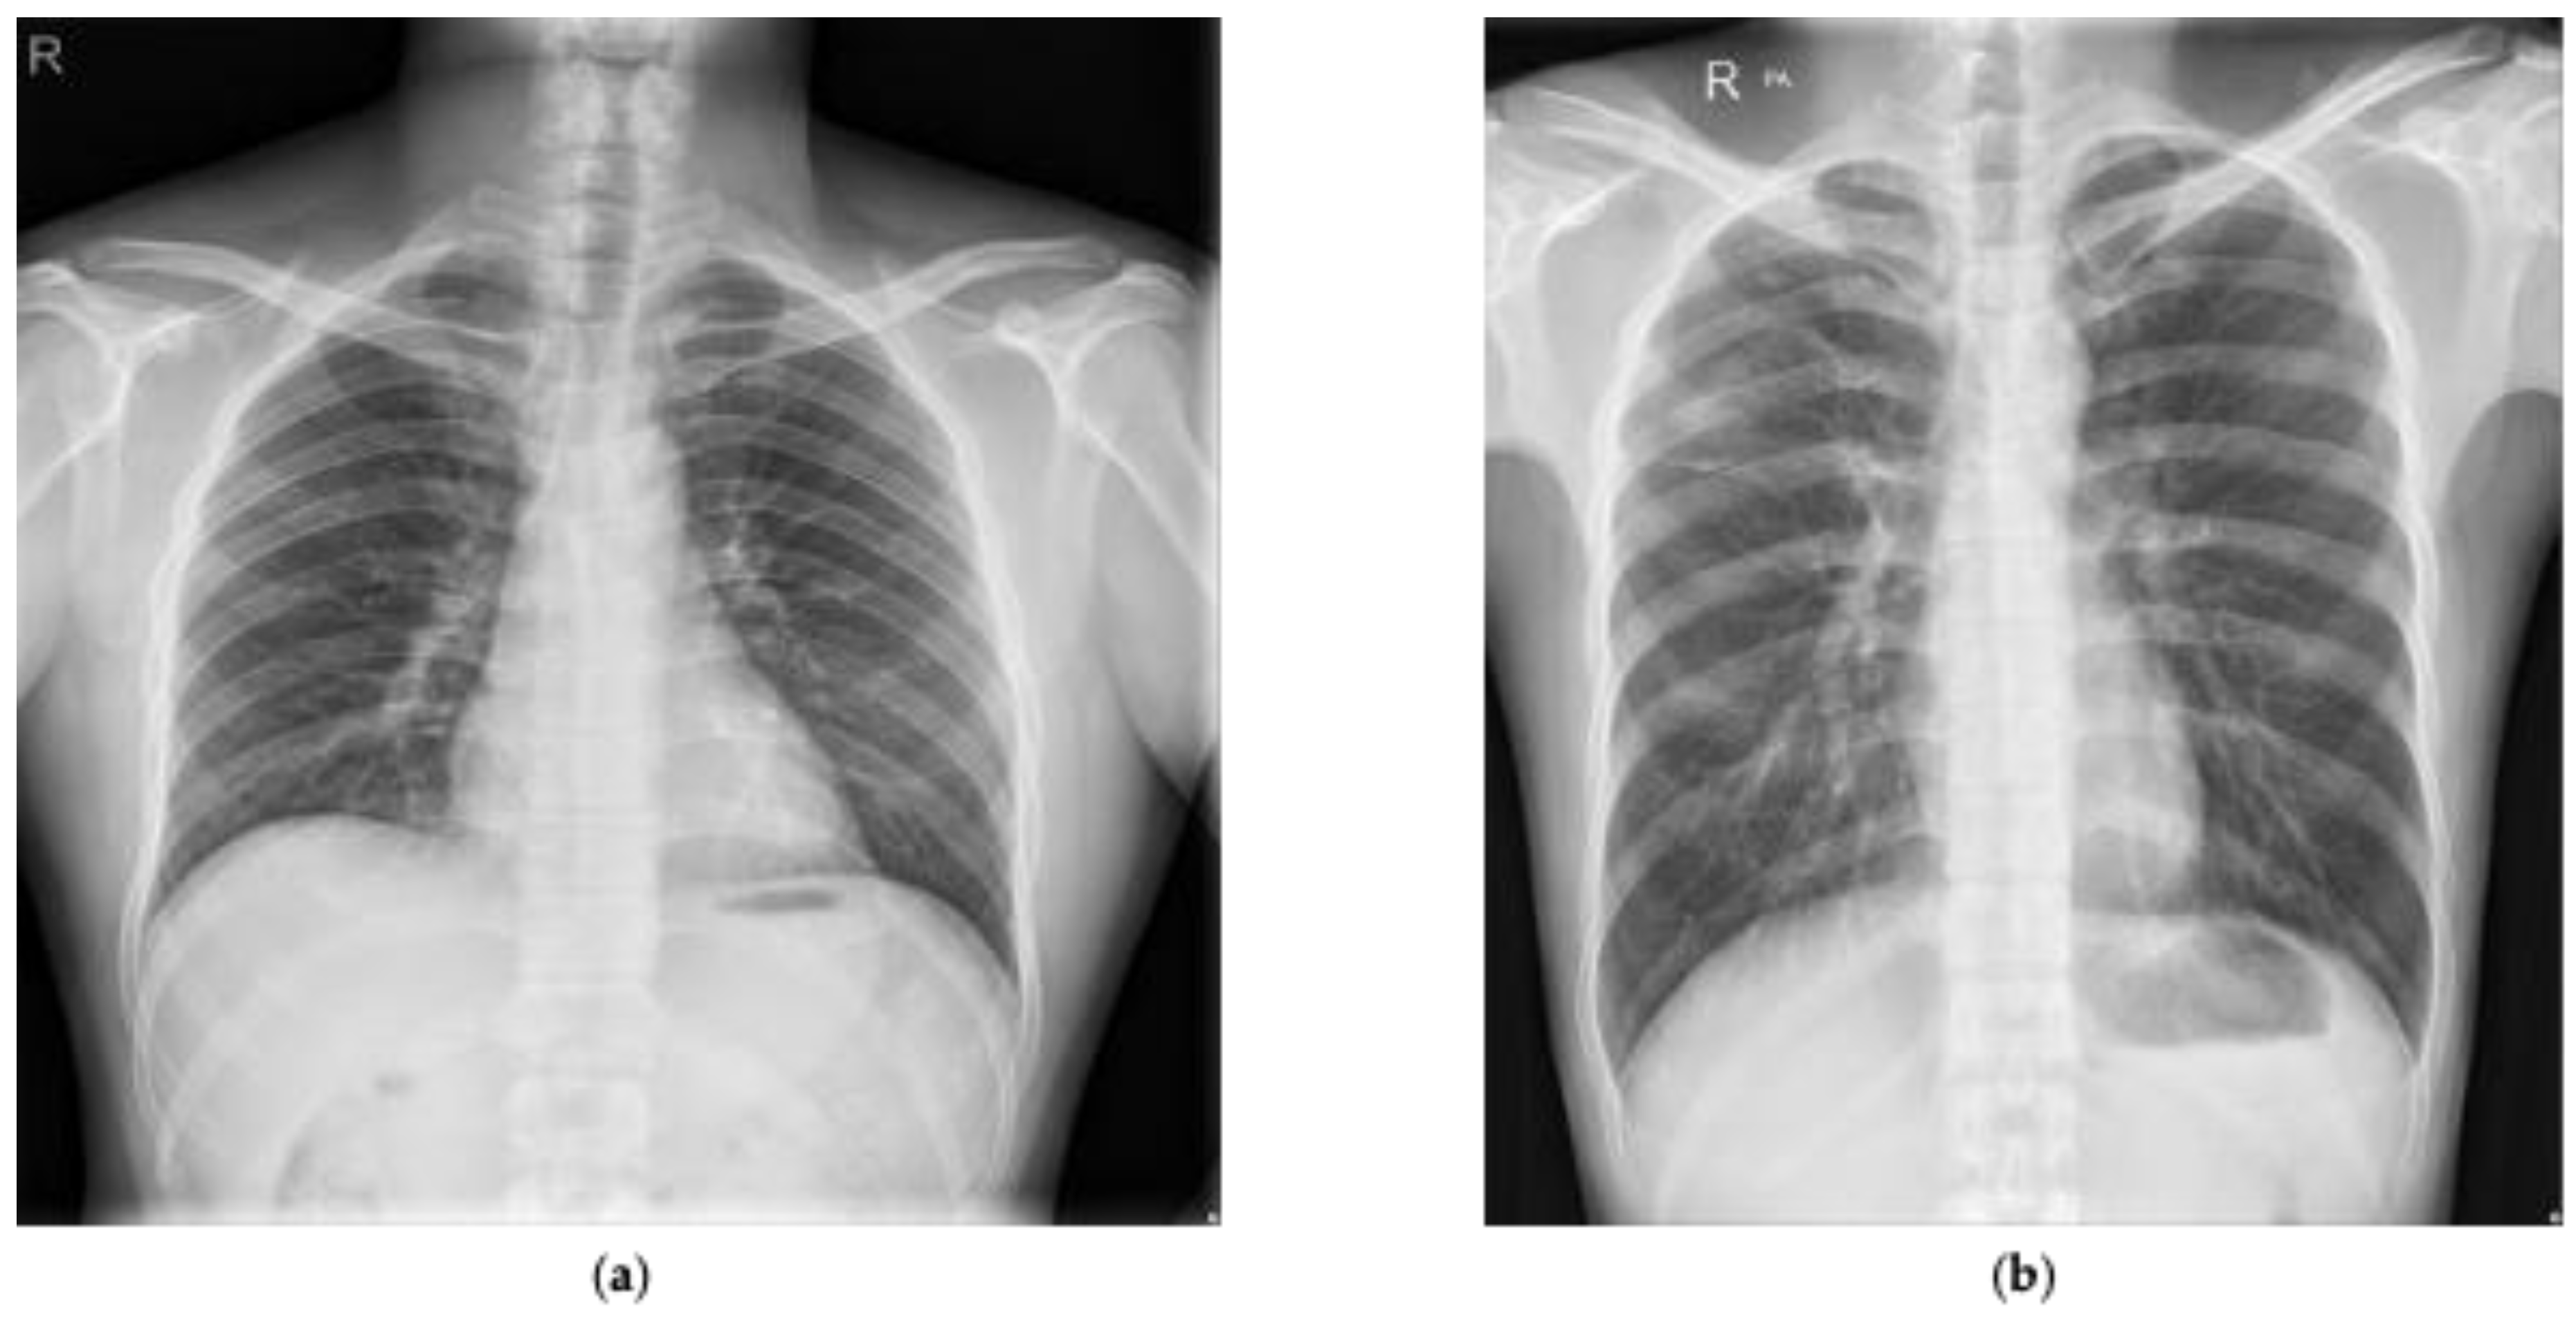
We also utilized a publicly available Shenzhen dataset marked by radiologists for the detection of tuberculosis [44,45,46,47]. This dataset was composed of 662 annotated chest radiographs with 336 marked as tuberculosis and the rest marked as normal. 
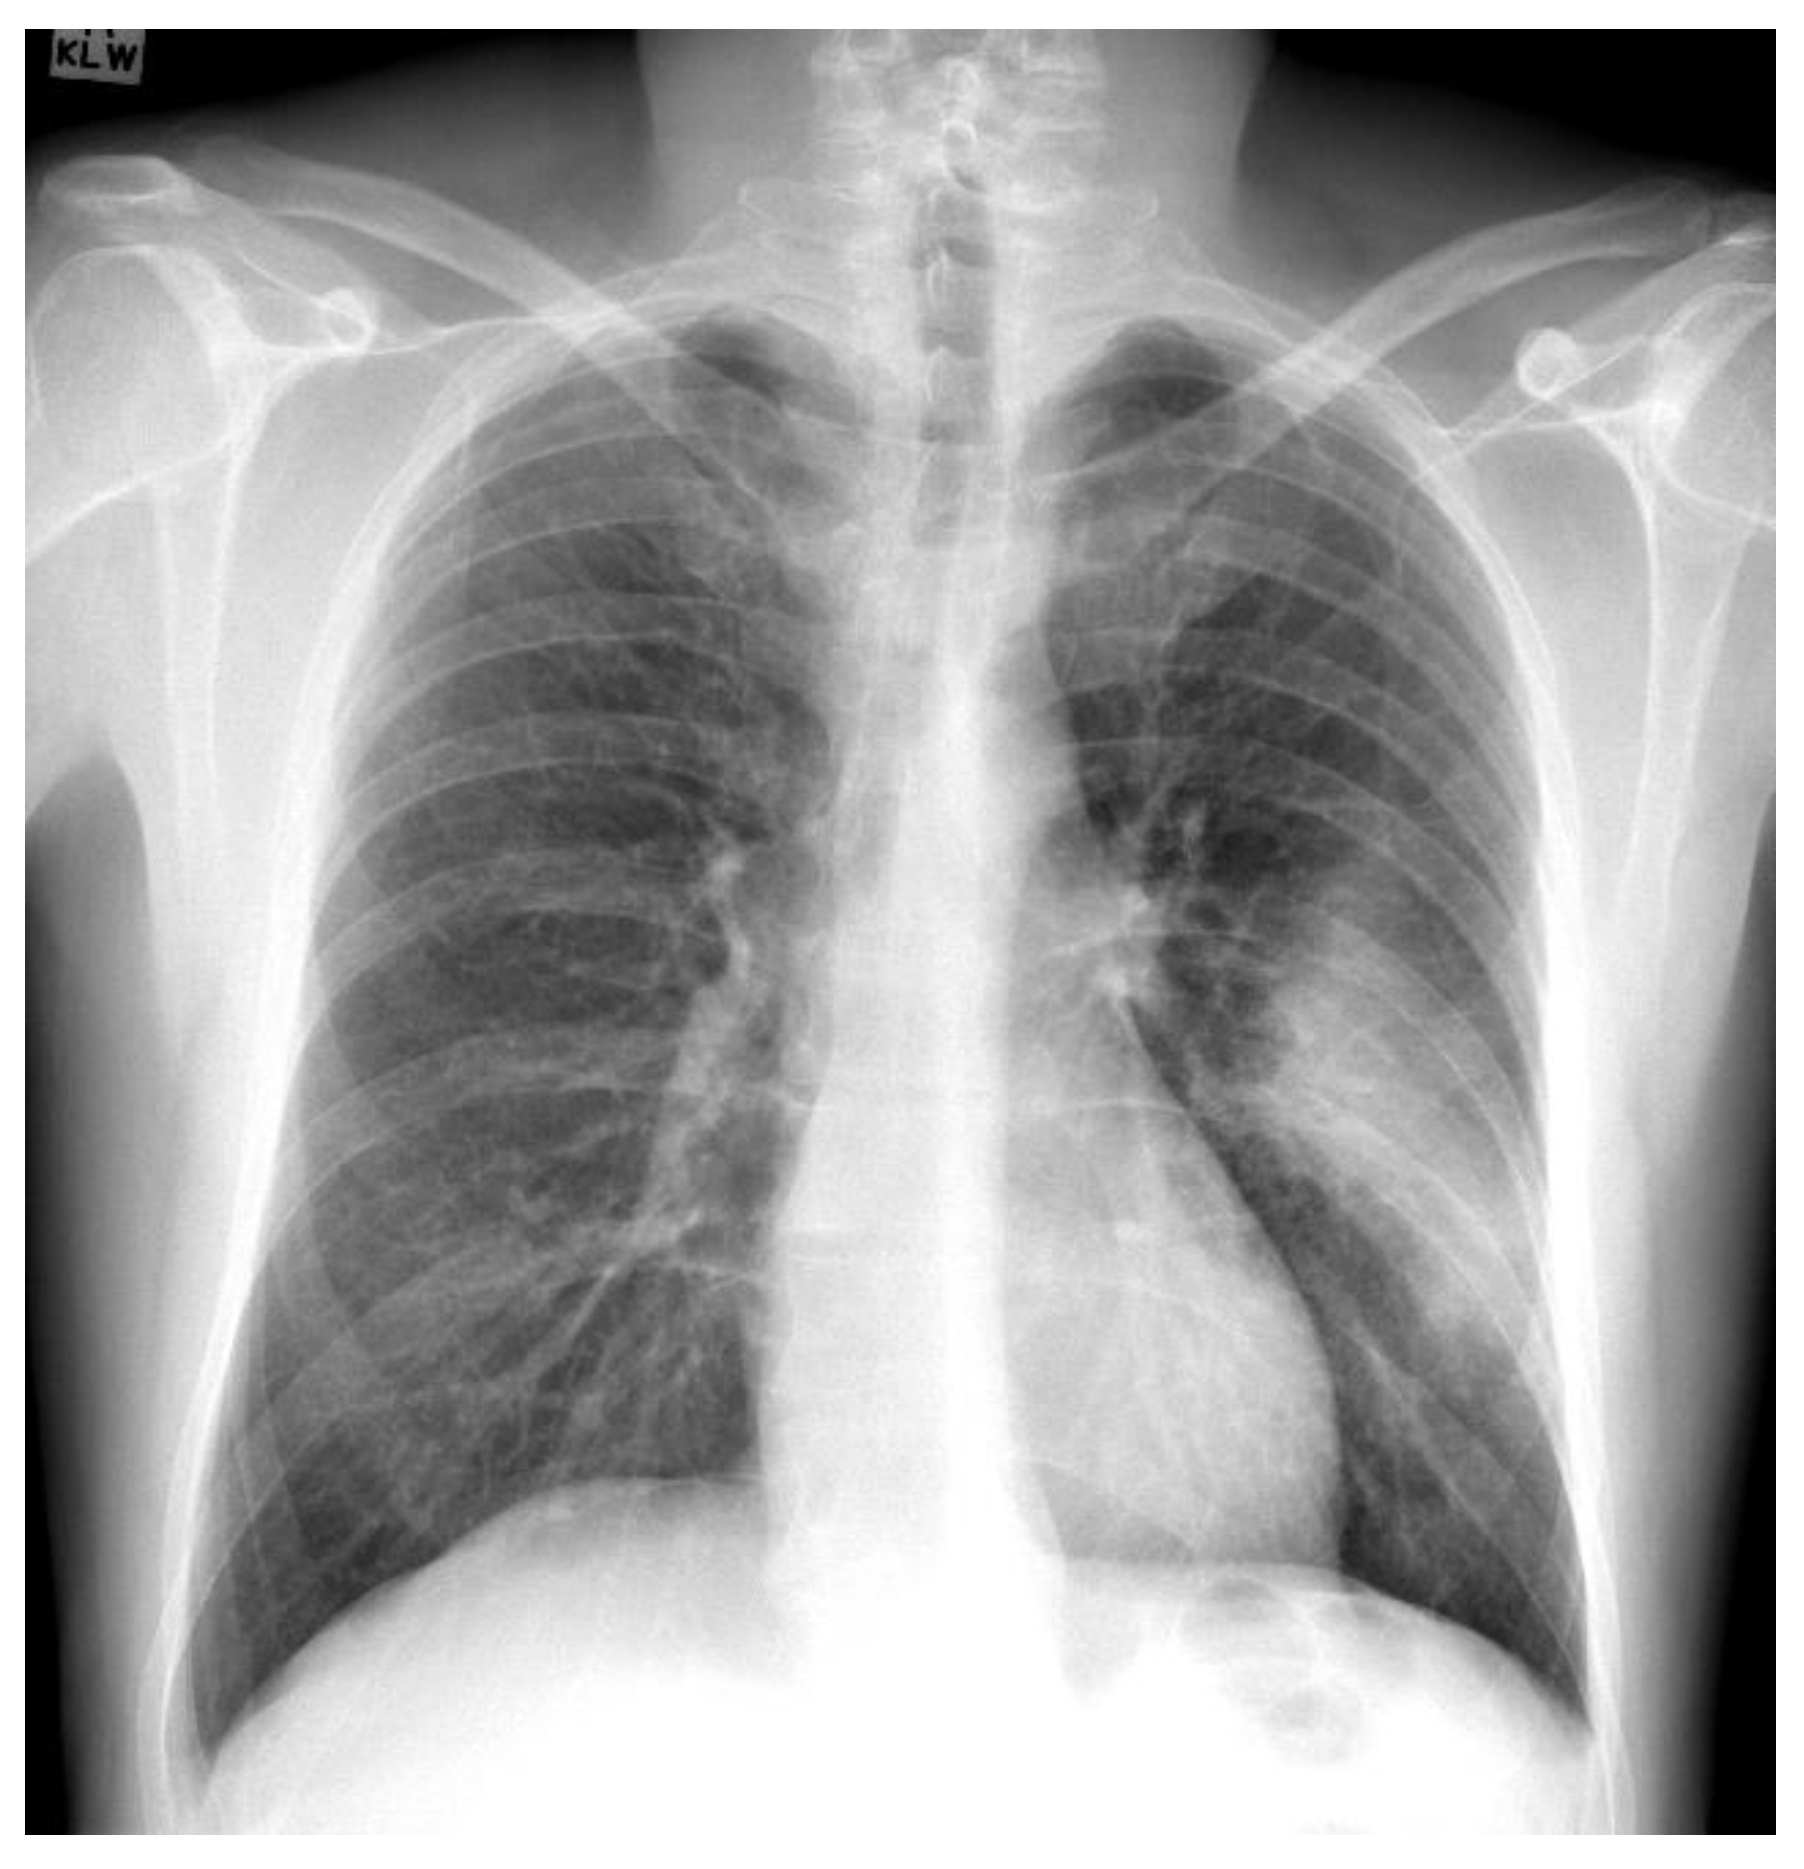
Figure 2 presents two examples presented in the Shenzhen dataset that have been marked as normal and tuberculosis, respectively, by radiologists. In addition, manual lung masks were publicly available for 566 cases in the Shenzhen dataset. Note that we included only those cases for this research.
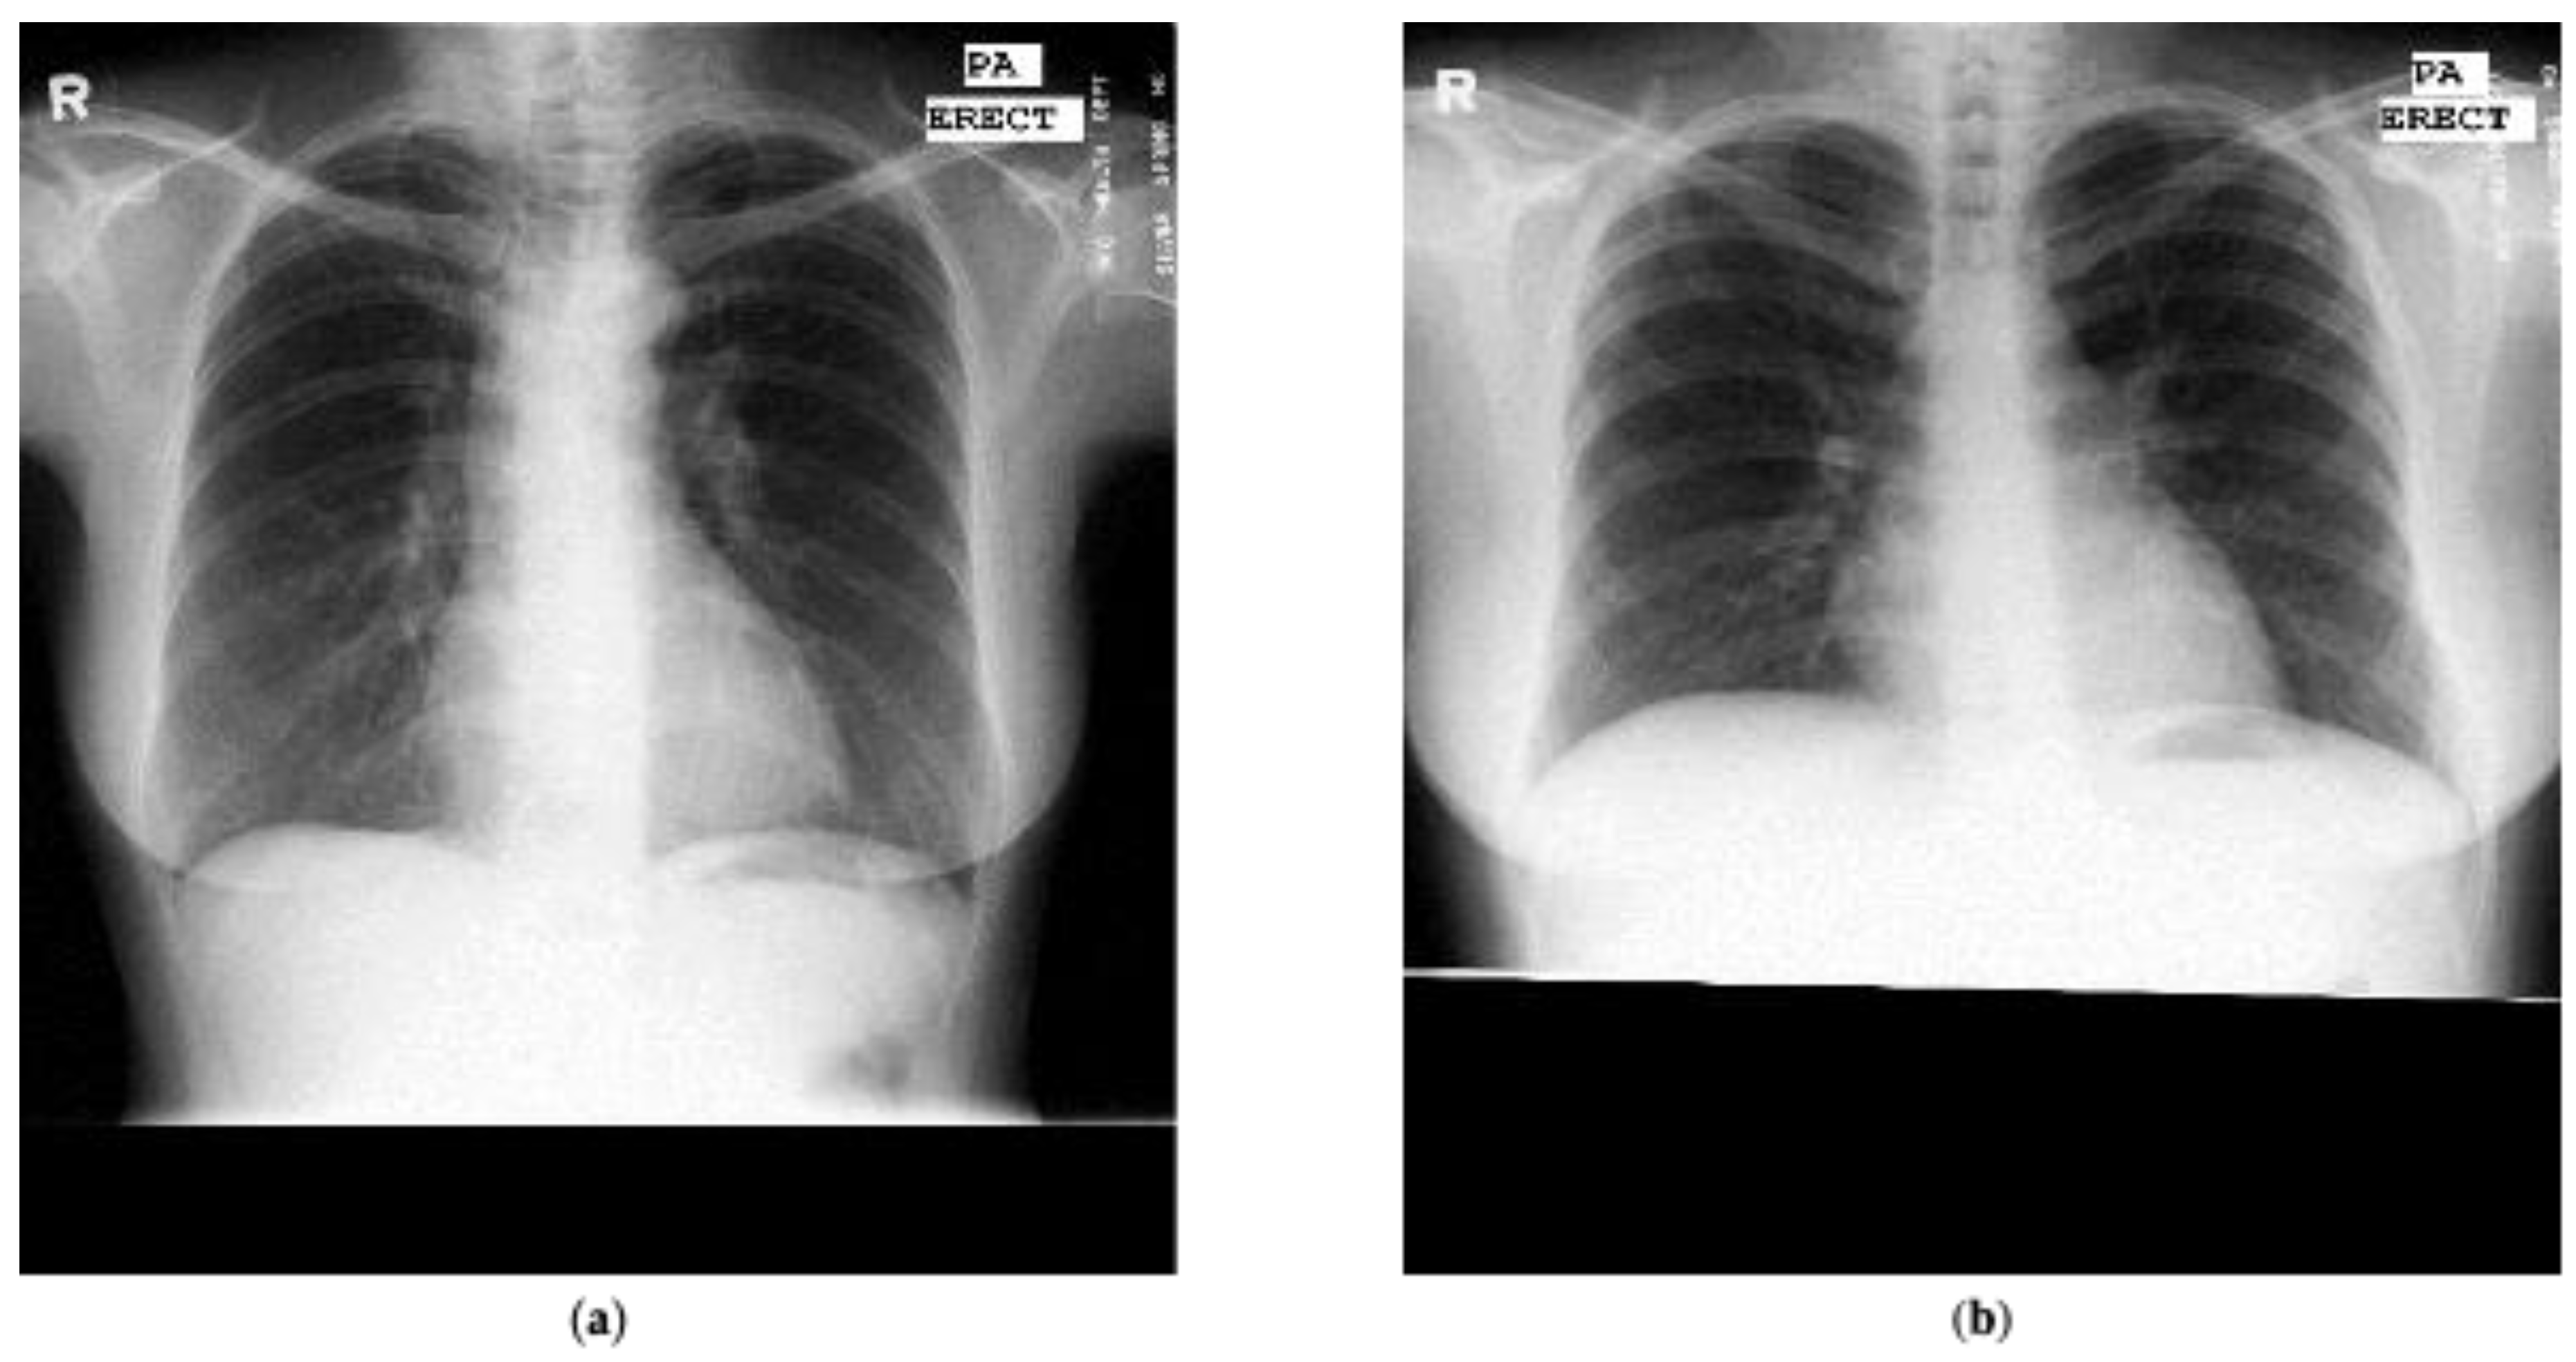
The Montgomery dataset [45,46] was marked by radiologists for tuberculosis detection and comprised of 80 chest radiographs marked as normal and 58 cases marked as tuberculosis. Similarly to the Shenzhen dataset, the lung masks marked by radiologists are available publicly. 
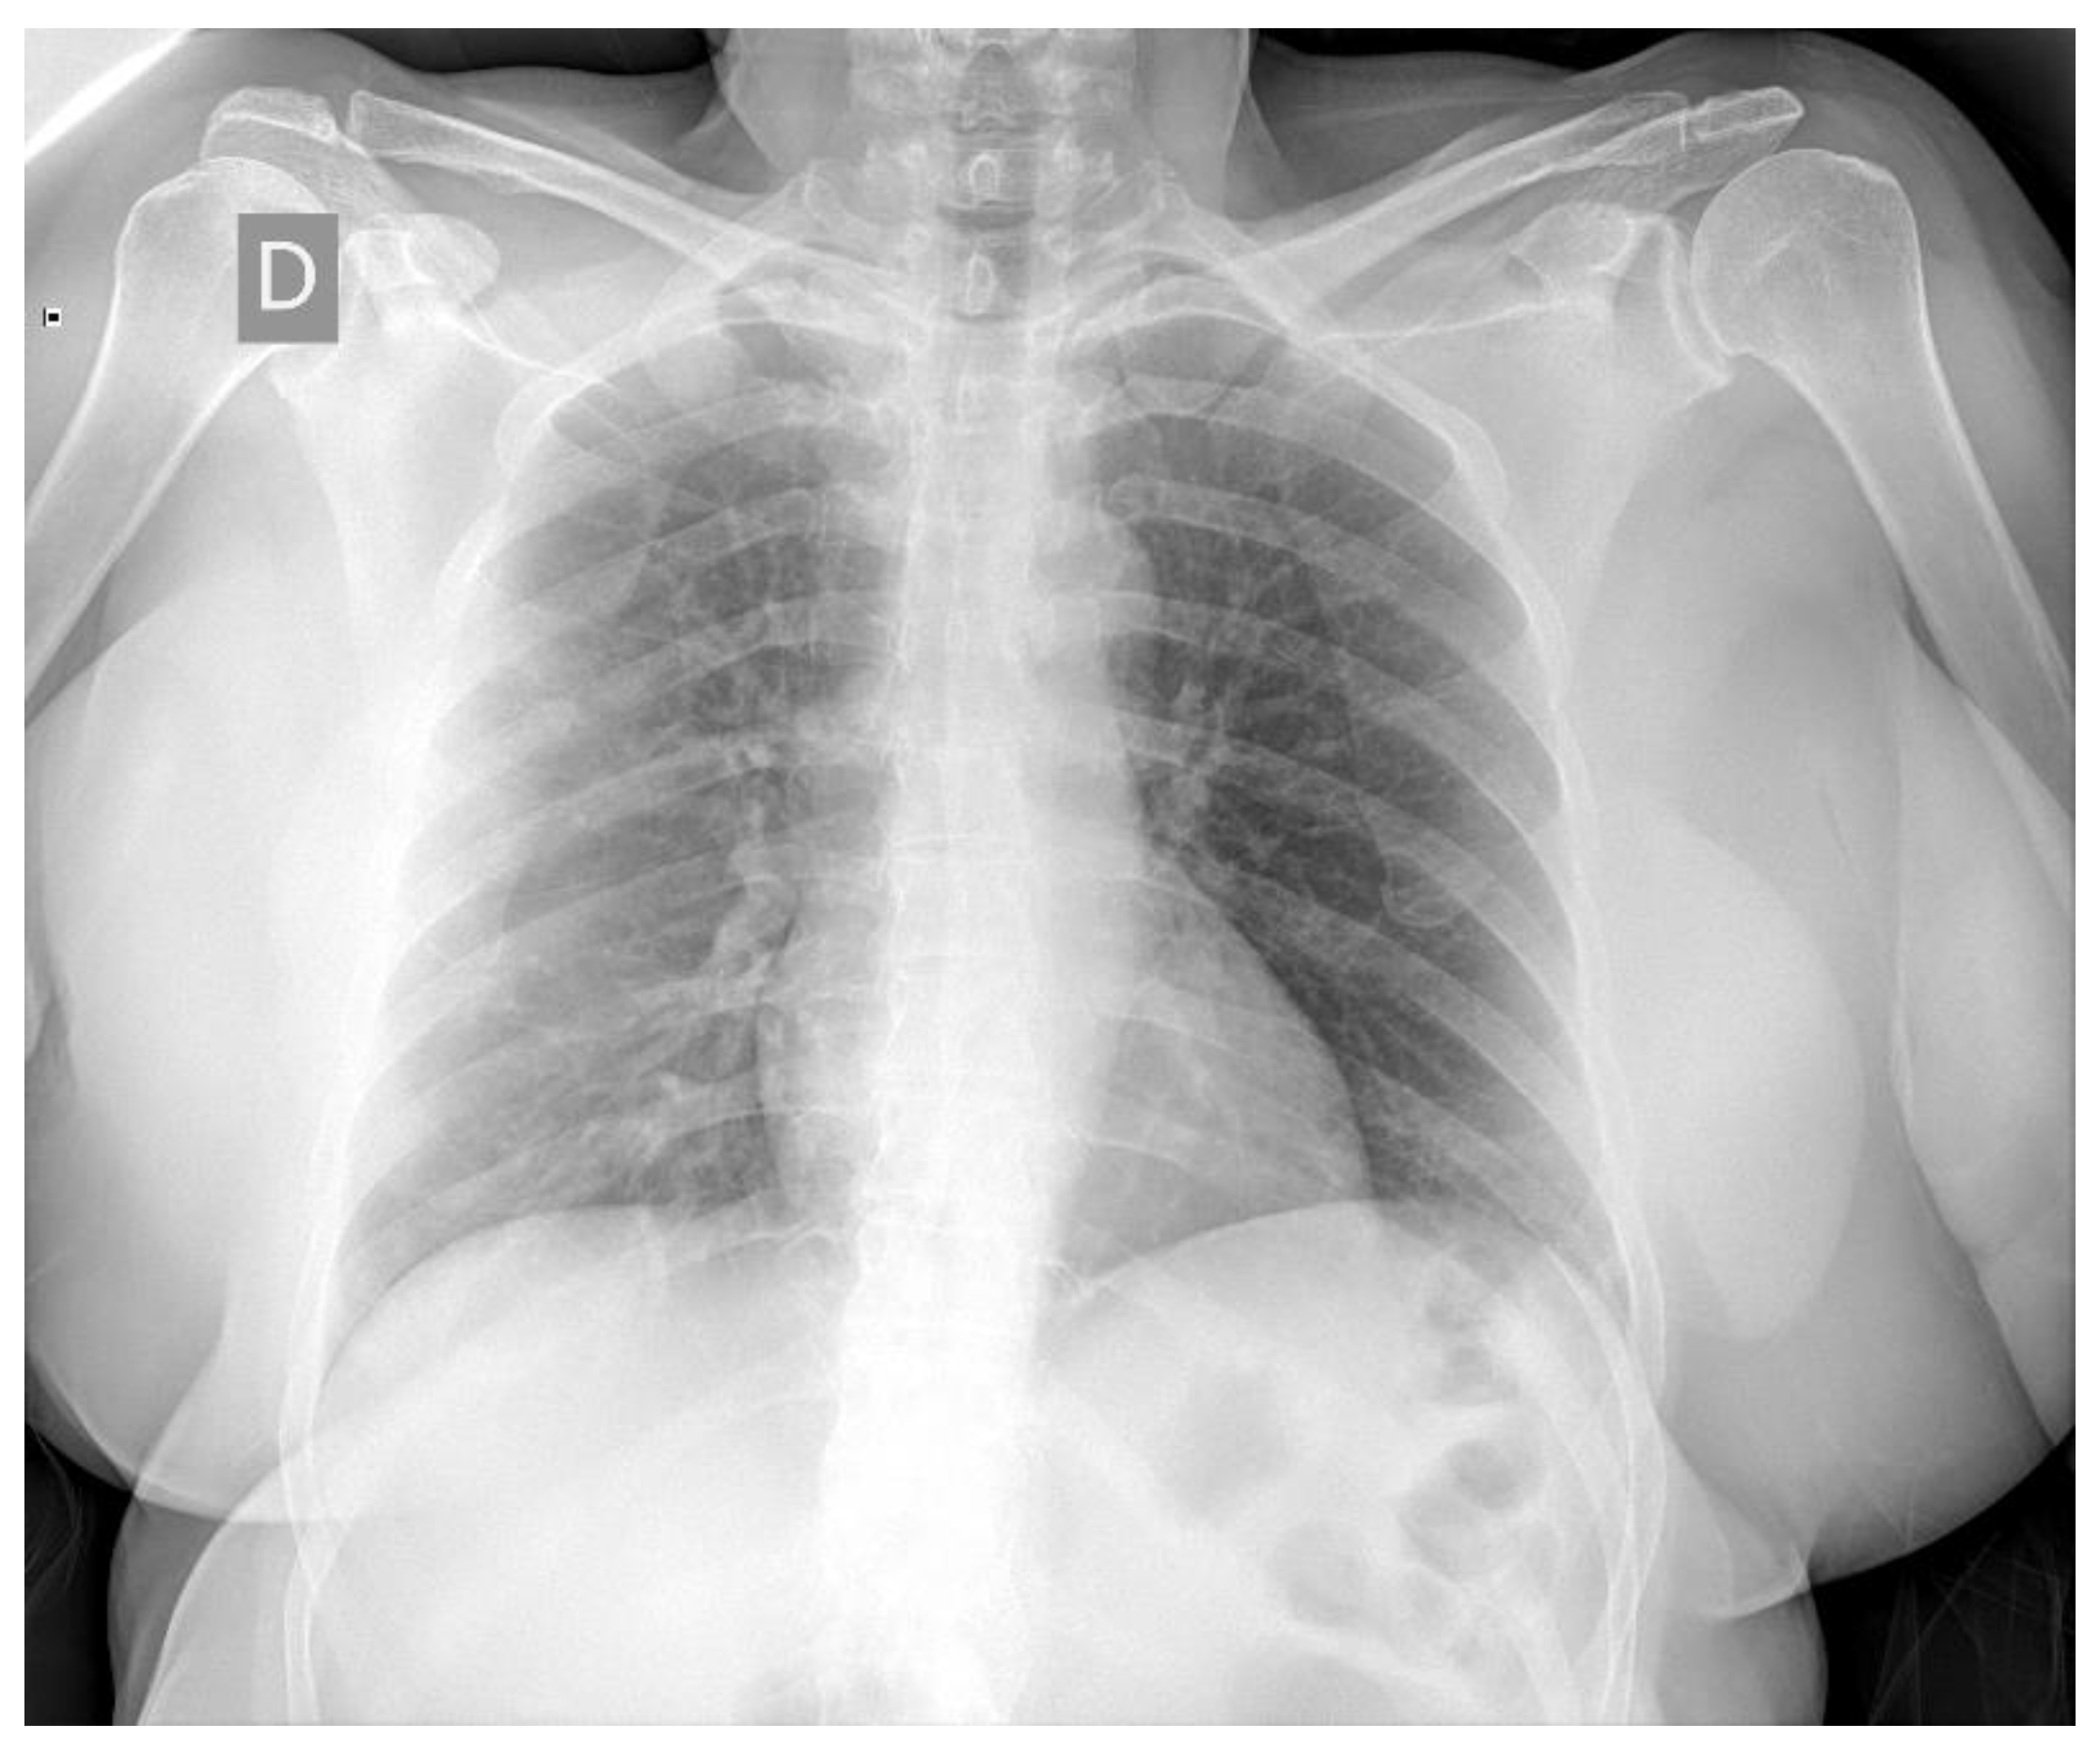
Figure 3 presents one example marked as normal and one example marked as tuberculosis from the Montgomery dataset.
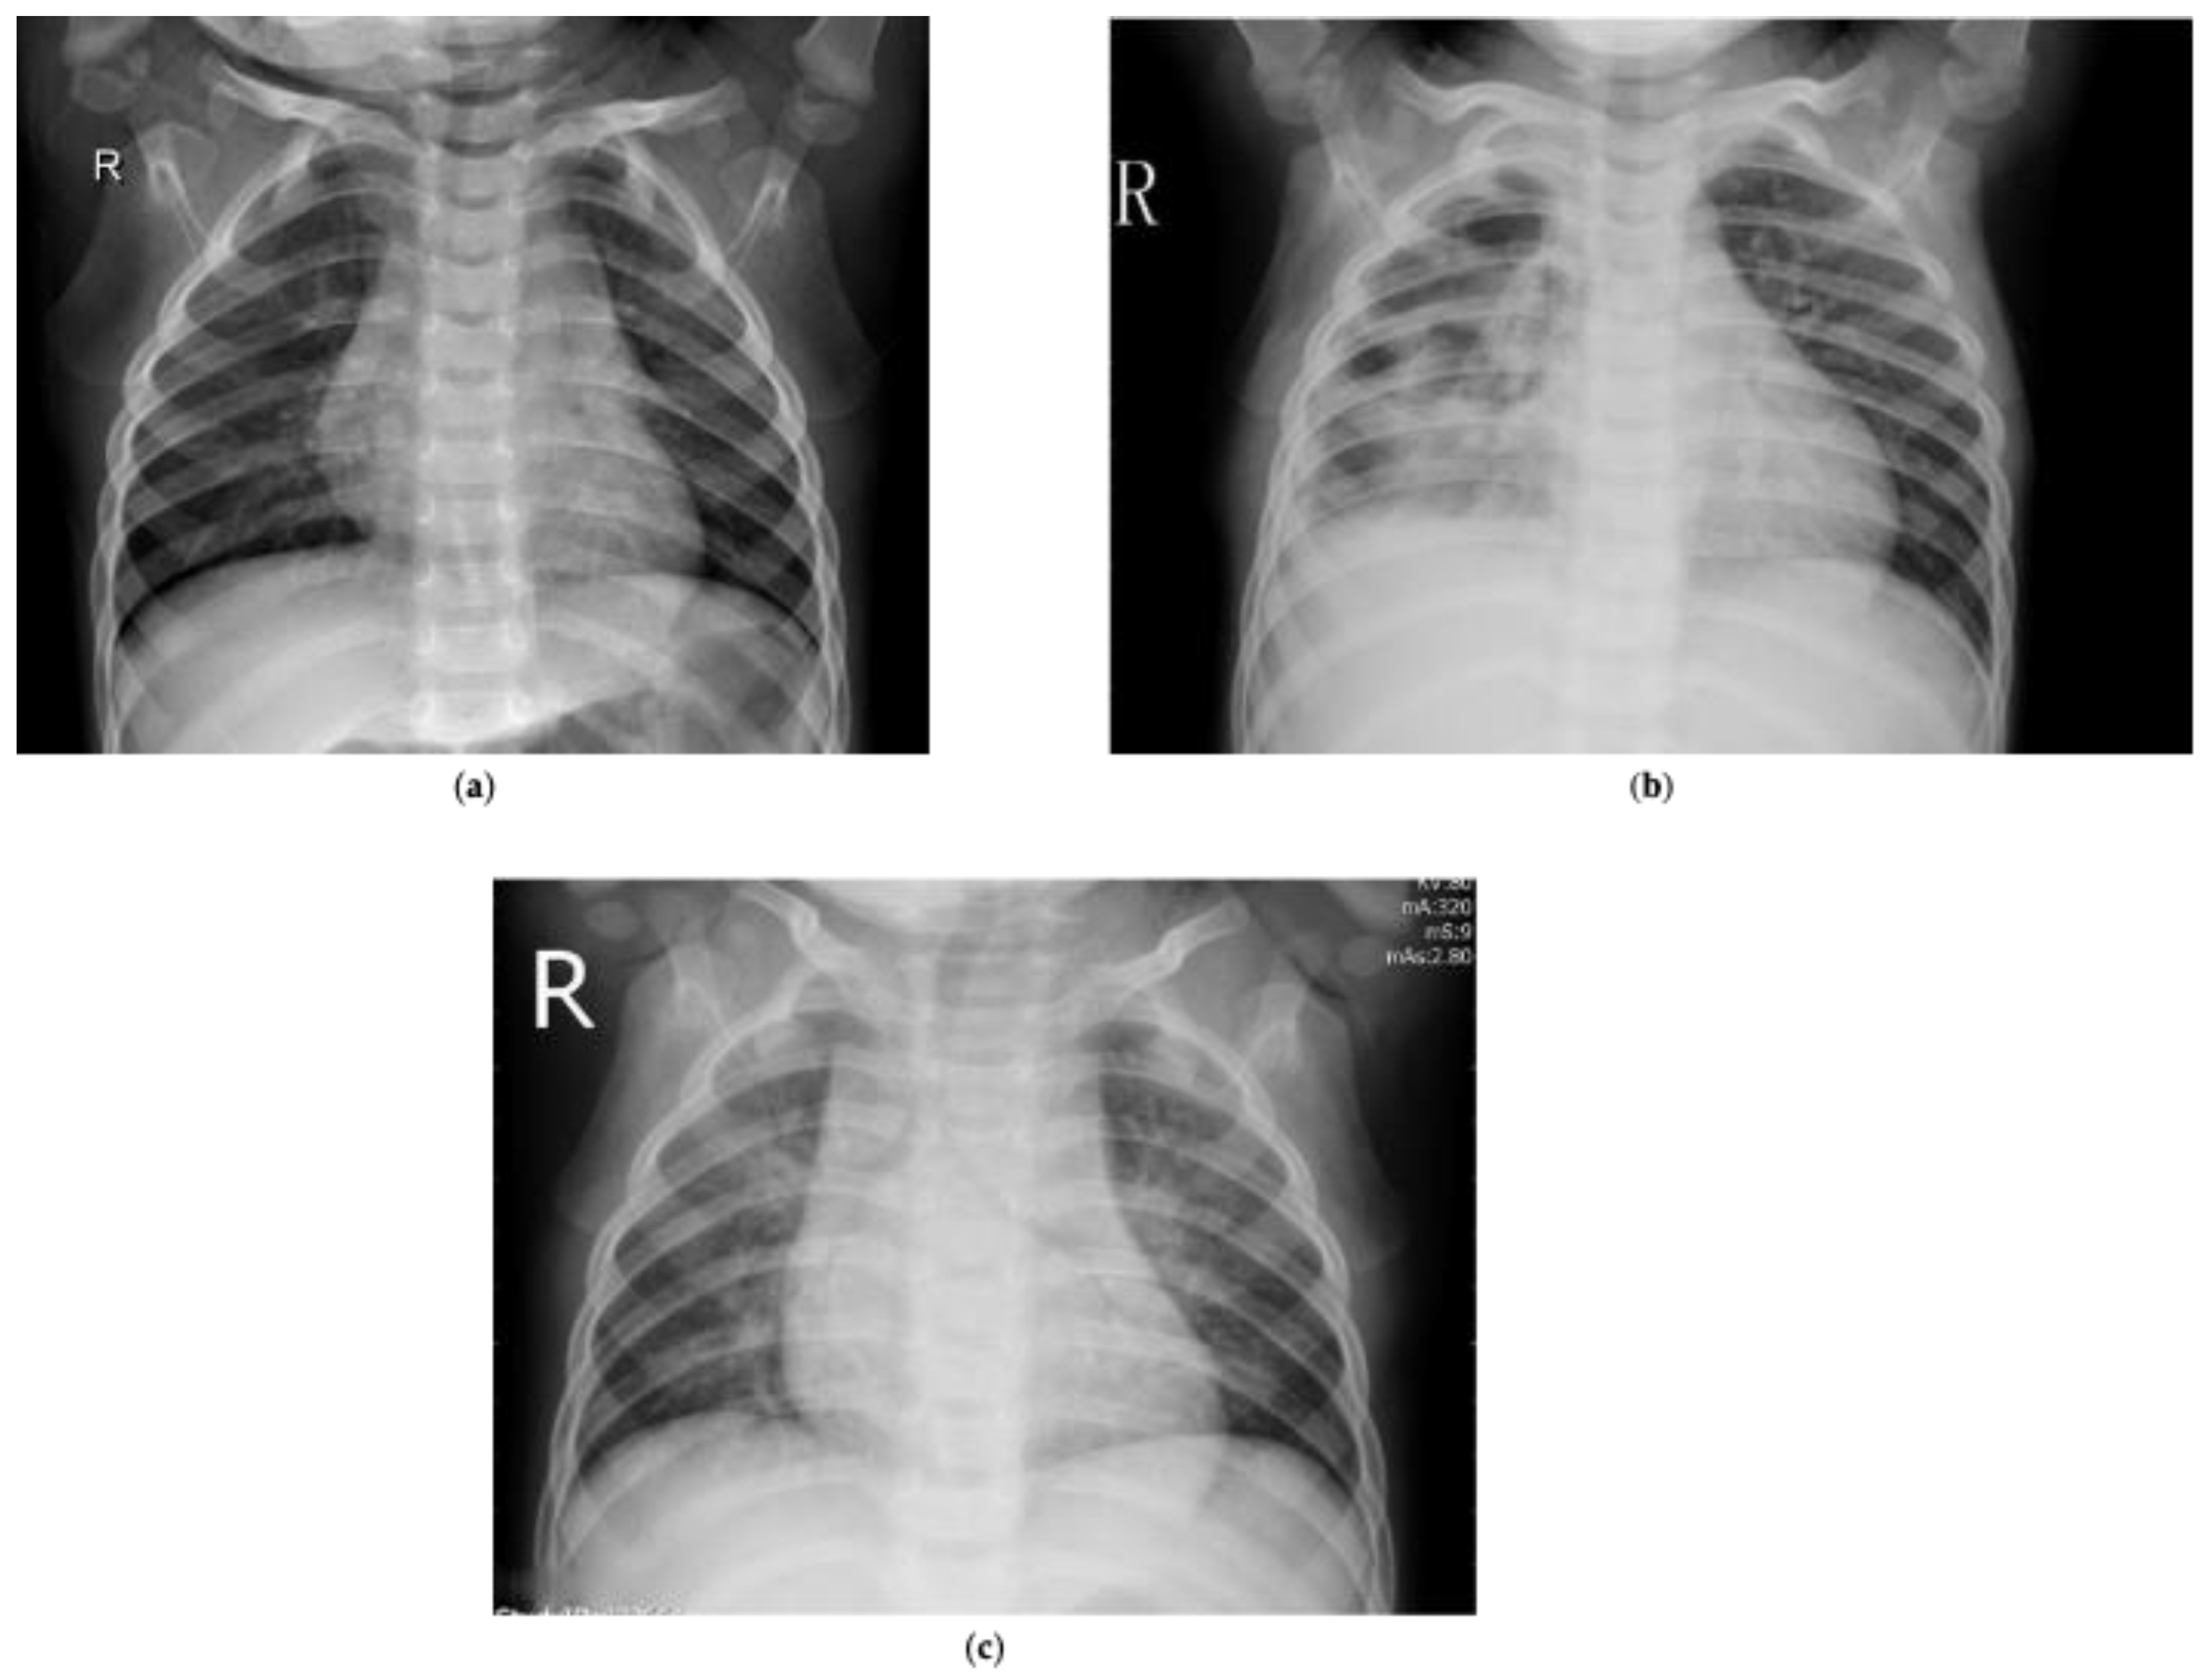
Another publicly available dataset that we refer to is the pneumonia dataset, which contained chest radiographs marked for pneumonia detection [48]. It contained 5856 chest radiographs manually annotated by radiologists as normal, bacterial or viral pneumonia. Table 2 presents the composition of the pneumonia dataset. 
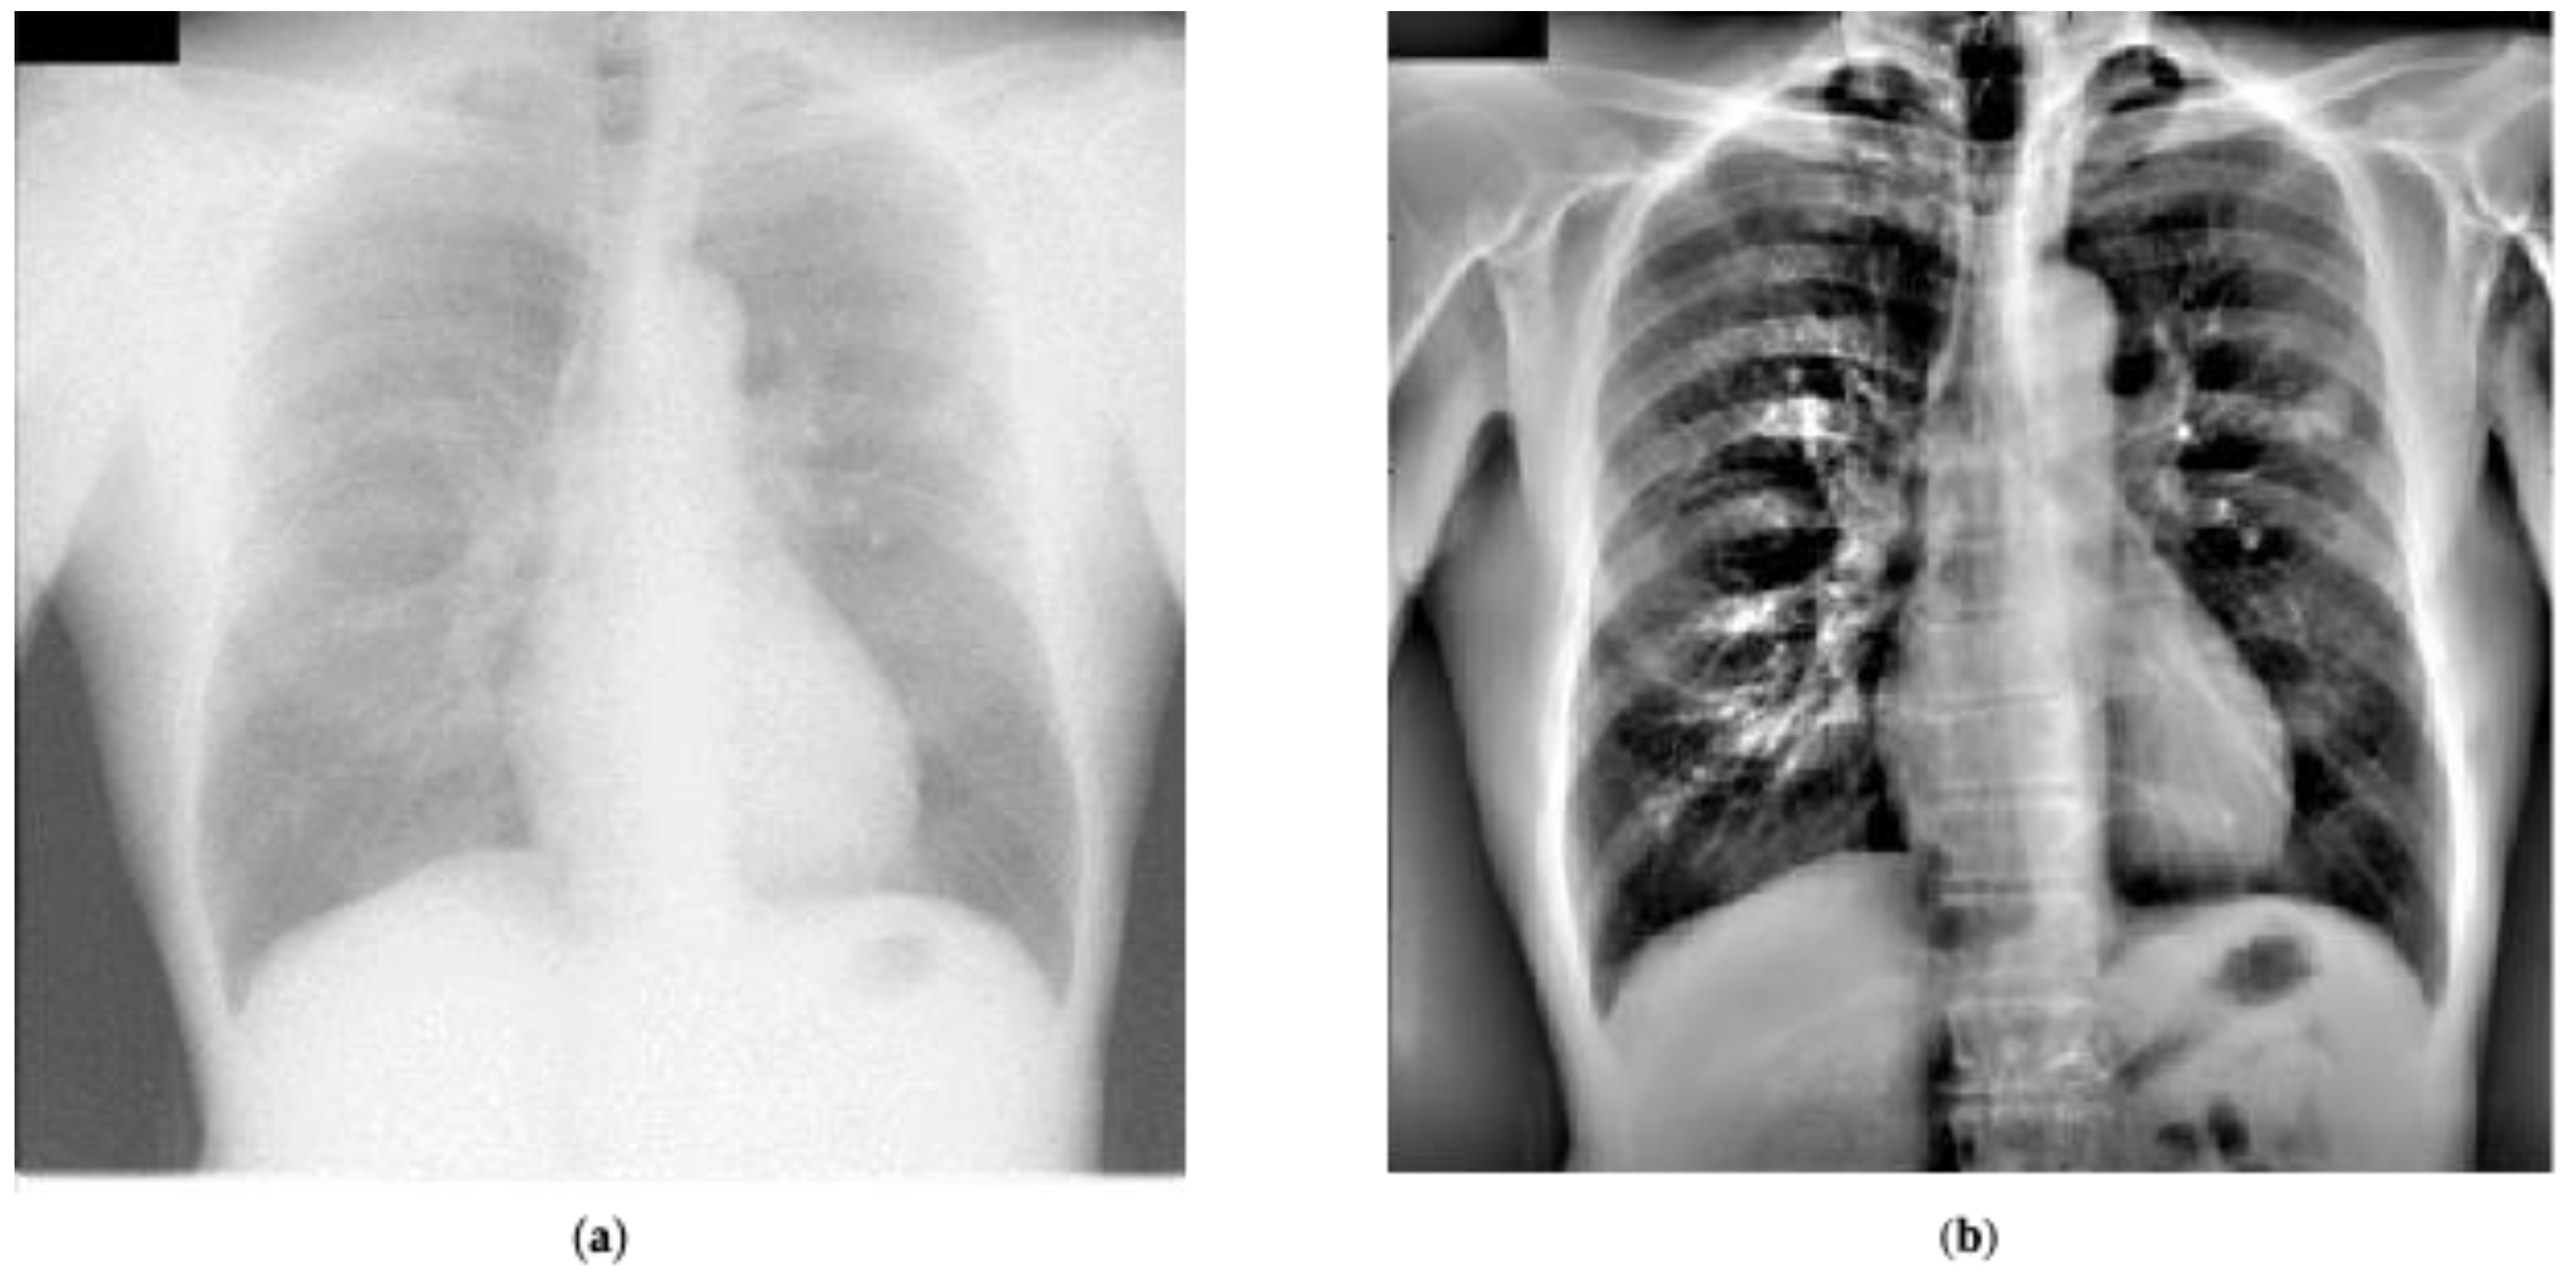
Figure 4 presents certain sample chest radiographs marked in the dataset.
Finally, for COVID-19 cases, we used the datasets available publicly at [49,50]. The dataset presented in [49] was curated by Dr. Joseph Cohen, a postdoctoral fellow at the University of Montreal and contained images marked as COVID-19 by radiologists. We solely utilized the 239 chest radiographs in frontal angle that had been marked as COVID-19 from this dataset. Note that the dataset used for this paper was downloaded on 16 May 2020 and the images are frequently being updated so the quantity of images might differ. Figure 5 presents an example marked as COVID-19 by radiologists from this dataset. In [50], a large dataset was introduced from the Valencian Region Medical ImageBank (BIMCV) containing chest radiographs of COVID-19 patients marked by expert readers. This dataset contained radiological findings and location, pathologies, radiological reports, and DICOM metadata for 2265 chest radiographs belonging to 1311 patients. To the best of our knowledge, this is the largest COVID-19 dataset of chest radiographs available publicly. However, note that there are no normal cases in this dataset. We considered all the images in the BIMCV dataset as COVID-19, as reported in the paper associated with the dataset [50]. All studies of patients in the dataset had at least one positive RT-PCR test. Figure 6 presents an example marked as COVID-19 by radiologists from this dataset. Note that we utilized all of the datasets except BIMCV for 10-fold cross validation purposes. We conducted a sensitivity analysis experiment using the BIMCV COVID-19 dataset. We also conducted another experiment in which we split all the datasets available in our resources for a thorough hold-out validation.

4. CAD System

In this section, we present the different CAD system training methodologies using CNNs for the CAD of COVID-19 on chest radiographs, including the recommended system to tackle class imbalance. We adopted the top-level architectures presented in [5,6,10] by the co-authors of this paper for CAD of lung nodules and pneumonia detection and diagnosis in chest radiographs. Figure 7 presents the top-level block diagram for the enhanced baseline and recommended CAD systems studied in this paper.

4.1. Preprocessing

We preprocessed the chest radiographs to normalize images present across the datasets. At first, chest radiographs were thresholded to remove very ‘bright’ pixels that typically represent text annotations present across datasets to avoid any type of bias. Note that the entire suite of the chest radiographs was converted to grayscale, if necessary, before performing any of the preprocessing operations. The images were then reshaped to a size of 256 × 256. This size was empirically determined to be highly effective for the CAD of lung nodules [5,6,9]. Later, we preprocessed the chest radiographs using LCE to maintain the contrast within and across the images presented in the dataset [5]. Equation (1) describes the LCE process:
y ( m , n ) = x ( m , n ) μ ( m , n ) σ ( m , n )
where m, n are pixel coordinates, y ( m , n ) represents the LCE image, x ( m , n ) represents the resized image, σ ( m , n ) is the local standard deviation estimate, and μ ( m , n ) represents the local spatial mean estimate. Local spatial mean and standard deviations were estimated by convolving the resized images with a Gaussian low pass filter that had a standard deviation of 16 [5]. Figure 8 shows an example image from the JRST dataset before and after LCE preprocessing.

4.2. Lung Segmentation

Lung segmentation plays a crucial role for CAD tools. Segmenting the lungs helps in narrowing down the region of interest for the classification architecture. It also assists the automated algorithm in learning patterns/features specific to the lungs, because diseases such as tuberculosis, bacterial pneumonia, viral pneumonia, and COVID-19 tend to show variation only within the lung region. In this paper, lung segmentation was performed with the U-Net architecture presented in [9] with an encoder depth of 3. The LCE images served as the input. In [9], the lung segmentation algorithm is developed based on the JRST and Shenzhen datasets. We adopted the same approach in this research.

4.3. Traditional Transfer Learning Approach

We utilized established CNNs initially trained on millions of images for transfer learning. We replaced the last fully connected layer of such networks with two fully connected units and initiated further training to classify the images into different classes. We chose to employ two units, because this has been shown in [10] and [18] to be effective. Initial weights to the deep CNN were assigned based on the pre-trained models on ImageNet database [51]. We studied the performance of ResNet50, Inception-v3, DenseNet201, and Xception. These networks have proven to be highly effective for medical imaging applications such as the detection of pneumonia [10], tuberculosis, diabetic retinopathy, malaria, and brain tumors [18].

4.4. Transfer-to-Transfer Learning Approach

In our recommended system using transfer-to-transfer learning methodology, we split the highly imbalanced training dataset into a series of class-balanced mini-sets. Each mini training set contained all the images belonging to the COVID-19 category and an equal quantity of randomly picked non-COVID-19 category images. We split the training set such that there was no repetition of non-COVID-19 images across the mini training sets. When training was completed on one mini-set, those weights were transferred to the next mini-set. This process was repeated until we processed every non-COVID-19 class image presented in our full training dataset. We split the training dataset into N mini training sets where N is given by
N   = #   T o t a l   I m a g e s #   M i n o r i t y   C l a s s   I m a g e s .
To begin this training process, we adopted the traditional transfer learning approach as mentioned in Section 4.3 for the first mini training set. Figure 9 presents a block diagram of the recommended system’s training mechanism. To the best of our knowledge, this type of approach has never been studied before for any classification problem in the field of medical imaging. We believe that this approach helps the machine learning process to utilize the entire suite of available training images, while also providing balanced presentation of the two classes. This helps in addressing class imbalance with no synthetic data augmentation. Note that our recommended approach compared all the images belonging to the minority class with one batch of majority class images in one epoch, and this process was repeated across every batch of majority class images. This helped the network in maximizing inter-class variance despite class imbalance. Weights were adjusted accordingly in each epoch, which helped the algorithm to perform well. This proposed approach is efficient in terms of memory, and each of the majority class images is seen only once by the network thereby reducing the training time significantly. We believe that this approach could be applicable to a variety of machine learning classification problems with an uneven distribution of classes.

5. Experimental Results

In this section, we present the experimental results obtained for both lung segmentation and COVID-19 classification.

5.1. Lung Segmentation

We used the JRST, Montgomery, and Shenzhen datasets to study the performance of our proposed U-Net CNN architecture [9] for lung segmentation, because lung masks for these data datasets were publicly available. We studied the performance with two different experiments. In the first experiment, we trained the U-Net architecture using JRST chest radiographs, validated using the Montgomery dataset, and tested on the Shenzhen dataset. We chose a learning rate of 10−3, a mini-batch size of 16 with a validation patience of 3, and a validation frequency of 50.
In the second experiment, we studied the performance of U-Net by using Shenzhen dataset images for training, the Montgomery dataset for validation, and the JRST dataset for testing. We utilized the same set of parameters as our previous experiment. Lung segmentation results are summarized for both experiments in Table 3. Lung segmentation results are summarized in terms of pixel classification accuracy, Intersection over Union (IoU), and dice coefficient.

5.2. Traditional Transfer Learning Approach Results

In this section, we present the results obtained using our baseline and enhanced baseline methods. Our first experiment was a 10-fold cross validation using all the datasets except BIMCV COVID-19. In this process, we broke up the total dataset into 10 “folds”. We trained a network using 9 of the folds and tested the performance on the remaining fold. This was done 10 times for a total of 10 networks. For each fold, we trained and tuned our hyperparameters solely based on the images from the training fold. We made sure to exclude the testing fold in any manner to conduct a rigorous study. Note that we utilized the same set of cases in each fold for different systems tested. We resized all images to match the input size of the network architecture for all the methods. As mentioned earlier, we computed the performance metrics using formulae presented in Table 4, in addition to AUC. Table 5 and Table 6 present the results obtained using various networks without and with preprocessing (including lung segmentation), respectively. Metrics are presented along with 95% Confidence Interval (CI) which were determined based on the performance across the 10 folds.
We studied the performance of our proposed architectures in terms of true positives, false negatives, and sensitivity for the newly established and publicly available BIMCV COVID-19 dataset [50]. We limited our analysis for this dataset to the metrics stated because no non-COVID cases were present in the original database. The BIMCV dataset was solely utilized in this experiment for testing. Note that we utilized the same set of cases for training as done in previous experiments in terms of 10-fold cross validation. Table 7 and Table 8 present the performance of the traditional transfer learning approaches for the BIMCV COVID-19 dataset without and with preprocessing, respectively.

5.3. Proposed CAD System Using Transfer-To-Transfer Learning Approach

In this section, we present the results obtained using our proposed transfer-to-transfer learning approach for the same set of networks. Similar to traditional transfer learning experiments, we studied the performance both in terms of 10-fold cross validation and hold-out validation. We utilized the same set of images for training and testing as used in Section 5.2. In this scenario, we determined the value of N = 28 using Equation (2). Each mini-set contained all the training images belonging to COVID-19 class (~215) and the same quantity of non-COVID-19 chest radiographs, except for the last mini-set. We trained each balanced mini training set for one epoch with the same set of hyperparameters across all mini-sets in a given fold. Table 9 and Table 10 present the results obtained using various networks using the recommended approach after the application of the proposed lung segmentation algorithm. Figure 10 presents the class activation mapping results obtained for each of the networks for a given test case which had been identified as COVID-19 by the radiologists.

5.4. Architecture Comparison

In this section, we compared the three architectures proposed in this research by conducting another hold-out validation experiment using all the images available. Table 11 presents the dataset distribution utilized for this experiment. In the previous experiments, the test dataset was dominated by either of the two classes. This experiment was conducted such that we had even distribution of test images belonging to each category (Non-COVID-19: 2139, COVID-19: 2139). Note that our training dataset still suffered from class imbalance (Non-COVID-19: 4668, COVID-19: 365). We utilized the same set of hyperparameters for all the architectures. Results obtained using ‘ResNet50’ using the three different training methodologies are presented in Table 12.

6. Discussion

Lung segmentation results presented in Table 3 indicate that our proposed U-Net architecture performed well across two test datasets demonstrating its efficacy, with IoU values of 0.95 and 0.96. Adding these lung masks to the preprocessing used by the enhanced baseline system and recommended system helped improve performance by excluding irrelevant spatial information from the features generated by the CNNs. Classification results presented in Table 5, Table 6, Table 7 and Table 8 clearly indicate that preprocessing which includes lung segmentation significantly improves the system performance in terms of sensitivity and precision. Sensitivity improvements were in the range of 11–22% for all the networks and precision improvement was by at least 25% across all networks using 10-fold cross validation study. It must also be noted that chest radiographs used in this research have different modalities such as Posterior Anterior (PA), Anterior Posterior (AP) and AP-Supine. These modalities indicate that chest radiographs are taken at different distances from the patient. Therefore, segmenting the lung region helps the classification architectures overcome any bias, aiding in improving the performance further.
Table 9, Table 10 and Table 12 clearly indicate that the recommended system using transfer-to-transfer learning mechanism provided the best performance across all methods studied in this paper for all performance metrics. There is a significant boost in terms of sensitivity (about 10%) for all the networks. This type of training procedure helped the algorithm perform significantly better, addressing the class imbalance as weights of the network were adjusted based on each mini training set without any data augmentation. Starting from the recommended system, we took away the transfer-to-transfer learning in the enhanced baseline. We further took away the preprocessing and lung segmentation in the baseline system. Thus, we were able to show the benefits of these algorithm components by ablation. We have elected to preserve the standard CNN architectures and not perform any layer ablation in order to preserve their original integrity. We believe that the main emphasis of this paper is on the training mechanisms to combat class imbalance and help in the detection of COVID-19 on chest radiographs.
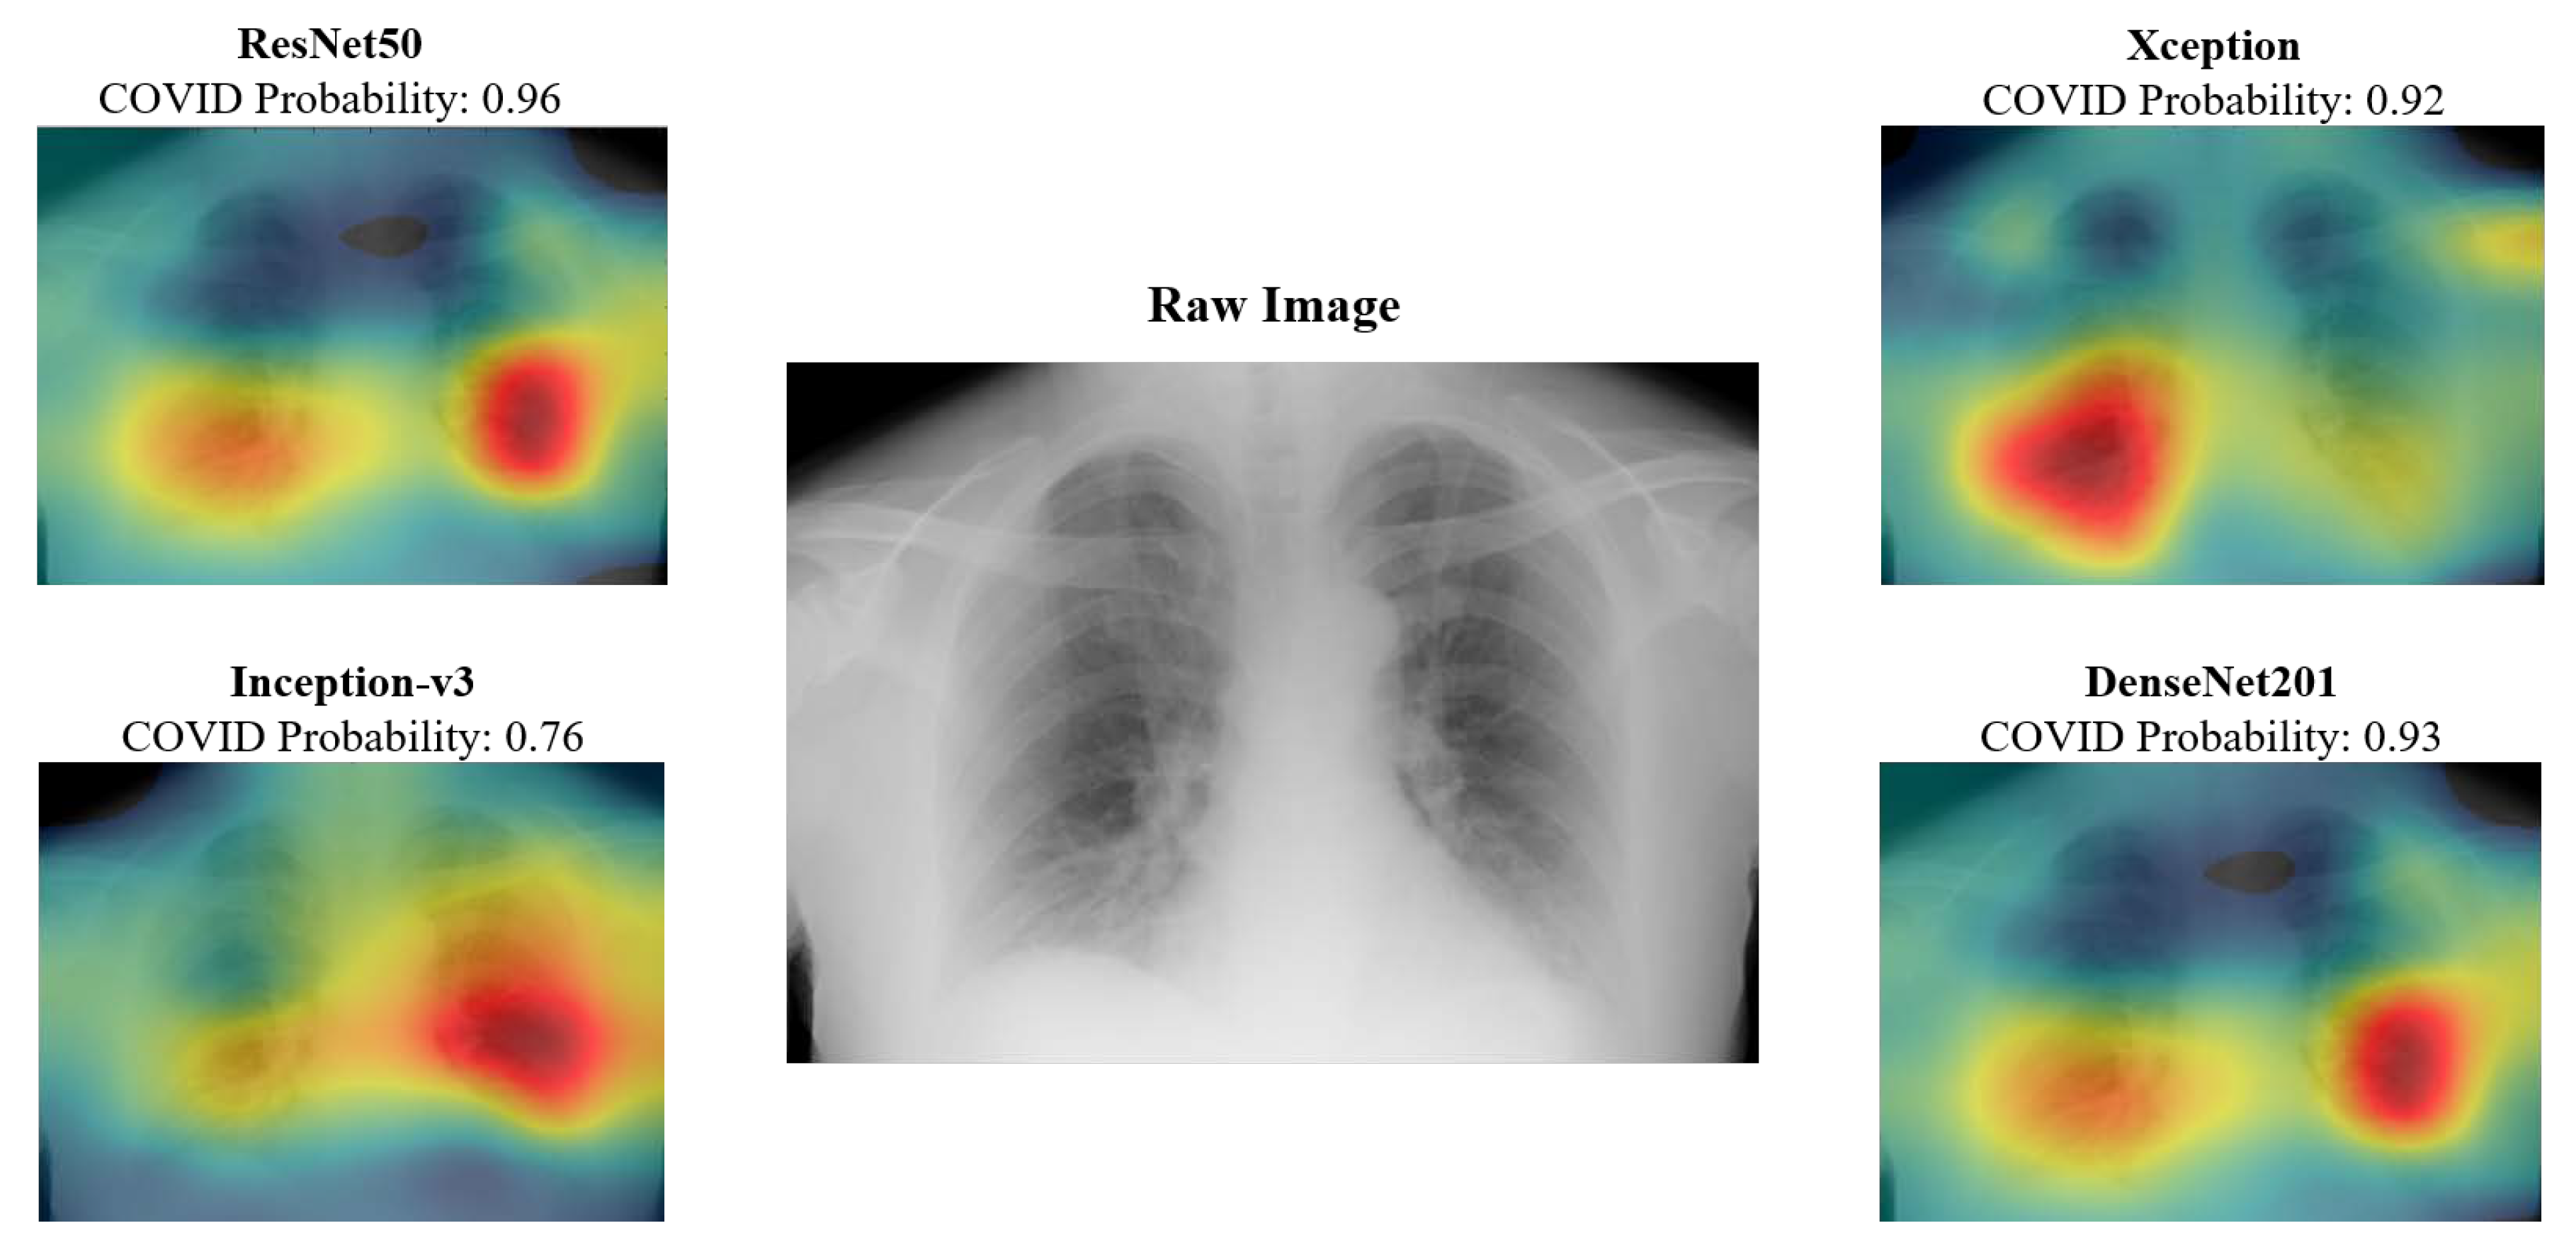
The class activation maps provide radiologists with insight into the anatomical structures that are keyed in on the various networks. For instance, the maps presented in Figure 10 indicate that right bottom lung region of this patient contributed the most for Xception network output, whereas it is the left bottom lung region for Inception-v3. These types of visualizations could provide insights to radiologists and would help by providing a valuable second opinion. CAD results could be provided for every model and the radiologists could select or reject CAD results based on the whether they believed the class activation map was highlighting the medically relevant areas of the lung for a given patient.
Table 7, Table 8 and Table 10 present the results for the BIMCV COVID-19 dataset. The performance for this dataset was studied in terms of true positives, false negatives, and sensitivity, because all the patients present in the dataset were diagnosed with COVID-19. Results indicate that our recommended system significantly outperforms the other approaches. Sensitivity of 0.94 was achieved using our recommended approach for both the hold-out validation experiments. These hold-out validation experiments contained 2265 and 2139 COVID-19 chest radiographs for testing, respectively. Note that these results were achieved using a limited set of COVID-19 training images (239 and 365), which clearly demonstrates the efficacy of the proposed approach. Table 12 compares the performance of ‘ResNet50’ using the different training methodologies when testing on equal numbers of images belonging to the COVID-19 and non-COVID-19 categories. Note that this experiment was still conducted with imbalanced training dataset. Results clearly indicate that our recommended system performed the best in terms of all performance metrics studied in this paper. We could not run the experiments for the newly discovered COVID-19 negative BIMCV dataset, as their publication is yet to be available. We would like to gain more insights in terms of its marking before utilizing those cases for training or testing to avoid any kind of bias. We did not run the experiments to avoid any type of bias present in the COVID-19 negative dataset; its publication would help us understand the data. Studying the algorithm’s performance utilizing cases that are marked as COVID-19 positive and negative from the set of hospitals would provide better insights about the performance.
Figure 11 presents the roadmap of our integrated CAD system in chest radiographs for disparate applications. We intend to integrate the proposed COVID-19 detection capability into our existing CAD systems for various lung diseases in chest radiographs. Our CAD system for the detection of tuberculosis achieved an overall accuracy of 91% for the Shenzhen dataset [18]. In [10], our CAD system achieved an overall accuracy of 98.9% and 97.9% for pneumonia detection and diagnosis, respectively, using the pneumonia dataset in Table 1. The proposed technology could be even more important diagnostically for distinguishing normal flu cases with pneumonia from COVID-19 for upcoming flu seasons.

7. Conclusions

CAD algorithms for COVID-19 detection using chest radiographs could be a valuable new tool in the fight against this disease. Such algorithms could potentially provide fast and valuable information regarding a patient’s diagnosis. In this research, we have proposed a novel approach for CAD of COVID-19 in chest radiographs that is robust to class imbalance in training data. We believe such robustness is important because class imbalance is a frequent problem in medical image analysis and classification. This is particularly true for contemporary COVID-19 detection.
Table 9, Table 10 and Table 12 indicate that our recommended system using transfer-to-transfer learning methodology outperforms the traditional approaches significantly. In fact, the minimum performance across all networks and testing conditions in terms of sensitivity is 88%, despite class imbalance. Our results also showed that select preprocessing and lung segmentation also helped to provide a significant boost in performance in this application. Class activation maps can be readily generated along with the CAD output, to provide radiologists with insight into the spatial areas that are most important in the CAD classification. This could be important for COVID-19 detection, where radiologists may be looking for specific abnormalities appearing in some areas of the lungs.
We believe that our transfer-to-transfer learning approach helps in maximizing inter-class variance, as every minority class image is trained with majority class batches. We acknowledge that our proposed transfer-to-transfer learning approach is similar to duplicating minority class images to an equivalent amount of majority class images. However, our proposed approach is efficient in terms of memory and each of the majority class image is seen only once by the network, thereby reducing the training time significantly. Furthermore, this CAD system can be easily “transfer-learned” further with new labeled data as it becomes available. This type of approach could help us update the network from the currently developed stage with access to more chest radiographs instead of a traditional approach where we would have to re-train from scratch.
We have presented these results for publicly available datasets thereby setting a benchmark for future research efforts. At first, we studied the performance of traditional transfer learning-based approaches utilizing ResNet50, DenseNet201, Inception-v3, and Xception networks. These results were significantly improved by the application of LCE and lung segmentation for traditional transfer learning approaches.

Author Contributions

Conceptualization, R.C.H. and B.N.N.; software, B.N.N., V.K. and R.C.H.; data curation, V.K., B.N.N.; writing—review and editing, V.S.P.D., C.K., B.N.N., R.C.H. and V.K.; supervision, R.C.H. and B.N.N. All authors have read and agreed to the published version of the manuscript.

Funding

This research received no external funding.

Conflicts of Interest

The authors declare no conflict of interest.

Abbreviations

COVID-19Coronavirus disease 2019
CADComputer-Aided Detection
RT-PCRReverse-Transcription-Polymerase Chain Reaction
CTComputed Tomography
CNNConvolutional Neural Network
AUCArea under the Receiver Operating Characteristic curve
LCELocal Contrast Enhancement
GANGenerative Adversarial Network
JRSTJapanese Radiological Scientific Technology
BIMCVValencian Region Medical ImageBank
CIConfidence Interval
TPTrue Positive
TNTrue Negative
FPFalse Positive
FNFalse Negative
PPrecision
RRecall
IoUIntersection over Union
PAPosterior Anterior
APAnterior Posterior

References

  1. World Health Organization (WHO). Coronavirus Disease (COVID-2019) Situation Reports. Available online: https://www.who.int/emergencies/diseases/novel-coronavirus-2019/events-as-they-happen (accessed on 15 May 2020).
  2. World Health Organization (WHO). Coronavirus Disease Outbreak Situation. Available online: https://www.who.int/emergencies/diseases/novel-coronavirus-2019 (accessed on 15 May 2020).
  3. Rajaraman, S.; Antani, S. Training deep learning algorithms with weakly labeled pneumonia chest X-ray data for COVID-19 detection. medRxiv 2020. [Google Scholar] [CrossRef]
  4. Rubin, G.D.; Ryerson, C.J.; Haramati, L.B.; Sverzellati, N.; Kanne, J.P.; Raoof, S.; Schluger, N.W.; Volpi, A.; Yim, J.-J.; Martin, I.B.K.; et al. The Role of Chest Imaging in Patient Management during the COVID-19 Pandemic: A Multinational Consensus Statement from the Fleischner Society. Chest 2020, 296, 172–180. [Google Scholar] [CrossRef] [Green Version]
  5. Hardie, R.C.; Rogers, S.K.; Wilson, T.; Rogers, A. Performance analysis of a new computer aided detection system for identifying lung nodules on chest radiographs. Med. Image Anal. 2008, 12, 240–258. [Google Scholar] [CrossRef] [PubMed]
  6. Narayanan, B.N.; Hardie, R.C.; Kebede, T.M.; Sprague, M.J. Optimized feature selection-based clustering approach for computer-aided detection of lung nodules in different modalities. Pattern Anal. Appl. 2019, 22, 559–571. [Google Scholar] [CrossRef]
  7. Okumura, T.; Miwa, T.; Kako, J.I.; Yamamoto, S.; Matsumoto, R.; Tateno, Y.; Iinuma, T.; Matsumoto, T. Automatic detection of lung cancers in chest CT images by variable N-Quoit filter. In Proceedings of the Fourteenth International Conference on Pattern Recognition (Cat. No. 98EX170), Brisbane, Queensland, Australia, 20 August 1998; Volume 2, pp. 1671–1673. [Google Scholar]
  8. Narayanan, B.N.; Hardie, R.C.; Kebede, T.M. Analysis of various classification techniques for computer aided detection system of pulmonary nodules in CT. In Proceedings of the 2016 IEEE National Aerospace and Electronics Conference (NAECON) and Ohio Innovation Summit (OIS), Dayton, OH, USA, 25–29 July 2016; pp. 88–93. [Google Scholar]
  9. Narayanan, B.N.; Hardie, R.C. A Computationally Efficient U-Net Architecture for Lung Segmentation in Chest Radiographs. In Proceedings of the 2019 IEEE National Aerospace and Electronics Conference (NAECON), Dayton, OH, USA, 15–19 July 2019; pp. 279–284. [Google Scholar]
  10. Narayanan, B.N.; Davuluru, V.S.P.; Hardie, R.C. Two-stage deep learning architecture for pneumonia detection and its diagnosis in chest radiographs. In Medical Imaging 2020: Imaging Informatics for Healthcare, Research, and Applications; International Society for Optics and Photonics: Houston, TX, USA, 2020; Volume 11318, p. 113180G. [Google Scholar]
  11. Oliveira, L.L.G.; Silva, S.A.E.; Ribeiro, L.H.V.; De Oliveira, R.M.; Coelho, C.J.; Andrade, A.L.S.S. Computer-aided diagnosis in chest radiography for detection of childhood pneumonia. Int. J. Med. Inform. 2008, 77, 555–564. [Google Scholar] [CrossRef]
  12. Van Ginneken, B.; Romeny, B.M.T.H.; Viergever, M.A. Computer-aided diagnosis in chest radiography: A survey. IEEE Trans. Med. Imaging 2001, 20, 1228–1241. [Google Scholar] [CrossRef] [Green Version]
  13. Giger, M.; MacMahon, H. Image processing and computer-aided diagnosis. Radiol. Clin. N. Am. 1996, 34, 565–596. [Google Scholar]
  14. Monnier-Cholley, L.; MacMahon, H.; Katsuragawa, S.; Morishita, J.; Ishida, T.; Doi, K. Computer-aided diagnosis for detection of interstitial opacities on chest radiographs. Am. J. Roentgenol. 1998, 171, 1651–1656. [Google Scholar] [CrossRef] [Green Version]
  15. Rajpurkar, P.; Irvin, J.; Zhu, K.; Yang, B.; Mehta, H.; Duan, T.; Ding, D.; Bagul, A.; Langlotz, C.; Shpanskaya, K.; et al. Chexnet: Radiologist-level pneumonia detection on chest X-rays with deep learning. arXiv 2017, arXiv:1711.05225. [Google Scholar]
  16. Guan, Q.; Huang, Y.; Zhong, Z.; Zheng, Z.; Zheng, L.; Yang, Y. Diagnose like a radiologist: Attention guided convolutional neural network for thorax disease classification. arXiv 2018, arXiv:1801.09927. [Google Scholar]
  17. Rajaraman, S.; Candemir, S.; Kim, I.; Thoma, G.; Antani, S. Visualization and Interpretation of Convolutional Neural Network Predictions in Detecting Pneumonia in Pediatric Chest Radiographs. Appl. Sci. 2018, 8, 1715. [Google Scholar] [CrossRef] [PubMed] [Green Version]
  18. Narayanan, B.N.; De Silva, M.S.; Hardie, R.C.; Kueterman, N.K.; Ali, R. Understanding Deep Neural Network Predictions for Medical Imaging Applications. arXiv 2019, arXiv:1912.09621. [Google Scholar]
  19. Javaid, M.; Javid, M.; Rehman, M.Z.U.; Shah, S.I.A. A novel approach to CAD system for the detection of lung nodules in CT images. Comput. Methods Programs Biomed. 2016, 135, 125–139. [Google Scholar] [CrossRef] [PubMed]
  20. Van Ginneken, B.; Armato, S.G.; De Hoop, B.; Vorst, S.V.A.-V.D.; Duindam, T.; Niemeijer, M.; Murphy, K.; Schilham, A.; Retico, A.; Fantacci, M.E.; et al. Comparing and combining algorithms for computer-aided detection of pulmonary nodules in computed tomography scans: The ANODE09 study. Med. Image Anal. 2010, 14, 707–722. [Google Scholar] [CrossRef] [Green Version]
  21. Armato, S.G.; Giger, M.L.; Moran, C.J.; Blackburn, J.T.; Doi, K.; MacMahon, H. Computerized Detection of Pulmonary Nodules on CT Scans. Radiographics 1999, 19, 1303–1311. [Google Scholar] [CrossRef] [PubMed]
  22. Armato, S.G.; McLennan, G.; McNitt-Gray, M.F.; Meyer, C.R.; Yankelevitz, D.; Aberle, D.R.; Henschke, C.I.; Hoffman, E.A.; Kazerooni, E.A.; MacMahon, H.; et al. Lung Image Database Consortium: Developing a Resource for the Medical Imaging Research Community. Radiology 2004, 232, 739–748. [Google Scholar] [CrossRef]
  23. Wiemker, R.; Rogalla, P.; Opfer, R.; Ekin, A.; Romano, V.; Bülow, T. Comparative performance analysis for computer aided lung nodule detection and segmentation on ultra-low-dose vs. standard-dose CT. In Medical Imaging 2006: Image Perception, Observer Performance, and Technology Assessment; International Society for Optics and Photonics: San Diego, CA, USA, 2006; p. 614605. [Google Scholar]
  24. Das, M.; Mühlenbruch, G.; Mahnken, A.H.; Flohr, T.G.; Gündel, L.; Stanzel, S.; Wildberger, J.E. Small Pulmonary Nodules: Effect of Two Computer-aided Detection Systems on Radiologist Performance1. Radiology 2006, 241, 564–571. [Google Scholar] [CrossRef]
  25. Yuan, R.; Vos, P.M.; Cooperberg, P.L. Computer-Aided Detection in Screening CT for Pulmonary Nodules. Am. J. Roentgenol. 2006, 186, 1280–1287. [Google Scholar] [CrossRef] [Green Version]
  26. Gurung, J.; Maataoui, A.; Khan, M.; Wetter, A.; Harth, M.; Jacobi, V.; Vogl, T.J. Automated detection of lung nodules in multidetector CT: Influence of different reconstruction protocols on performance of a software prototype. In RöFo-Fortschritte auf dem Gebiet der Röntgenstrahlen und der bildgebenden Verfahren; Georg Thieme Verlag KG Stuttgart: New York, NY, USA, 2006; Volume 178, pp. 71–77. [Google Scholar]
  27. Opfer, R.; Wiemker, R. Performance Analysis for Computer-Aided Lung Nodule Detection on LIDC Data. In Medical Imaging 2007: Image Perception, Observer Performance, and Technology Assessment; International Society for Optics and Photonics: San Diego, CA, USA, 2007; p. 65151C. [Google Scholar]
  28. Sahiner, B.; Hadjiiski, L.M.; Chan, H.P.; Shi, J.; Cascade, P.N.; Kazerooni, E.A.; Song, T. Effect of CAD on radiologists’ detection of lung nodules on thoracic CT scans: Observer performance study. In Medical Imaging 2007: Image Perception, Observer Performance, and Technology Assessment; International Society for Optics and Photonics: San Diego, CA, USA, 2007; p. 65151D. [Google Scholar]
  29. Buhmann, S.; Herzog, P.; Liang, J.; Wolf, M.; Salganicoff, M.; Kirchhoff, C.; Reiser, M.; Becker, C.H. Clinical Evaluation of a Computer-Aided Diagnosis (CAD) Prototype for the Detection of Pulmonary Embolism. Acad. Radiol. 2007, 14, 651–658. [Google Scholar] [CrossRef]
  30. Schilham, A.M.; Van Ginneken, B.; Loog, M. A computer-aided diagnosis system for detection of lung nodules in chest radiographs with an evaluation on a public database. Med. Image Anal. 2006, 10, 247–258. [Google Scholar] [CrossRef]
  31. He, K.; Zhang, X.; Ren, S.; Sun, J. Deep Residual Learning for Image Recognition. In Proceedings of the IEEE Conference on Computer Vision and Pattern Recognition (CVPR), Las Vegas, NV, USA, 26 June–1 July 2016; pp. 770–778. [Google Scholar]
  32. Chollet, F. Xception: Deep Learning with Depthwise Separable Convolutions. In Proceedings of the IEEE Conference on Computer Vision and Pattern Recognition (CVPR), Honolulu, HI, USA, 21–26 July 2017; pp. 1251–1258. [Google Scholar]
  33. Szegedy, C.; Vanhoucke, V.; Ioffe, S.; Shlens, J.; Wojna, Z. Rethinking the inception architecture for computer vision. In Proceedings of the IEEE Conference on Computer Vision and Pattern Recognition (CVPR), Las Vegas, NV, USA, 26 June–1 July 2016; pp. 2818–2826. [Google Scholar]
  34. Szegedy, C.; Ioffe, S.; Vanhoucke, V.; Alemi, A. Inception-v4, inception-resnet and the impact of residual connections on learning. arXiv 2016, arXiv:1602.07261. [Google Scholar]
  35. Huang, G.; Liu, Z.; Van Der Maaten, L.; Weinberger, K.Q. Densely connected convolutional networks. In Proceedings of the IEEE Conference on Computer Vision and Pattern Recognition, Honolulu, HI, USA, 21–26 July 2017; pp. 4700–4708. [Google Scholar]
  36. Szegedy, C.; Liu, W.; Jia, Y.; Sermanet, P.; Reed, S.; Anguelov, D.; Erhan, D.; Vanhoucke, V.; Rabinovich, A. Going deeper with convolutions. In Proceedings of the IEEE Computer Society Conference on Computer Vision and Pattern Recognition, Boston, MA, USA, 7–12 June 2015; pp. 1–9. [Google Scholar]
  37. Lv, X.; Zhang, X. Generating Chinese Classical Landscape Paintings Based on Cycle-Consistent Adversarial Networks. In Proceedings of the 2019 6th International Conference on Systems and Informatics (ICSAI), Shanghai, China, 2–4 November 2019; pp. 1265–1269. [Google Scholar]
  38. Ben-Cohen, A.; Klang, E.; Amitai, M.M.; Goldberger, J.; Greenspan, H. Anatomical data augmentation for CNN Based Pixel-Wise Classification. In Proceedings of the 2018 IEEE 15th International Symposium on Biomedical Imaging (ISBI 2018), Washington, DC, USA, 4–7 April 2018; pp. 1096–1099. [Google Scholar]
  39. Goodfellow, I.J.; Pouget-Abadie, J.; Mirza, M.; Xu, B.; Warde-Farley, D.; Ozair, S.; Courville, A.C.; Bengio, Y. Generative Adversarial Nets. 2014. Available online: https://arxiv.org/abs/1406.2661 (accessed on 13 November 2020).
  40. Tartaglione, E.; Barbano, C.A.; Berzovini, C.; Calandri, M.; Grangetto, M. Unveiling COVID-19 from CHEST X-Ray with Deep Learning: A Hurdles Race with Small Data. Int. J. Environ. Res. Public Health 2020, 17, 6933. [Google Scholar] [CrossRef] [PubMed]
  41. Wang, L.; Wong, A. COVID-Net: A Tailored Deep Convolutional Neural Network Design for Detection of COVID-19 Cases from Chest X-Ray Images. arXiv 2020, arXiv:2003.09871. [Google Scholar] [CrossRef]
  42. Shiraishi, J.; Katsuragawa, S.; Ikezoe, J.; Matsumoto, T.; Kobayashi, T.; Komatsu, K.-I.; Matsui, M.; Fujita, H.; Kodera, Y.; Doi, K. Development of a Digital Image Database for Chest Radiographs with and without a Lung Nodule. Am. J. Roentgenol. 2000, 174, 71–74. [Google Scholar] [CrossRef] [PubMed]
  43. Van Ginneken, B.; Stegmann, M.B.; Loog, M. Segmentation of anatomical structures in chest radiographs using supervised methods: A comparative study on a public database. Med. Image Anal. 2006, 10, 19–40. [Google Scholar] [CrossRef] [Green Version]
  44. Jaeger, S.; Karargyris, A.; Candemir, S.; Folio, L.; Siegelman, J.; Callaghan, F.; Xue, Z.; Palaniappan, K.; Singh, R.K.; Antani, S.; et al. Automatic Tuberculosis Screening Using Chest Radiographs. IEEE Trans. Med. Imaging 2014, 33, 233–245. [Google Scholar] [CrossRef]
  45. Candemir, S.; Jaeger, S.; Palaniappan, K.; Musco, J.P.; Singh, R.K.; Xue, Z.; Karargyris, A.; Antani, S.; Thoma, G.; McDonald, C.J. Lung Segmentation in Chest Radiographs Using Anatomical Atlases with Nonrigid Registration. IEEE Trans. Med. Imaging 2014, 33, 577–590. [Google Scholar] [CrossRef]
  46. Jaeger, S.; Candemir, S.; Antani, S.; Wáng, Y.-X.J.; Lu, P.-X.; Thoma, G. Two public chest X-ray datasets for computer-aided screening of pulmonary diseases. Quant. Imaging Med. Surg. 2014, 4, 475–477. [Google Scholar]
  47. Tuberculosis Chest X-ray Image Datasets. Available online: https://lhncbc.nlm.nih.gov/publication/pub9931 (accessed on 16 May 2020).
  48. Kermany, D.S.; Goldbaum, M.; Cai, W.; Valentim, C.C.; Liang, H.; Baxter, S.L.; McKeown, A.; Yang, G.; Wu, X.; Yan, F.; et al. Identifying Medical Diagnoses and Treatable Diseases by Image-Based Deep Learning. Cell 2018, 172, 1122–1131. [Google Scholar] [CrossRef]
  49. Cohen, J.P.; Morrison, P.; Dao, L.; Roth, K.; Duong, T.Q.; Ghassemi, M. COVID-19 Image Data Collection: Prospective Predictions Are the Future. 2020. Available online: https://arxiv.org/abs/2006.11988 (accessed on 13 November 2020).
  50. De la Iglesia Vayá, M.; Saborit, J.M.; Montell, J.A.; Pertusa, A.; Bustos, A.; Cazorla, M.; Galant, J.; Barber, X.; Orozco-Beltrán, D.; García-García, F.; et al. BIMCV COVID-19+: A large annotated dataset of RX and CT images from COVID-19 patients. arXiv 2020, arXiv:2006.01174. [Google Scholar]
  51. Deng, J.; Dong, W.; Socher, R.; Li, L.J.; Li, K.; Li, F.F. Imagenet: A Large-Scale Hierarchical Image Database. In Proceedings of the 2009 IEEE Conference on Computer Vision and Pattern Recognition, Miami, FL, USA, 20–25 June 2009; pp. 248–255. [Google Scholar]
Figure 1. An example from the JRST dataset with a radiologist nodule marking.
Ai 01 00032 g001
Figure 2. Chest radiograph examples from the Shenzhen dataset marked by radiologists: (a) normal; (b) tuberculosis.
Ai 01 00032 g002
Figure 3. Chest radiograph examples from the Montgomery dataset marked by radiologists: (a) normal; (b) tuberculosis.
Ai 01 00032 g003
Figure 4. Chest radiograph examples from the Pneumonia dataset marked by radiologists: (a) normal, (b) bacterial pneumonia, (c) viral pneumonia.
Ai 01 00032 g004
Figure 5. Chest radiograph example from the University of Montreal COVID-19 dataset marked by radiologists.
Ai 01 00032 g005
Figure 6. Chest radiograph example from the BIMCV COVID-19 dataset marked by radiologists.
Ai 01 00032 g006
Figure 7. Top-level block diagram of enhanced baseline and recommended Computer-Aided Detection (CAD) systems for COVID-19 in chest radiographs.
Ai 01 00032 g007
Figure 8. An example from the JRST dataset: (a) raw image, (b) preprocessed image.
Ai 01 00032 g008
Figure 9. Recommended system: transfer-to-transfer learning approach. Each mini training set contained all the images of minority class and a randomly picked equal quantity of majority class images. Note that there was no repetition of majority class images across all mini training sets.
Ai 01 00032 g009
Figure 10. Class activation mapping results for a given test image using the proposed transfer-to-transfer learning approach for each network.
Ai 01 00032 g010
Figure 11. Proposed integrated CAD system for chest radiographs.
Ai 01 00032 g011
Table 1. Overall dataset distribution.
DatasetNumber of ImagesUsage
Pneumonia585610-fold cross validation/Hold-out
Shenzhen—Tuberculosis56610-fold cross validation/Hold-out
Montgomery—Tuberculosis13810-fold cross validation/Hold-out
Japanese Radiological Scientific Technology (JRST)—Lung cancer24710-fold cross validation/Hold-out
University of Montreal—COVID-1923910-fold cross validation/Hold-out
Valencian Region Medical ImageBank (BIMCV) COVID—192265Sensitivity Analysis/Hold-out
Table 2. Pneumonia dataset distribution.
ClassNumber of Images
Normal1583
Bacterial Pneumonia2780
Viral Pneumonia1493
Table 3. Lung segmentation: performance analysis.
ExperimentShenzhenMontgomeryJRSTPixel Classification Accuracy (%)IoUDice Coefficient
# 1TestValidationTrain98.000.960.95
# 2TrainValidationTest98.200.950.95
Table 4. Performance metrics.
Performance MetricsFormula 1
Accuracy T P + T N T P + T N + F P + F N
Sensitivity and Recall T P T P + F N
Specificity T N T N + F P
Precision T P T P + F P
F1 Score 2 P R P + R
1 TP: Number of True Positives, FP: Number of False Positives, TN: Number of True Negatives, FN: Number of False Negatives, P: Precision, R: Recall.
Table 5. 10-fold cross validation performance using our baseline method.
NetworkAccuracy (%)SensitivitySpecificityPrecisionF1 ScoreAUC
ResNet5097.45 ± 0.770.72 ± 0.170.98 ± 0.010.69 ± 0.140.65 ± 0.100.98 ± 0.00
Inception-v396.01 ± 1.540.66 ± 0.220.92 ± 0.120.66 ± 0.260.66 ± 0.130.97 ± 0.01
DenseNet20197.01 ± 0.540.71 ± 0.180.92 ± 0.110.69 ± 0.140.70 ± 0.100.97 ± 0.01
Xception97.16 ± 0.650.72 ± 0.130.93 ± 0.080.70 ± 0.120.71 ± 0.100.97 ± 0.02
Table 6. 10-fold cross validation performance using our enhanced baseline method that included preprocessing.
NetworkAccuracy (%)SensitivitySpecificityPrecisionF1 ScoreAUC
ResNet5098.85 ± 0.650.82 ± 0.150.99 ± 0.000.88 ± 0.110.82 ± 0.110.99 ± 0.00
Inception-v398.12 ± 2.000.81 ± 0.100.99 ± 0.120.88 ± 0.130.84 ± 0.080.99 ± 0.02
DenseNet20198.01 ± 1.540.81 ± 0.120.99 ± 0.120.87 ± 0.100.83 ± 0.130.99 ± 0.01
Xception98.16 ± 0.650.80 ± 0.140.99 ± 0.080.88 ± 0.100.81 ± 0.100.99 ± 0.02
Table 7. Test Performance using baseline method on the BIMCV dataset.
NetworkTrue PositivesFalse NegativesSensitivity
ResNet501540 ± 181725 ± 1810.68 ± 0.08
Inception-v31523 ± 172742 ± 1720.67 ± 0.08
DenseNet2011555 ± 125710 ± 1250.69 ± 0.06
Xception1680 ± 112585 ± 1120.74 ± 0.05
Table 8. Test Performance using enhanced baseline method that included preprocessing on the BIMCV dataset.
NetworkTrue PositivesFalse NegativesSensitivity
ResNet501621 ± 163644 ± 1630.72 ± 0.07
Inception-v31595 ± 133670 ± 1330.70 ± 0.06
DenseNet2011761 ± 120504 ± 1200.78 ± 0.05
Xception1801 ± 119464 ± 1190.80 ± 0.05
Table 9. 10-fold cross validation performance using our recommended system that included preprocessing and transfer-to-transfer learning.
NetworkAccuracy (%)SensitivitySpecificityPrecisionF1 ScoreAUC
ResNet5099.34 ± 0.350.91 ± 0.100.99 ± 0.000.90 ± 0.050.90 ± 0.110.99 ± 0.00
Inception-v399.34 ± 0.190.91 ± 0.040.99 ± 0.000.91 ± 0.060.91 ± 0.070.99 ± 0.00
DenseNet20199.31 ± 0.300.90 ± 0.050.99 ± 0.010.91 ± 0.030.91 ± 0.090.99 ± 0.01
Xception99.19 ± 0.210.91 ± 0.050.99 ± 0.000.90 ± 0.050.91 ± 0.070.99 ± 0.01
Table 10. Test Performance using our recommended systems on BIMCV dataset that employed preprocessing and transfer-to-transfer learning.
NetworkTrue PositivesFalse NegativesSensitivity
ResNet502001 ± 101264 ± 1010.88 ± 0.04
Inception-v32015 ± 97250 ± 970.89 ± 0.04
DenseNet2012108 ± 95157 ± 950.93 ± 0.04
Xception2121 ± 92144 ± 920.94 ± 0.04
Table 11. Hold-out validation dataset.
Dataset# Train Images# Test Images
Pneumonia40021854
Shenzhen—Tuberculosis396170
Montgomery—Tuberculosis9741
JRST—Lung cancer17374
University of Montreal—COVID-19100139
BIMCV—COVID-192652000
Table 12. Hold-out validation results using ResNet50.
MethodologyAccuracy (%)SensitivitySpecificityPrecisionF1 Score
Baseline81.880.820.780.760.79
Enhanced Baseline89.060.900.840.850.87
Recommended95.500.940.930.930.93
Publisher’s Note: MDPI stays neutral with regard to jurisdictional claims in published maps and institutional affiliations.

