
Who Was Wrong? An Object Detection Based Responsibility Assessment System for Crossroad Vehicle Collisions †


Department of Computer Science, Graduate School of Engineering, Nagoya Institute of Technology, Nagoya City 466-8555, Aichi Prefecture, Japan
*
Author to whom correspondence should be addressed.
†
This paper is an extended version of our paper published in Yawovi HA, Ozono T, Shintani T (2020) Crossroad accident responsibility prediction based on a multi-agent system. In Proceedings of the 2020 International Conference on Computational Science and Computational Intelligence (CSCI), pp. 579–584. https://0-doi-org.brum.beds.ac.uk/10.1109/CSCI51800.2020.00103 .
‡
Current address: Nagoya Institute of Technology, Gokisocho, Showa Ward, Nagoya 466-8555, Aichi, Japan.
AI 2022, 3(4), 844-862; https://0-doi-org.brum.beds.ac.uk/10.3390/ai3040051
Submission received: 28 July 2022
/
Revised: 8 September 2022
/
Accepted: 21 September 2022
/
Published: 9 October 2022
(This article belongs to the Section AI Systems: Theory and Applications)
Abstract
:Car crashes, known also as vehicle collisions, are recurrent events that occur every day. As long as vehicles exist, vehicle collisions will, unfortunately, continue to occur. When a car crash occurs, it is important to investigate and determine the actors’ responsibilities. The police in charge of that task, as well as claims adjusters, usually process manually by going to the crash spot, collecting data on the field, drafting the crash, and assessing responsibilities based on road rules. This later task of assessing responsibilities usually takes time and requires enough knowledge of road rules. With the aim to support the police and claims adjusters and simplify the process of responsibility determination, we built a system that can automatically assess actors’ responsibilities within a crossroad crash. The system is mainly based on image detection and uses a rule-based knowledge system to assess responsibilities within driving recorders’ videos. It uses the crash video recorded by one of the involved vehicles’ driving recorders as the input data source and outputs the evaluation of each actor’s responsibility within the crash. The rule-based knowledge system was implemented to make the reasoning about responsibility assessment clear and allow users to easily understand the reasons for the results. The system consists of three modules: (a) a crash time detection module, (b) a traffic sign detection module, and (c) a responsibility assessment module. To detect a crash within a video, we discovered that the simple application of existing vehicle detection models would result in wrong detections with many false positives. To solve the issue, we made our proposed model take into account only the collided vehicle, its shape, and its position within the video. Moreover, with the biggest challenge being finding data to train the system’s detection models, we built our own dataset from scratch with more than 1500 images of head-on car crashes within the context of crossroad accidents taken by the driving recorder of one of the vehicles involved in the crash. The experiment’s results show how the system performs in (1) detecting the crash time, (2) detecting traffic signs, and (3) assessing each party’s responsibility. The system performs well when light conditions and the visibility of collided objects are good and traffic lights’ view distances are close.
1. Introduction
Car crashes, also called vehicle accidents, road traffic injuries, or road accidents, are serious problems that all countries around the world are facing and dealing with day by day.
The World Health Organization (WHO) [1] has recently reported that traffic accidents are now the leading cause of death in children and young adults aged 5 to 29 years, signaling the need for a change in the current child health agenda, which has largely neglected road safety. It is the eighth leading cause of death for all age groups surpassing HIV/AIDS, tuberculosis, and diarrheal diseases. As long as vehicles exist, vehicle collisions will, unfortunately, continue to occur.
Vehicle collisions occur for many reasons and factors [2,3,4] in different situations [5,6] and involving different actors. When a car crash occurs, it is important to investigate and determine the causes that led to it as well as the responsibilities of every actor involved. This helps first to make sure that the incident was not caused by a criminal mindset and second to determine which party will be responsible for paying the damages. The police in charge of investigation usually process manually by going to the crash spot, collecting data on the field, drafting the crash, assessing responsibilities based on road rules, and producing a crash report that generally takes three (3) to fifteen (15) days to be available. At the same time, insurance companies also assign the claim to claims adjusters, who are professionals who assess, within a period of about thirty (30) days, insurance claims and determine how much the insurance company will pay. Claims adjusters generally process the same way as police do to gather their own evidence on the cause of the accident and the damage or injuries claimed and determine who was responsible for the crash before the initiation of any damage payment process. Victims generally wait until the end of this process before receiving their compensation.
Our goal is to automate the responsibility assessment process for both police and claim adjusters by creating a support system that can automatically and quickly report who was wrong when an incident occurs. By doing so, we want to facilitate the process, shorten the decision time, and reduce the time that victims have to wait to receive their compensation. This paper introduces our system based mainly on image processing that can support the police in evaluating actors’ responsibilities automatically within a crossroad crash (one of the most common car crashes). The system uses the crash video recorded by the driving recorder of one of the vehicles involved in the crash as the input data source. It then assesses and outputs the evaluation of each actor’s responsibility within the crash thanks to a rule-based knowledge system, which was introduced to make the reasoning about responsibility assessment explainable and enable users to understand the results easily. To assess responsibilities, the system is equipped in total with three different modules and goes through three different steps: (1) detecting crash time within the crash video thanks to the first module, (2) detecting all traffic signs within the crash video thanks to the second module, and (3) using a rule-based knowledge system of road rules to deduct each party’s probable responsibility thanks to the third module. A head-on crash is not an object on its own that a common vehicle detection model can recognize. Therefore, applying existing vehicle detection models such as [7,8,9] will fail or output wrong results with many false positives. To solve the issue, we made our proposed model assume that if there is a head-on crash in an image with the angle of view of the driving recorder inside one of the vehicles involved in the crash, the crash can be recognized by taking into consideration only the collided vehicle, its shape, and its position within the video. Our contribution is the proposed framework that combines crash detection (using an original method that takes into account only the collided vehicle, its shape, and its position within the video), traffic signs detection, and a knowledge system to assess actors’ responsibilities from a crash video. Moreover, due to a lack of available datasets with the required data to train the system’s detection models, we built our own dataset from scratch with more than 1500 images of head-on car crashes within crossroad accidents context taken by the driving recorder of one of the vehicles involved in the crash. This dataset, when made publicly available, can also be used by other researchers to train their models for applications in fields such as autonomous driving or driving assistance systems. Currently, the crash detection model, as well as the traffic light detection model, can be found in this repository (https://github.com/heltonyawovi/car-crashes-responsibility-assessor/tree/main/models (accessed on 8 September 2022)).
During the evaluation, the performance of each module of the system was tested with different parameters and under different road conditions (daytime and nighttime with good and bad visibility). The experiment’s results show how the system performs in (1) detecting the crash time within a video using different vehicle types (cars, vans, and trucks), (2) detecting traffic signs within a crash video using different view distances (far, close, very close), and (3) assessing each party’s responsibility.
In a previous work [10], we described the first prototype of our system that was trained with a manually created dataset of 531 head-on crash images and 3000 traffic light images. The system needed user intervention during the crash-time detection phase to select the frame that describes the crash the most. We did some experiments with 27 testing videos within different road conditions and vehicles involved. In this paper, we introduce the extended version of our system with additional training data (1530 manually created head-on crash images from videos and 3000 traffic lights images) and we made some new experiments (with 180 testing videos collected and processed from YouTube) with and without user intervention during the crash time detection phase. The main goal of this current work is to improve the accuracy of our models and enable them to perform the highest accuracy possible; we focus mainly on data collection and new experiments. In the future work section, we describe improvements that we will make to the system’s features to handle more crossroad crash cases, such as cases without traffic lights, with pedestrians involved, or with stop signs.
2. Related Work
Several studies have been carried out to propose car crash image and video databases, as well as road accident prediction and analysis models. The main areas of interest that these models study are (a) road accident forecasting [11,12,13,14,15,16] using driving recorder videos [17,18,19] or traffic surveillance cameras [20,21,22], (b) detection of problematic areas for circulation [6,23,24,25], (c) real-time detection of traffic incidents [26,27], and (d) speed calculation [28].
An existing work [29] has focused on support systems that predict expert responsibility attribution from explanatory variables. These variables are available from crash data routinely recorded by the police, according to a data-driven process with explicit rules where the driver’s responsibility is assessed by experts using all information contained in police reports.
The major challenge we faced while implementing our system was building a dataset with enough image data of head-on car crashes within crossroad accidents context taken by the driving recorder of one of the vehicles involved in the crash. Our dataset needs to include thousands of crash images taken from driving recorders’ videos before the model can perform well after the training phase. However, most of the existing sources of datasets related to a car crash on the web (such as the web platform kaggle.com) do not have large data sets ready to download that fit our needs. Furthermore, publicly available datasets are generally from surveillance cameras [21,30,31,32] or from driving recorders of vehicles that are not necessarily involved in the crash [17,33,34,35,36]. Therefore, we had to build a custom dataset that would fulfill all the system’s requirements.
To date, there is no publicly available framework that can automatically assess drivers’ responsibilities from a driving recorder video. Existing works using driving recorder videos have been focusing on crash detection [17,37,38,39], analysis of driver distraction and inattention [40], or risk factors evaluation [41]. The originality of this paper is the proposal of a framework with a novel approach that combines crash detection (using an original method that takes into account only the collided vehicle, its shape, and its position within the video), traffic signs detection, and a knowledge system to assess actors’ responsibilities from a crash video. Furthermore, since a new specialized dataset (dedicated only to head-on crashes from ego vehicle’s driving recorders) has been created to satisfy the system’s requirement when made publicly available, it can be used by other researchers to train their models for applications in fields such as autonomous driving or driving assistance systems.
3. Responsibilities’ Evaluation within a Crossroad Crash with Traffic Lights
Using previously occurred car crash data with artificial intelligence, Internet of Things [42,43], or machine learning [44] to predict future crashes or to detect factors leading to those fatalities is very important.
In our work, we propose a heuristic approach to solve the problem of actors’ responsibility determination when a crash occurs thanks to the usage of the driving recorder video of the crash as the data source. We developed a system that helps evaluate each actor’s responsibility within a car crash, especially a crossroad crash with traffic lights. The system consists of three different modules with a set of five distinct steps.
In an accident, there are many factors that should be taken into consideration. Some of these factors can be detected automatically, while some will need human input in the system. Here are some of the manual inputs, and some of the automatically detected factors, as well as some assumptions we made during the implementation of the system:
- Automatically detected factors: Crash time; Traffic light state; Daytime/Nighttime.
- Manual input factors: Road width; Vehicles’ speed; Vehicles’ direction; Accident location; Drivers’ information (name, age...); Exact time (hh:mm:ss).
- Assumptions: Both actors involved in the crash are cars; Vehicle A is the car from which the crash video was recorded; Both actors come from different ways.
It is also important to note that the current version of the system is only for crossroad crashes with traffic lights that involve two cars and taking as input only one crash video at a time.
3.1. Design of the System
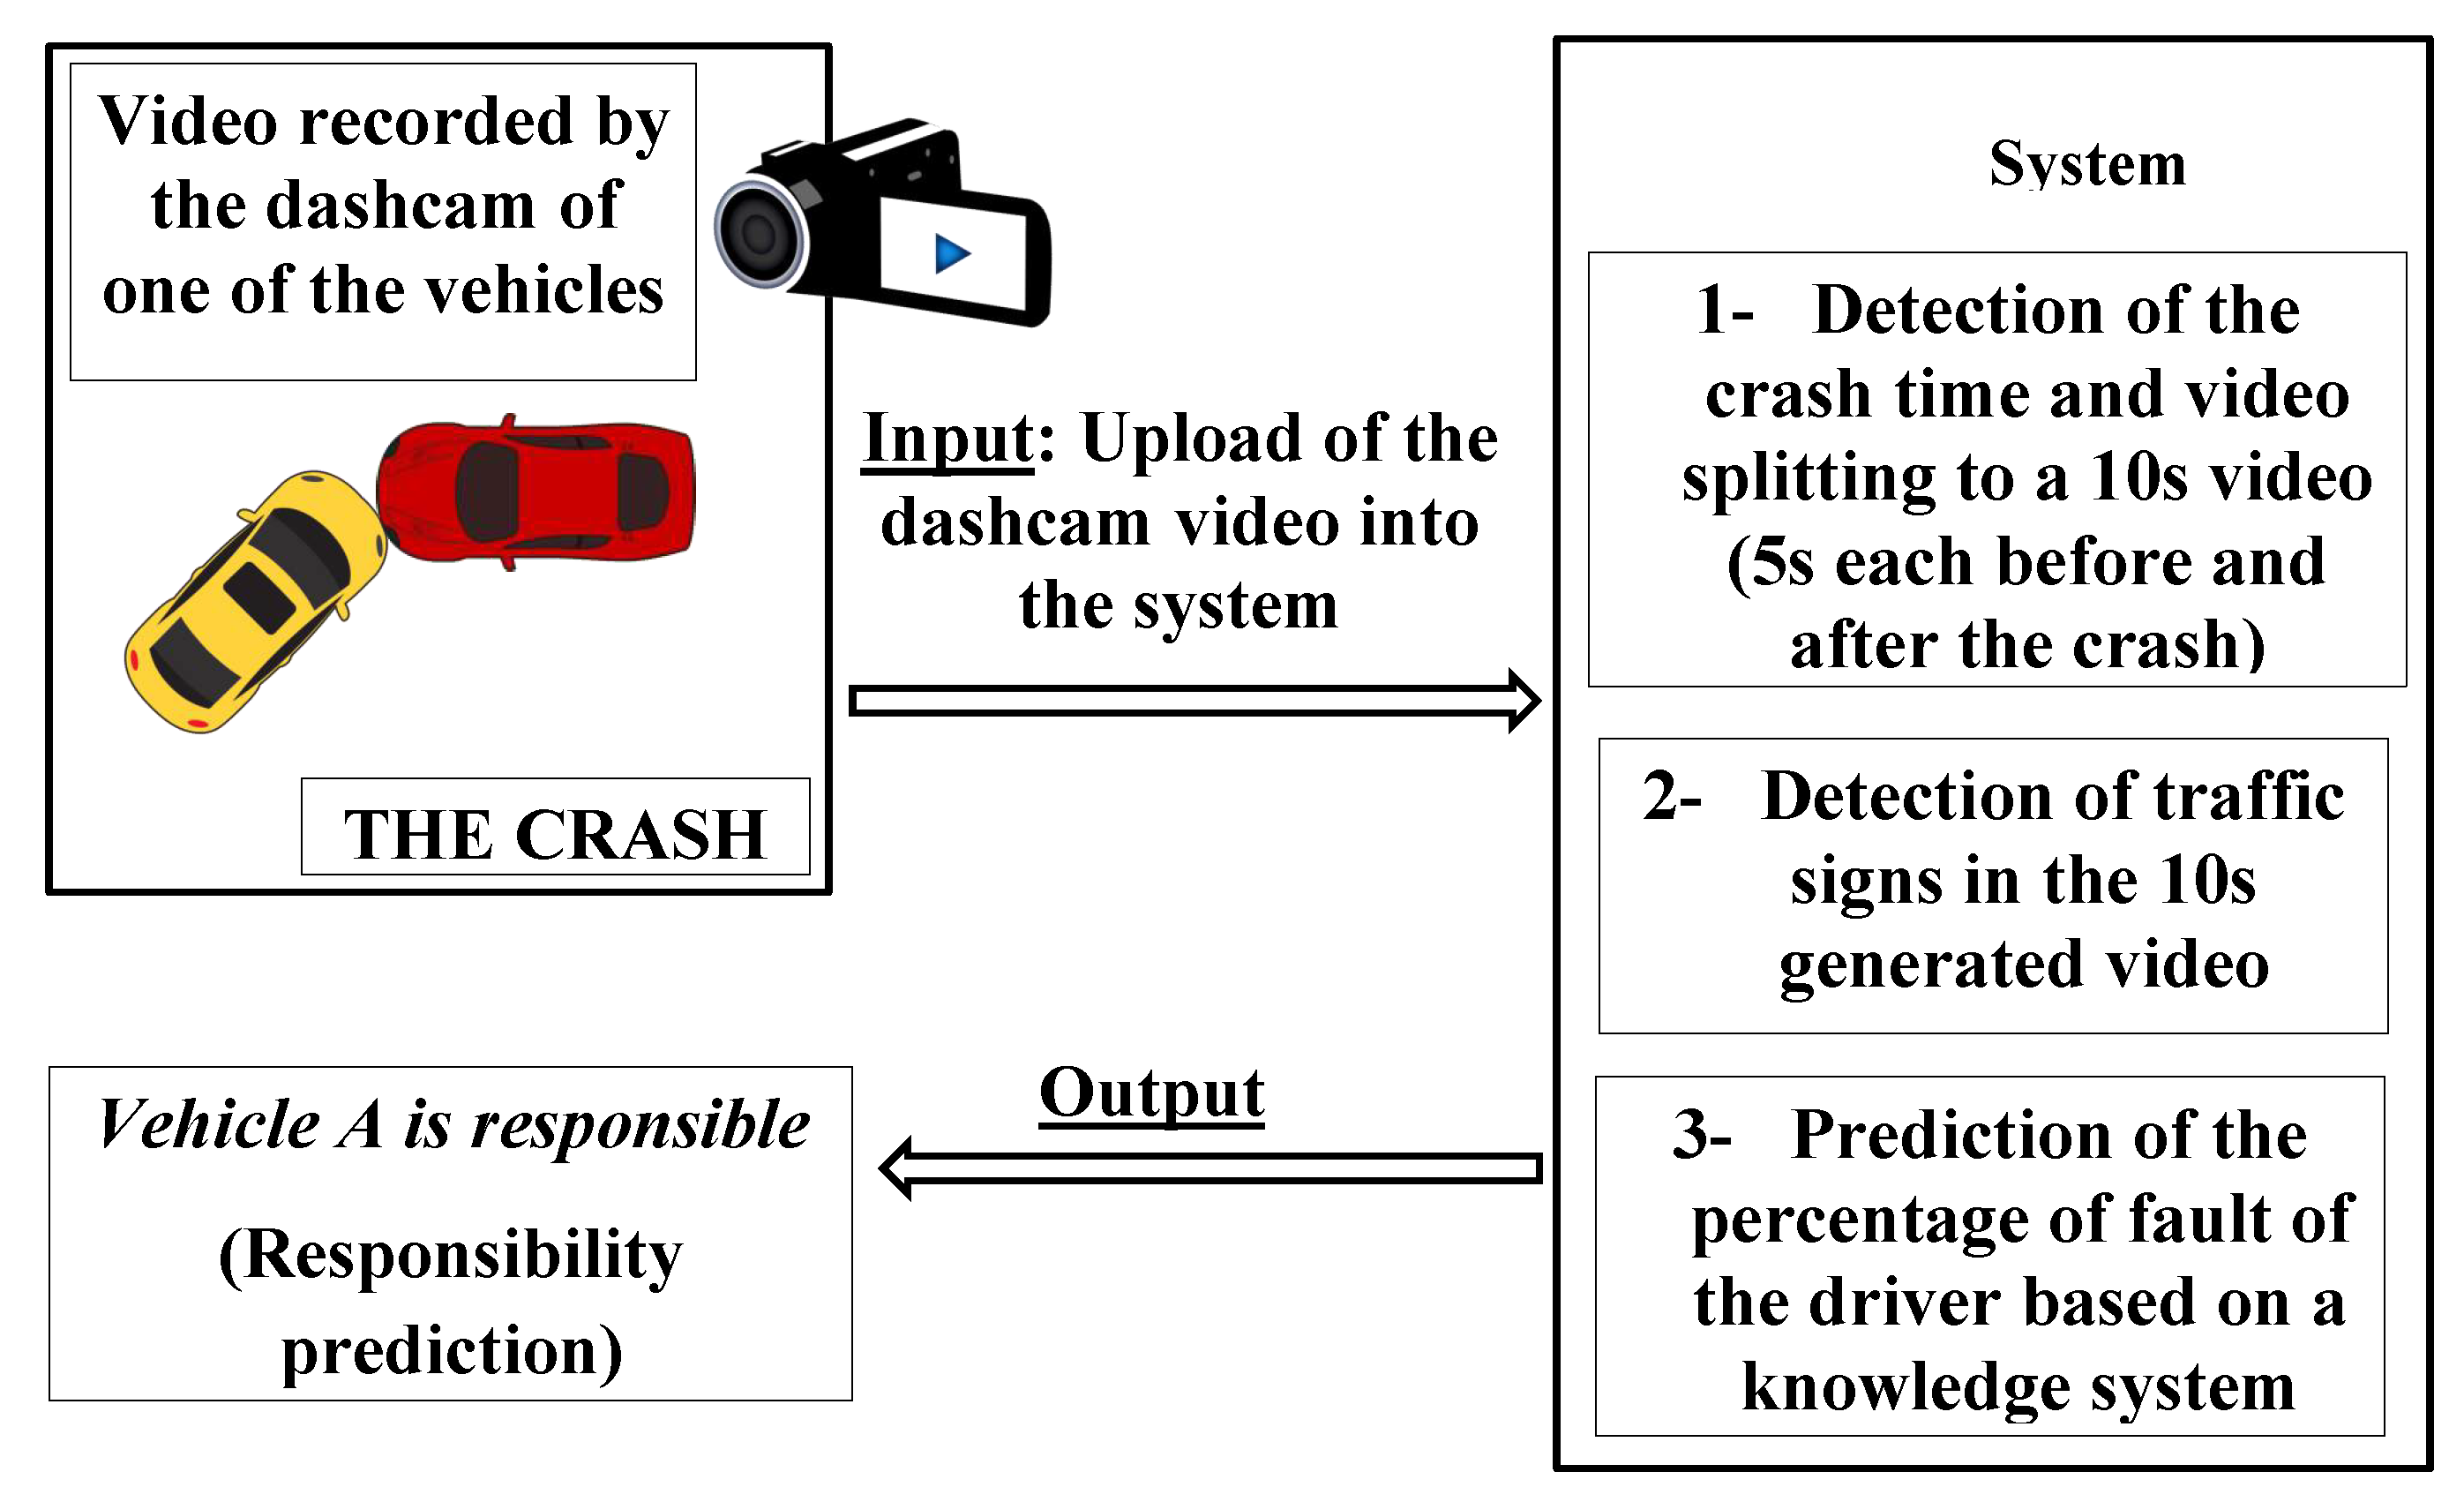
To implement a system that can evaluate actors’ responsibilities within a crash using the crash video as the input data source, there is a need to implement distinct modules that can work together to achieve the final goal. The system is a set of three different modules, each having a specific job and working independently to achieve one sub-goal of the entire system. The first module is a module that can detect the crash time in a video and split the crash interval in that video into images for object detection. The second module is a module that can detect, in an image, crucial information used to evaluate responsibilities in a crash (such as traffic lights). The third and last module is a module based on a rule-based knowledge system of road rules that can use an inference engine to derive actors’ responsibilities within a crash. Figure 1 shows the architecture of the system with the three modules.
All of these three modules contribute to having a complete system that passes through five distinct steps to evaluate the responsibilities of actors within a crash: (1) The detection of the crash time in the video recorded by the driving recorder of the vehicle; (2) the split of that video into a 10 s video (5 s each, before and after the crash time); (3) the split of the 10 s video, frame by frame, into images that can be used by a model for object detection; (4) the detection of important objects in the video, such as traffic lights and cars; (5) the evaluation of the percentage of fault (degree of negligence) of each actor based on road rules using a rule-based knowledge system.
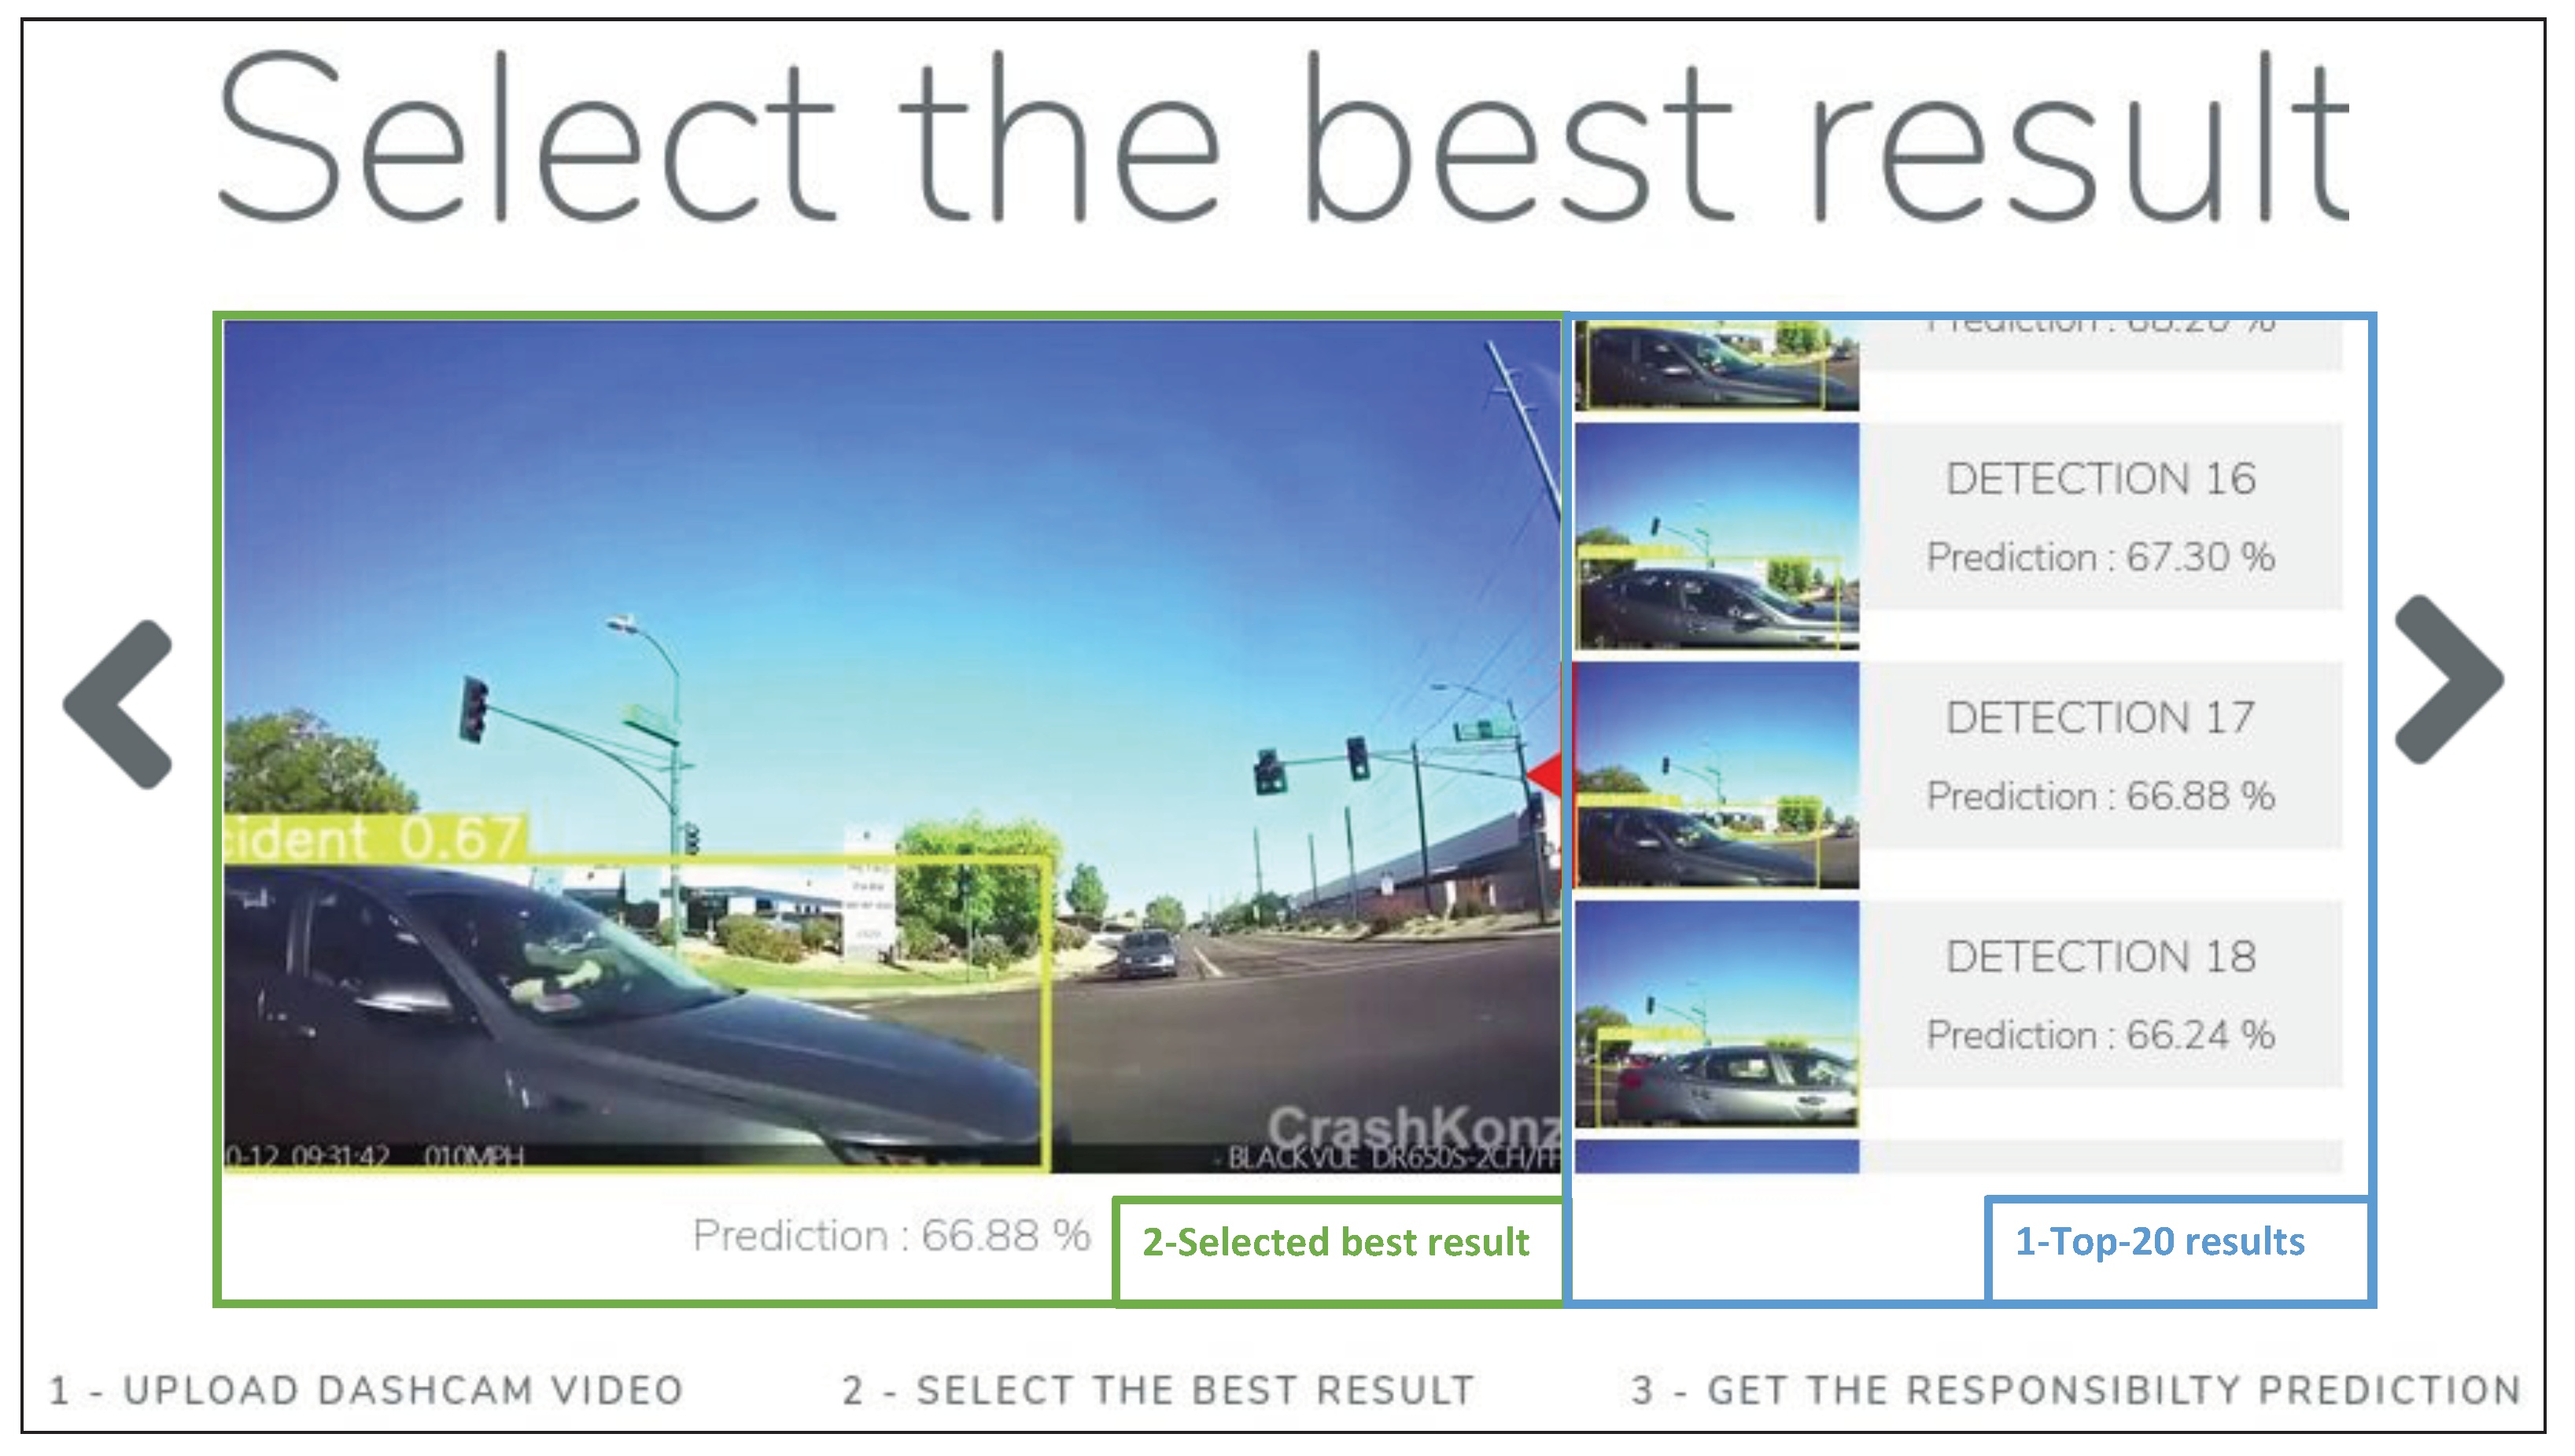
We implemented an easy-to-use and ergonomic user interface that allows the user to upload his crash video and get the result of the responsibilities’ evaluation in three steps. Figure 2 shows a screenshot of the interface with the steps that the user must follow to get the final result of the evaluation.
3.2. Crash Time Detection Module
This module is the first one and the starting point of the system. It detects the time of the crash in the crash video, splits that video into a 10 s video (5 s each before and after the crash), and splits that 10 s video, frame by frame, into images. It consists of three main tasks: the detection of the crash time in the crash video, the split of the crash video into a 10s video, and the split of the 10 s video into images.
Detection of the Crash Time in the Crash Video
To detect the crash time in a video, we created a custom object detection model that can detect a crash using YOLOv5 (https://0-doi-org.brum.beds.ac.uk/10.5281/zenodo.7002879 (accessed on 8 September 2022)). YOLOv5 is a family of object detection architectures and models pretrained on the COCO dataset [45]. It is one of the fastest versions in the YOLO series. YOLO [46] an acronym for ’You only look once’, is a convolutional neural network for performing object detection in real time. It is an object detection algorithm that divides images into a grid system. Each cell in the grid is responsible for detecting objects within itself. YOLO is one of the most famous object detection algorithms due to its speed and accuracy. Many works related to car traffic have used YOLOv5 to detect traffic signals [47,48], obstacles [49], traffic flow [50], or to classify vehicles [51].
In this study, YOLOv5 was used to detect a crash within a video. We used 1530 images of head-on crashes to train our YOLOv5 model and get it ready for crash detection.
4. Dataset Building
Our dataset has a particularity because of some criteria it has to meet:
- The images in the dataset have to be related to a head-on crash;
- The dataset’s images have to be from a video recorded by the driving recorder of one of the vehicles involved in the crash.
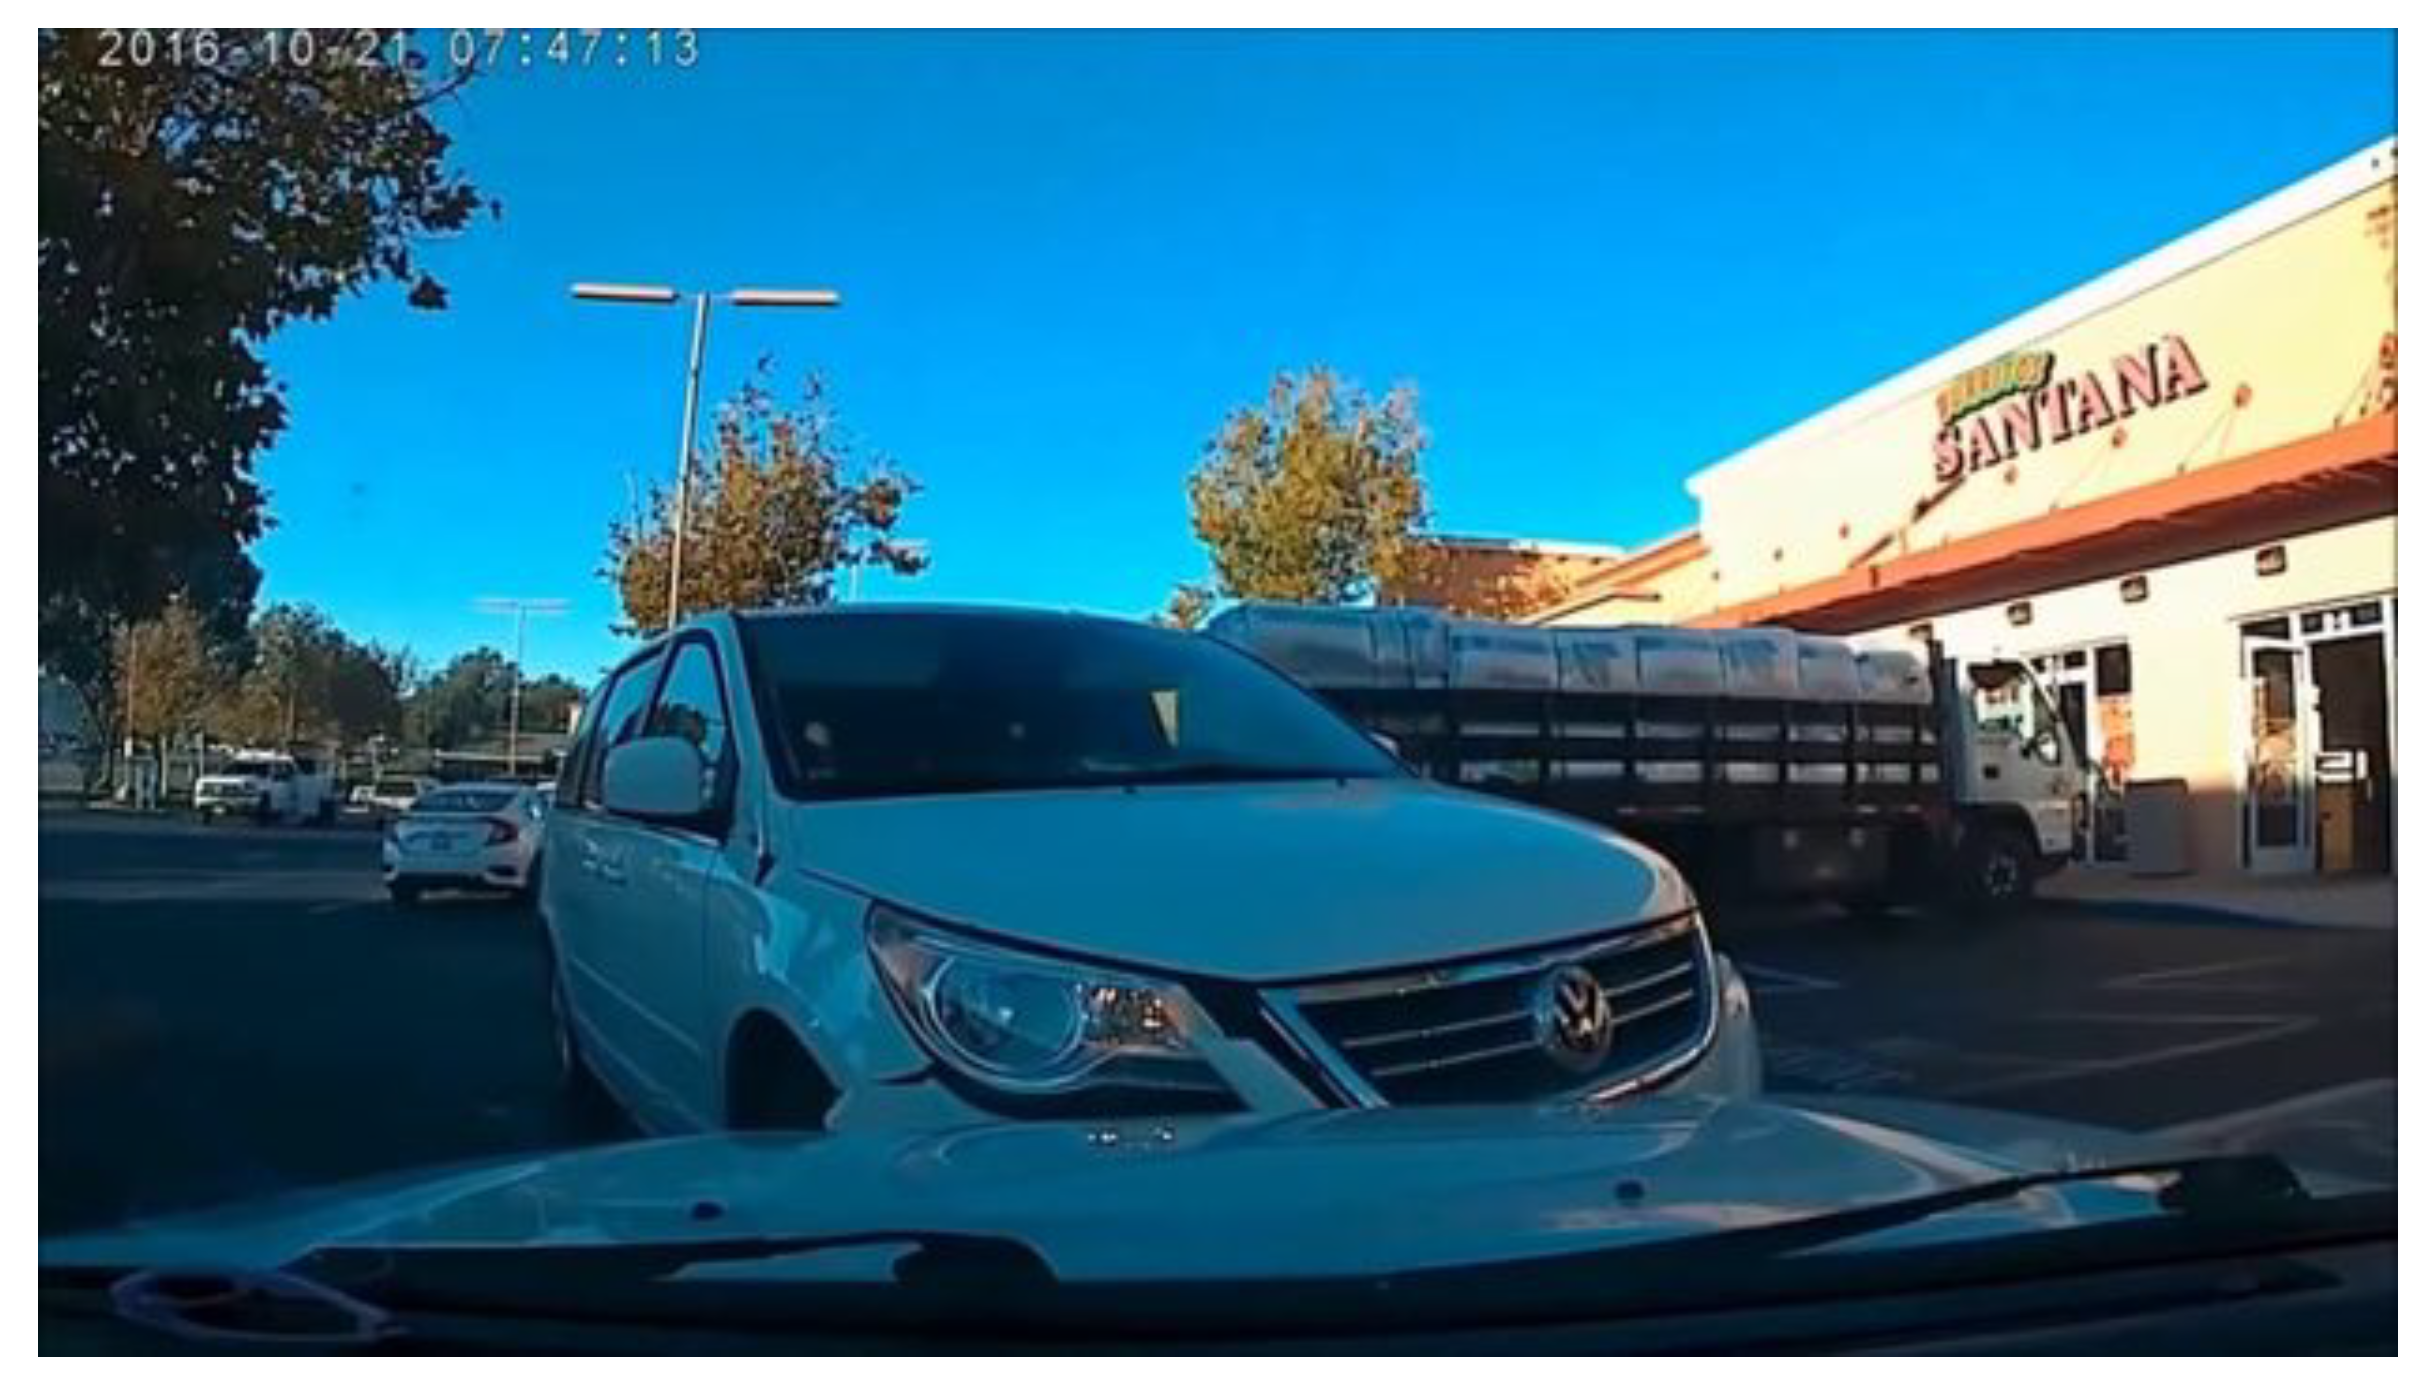
To build a custom dataset with enough images that meet these criteria, we had to extract these images from videos. We used YouTube as a source of data. YouTube is a well-known online platform where we can find many kinds of crash videos, including the ones of interest to us. However, it requires a manual and long job to get the ones that meet our dataset criteria. We started by searching compilation videos of crossroad accidents recorded by driving recorders that we could collect manually. The major part of the compilation videos we found was not dedicated only to head-on crashes in the context of crossroad accidents. Most of them were a compilation of all kinds of car crashes that occurred in the United States of America, Thailand, Russia, and India with the driving recorders, not necessarily the ones of the vehicles involved in the crash. Therefore, we had to watch all the videos and select the parts containing the kinds of crashes and angles of recording of interest to us. In total, we watched 103 videos (each one having an average of 15 min in length) and finally selected 68 of them. We selected those compilation videos based on acceptable image quality (480 p and above), the fact that they have at least one video related to a head-on crash in a crossroad accident context, and the fact that the crash details are clear enough to use the images during the labeling step. After collecting the compilation videos, we had to extract and resize the frames (images) of the parts that we were interested in. We used the library OpenCV (Open Source Computer Vision) to extract the frames and scikit-image (https://scikit-image.org/ (accessed on 11 May 2022)) to modify and resize them so that they have the same size and structure. For homogeneity and consistency in the data, the frames of the videos were converted to a lower width (500 pixels). Figure 3 shows an example of one of the head-on crash images we finally got after the extraction and the resizing steps.
After all these steps, we received a total of 1530 crash images from different countries, such as the United States of America, Russia, and India, to train our model. To annotate the images, we used LabelImg (https://github.com/tzutalin/labelImg (accessed on 11 May 2022)) a graphical image annotation tool, and label object bounding boxes in images written in Python. We imported all of our images into the software and manually annotated them one by one, by creating rectangle bounding boxes around the crash. A crash is not an object on its own that an object detector can recognize. Therefore, we assumed that if there is a head-on crash in an image with the angle of view of a driving recorder inside one of the vehicles involved in the crash, we can recognize the crash by taking into consideration the collided car. The shape and the position of the collided car can tell us if there is a crash or not. Therefore, we created annotation bounding boxes to surround collided objects (mainly cars, trucks, and vans) in the images. LabelImg allows for the creation of two types of annotation formats: PascalVOC (XML file-based format) and YOLO (TXT file-based format). We chose the YOLO format and exported our labeled images (with their corresponding annotation TXT files) to a directory ready to be split into training/validation/test data. We separated our annotated images into training data (1071 images equivalent to 70% of the dataset), validation data (306 images equivalent to 20% of the dataset), and test data (153 images equivalent to 10% of the dataset).
5. Model Training and Validation
After setting up the dataset, we then created the necessary configuration files and trained our custom detection model. To train the model, we used Google Colab (a Jupyter notebook environment created by Google to help disseminate machine learning education and research) because of its ease of use and its fast processing. We set the batch size to 16 and the number of training epochs to 100. After the training and validation steps, we exported the trained weights that can be used for future inferences for crash detection in any other videos and on devices that do not have a powerful processing unit.
In the early version of our system [10], we implemented a service that can be used by the system to request the detection of a crash in a given video using the model inference. The service output is the list of the top-20 crash detection results with details about each detection’s accuracy, the frame in which each detection was made, and the link to the image containing the bounding box for the corresponding detection. To be able to create such a service, we had to modify the detection algorithm of YOLOv5 to output the data we needed. The YOLOv5 detection algorithm outputs the result of the detection directly into videos or images. However, in our case, we needed to get the detection details in an array. Therefore, we created our custom detection algorithm based on the initial detection code of YOLOv5. We added features and methods to extract details about the detection’s accuracy, the frame number in the image sequence of the video in which the detection was made, and the exportation of the image in which the crash was detected with the detection bounding box. Thanks to that service, the system was able to show the list of the top 20 results of the crash time detection to the user, who can manually select the best result to use for the next steps of the responsibilities evaluation.
In the current version of the system, to speed up the whole process and make things easier for users, we removed that manual selection step. Thanks to additional training in the crash time detection model, now the system automatically uses the best first result and processes to the next steps without asking the user for manual selection.
5.1. Split the Crash Video into a 10 s Video with Image Extraction
Generally, driving recorders record long sequences of videos. Depending on the brand and the available memory of the driving recorder, the raw recorded video can have an initial length of 30 min or more. When a crash occurs, we do not need the full-length recorded video. We only need a few seconds before and after the crash. Therefore, after the detection of the crash time within a video, the system splits that video automatically into a 10 s video (5 s each before and after the crash time).
After getting the 10 s video (which reduces processing time considerably), the module automatically extracts the frames from that short video to have a total of 240 images (1 s in a video may have 24 frames or images). Then, it modifies and resizes each of the frames to get frames with the same size and structure and makes all of them ready to be used by any object detection library. The output of this module is images of the environment of the crash a few seconds before and after the crash. This output will be used by the second module to detect traffic lights and other crucial information used to evaluate responsibilities within crashes.
5.2. Traffic Sign Detection Module
This module is the traffic sign detection module that helps the system know what to evaluate in the responsibilities’ evaluation phase. The final purpose of this module is to detect any kind of traffic signs (stop signs, traffic lights, speed limit signs...), but in its current version it can only detect traffic lights. It is an intermediary module and serves as a middleware for the first module and the last module. To implement this module, whose main task is object detection, we used again the object detector YOLOv5 and the library Open CV. We trained a YOLO custom object detection model with a dataset of thousands of images of green, red, and yellow traffic lights.
6. Dataset Building
To build a custom dataset with enough images of traffic lights, we investigated and downloaded them one by one on Google Image Search. In addition, fortunately, we found a ready-to-use labeled traffic light image dataset on the public dataset of Roboflow.com (https://public.roboflow.com/object-detection/self-driving-car (accessed on 11 May 2022)). The dataset is a set of 15,000 images taken on roads in the United States of America. It contains not only signs for traffic lights, but also signs for pedestrians, bikers, and cars. Needing only traffic lights annotations, we extracted 1300 images of traffic lights from the original dataset (red, green, yellow, red left, green left, and yellow left). We finally got a total of 3000 images of traffic lights after adding the ones we downloaded manually from Google.
For labeling the dataset’s images, we used LabelImg, to annotate them. We then separated the annotated images into training data (2100 images equivalent to 70% of the dataset), validation data (600 images equivalent to 20% of the dataset), and test data (300 images equivalent to 10% of the dataset).
7. Model Training and Validation
After the dataset building phase, we created the necessary configuration files and trained the model in Google Colab as we did previously for crash time detection module.
The output of this module is the list of all traffic lights detected in the crash environment’s images a few seconds before and after the crash. This output is used by the third module to evaluate actors’ responsibilities through an inference on a rule-based knowledge system.
Responsibility Evaluation Module
This module is the last module of the system. It uses the results of the previous module (detected traffic signs) to evaluate the responsibilities. To enable users to easily understand the reasons for the results, this module was implemented using a rule-based knowledge system and uses an inference engine to determine whether the first driver in the crash (the driver of the vehicle whose crash video was recorded by the driving recorder and inputted into the system via the first module) is responsible or not.
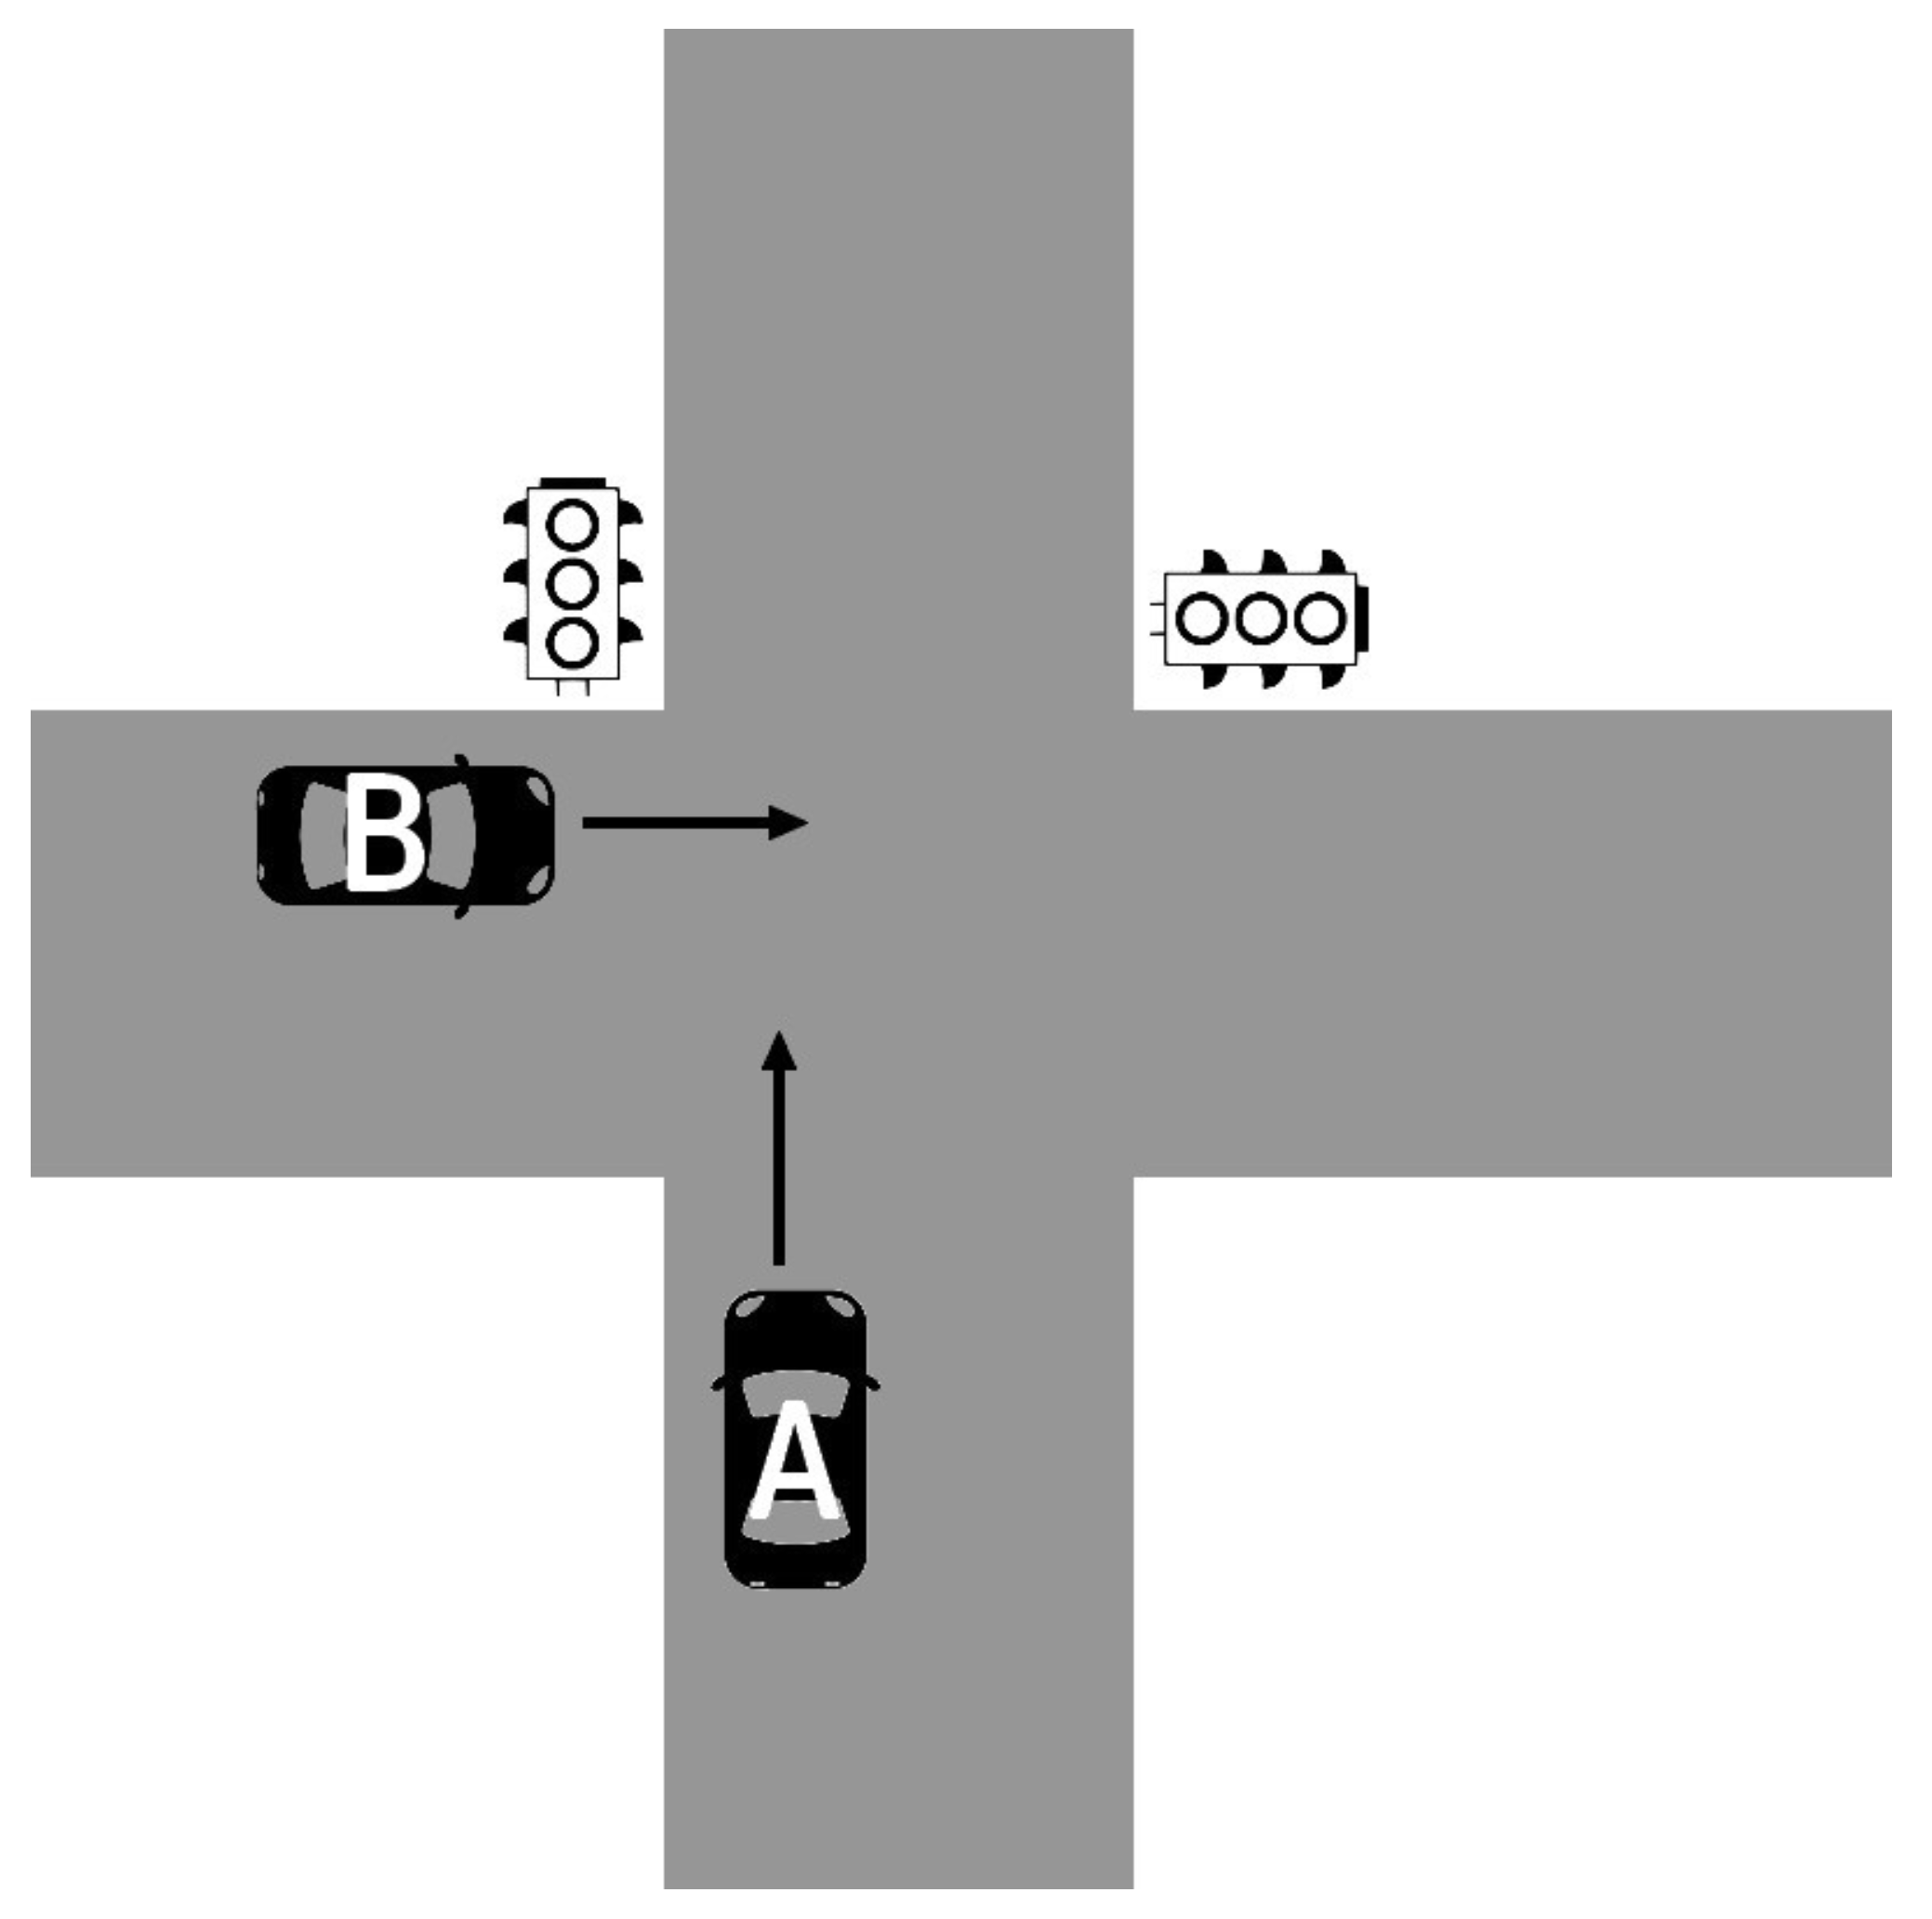
Usually, after a crash, the police determine responsibilities based on the evaluation of each actor’s degree of negligence (or percentage of fault). In Japan, legal books on negligence offset rates in civil traffic proceedings are widely used to determine the degree of negligence. In these books, there are predefined degrees of negligence with different kinds of crashes. Since our system is based on Japanese traffic rules, we use those predefined degrees of negligence to obtain responsibilities (like the police generally do). For example, let’s consider a crossroad crash involving two vehicles at an intersection with traffic lights (as illustrated in Figure 4).
In such a case, according to Japanese traffic rules, we have basic degrees of negligence for each vehicle depending on the situation:
- Situation 1: “In case the traffic light is green for Vehicle A and red for Vehicle B, the degree of negligence for Vehicle A is 0, and the one of Vehicle B is 100.”
- Situation 2: “In case the traffic light is yellow for Vehicle A and red for Vehicle B, the degree of negligence for Vehicle A is 20, and the one of Vehicle B is 80.”
- Situation 3: “In case the traffic light is red for Vehicle A and red for Vehicle B, the degree of negligence for Vehicle A is 50, and the one of Vehicle B is 50.”
The responsibility evaluation module of the system uses this logic to deduct the corresponding degree of negligence of each actor involved in a crash and to output responsibilities. In some cases (such as low accuracy in detections, no result after multiple deductions from the knowledge system, or if the crash did not occur at a crossroad), the module outputs "unknown," which is set for unknown results. This is the output in case of failure in the responsibility prediction by the system.
8. Experiments
To evaluate the system, we performed some experiments with a testing dataset containing 180 head-on crash videos within the context of crossroad accidents that occurred in the United States of America and in India (as for now, the side of driving—either left or right—does not have any impact on the result of the system). The dataset contains 90 videos of crashes that occurred in good visibility conditions (45 each during daytime and nighttime) and 90 videos of crashes with poor visibility (45 each during daytime and nighttime). For each module, we got different results depending on the road environment conditions such as daytime and night time with good visibility (for example, a sunny day or a well-lighted road during the night), and daytime and night time with bad visibility (for example, a snowy day or a bad lighted road during the night).
8.1. Evaluation of the Crash Time Detection Module
The crash time detection of the system within a video is achieved through the first module. To evaluate the performance of this module in detecting videos crashes, we carried out the experiment with 180 testing videos. Here, we want to evaluate how well our custom model can detect a crash so that the system can get the crash time. We chose different collided objects (the other actor in the crash) such as cars, vans, and trucks. First, we evaluated the performance of the system during the day with good visibility and bad visibility. Then we evaluated its performance at night with good visibility and bad visibility.
Table 1 shows the resulting accuracy of the module’s model in detecting the crash in videos during these different environmental conditions with different collided objects. The model’s accuracy calculation is expressed by the following formula:
where is True Positive, is True Negative, is False Positive, and is False Negative.
As shown in Table 1, during daytime and in good visibility conditions, the accuracy of the crash detection model is either 93.5% (for cars), 91.2% (for vans), or 91.5% (for trucks). During the day and in bad visibility, the accuracy drastically drops to reach 39.9% for cars, 38.7% for vans, and 38.3% for trucks. During nighttime and in good visibility conditions, the crash detection model performs relatively well when the collided object is either a car (82.1%), a van (80.6%), or a truck (79.8%). The lowest accuracy is reached when the environment condition is night with poor visibility. The model achieves an accuracy of 32.5% for cars, 28.3% for vans, and 28.1% for trucks.
The limitation of this module is mainly due to the variation of light and the visibility of objects in crash images. When the visibility is good enough, the module performs well with good accuracy. On the other hand, when the visibility is bad, the module suffers from making a good detection of the crash.
8.2. Evaluation of the Traffic Sign Detection Module
We evaluated the performance of the system in detecting traffic lights within the 180 test videos by evaluating the second module that is in charge of the task. Here, we want to evaluate how well our custom model can detect a traffic light (green, red, and yellow) in a given image. We made the experimentation in different road environment conditions as we did for the evaluation of the first module. We chose different view distances of the traffic lights from the driving recorder of the vehicle. We evaluated the system when the traffic light is far from the driving recorder (more than 30 m), close to the driving recorder (between 30 m and 10 m), or very close to the driving recorder (less than 10 m).
Table 2 shows the resulting accuracy of the module’s model in detecting traffic lights in videos with different view distances. Here again, the model’s accuracy calculation is expressed by Formula (1).
During the day and under good visibility conditions, the model of the module performs well when the distance from the traffic light from the driving recorder is either very close (97.3%), close (91.2%), or far (83.5%). During the day and in bad visibility, the accuracy drastically drops to 41.2% for very close distances, 40.8% for close distances, and 40.6% for far distances. During nighttime and in good visibility conditions, the traffic sign detection model performs relatively well when the view distance is either very close (73.1%), close (69.5%), or far (68.1%). The lowest accuracy is reached when the environment condition is night with poor visibility. The model achieves an accuracy of 36.8% for very close distances, 30.6% for close distances, and 30.2% for far distances.
The performance of this module depends on light conditions and traffic lights’ view distance. When the visibility is good enough and the view distance is very close, the module performs well. However, when the visibility is bad with a far view distance, the module suffers from recognizing traffic lights.
8.3. Evaluation of the Responsibility Evaluation Module
To evaluate the performance of the system in predicting each actor’s responsibility within a crash, we evaluated the performance of the third module in different road environment conditions and in two different scenarios: (a) with the user’s manual selection of the best result during the crash time detection phase, and (b) without the user’s manual selection step. In both scenarios, we randomly partitioned the 180 testing videos as follows:
- With a car as the collided object (60 videos in total): 15 videos during the day in good visibility, 15 videos during the day in bad visibility, 15 videos during the night in good visibility, and 15 videos during the night in bad visibility;
- With a van as the collided object (60 videos in total): Same as the previous partition.
- With a truck as the collided object (60 videos in total): Same as the previous partition.
8.3.1. Evaluation Results with the User’s Manual Selection Step
Table 3 shows the results of the successfully predicted responsibilities within the videos over the total number of videos tested when the user intervenes during the crash time detection phase and selects the best result to use among the top 20 results. The result is calculated by the proportion of videos in which the system has successfully predicted responsibilities over the total number of videos tested. The proportion formula is expressed below:
where is the number of videos in which the system has successfully predicted responsibilities, and is the total number of tested videos.
As shown in the results, during the daytime, and in good visibility conditions, with the user’s intervention, the module performs well in evaluating actors’ responsibilities when the collided object is either a car (successful evaluation within 14 videos over 15 tested in total), a van (successful evaluation within 14 videos over 15 tested in total) or a truck (successful evaluation within 12 videos over 15 tested in total). During the day and in bad visibility, the performance drastically drops to reach good evaluation within 5 videos only over 15 tested in total for cars, 4 videos only over 15 tested in total for vans, and 5 videos only over 15 tested in total for trucks. During nighttime and in good visibility conditions, the system performs relatively well when the collided object is either a car (successful evaluation within 14 videos over 15 tested in total), a van (successful evaluation within 12 videos over 15 tested in total), or a truck (successful evaluation within 12 videos over 15 tested in total). The lowest accuracy is reached when the environment condition is night with bad visibility. The system achieves a performance of good evaluation within 3 videos only over 15 tested in total for cars, 3 videos only over 15 tested in total for vans, and 2 videos only over 15 tested in total for trucks.
8.3.2. Evaluation Results without the User’s Manual Selection Step
Table 4 shows the results of the successfully predicted responsibilities within videos over the total number of tested videos when the user does not intervene during the crash time detection phase to select the best result to use among the top 20 results. In this scenario, the system automatically takes the first best result of the crash time prediction to evaluate responsibilities. Here again, the result is calculated by the proportion expressed by Formula (2).
As shown in the results, during the daytime, and in good visibility conditions, without user intervention, the module performs relatively well in evaluating actors’ responsibilities when the collided object is either a car (successful evaluation within 10 videos over 15 tested in total), a van (successful evaluation within 9 videos over 15 tested in total) or a truck (successful evaluation within 8 videos over 15 tested in total). During the day and in bad visibility, the performance drastically drops to reach good evaluation within 3 videos over 15 tested in total for cars, 2 videos over 15 tested in total for vans, and 3 videos over 15 tested in total for trucks. During nighttime and in good visibility conditions, the system performs slightly well when the collided object is either a car (successful evaluation within 8 videos over 15 tested in total), a van (successful evaluation within 7 videos over 15 tested in total), or a truck (successful evaluation within 7 videos over 15 tested in total). Here again, the lowest accuracy is reached when the environment condition is night with bad visibility. The system achieves a performance of good evaluation within 2 videos over 15 tested in total for cars, 2 videos over 15 tested in total for vans, and 1 video over 15 tested in total for trucks.
8.3.3. Evaluation Results’ Comparison for Both Scenarios
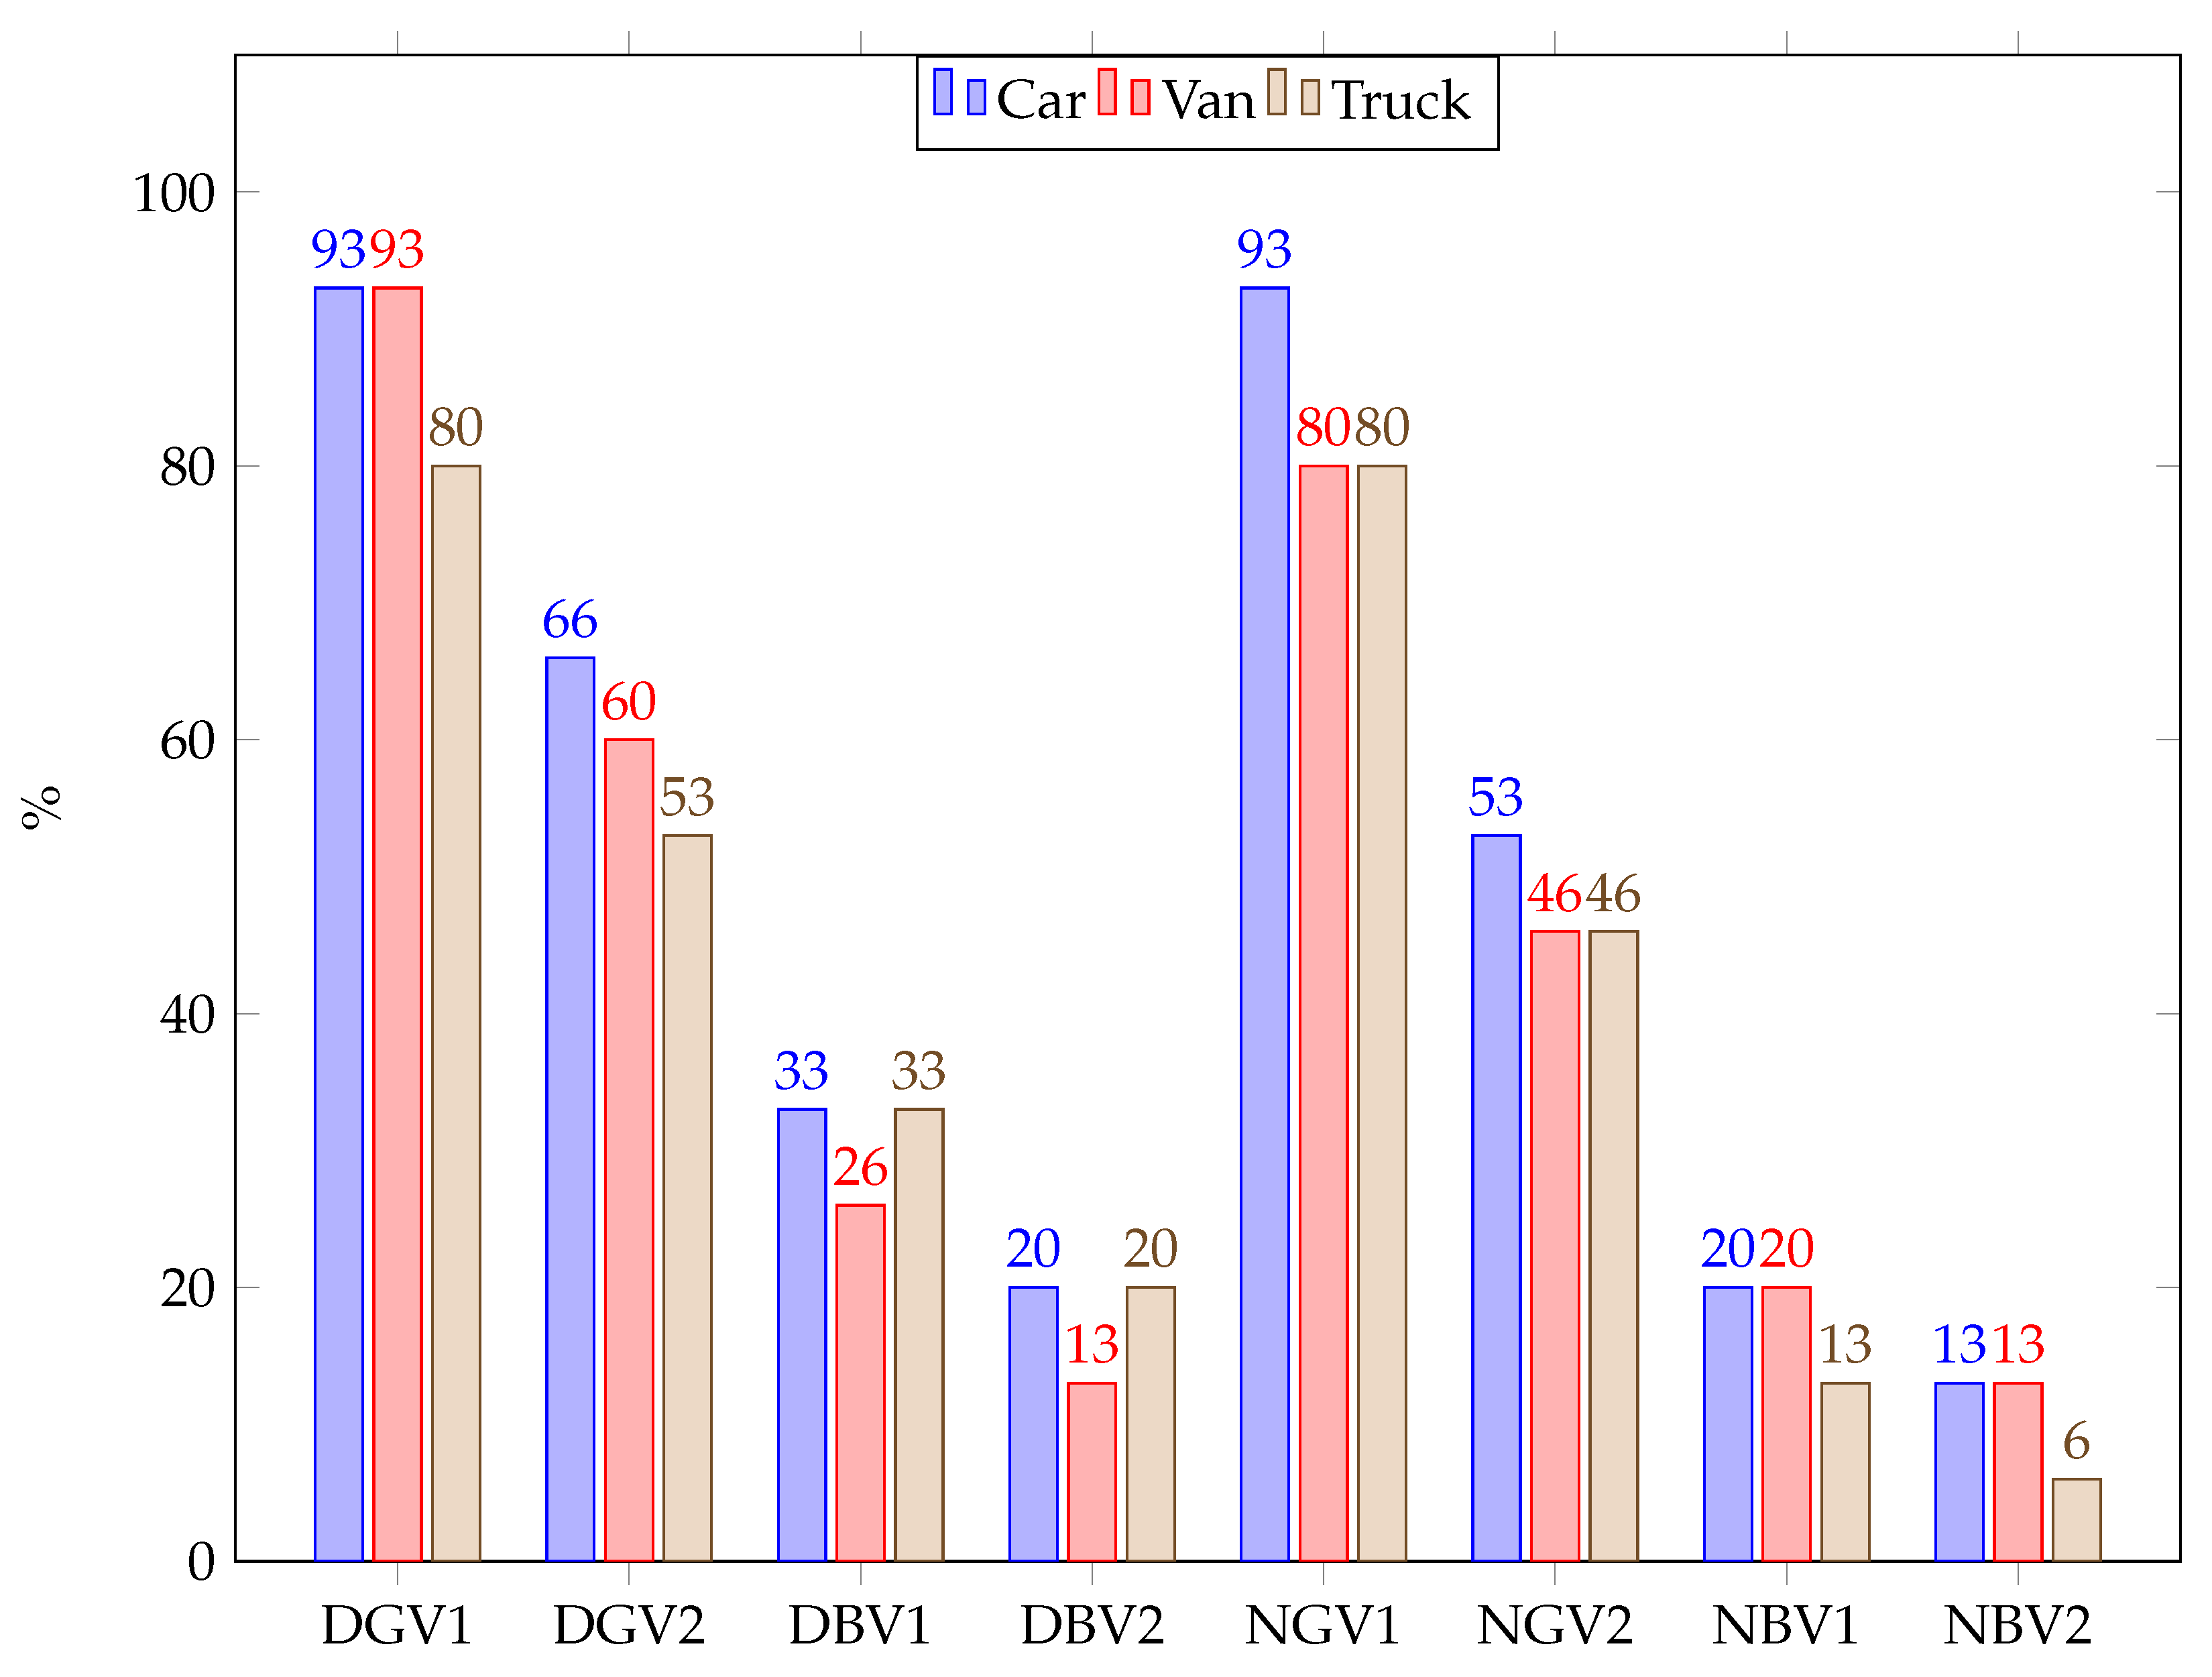
To compare the different evaluation results that were obtained with and without user intervention during the crash time detection process, we put the results in a simple column chart, as shown in Figure 5.
Legend:
- D: Day
- N: Night
- GV: Good visibility
- BV: Bad visibility
- 1: with user’s intervention
- 2: without user’s intervention
- For example, DGV1 means Day - Good visibility with user’s intervention
By analyzing the chart, we can see that the difference in accuracy in assessing responsibilities between cases with the user’s intervention and the one without the user’s intervention is in the range of 7% (best case) and 40% (worst case). This leads to the fact that although the system performs relatively well when there is no user intervention, it performs better when that intervention is involved. In addition, the performance of the system depends on the performance of the first and second modules of the system, either with or without the user’s intervention. If one of the two modules or both do not perform well, it affects the ability of this module to evaluate responsibilities. In some situations where there is no result after multiple deductions from the knowledge system, the third module could fail in assessing responsibilities even if both the first and second modules returned correct results. However, during the experiments, we did not get such a situation. Therefore, the limitations of our system are due to (a) the variation of light, (b) the visibility of collided objects, (c) the view distance of traffic lights within crash videos, and (d) the availability of matching rules in the knowledge system.
9. Discussion
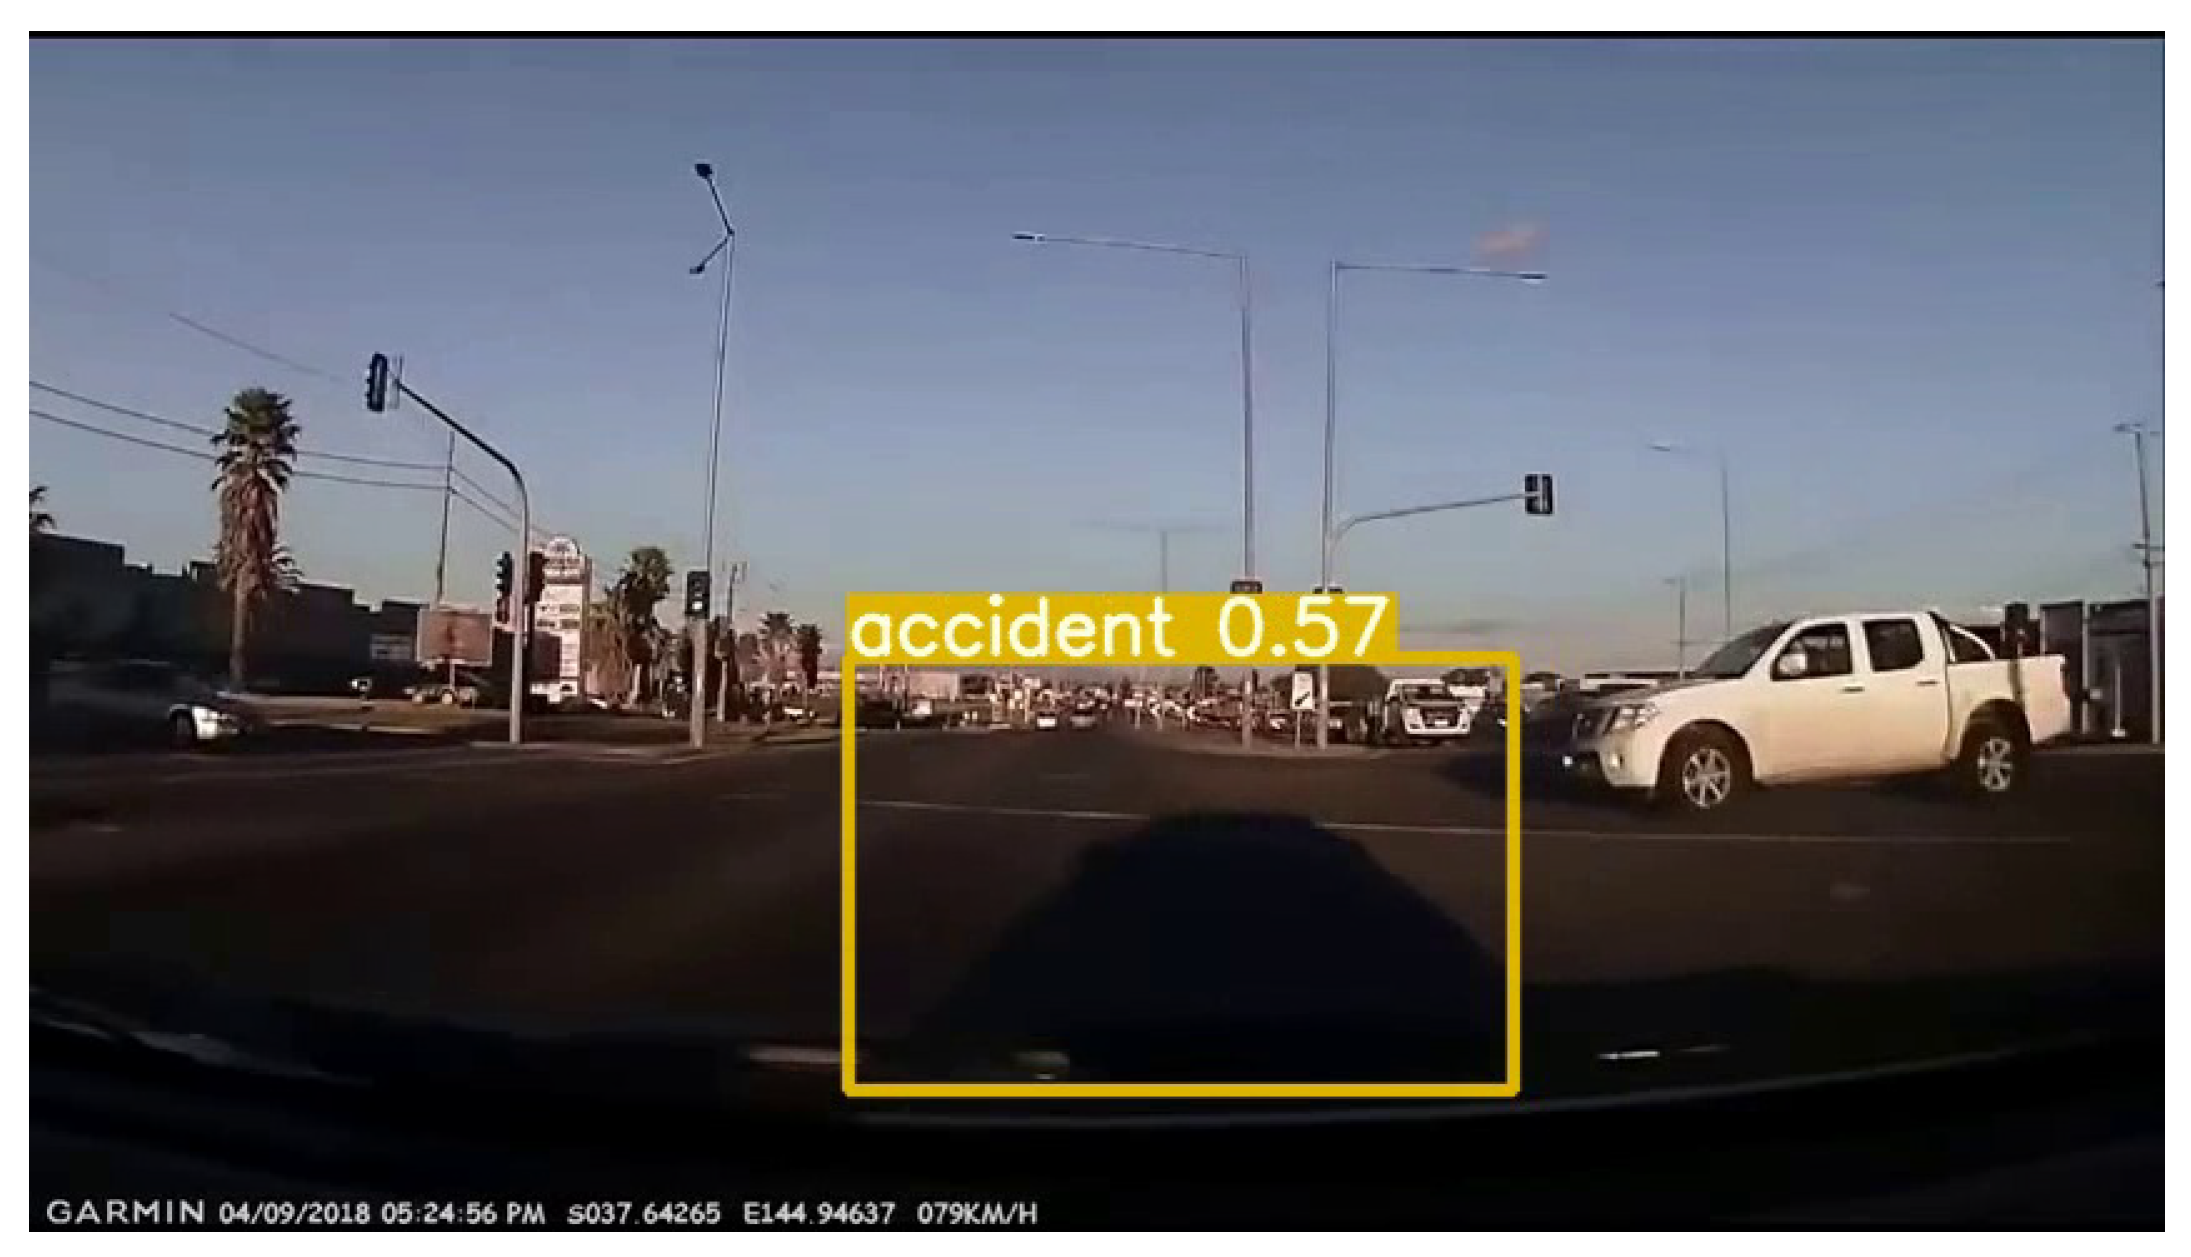
As shown in the experiment results, one of the main limitations of our system is due to light conditions when crashes occur. Like other technologies that use computer vision or object detection, light variation is one of the obstacles to robust object detection. The best solution to this problem may be the use of sensors, lidars, or radars. An alternative solution is to train our models with more data in low lighting conditions. In our case, the last solution is more suitable because most vehicles are not equipped with technologies such as lidar or radar but do have a driving recorder. In addition, other than the lighting condition in videos, the crash time detection module can sometimes detect wrong objects as collided objects. This may lead the system to a wrong evaluation of the crash time. For example, as shown in Figure 6, the module detects the shadow of a vehicle as the collided object. This is mainly due to the fact that since a crash is not an object on its own, we trained the crash detection model to detect a deformed vehicle as a crash. Therefore, every time the model detects a strange shape of a vehicle in the driving recorder video, it classifies it as a collided object. That was one of the reasons why we previously implemented the user’s manual selection of the best result among the top 20 obtained by the system. The manual selection helped minimize the impact of such detection errors on responsibility assessment. However, we will also explore more sophisticated methods involving object tracking and evolution of the scene in time that can help the system perform better in crash detection.
In an accident, many unexpected and exceptional events can occur and the system cannot handle all the possibilities. For example, when within a crash video, both traffic lights (for both drivers) are shown at the same time, the system may get confused and output a wrong result. In such a situation, a simple and quick solution may be to give the hand to the user for a manual selection of the correct traffic light to use. Moreover, in some situations, driving recorders can get damaged by serious shocks. In such cases, the system may fail in evaluating responsibilities if the record of up to at least one second after the collision is not available.
10. Future Work
As mentioned in previous sections, our current system is specific to crossroad crashes with traffic lights only. To have more impact and contribution to solving problems related to responsibility assessment within vehicle crashes, we are currently working on improving the system to handle more crossroad cases. In addition, because not all law systems have clear rules for all car crash situations, the system (mainly the third module) will need some modifications when used with some law systems.
10.1. Other Crossroad Crash Cases to Handle
There are a wide variety of car crashes that occur every day with different scenarios, in different environmental conditions, and in different areas. Therefore, our system cannot handle all types of car crashes. We chose to focus only on crossroad crashes because of the fact that they have a variety of cases and they are the most recorded ones with driving recorders
Here is the list of other crossroad crash cases that we plan to implement to improve the system:
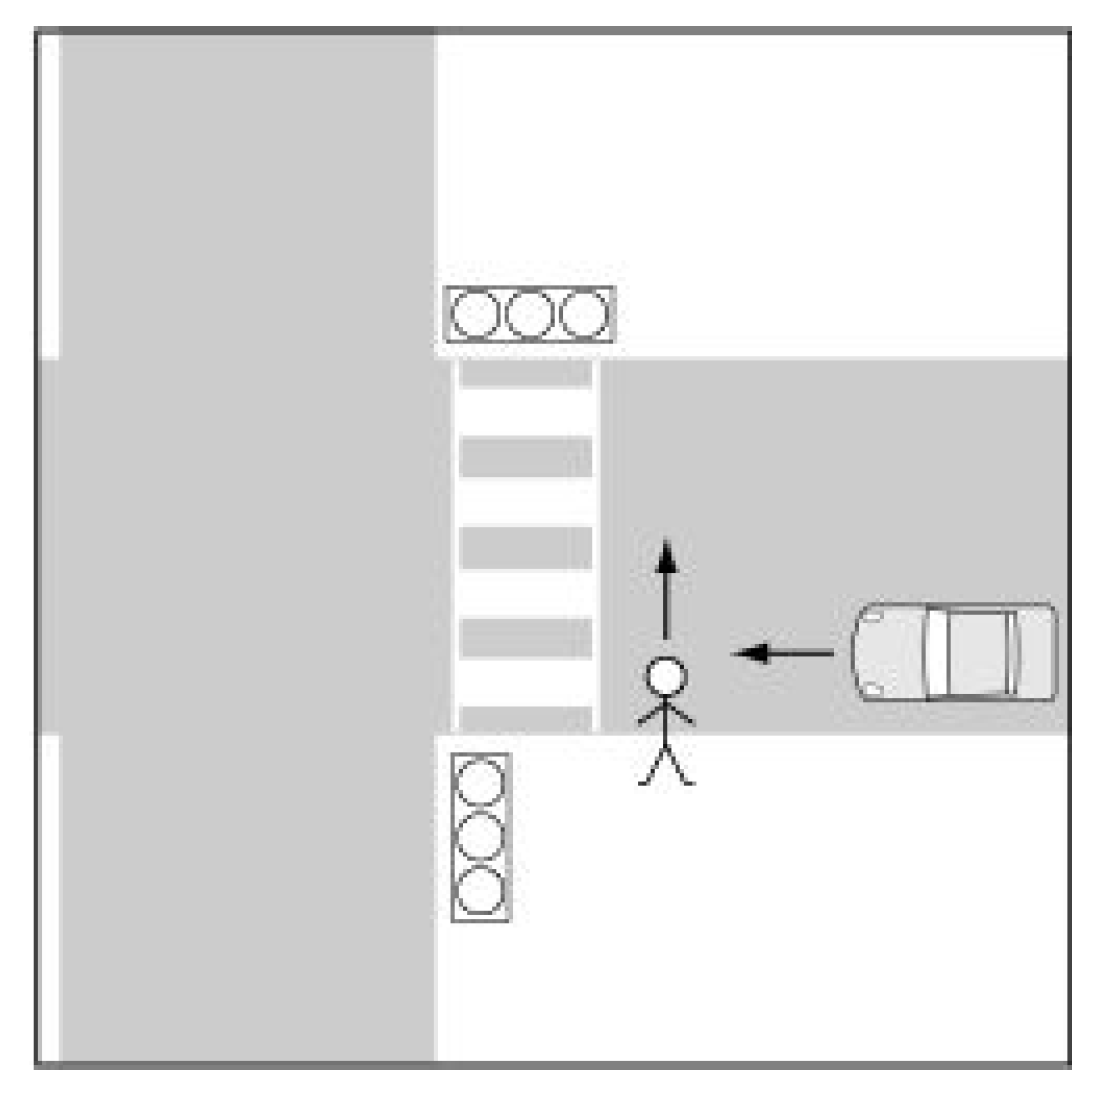
- Crossroad crash involving a car and a pedestrian: The handling of this case at/not at a pedestrian crossing involved taking into consideration different scenarios such as when there is a traffic light, when there is a safe zone, when there is no traffic light, when there is a traffic light near the pedestrian crossing, and when the collision occurs in front of the pedestrian crossing (as illustrated in Figure 7).
- Crossroad crash involving two cars: This involved taking into consideration different scenarios such as intersection with a traffic light, intersection without traffic lights when there is a one-way violation when there is a stop sign or a red blinking/yellow blinking signal, and when there is a priority road;
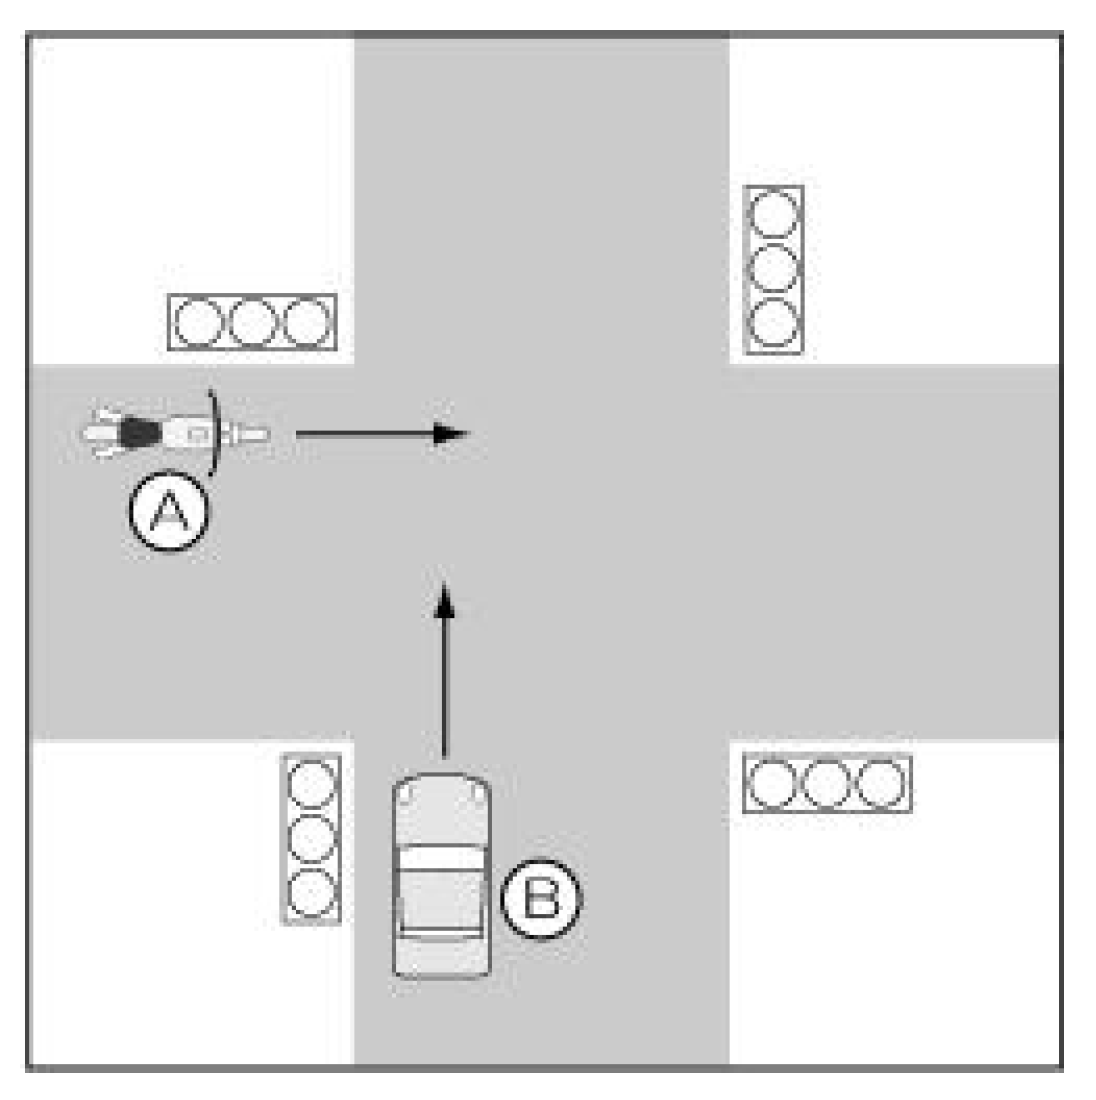
- Crossroad crash involving a car and a motorcycle: This involved taking into consideration scenarios such as an intersection with a traffic light (as illustrated in Figure 8), an intersection of the same width without traffic lights, the motorcyclist clearly driving on a wide road, the car’s driver clearly driving on a wide road the motorcyclist driving on a priority road, the car’s driver driving on a priority road, the car’s driver violates one way, and the motorcyclist violates one way.
10.2. Data Collection
The improvement on our system is to enable it to handle more crossroad crash cases, we, therefore, need to collect data and train our models to recognize more elements in a given crash video dashcam footage. The data collection will be divided into four phases:
- Data collection for the crash time detection model: There are some existing car crash video datasets that were made from YouTube videos such as CCD [18], DAD [36], and A3D [17]. These datasets contain all kinds of accidents with many scenarios. The ones of interest to us (containing crashes at intersections involving two cars /a car and a pedestrian /a car and a motorcycle with the vehicle from which the video was recorded involved) are very few. Therefore, because we can get only a few videos from these datasets, as we did before, we will look for additional crossroad crash videos on YouTube to have more data.
- Data collection for the traffic sign detection model: We will also collect data to train the existing traffic sign detection model to recognize not only traffic lights but also other traffic signs such as stop signs, pedestrian crosswalks, and speed limit signs.
- Data collection for the knowledge system: To enable the system to evaluate responsibilities within the new cases that will be implemented, we will need to collect more road rules and degree of negligence assessment logic to improve our knowledge base. A simple example may be:
“When the crash occurs near the pedestrian crossing with a traffic light, the degree of negligence is 70% for the pedestrian crossing in red and 30% for the car with green traffic light”.
- Data augmentation for all the collected data.
10.3. Crash Simulation Sandbox Implementation
Getting video data of different crash cases with various scenarios is a complex and time-consuming task. Some crash cases’ video data are easily available because they usually occur. On the other hand, some others are rare or very difficult to get because of their low level of occurrence. To have enough data in our dataset that are related to cases that our system will handle, we have to simulate some crashes for some cases that we cannot find enough data for. Therefore, we plan to add to our system a simulation sandbox that will enable a user to simulate a crash in 3D and generate a crash video that can be used to train our crash time detection model.
11. Conclusions
With the objective of shortening the decision time for the police and claims adjusters when a car crash occurs, we have developed a support system based on object detection and a rule-based knowledge system. The system can recognize a crash within a video, detect and list all traffic signs within that video and finally assess the responsibilities of actors within the crash. The reasoning for responsibility assessment should be explainable. Therefore, with the implementation of a rule-based knowledge system in the system, users can easily understand the responsibility assessment’s reasons and confirm the results. To detect a crash within a video, we discovered that the simple application of existing vehicle detection models would result in wrong detections with many false positives. To solve the issue, we made our proposed model to take into consideration only the collided vehicle, its shape, and its position within the video. Moreover, because most of the existing sources of datasets related to car crashes or publicly available datasets are generally from surveillance cameras or from driving recorders of vehicles that are not necessarily involved in the crash, we built a custom dataset that fulfilled all the system’s requirements. It was one of the most time-consuming tasks to complete the system’s implementation. During the experimentation, results showed that the system performs well when the light’s condition and the visibility of collided objects are good, and when traffic lights’ view distances are close. That makes the system depends on the visibility of objects to perform well.
For improvement, we plan to train our crash time detection model with more data in different crossroad crash cases and train the traffic sign detection model with more traffic signs (stop signs, speed limit signs, etc.).
Author Contributions
Conceptualization, H.A.Y.; Data curation, H.A.Y.; Investigation, H.A.Y.; Methodology, H.A.Y. and T.O.; Project administration, H.A.Y. and T.O.; Software, H.A.Y.; Supervision, M.K. and T.O.; Validation, H.A.Y., M.K. and T.O.; Writing—original draft, H.A.Y.; Writing—review & editing, H.A.Y., M.K. and T.O. All authors have read and agreed to the published version of the manuscript.
Funding
This work was supported in part by JSPS KAKENHI Grant Numbers JP19K12266, JP22K18006. The APC was partially funded by JSPS KAKENHI Grant Number JP19K12266.
Data Availability Statement
Not applicable.
Conflicts of Interest
The authors declare no conflict of interest.
References
- World Health Organization. Global Status Report on Road Safety 2018; Technical Report; World Health Organization: Geneva, Switzerland, 2018. [Google Scholar]
- Bucsuházy, K.; Matuchová, E.; Zůvala, R.; Moravcová, P.; Kostíková, M.; Mikulec, R. Human factors contributing to the road traffic accident occurrence. Transp. Res. Procedia 2020, 45, 555–561. [Google Scholar] [CrossRef]
- Studer, L.; Paglino, V.; Gandini, P.; Stelitano, A.; Triboli, U.; Gallo, F.; Andreoni, G. Analysis of the Relationship between Road Accidents and Psychophysical State of Drivers through Wearable Devices. Appl. Sci. 2018, 8, 1230. [Google Scholar] [CrossRef] [Green Version]
- Ditcharoen, A.; Chhour, B.; Traikunwaranon, T.; Aphivongpanya, N.; Maneerat, K.; Ammarapala, V. Road traffic accidents severity factors: A review paper. In Proceedings of the 2018 5th International Conference on Business and Industrial Research (ICBIR), Bangkok, Thailand, 17–18 May 2018; pp. 339–343. [Google Scholar] [CrossRef]
- Buss, D.; Abishev, K.; Baltabekova, A. Driver‘s reliability and its effect on road traffic safety. Procedia Comput. Sci. 2019, 149, 463–466. [Google Scholar] [CrossRef]
- Rejoice, B.; Amin, A.; Zala, L. Development of Model for Road Crashes and Identification of Accident Spots. Int. J. Intell. Transp. Syst. Res. 2020, 19, 99–111. [Google Scholar] [CrossRef]
- Chen, Z.; Cao, L.; Wang, Q.; Khattak, H.A. YOLOv5-Based Vehicle Detection Method for High-Resolution UAV Images. Mob. Inf. Syst. 2022, 2022, 1828848. [Google Scholar] [CrossRef]
- Dong, X.; Yan, S.; Duan, C. A lightweight vehicles detection network model based on YOLOv5. Eng. Appl. Artif. Intell. 2022, 113, 104914. [Google Scholar] [CrossRef]
- Song, X.; Gu, W. Multi-objective real-time vehicle detection method based on yolov5. In Proceedings of the 2021 International Symposium on Artificial Intelligence and its Application on Media (ISAIAM), Xi’an, China, 21–23 May 2021; pp. 142–145. [Google Scholar] [CrossRef]
- Yawovi, H.A.; Ozono, T.; Shintani, T. Crossroad Accident Responsibility Prediction Based on a Multi-agent System. In Proceedings of the 2020 International Conference on Computational Science and Computational Intelligence (CSCI), Las Vegas, NV, USA, 16–18 December 2020; pp. 579–584. [Google Scholar] [CrossRef]
- Chen, Q.; Song, X.; Yamada, H.; Shibasaki, R. Learning deep representation from big and heterogeneous data for traffic accident inference. In Proceedings of the 30th AAAI Conference on Artificial Intelligence, Phoenix, AZ, USA, 12–17 February 2016. [Google Scholar]
- Lin, L.; Wang, Q.; Sadek, A.W. A novel variable selection method based on frequent pattern tree for real-time traffic accident risk prediction. Transp. Res. Part Emerg. Technol. 2015, 55, 444–459. [Google Scholar] [CrossRef]
- Wenqi, L.; Dongyu, L.; Menghua, Y. A model of traffic accident prediction based on convolutional neural network. In Proceedings of the 2017 2nd IEEE International Conference on Intelligent Transportation Engineering (ICITE), Singapore, 1–3 September 2017; pp. 198–202. [Google Scholar]
- Park, S.h.; Kim, S.m.; Ha, Y.g. Highway traffic accident prediction using VDS big data analysis. J. Supercomput. 2016, 72, 2815–2831. [Google Scholar] [CrossRef]
- Shi, Q.; Abdel-Aty, M. Big Data applications in real-time traffic operation and safety monitoring and improvement on urban expressways. Transp. Res. Part C Emerg. Technol. 2015, 58, 380–394. [Google Scholar] [CrossRef]
- You, J.; Wang, J.; Guo, J. Real-time crash prediction on freeways using data mining and emerging techniques. J. Mod. Transp. 2017, 25, 116–123. [Google Scholar] [CrossRef] [Green Version]
- Yao, Y.; Xu, M.; Wang, Y.; Crandall, D.J.; Atkins, E.M. Unsupervised Traffic Accident Detection in First-Person Videos. arXiv 2019, arXiv:1903.00618. [Google Scholar]
- Bao, W.; Yu, Q.; Kong, Y. Uncertainty-based Traffic Accident Anticipation with Spatio-Temporal Relational Learning. arXiv 2020, arXiv:2008.00334. [Google Scholar]
- Suzuki, T.; Kataoka, H.; Aoki, Y.; Satoh, Y. Anticipating Traffic Accidents with Adaptive Loss and Large-scale Incident DB. arXiv 2018, arXiv:1804.02675. [Google Scholar]
- Wang, C.; Yulu, D.; Zhou, W.; Geng, Y. A Vision-Based Video Crash Detection Framework for Mixed Traffic Flow Environment Considering Low-Visibility Condition. J. Adv. Transp. 2020, 2020, 9194028. [Google Scholar] [CrossRef] [Green Version]
- Sultani, W.; Chen, C.; Shah, M. Real-world Anomaly Detection in Surveillance Videos. arXiv 2018, arXiv:1801.04264. [Google Scholar]
- Yun, K.; Jeong, H.; Yi, K.M.; Kim, S.W.; Choi, J.Y. Motion Interaction Field for Accident Detection in Traffic Surveillance Video. In Proceedings of the 2014 22nd International Conference on Pattern Recognition, Stockholm, Sweden, 24–28 August 2014; pp. 3062–3067. [Google Scholar] [CrossRef]
- Cao, G.; Michelini, J.; Grigoriadis, K.; Ebrahimi, B.; Franchek, M. Cluster-based correlation of severe braking events with time and location. J. Intell. Transp. Syst. 2015, 20, 187–192. [Google Scholar] [CrossRef]
- Fawcett, L.; Thorpe, N.; Matthews, J.; Kremer, K. A novel Bayesian hierarchical model for road safety hotspot prediction. Accid. Anal. Prev. 2017, 99, 262–271. [Google Scholar] [CrossRef]
- Kumar, S.; Toshniwal, D. A data mining approach to characterize road accident locations. J. Mod. Transp. 2016, 24, 62–72. [Google Scholar] [CrossRef] [Green Version]
- D’Andrea, E.; Ducange, P.; Lazzerini, B.; Marcelloni, F. Real-Time Detection of Traffic From Twitter Stream Analysis. IEEE Trans. Intell. Transp. Syst. 2015, 16, 1–15. [Google Scholar] [CrossRef]
- Gu, Y.; Qian, S.; Chen, F. From Twitter to detector: Real-time traffic incident detection using social media data. Transp. Res. Part C Emerg. Technol. 2016, 67, 321–342. [Google Scholar] [CrossRef]
- Brylev, I.; Evtiukov, S.; Evtiukov, S. Problems of calculating the speed of two-wheeled motor vehicles in an accident. Transp. Res. Procedia 2018, 36, 84–89. [Google Scholar] [CrossRef]
- Garcia, C.; Viallon, V.; Bouaoun, L.; Martin, j.l. Prediction of responsibility for drivers and riders involved in injury road crashes. J. Saf. Res. 2019, 70. [Google Scholar] [CrossRef] [PubMed] [Green Version]
- LI, W.X.; Mahadevan, V.; Vasconcelos, N. Anomaly Detection and Localization in Crowded Scenes. IEEE Trans. Pattern Anal. Mach. Intell. 2013, 36, 18–32. [Google Scholar] [CrossRef] [Green Version]
- Liu, W.; Luo, W.; Lian, D.; Gao, S. Future Frame Prediction for Anomaly Detection - A New Baseline. In Proceedings of the 2018 IEEE/CVF Conference on Computer Vision and Pattern Recognition, Salt Lake City, UT, USA, 18–23 June 2018; pp. 6536–6545. [Google Scholar] [CrossRef] [Green Version]
- Lu, C.; Shi, J.; Jia, J. Abnormal Event Detection at 150 FPS in MATLAB. In Proceedings of the 2013 IEEE International Conference on Computer Vision, Sydney, Australia, 1–8 December 2013; pp. 2720–2727. [Google Scholar] [CrossRef]
- Fang, J.; Yan, D.; Qiao, J.; Xue, J. DADA: A Large-scale Benchmark and Model for Driver Attention Prediction in Accidental Scenarios. arXiv 2019, arXiv:1912.12148. [Google Scholar]
- Herzig, R.; Levi, E.; Xu, H.; Gao, H.; Brosh, E.; Wang, X.; Globerson, A.; Darrell, T. Spatio-Temporal Action Graph Networks. In Proceedings of the 2019 IEEE/CVF International Conference on Computer Vision Workshop (ICCVW), Seoul, Korea, 27–28 October 2019; pp. 2347–2356. [Google Scholar] [CrossRef] [Green Version]
- Yu, F.; Chen, H.; Wang, X.; Xian, W.; Chen, Y.; Liu, F.; Madhavan, V.; Darrell, T. BDD100K: A Diverse Driving Dataset for Heterogeneous Multitask Learning. arXiv 2018, arXiv:1805.04687. [Google Scholar]
- Chan, F.H.; Chen, Y.T.; Xiang, Y.; Sun, M. Anticipating Accidents in Dashcam Videos. In Proceedings of the Computer Vision—ACCV 2016; Lai, S.H., Lepetit, V., Nishino, K., Sato, Y., Eds.; Springer International Publishing: Cham, Switzerland, 2017; pp. 136–153. [Google Scholar] [CrossRef]
- Radu, V.; Nan, M.; Trascau, M.; Iancu, D.T.; Ghita, A.S.; Florea, A.M. Car crash detection in videos. In Proceedings of the 2021 23rd International Conference on Control Systems and Computer Science (CSCS), Bucharest, Romania, 26–28 May 2021; pp. 127–132. [Google Scholar] [CrossRef]
- Lu, Z.; Wei, Z.; Zhang, S.; Wang, C. A New Video-Based Crash Detection Method: Balancing Speed and Accuracy Using a Feature Fusion Deep Learning Framework. J. Adv. Transp. 2020, 2020, 8848874. [Google Scholar] [CrossRef]
- Ghahremannezhad, H.; Shi, H.; Liu, C. Real-Time Accident Detection in Traffic Surveillance Using Deep Learning. In Proceedings of the 2022 IEEE International Conference on Imaging Systems and Techniques (IST), Kaohsiung, Taiwan, 21–23 June 2022. [Google Scholar] [CrossRef]
- Yun, Y.; Gu, I.Y.H.; Bolbat, M.; Khan, Z.H. Video-based detection and analysis of driver distraction and inattention. In Proceedings of the 2014 International Conference on Signal Processing and Integrated Networks (SPIN), Noida, India, 20–21 February 2014; pp. 190–195. [Google Scholar] [CrossRef]
- Dingus, T.A.; Guo, F.; Lee, S.; Antin, J.F.; Perez, M.; Buchanan-King, M.; Hankey, J. Driver crash risk factors and prevalence evaluation using naturalistic driving data. Proc. Natl. Acad. Sci. USA 2016, 113, 2636–2641. [Google Scholar] [CrossRef] [Green Version]
- Sharma, S.; Sebastian, S. IoT based car accident detection and notification algorithm for general road accidents. Int. J. Electr. Comput. Eng. 2019, 9, 4020–4026. [Google Scholar] [CrossRef]
- Yuan, Z.; Zhou, X.; Yang, T. Hetero-ConvLSTM: A Deep Learning Approach to Traffic Accident Prediction on Heterogeneous Spatio-Temporal Data. In Proceedings of the 24th ACM SIGKDD International Conference on Knowledge Discovery & Data Mining (KDD ’18), London, UK, 19–23 August 2018; Association for Computing Machinery: New York, NY, USA, 2018; pp. 984–992. [Google Scholar] [CrossRef]
- Theofilatos, A. Incorporating real-time traffic and weather data to explore road accident likelihood and severity in urban arterials. J. Saf. Res. 2017, 61, 9–21. [Google Scholar] [CrossRef]
- Lin, T.Y.; Maire, M.; Belongie, S.; Bourdev, L.; Girshick, R.; Hays, J.; Perona, P.; Ramanan, D.; Zitnick, C.L.; Dollár, P. Microsoft COCO: Common Objects in Context. arXiv 2014, arXiv:1405.0312. [Google Scholar]
- Redmon, J.; Divvala, S.; Girshick, R.; Farhadi, A. You Only Look Once: Unified, Real-Time Object Detection. arXiv 2015, arXiv:1506.02640. [Google Scholar]
- Snegireva, D.; Perkova, A. Traffic Sign Recognition Application Using Yolov5 Architecture. In Proceedings of the 2021 International Russian Automation Conference (RusAutoCon), Sochi, Russia, 5–11 September 2021; pp. 1002–1007. [Google Scholar] [CrossRef]
- Liu, W.; Wang, Z.; Zhou, B.; Yang, S.; Gong, Z. Real-time Signal Light Detection based on Yolov5 for Railway. IOP Conf. Ser. Earth Environ. Sci. 2021, 769, 042069. [Google Scholar] [CrossRef]
- Murthy, J.S.; Siddesh, G.M.; Lai, W.-C.; Parameshachari, B.D.; Patil, S.N.; Hemalatha, K.L. ObjectDetect: A Real-Time Object Detection Framework for Advanced Driver Assistant Systems Using YOLOv5. Wirel. Commun. Mob. Comput. 2022, 2022, 9444360. [Google Scholar] [CrossRef]
- Sun, F.; Li, Z.; Li, Z. A traffic flow detection system based on YOLOv5. In Proceedings of the 2021 2nd International Seminar on Artificial Intelligence, Networking and Information Technology (AINIT), Shanghai, China, 15–17 October 2021; pp. 458–464. [Google Scholar] [CrossRef]
- Snegireva, D.; Kataev, G. Vehicle Classification Application on Video Using Yolov5 Architecture. In Proceedings of the 2021 International Russian Automation Conference (RusAutoCon), Sochi, Russia, 5–11 September 2021; pp. 1008–1013. [Google Scholar] [CrossRef]
Figure 1.
The architecture of the system with the collaboration between the three modules.

Figure 2.
Screenshot of the graphic interface of the system with the steps the user has to follow to get the final result of the responsibilities’ evaluation with the list of the top-20 results displayed on the right side as thumbnails within a scrollable panel and the selected best result displayed on the left side.

Figure 3.
Example of one of the head-on crash images obtained after the extraction and the resizing phase.
Figure 3.
Example of one of the head-on crash images obtained after the extraction and the resizing phase.

Figure 4.
Illustration of a crash involving two vehicles at an intersection with traffic lights in Japan (left side driving).
Figure 4.
Illustration of a crash involving two vehicles at an intersection with traffic lights in Japan (left side driving).

Figure 5.
Comparison graph for evaluation results with and without user intervention.

Figure 6.
Example of the detection of the vehicle’s shadow as the collided object.

Figure 7.
Illustration of a crash involving a car and a pedestrian at an intersection in front of the pedestrian crossing. From https://jiko-online.com/wp/kasitu/jiho-oudan/ (accessed on 8 September 2022).
Figure 7.
Illustration of a crash involving a car and a pedestrian at an intersection in front of the pedestrian crossing. From https://jiko-online.com/wp/kasitu/jiho-oudan/ (accessed on 8 September 2022).

Figure 8.
Illustration of a crash involving a car and a motorcycle at an intersection with traffic lights. From https://jiko-online.com/wp/kasitu/jiba-tyoku/ (accessed on 8 September 2022).
Figure 8.
Illustration of a crash involving a car and a motorcycle at an intersection with traffic lights. From https://jiko-online.com/wp/kasitu/jiba-tyoku/ (accessed on 8 September 2022).


Table 1.
Results of the crash detection model’s accuracy.
| Collided Object & | Environment Conditions | |||
|---|---|---|---|---|
| Performance of the | Day | Night | ||
| Model (Accuracy) | Good Visibility | Bad Visibility | Good Visibility | Bad Visibility |
| Car | 93.5% | 39.9% | 82.1% | 32.5% |
| Van | 91.2% | 38.7% | 80.6% | 28.3% |
| Truck | 91.5% | 38.3% | 79.8% | 28.1% |
Table 2.
Results of the traffic sign detection model’s accuracy.
| View Distance & | Environment Conditions | |||
|---|---|---|---|---|
| Performance of the | Day | Night | ||
| Model (Accuracy) | Good Visibility | Bad Visibility | Good Visibility | Bad Visibility |
| Far | 83.5% | 40.6% | 68.1% | 30.2% |
| Close | 91.2% | 40.8% | 69.5% | 30.6% |
| Very close | 97.3% | 41.2% | 73.1% | 36.8% |
Table 3.
Results of the module in evaluating responsibilities with user’s manual selection.
| Collided Object & | Environment Conditions | |||
|---|---|---|---|---|
| Performance of the | Day | Night | ||
| Responsibilities’ Evaluation | Good Visibility | Bad Visibility | Good Visibility | Bad Visibility |
| Car | 93% (14/15 videos) | 33% (5/15 videos) | 93% (14/15 videos) | 20% (3/15 videos) |
| Van | 93% (14/15 videos) | 26% (4/15 videos) | 80% (12/15 videos) | 20% (3/15 videos) |
| Truck | 80% (12/15 videos) | 33% (5/15 videos) | 80% (12/15 videos) | 13% (2/15 videos) |
Table 4.
Results of the module in evaluating responsibilities without user’s manual selection.
| Collided Object & | Environment Conditions | |||
|---|---|---|---|---|
| Performance of the | Day | Night | ||
| Responsibilities’ Evaluation | Good Visibility | Bad Visibility | Good Visibility | Bad Visibility |
| Car | 66% (10/15 videos) | 20% (3/15 videos) | 53% (8/15 videos) | 13% (2/15 videos) |
| Van | 60% (9/15 videos) | 13% (2/15 videos) | 46% (7/15 videos) | 13% (2/15 videos) |
| Truck | 53% (8/15 videos) | 20% (3/15 videos) | 46% (7/15 videos) | 6% (1/15 videos) |
Publisher’s Note: MDPI stays neutral with regard to jurisdictional claims in published maps and institutional affiliations. |
© 2022 by the authors. Licensee MDPI, Basel, Switzerland. This article is an open access article distributed under the terms and conditions of the Creative Commons Attribution (CC BY) license (https://creativecommons.org/licenses/by/4.0/).
Share and Cite
MDPI and ACS Style
Yawovi, H.A.; Kikuchi, M.; Ozono, T. Who Was Wrong? An Object Detection Based Responsibility Assessment System for Crossroad Vehicle Collisions. AI 2022, 3, 844-862. https://0-doi-org.brum.beds.ac.uk/10.3390/ai3040051
AMA Style
Yawovi HA, Kikuchi M, Ozono T. Who Was Wrong? An Object Detection Based Responsibility Assessment System for Crossroad Vehicle Collisions. AI. 2022; 3(4):844-862. https://0-doi-org.brum.beds.ac.uk/10.3390/ai3040051
Chicago/Turabian StyleYawovi, Helton Agbewonou, Masato Kikuchi, and Tadachika Ozono. 2022. "Who Was Wrong? An Object Detection Based Responsibility Assessment System for Crossroad Vehicle Collisions" AI 3, no. 4: 844-862. https://0-doi-org.brum.beds.ac.uk/10.3390/ai3040051