
Sterically Stabilized Multilayer Graphene Nanoshells for Inkjet Printed Resistors

1
Department of Mechanical and Aerospace Engineering, George Washington University, Washington, DC 20052, USA
2
NextFlex, Advanced Technologies Group, San Jose, CA 95131, USA
3
Department of Chemistry, George Washington University, Washington, DC 20052, USA
*
Author to whom correspondence should be addressed.
Electron. Mater. 2021, 2(3), 394-412; https://0-doi-org.brum.beds.ac.uk/10.3390/electronicmat2030027
Submission received: 10 August 2021
/
Revised: 30 August 2021
/
Accepted: 8 September 2021
/
Published: 14 September 2021
(This article belongs to the Special Issue Feature Papers of Electronic Materials)
Abstract
:In the field of printed electronics, there is a pressing need for printable resistors, particularly ones where the resistance can be varied without changing the size of the resistor. This work presents ink synthesis and printing results for variable resistance, inkjet-printed patterns of a novel and sustainable carbon nanomaterial—multilayer graphene nanoshells. Dispersed multilayer graphene nanospheres are sterically stabilized by a surfactant (Triton X100), and no post-process is required to achieve the resistive functionality. A surface tension-based adsorption analysis technique is used to determine the optimal surfactant dosage, and a geometric model explains the conformation of adsorbed surfactant molecules. The energetic interparticle potentials between approaching particles are modeled to assess and compare the stability of sterically and electrostatically stabilized multilayer graphene nanoshells. The multilayer graphene nanoshell inks presented here show a promising new pathway toward sustainable and practical printed resistors that achieve variable resistances within a constant areal footprint without post-processing.
1. Introduction
The flexible electronics industry is well on its way to becoming mainstream. Flexible electronics have appealing characteristics, such as thin, lightweight, and conformable form factors, low-cost manufacturing, environmentally friendly materials, and rapid prototyping. The unique characteristics of flexible electronic platforms promise transformative and disruptive improvements in many applications ranging from aerospace and defense [1] to human- [2,3,4,5,6,7] and structural-health monitoring [8,9] and distributed sensor systems [10,11,12].
Flexible electronics device manufacturing requires depositing a functional material in a specified pattern on a flexible substrate. Printing processes are well-suited for such deposition if the desired functional material can be made in the form of an ink. However, there are critical materials, processing, and device structure challenges for printable, flexible electronics.
From a materials selection and processing perspective, ink formulations for printing techniques require stable nanoparticle dispersions or chemical precursors. To convert one to the other after deposition necessitates a post-process that often restricts substrate material selection due to the limited thermal stability of flexible substrate materials [13]. The post-process commonly consists of an annealing step [14,15,16] via thermal [14,15], xenon flash lamp [17], laser [18], or microwave [15,19] treatments. In addition to limiting substrate material options, the post-processes are also time-consuming, presenting a possible bottleneck in an otherwise fast manufacturing method. Some promising solutions to this issue include a built-in, room-temperature sintering mechanism triggered by the increasing concentration of a latent, destabilizing agent during solvent evaporation [20], overprinting with a destabilizing material [21], and chemical welding induced by capillary condensation of an oxidizing agent at nanoparticle interfaces [22].
A key materials selection challenge is the choice of ink particle stabilization. For nanoparticle based inkjet inks, the long-term stability of dispersed nanoparticles against agglomeration, sedimentation, and chemical reaction is paramount. There are two stability mechanisms for colloidal particles: electrostatic and steric. Electrostatically stabilized inks may not require an energy-intensive post-process. However, the stabilization mechanism is limited in terms of a maximum possible solid loading, and it is highly sensitive to changes in ionic strength [23,24]. Steric stabilization is widely used in commercial ink formulations because of its thermodynamic nature (as opposed to the kinetic nature of electrostatic stabilization). As particles approach each other, terminally attached surfactant molecules or polymers either compress, reducing the density and number of available chain conformations, or interpenetrate, increasing the local osmotic pressure. The result of both effects is an increased free energy and strongly repulsive force. The primary drawback of steric stabilization for electronic material inks is that the steric stabilizing material additive must be removed after ink deposition to enable the intended material functionality (e.g., electrical conduction) [23].
A critical device structure challenge for printed electronics is the availability of resistive structures. Although the development of several material ink systems with varying functionalities is ongoing [25], incorporating passive components, such as inductors and resistors is still done via surface mount component placement processes (SMT). Notably, a process for integrating complementary metal-oxide-semiconductor (CMOS)-based die on flexible substrates has been demonstrated [26,27]. Nonetheless, SMT processes complicate and slow production. Furthermore, placing rigid, passive components on a flexible substrate can lead to mechanical stress at the attachment location, creating possible failure points. Some stretchable and flexible resistive components have been fabricated with eutectic gallium-indium embedded into polydimethylsiloxane (PDMS) substrates [28], but high resistance requires thin, long, serpentine wires that would occupy valuable space on a circuit board. Screen-printed, carbon-based resistors have been demonstrated with some tunability in the range of 10 kΩ to 1.5 MΩ [29], but they require a large area for high resistances. Rather than altering resistor geometry, Chang et al. produced sheet resistances between 3.3 kΩ/sq and 800 kΩ/sq by mixing high and low resistivity carbon-based screen-printing inks [30]. The conductive polymer poly (3,4-ethylenedioxythiophene):poly (styrene sulfonate) (PEDOT:PSS) has also been used to print resistors that achieve resistances that span five orders of magnitude by modifying ink formulation rather than altering component geometry [31,32]. The realization of printed resistors will require new materials with a wide range of electrical properties.
This work addresses both the materials and device structure challenges in printed electronics by investigating printed resistors made from sterically stabilized nanoparticle inks. The study focuses on multilayer graphene nanoshells (MGNS), a novel and environmentally friendly carbon nanomaterial. MGNS are composed of concentric shells of graphene (an onion-like structure surrounding a hollow core).
For sufficient particle stability, the dosage of the steric stabilizing material is critically important. We determined the optimal dosage for the steric stabilizing material, Triton X100, with a surface tension-based adsorption analysis and developed a geometric model to understand the conformation of adsorbed molecules. The difference in efficacy between sterically and electrostatically stabilized MGNS particles was shown by modeling and comparing the interparticle energetic potentials between approaching particles stabilized by either mechanism. Highly concentrated MGNS inks were inkjet printed onto paper substrates and electrically characterized.
Our results challenge the paradigm that a high solid loading is prerequisite for usable inks and that steric stabilizing materials must always be removed after material deposition. The inkjet-printed MGNS structures show promise for printed resistors with varying resistance controlled by a combination of ink solid loading and the number of printed layers rather than component geometry.
2. Materials and Methods
2.1. Nanoparticle Structure
MGNS are synthesized from the laser pyrolysis of biochar, a byproduct of a biofuel synthesis process from biomass. Because the energy content of the biofuel more than offsets the energy required to synthesize MGNS, their production is carbon-negative [23,33]. Since a wide range of low-cost biomass can be used—such as agricultural, forestry, and municipal residue—MGNS production is potentially inexpensive. The diameter of MGNS particles can be varied between ~20 nm up to several hundred nanometers with appropriate changes to synthesis conditions. Because MGNS are hollow, they have a high specific surface area. Scanning (SEM) and transmission (TEM) electron microscope micrographs of MGNS used in this work are shown in Figure 1 below. MGNS are chemically stable and have a high electrical resistivity. Chemical modification to add functionality (such as improved adhesion to a substrate) is possible with conventional synthesis methods.
2.2. Surface Tension-Based Adsorption Analysis
The dosage of steric stabilizing material is critical because particle surfaces must be fully covered for the stabilization mechanism to be effective [23]. If the dosage is too low, particles will not be fully covered, and polymer chains can lie flat (rather than orienting outward from the particle) or even desorb when particles approach each other, allowing particles to aggregate. If the dosage is too high, free stabilizing material in the liquid can induce bridging flocculation. Both effects reduce ink stability. For surfactant stabilizing materials like Triton X100, the proper dosage can be ascertained with a surface tension analysis [34] by taking the difference of the critical micelle concentrations (c.m.c.) of surfactant solutions with and without dispersed MGNS.
Surface tension was measured with a drop shape analyzer (KRŰSS, DSA25, Hamburg, Germany) using the pendant drop technique. Videos of droplets being pushed out of a syringe at a rate of 2 µL/min were recorded at 30 frames per second up to the point of breakoff. Measurements were taken from the 10–15 frames prior to droplet breakoff.
2.3. Ink Synthesis
Inks were prepared in 5–10 mL lots by mixing liquid components (DI water—Sigma-Aldrich; ethylene glycol—Sigma-Aldrich, anhydrous, assay: 99.8%; Triton X100—Sigma-Aldrich, X100—100 ML) together via horn ultrasonication for a total time of ~5 min (Fisher Scientific FB-505). A 1/8” horn was used at 20% amplitude with a 10 s on and off pulse. All sonication was carried out in an ice bath to mitigate solvent evaporation due to heat generation. An excess mass of MGNS (1.5× the expected maximum solid loading) was then added and dispersed by horn ultrasonication for ~2 h with the aforementioned settings. Large agglomerates remaining in the resulting dispersion were removed with centrifugation (Beckman Coulter, Avanti JXN-30 centrifuge, JA-30.50 Ti rotor, Pasadena, CA, USA) with details reported elsewhere [24].
The critical properties for inkjet printing are the viscosity and surface tension. For our inkjet printing system (Dimatix DMP 2831, FUJIFILM Dimatix, Inc., Santa Clara, CA, USA) the printable range of viscosity is between 2 and 30 (optimally 10–12) mPa-s. For surface tension, the printable range is between 28 and 42 mN/m.
Viscosity was measured with a rotational rheometer (TA Instruments HR-2, New Castle, DE, USA) in a cone/plate configuration with a 40 mm, 1° cone geometry at a constant shear rate and temperature of 1000 s−1 and 25 °C, respectively. Because ethylene glycol is hygroscopic, a solvent trap was used to limit sample exposure to air with neat ethylene glycol as the trapping solvent.
2.4. Inkjet Printing
MGNS inks were deposited onto paper substrates with a piezoelectrically-driven inkjet printer (Dimatix DMP 2831, Santa Clara, CA, USA). The nozzle diameter of the printheads was 21.5 µm; the cartridge height was 0.25 mm. The driving waveform consisted of four segments with a maximum amplitude of 12 V, and the jetting frequency was 5 kHz. The platen temperature was at ambient temperature (~21 °C). The droplet spacing was 15 µm. All other settings are described in detail in [23]. Line patterns were printed onto a gloss photo paper (Canon GP-701, Tokyo, Japan) in varying numbers of layers and dried at room temperature under ambient conditions.
2.5. Electrical Characterization
Current and voltage measurements of inkjet-printed lines of MGNS were made with a 4-point probe station and a multimeter (Keithley 2450, Keithley Instruments, Cleveland, OH, USA) on lines printed on a glossy photo paper (Canon GP-701, Tokyo, Japan) with silver-painted electrodes (Pelco Conductive silver paint, Ted Pella 16062-15, Ted Pella, Inc., Redding, CA, USA). The multimeter was set to source voltage from −40 to +40 V and measure current. Resistivity was calculated as with the electrical resistivity and Re the electrical resistance. Length measurements, Le, were taken from microscope images of the line segments using ImageJ. The cross-sectional area of each line segment, A, was estimated from profilometer (KLA P7, Milpitas, CA, USA) measurements across the lines. The area under each profile was determined numerically using the numpy.trapz function in Python which integrates using the composite trapezoidal rule.
2.6. Geometric Model
A geometric adsorption model based on the physical dimensions of the surfactant molecule and the geometry of an idealized MGNS particle provides insight about the conformation of adsorbed surfactant. The footprint of an adsorbed Triton X100 molecule was estimated from the bond lengths within the assumed anchoring groups, which consisted of the phenyl ring, the first oxygen in the polyethylene oxide chain, and the first butyl group in the 4-(1,1,3,3-tetramethylbutyl) group. The assumed anchor group footprint is shown in Figure 2.
The length, width, and area of the anchoring group are as follows:
where:
- : carbon-carbon bond length in phenyl group;
- : carbon-hydrogen bond length in phenyl group;
- : carbon-oxygen bond length;
- : carbon-carbon bond length (not in phenyl group);
- Lftprnt: molecule footprint length;
- Wftprnt: molecule footprint width;
- Aftprnt: molecule footprint area.
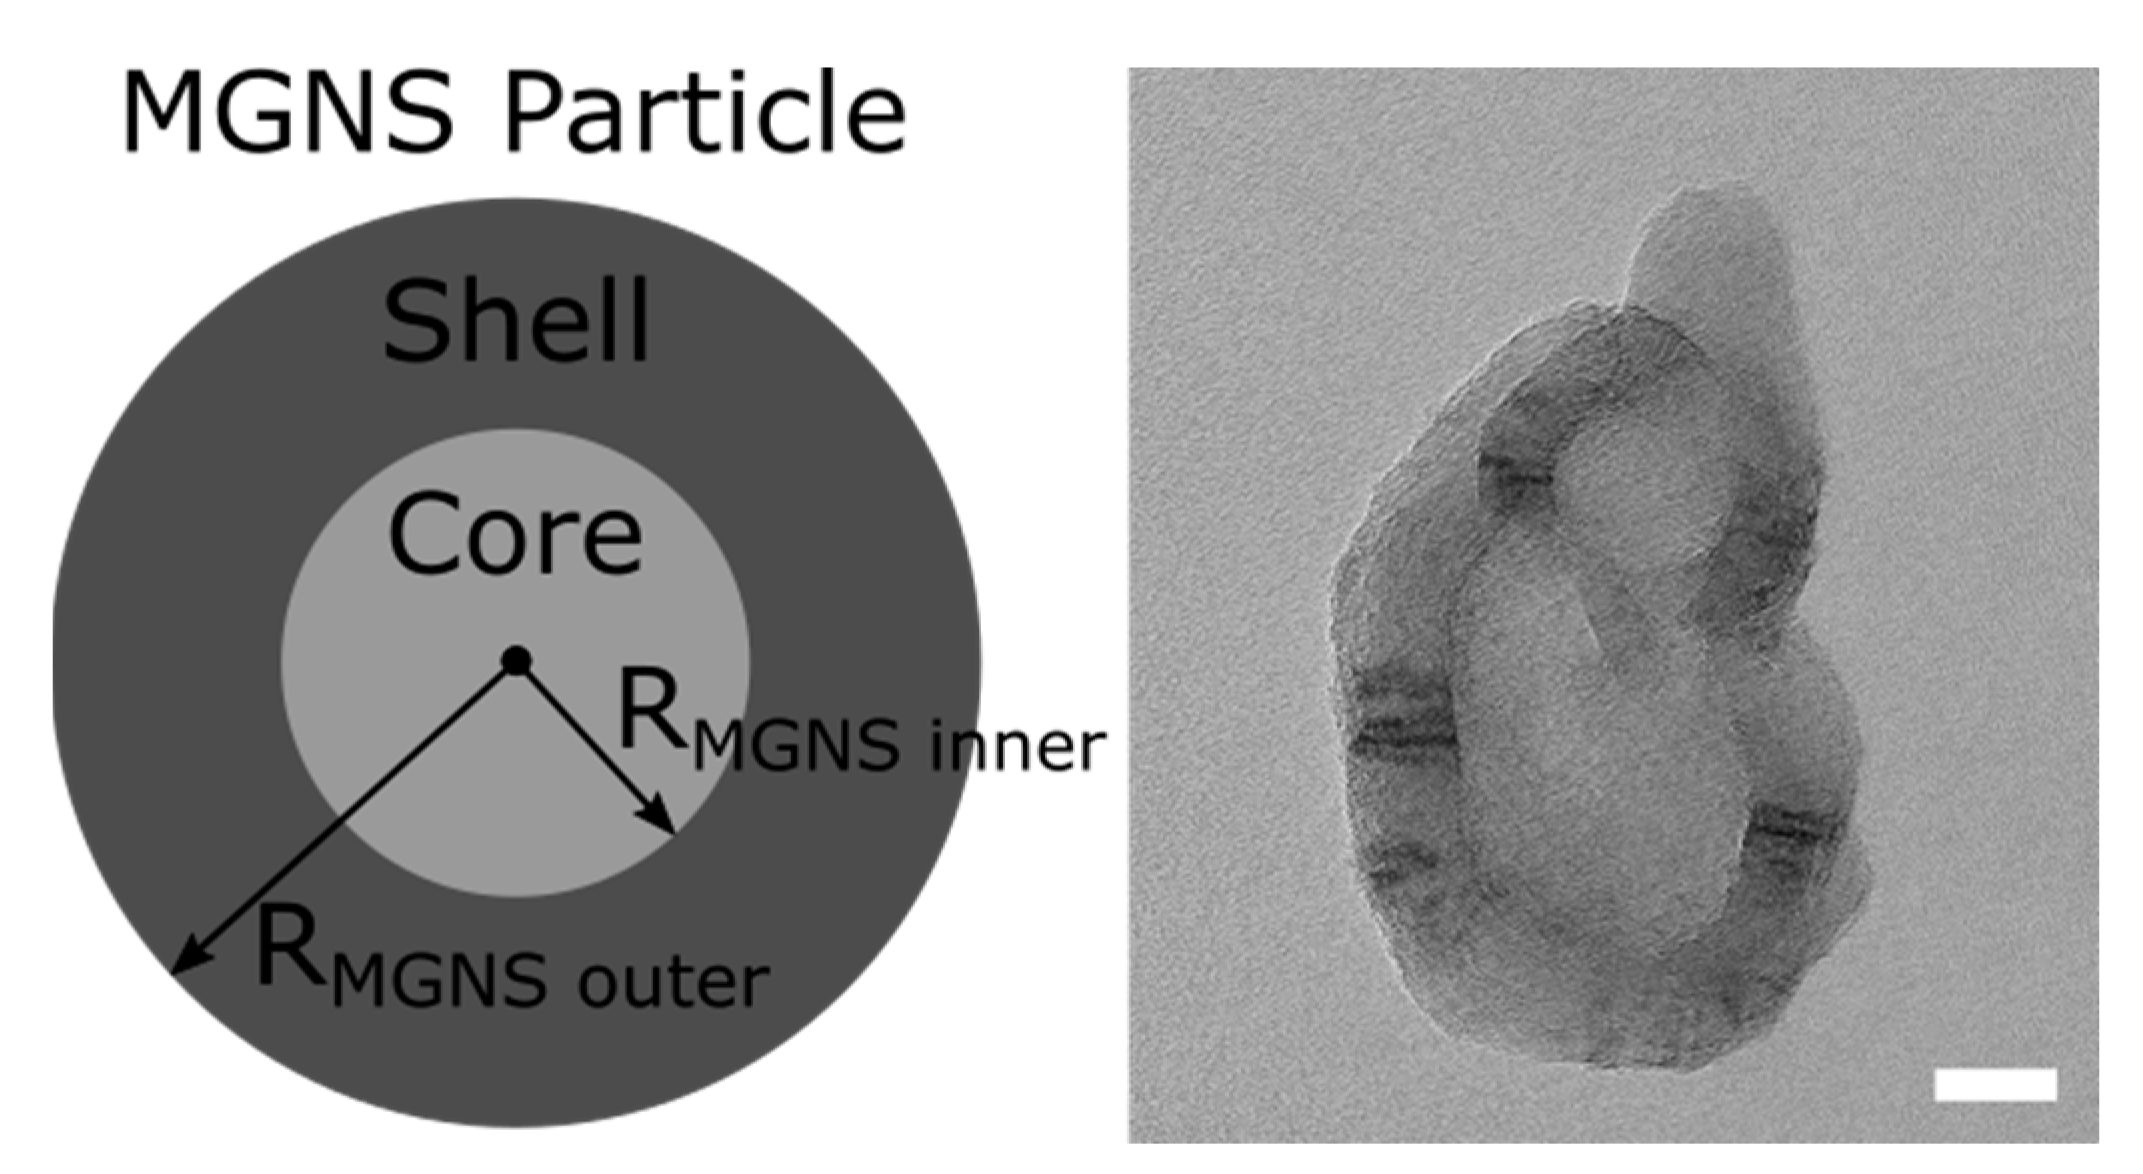
Measuring TEM images of the MGNSs provided geometric parameters. Figure 3 shows a diagram of an idealized MGNS particle next to a sample TEM image from which measurements were taken. A total of thirty-six diameter and thirty-seven wall thickness measurements were taken across seven images resulting in a mean diameter of 47.58 ± 6.91 nm and a mean wall thickness of 11.00 ± 2.30 nm. The diameter and wall thickness in the model were set to 50 nm and 10 nm, respectively. The mass of an individual MGNS particle was calculated by multiplying the solid volume of the idealized MGNS particle (Figure 3, left) with the density of graphite (2230 kg/m3) and adding the mass of the volume of water that could occupy the hollow MGNS core.
The number of molecules adsorbed to an individual MGNS particle was calculated by dividing the surface area of one MGNS particle by the estimated footprint of the anchoring group of Triton X100 Equation (4). Dividing this value by Avogadro’s number and the mass per MGNS particle gives the number of moles per mass of MGNS. Further dividing by the MGNS specific surface area (measured by BET analysis) yields the number of moles per particle surface area Equation (5).
2.7. Inter-Particle Potential Model
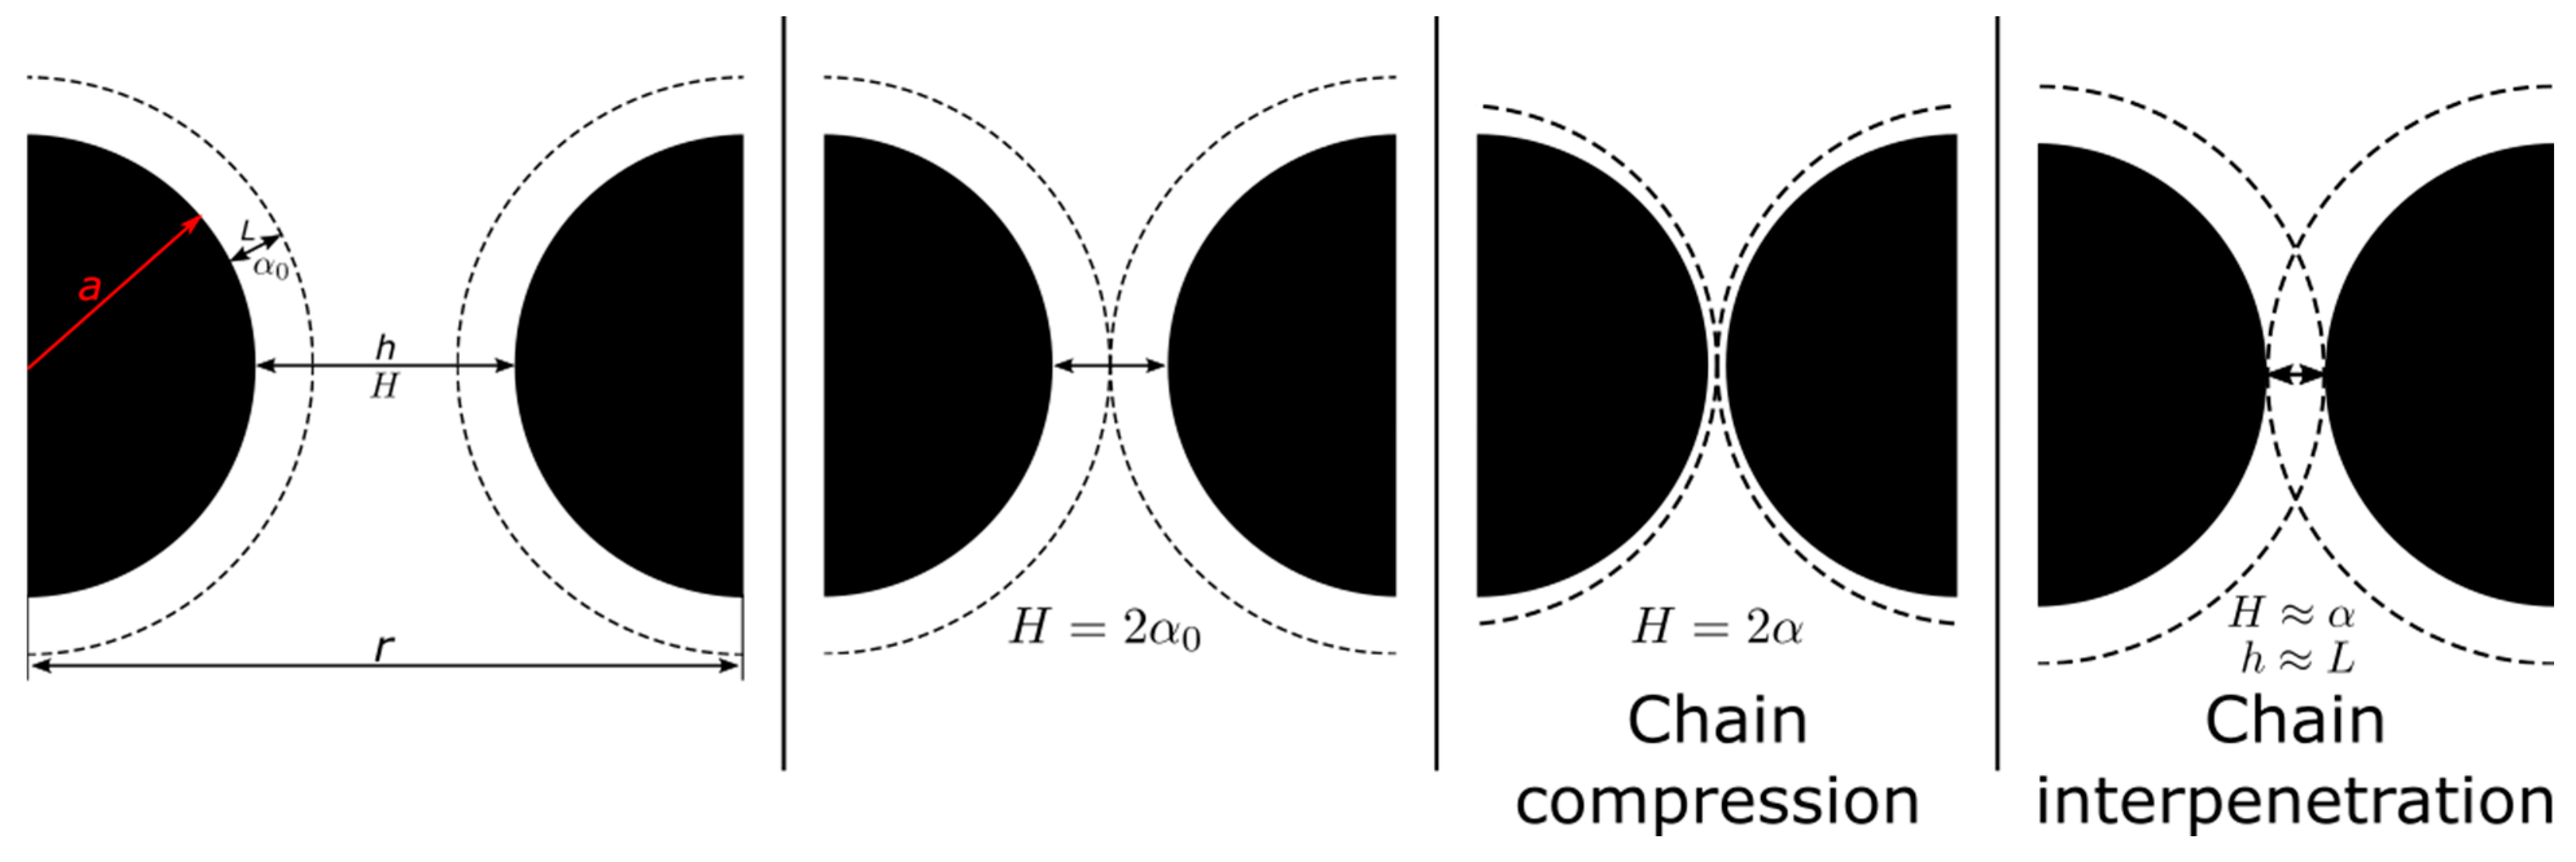
To assess and compare the stability of sterically stabilized MGNS to electrostatically stabilized MGNS, we modeled the interparticle energetic potentials between approaching particles. A diagram of the particle system is shown in Figure 4 below. The black semicircles represent dispersed MGNS particles. The dotted lines represent the thickness of the adsorbed surfactant layer. The third and fourth panels from the left depict chain compression and chain interpenetration, respectively.
The repulsion mechanism between two approaching sterically stabilized particles can be qualitatively illustrated by considering the local osmotic pressure of the stabilizing material in solution, which increases with polymer concentration. Interaction of particles with an adsorbed layer of terminally anchored polymers at separations less than the polymer chain length requires compression or interpenetration of the chains. In either case, the local polymer concentration (and thus osmotic pressure) increases, resulting in a repulsive force [35].
The expression used to evaluate the interparticle potential of sterically stabilized MGNS particles is [35]:
with
and
and the associated equilibrium conditions for (Equation (8)),
and (Equation (9)),
where:
- : interparticle potential;
- : particle radii;
- : particle – particle center separation;
- : particle – particle surface separation;
- number of polymer segments = 9.5 for Triton X100 [];
- : stabilizing segment chain length = 0.6 for poly(oxyethylene) [];
- : polymer segment density;
- polymer segment – segment excluded volume ;
- : physical volume of segment ;
- : surface density of polymer chains = ;
- : full retarded Hamaker constant;
- : adsorbed layer thickness;
- : dimension layer thickness of an isolated adsorbed layer;
- : dimensionless layer thickness;
- : dimensionless particle – particle surface separation;
- : dimensionless surface density of adsorbed polymer;
- : ratio of excluded volume per chain to volume occupied by chain at ideal conditions.
The first term on the right-hand side of Equation (6) yields the repulsive potential between approaching particles. It is developed by minimizing the free energy of interacting adsorbed layers and consists of contributions from the osmotic pressure, as well as the number and density of available polymer chain conformations. The second term on the right-hand side of Equation 6 represents the attractive van der Waals interaction between the sterically stabilized particles. The segment length, l = 0.6 nm, was taken from data for poly(oxyethylene) [35,36], which composes the hydrophilic chain of Triton X100.
The term represents the full retarded Hamaker constant. This analysis uses the non-retarded Hamaker constant. The substitution is justified because the full retarded Hamaker constant decays with increasing particle separation, and the value of the attractive term was several orders of magnitude less than the repulsive term for the range of separation evaluated. The Hamaker constant was calculated for a system of graphite particles separated by DI water [23,24] using the procedure described by Hugh and White [37]. Additional departures from the model are detailed in Appendix A.
3. Results
3.1. Surface Tension Coverage Analysis
The surfactant dosage for full particle coverage was determined from the difference of the critical micelle concentration (c.m.c.) of surfactant solutions with and without dispersed MGNS in ethylene glycol (Figure 5a), DI water (Figure 5b), and a 3:1 mixture of DI water and ethylene glycol (Figure 5c).
The analysis in DI water gave a clear optimal surfactant dosage of 8.7 × 10⁻⁷ mol/mg. In ethylene glycol the difference in surface tension of surfactant solutions with and without dispersed MGNS was ambiguous. This suggests that surfactant adsorption in ethylene glycol is poor, and adsorption is driven primarily by hydrophobic interactions rather than an affinity for the particle’s surface.
Because the rheological properties of ethylene glycol are favorable for inkjet printing and those of water are not, we repeated the analysis in mixtures of DI water and ethylene glycol in order to leverage the good surfactant adsorption behavior in DI water and the favorable rheology of ethylene glycol. Figure 5d shows the surface tension of mixtures of DI water and ethylene glycol with and without a constant concentration of surfactant (0.28 mM) and dispersed MGNS (0.22 mg/mL). The difference in surface tension between the surfactant and MGNS dispersion (solid black circles) and the surfactant only (empty squares) indicates the degree of surfactant adsorption to the MGNS particle surface. Repeating the surface tension analysis in a 3:1 mixture of DI water and ethylene glycol (Figure 5c) gave an optimal surfactant dosage of 7.7 × 10⁻⁷ mol/mg.
3.2. Geometric Absorption Model
The geometric model parameters are shown in Table 1, and the results of the adsorption model are shown in Table 2. All bond lengths were taken from Cordero et al. [38]. The optimal surfactant dosage for full particle surface coverage predicted by our model in DI water was 5.7 × 10⁻⁷ mol/mg or 1.7 × 10⁻⁶ mol/m2. This was approximately 1.5 times less than the value determined from surface tension measurements (8.7 × 10⁻⁷ mol/mg or 2.7 × 10⁻⁶ mol/m2). Model assumptions that could cause the discrepancy were the assumed geometry of MGNS particles or the Triton X100 anchoring group footprint, as well as the mass of individual MGNS particles. It is possible the model-measurement discrepancy results from instances where the surfactant was adsorbed in more than one layer but not a full bi-layer on MGNS particles.
The model used an idealized particle surface area with both inner and outer spherical surfaces of each particle available for adsorption. This was an idealization as many MGNS particles existed as aggregates, and all hollow particles should have had an opening. Both characteristics reduced the actual available surface area (assuming a sufficiently large opening). The exaggerated estimation of surface area would result in an overestimation of the calculated surfactant dosage, which was not the case. Therefore, either the assumed surface area was underestimated in the model (which is unlikely given the observed morphology of MGNS agglomerates in TEM images (Figure 6) and DLS particle size distribution ranging from 45 to 350 nm with an average of 125 nm (Figure S1), or other assumed factors in the model were unrepresentative.
As seen in TEM images (Figure 6), actual MGNS particles differed significantly from the idealized particle in Figure 3, some with graphite structures occupying the idealized hollow core, many existing in agglomerates. Additionally, at least 1% of particles still contain the nickel core from the synthesis process. By neglecting these factors, the model likely underestimated the mass-per-particle, which would result in an exaggerated calculated dosage, which was not the case.
We ran the model backward starting with the optimal dosage determined from the surface tension analysis to calculate the footprint that would be required for an idealized particle fully covered in a monolayer of surfactant molecules. The resulting footprint was 0.16 nm2 compared with 0.24 nm2 from the assumed anchoring group geometry shown in Figure 2. Due to the planar conformation of the phenyl group and the hydrophobic nature of it and the attached hydrocarbon group of the Triton X100 molecule, it was unlikely that the adsorption footprint for anchoring groups was much smaller than the estimated 0.24 nm2. Therefore, adsorption of Triton X100 likely occurred in more than one layer.
3.3. Energetic Potential Model
The interparticle potential for MGNS particles sterically stabilized by Triton X100 is shown and compared with the potential obtained for electrostatically stabilized MGNS in Figure 7.
The magnitude of the interparticle potential for sterically stabilized MGNS was much greater than that for the electrostatically stabilized MGNS. There was no potential global minimum as particle separation nears zero for sterically stabilized MGNS like there was for electrostatically stabilized MGNS. This is due to the thermodynamic (rather than kinetic) nature of the steric stability mechanism. Electrostatically stabilized MGNS are kinetically stable at the local potential minimum at h ≈ 40 nm because with enough kinetic energy they can overcome the potential peak (red curve in Figure 7 (bottom)) and drop into the potential global minimum as h→0, becoming irreversibly agglomerated. It was interesting that the peak of the electrostatically stabilized interparticle potential occurred very close to h = 2 L ≈ 6.8 nm; we believe this to be mere coincidence as choosing a steric stabilizing material with a longer chain length would result in a larger layer thickness, L.
The energetic potential model results corroborate the assertion that the steric stabilization mechanism is more effective at stabilizing liquid-matrix solid-particle dispersion systems than the electrostatic stabilization mechanism. The understanding of optimal dosage, conformation of adsorbed molecules, and inter-particle energetic potentials facilitated MGNS ink synthesis and subsequent printing, as described in the following section.
3.4. Ink Properties
The important physical properties for inkjet printing—viscosity and surface tension—are listed in Table 3 below with the ink density and the maximum MGNS solid loading. The Z value is a figure of merit for inkjet droplet ejection and is defined by the inverse Ohnesorge number. The printable range of Z defined in literature is 1 < Z < 14 [39,40,41] and was representative of our experience printing the inks. The DI water-based ink, with a Z value well outside the printable range, was nearly impossible to print; most attempts resulting primarily in spraying. The ink made with the DI water/ethylene glycol mixture had a Z value just outside the printable range, and printing was successful but challenging, requiring frequent adjustments to printing parameters.
3.5. Printing Results
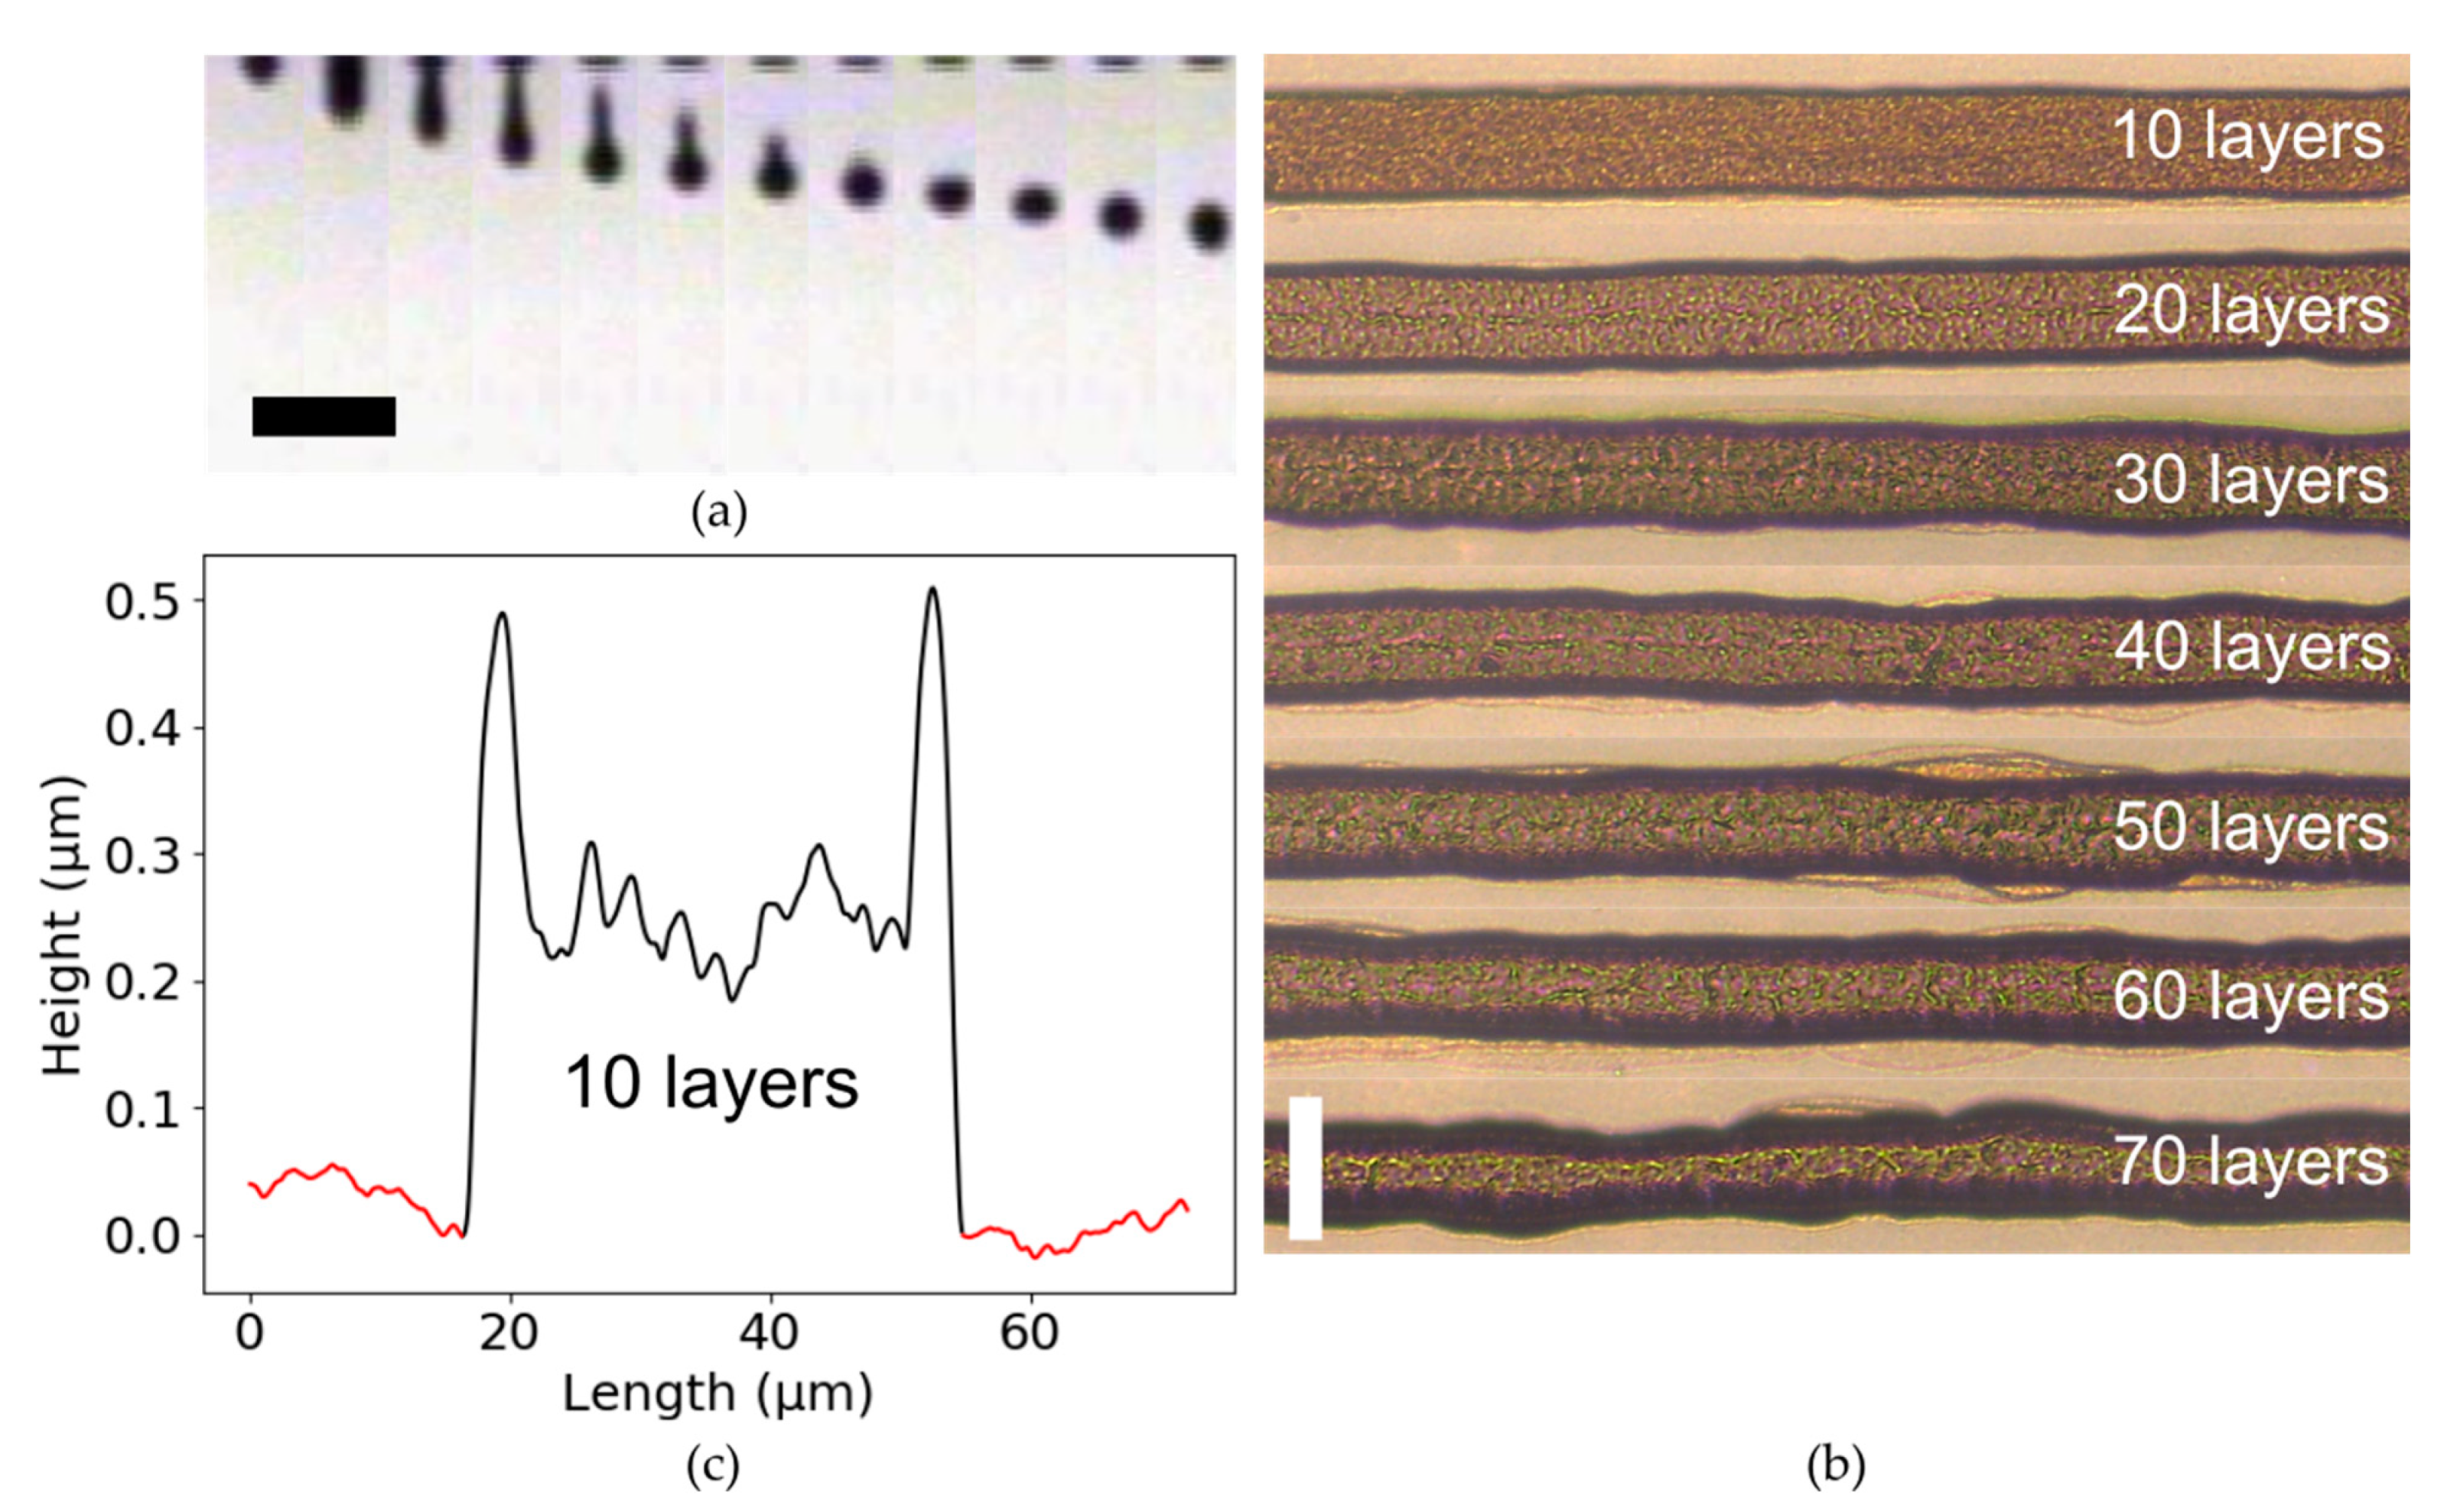
The droplet ejection sequence for the highly loaded MGNS ink in the DI water/ethylene glycol mixture is shown below in Figure 8a. The leading edge of the primary droplet slowed to a near stop as the liquid ligament initiated break-off from the meniscus before recombination. This was primarily due to the low ink viscosity that limited the driving voltage that could be applied before spraying occurred. A lower driving voltage results in a reduced velocity, and, thus, momentum of the ejected column of liquid that must overcome the upward pull from surface tension.
The MGNS ink was printed onto a gloss photopaper in varying numbers of layers (Figure 8b). The widths of the lines were approximately 40 µm. The printed lines exhibited the coffee ring effect: a majority of solute was deposited at the periphery of a droplets’ footprint during evaporation. The edges of printed lines became darker and wider with increased numbers of layers while the center of the line remains the same opacity. The effect was confirmed with profilometry measurements of the printed lines shown in Figure 8c. The tall spikes at the edges of the profile are indicative of the coffee ring effect. The red portion indicates data that were excluded from cross-sectional area calculations because it shows the surface of the paper substrate, not the printed feature.
3.6. Electrical Characteristics
The electrical resistivity of sterically and electrostatically stabilized, highly loaded MGNS inks as a function of the number of printed layers is shown in Figure 9. The electrical resistivity of the electrostatically stabilized MGNS ink in ethylene glycol was ~9 Ω-cm for 60 printed layers and for the sterically stabilized MGNS ink in a DI water/ethylene glycol mixture was it was ~11 Ω-cm. The resistivity of printed MGNS decreased sharply between 10 and 30 layers as the percolation threshold was reached, after which the resistivity began to plateau. For fewer than 20 printed layers, the lower resistivity of the sterically stabilized ink may have been due to its higher solid loading (steric: 4.83 mg/mL, electrostatic: 4.15 mg/mL). After 30 printed layers the relationship flipped, and the resistivity of the electrostatically stabilized ink was less than the sterically stabilized ink, which could be due to residual stabilizing material between MGNS particles.
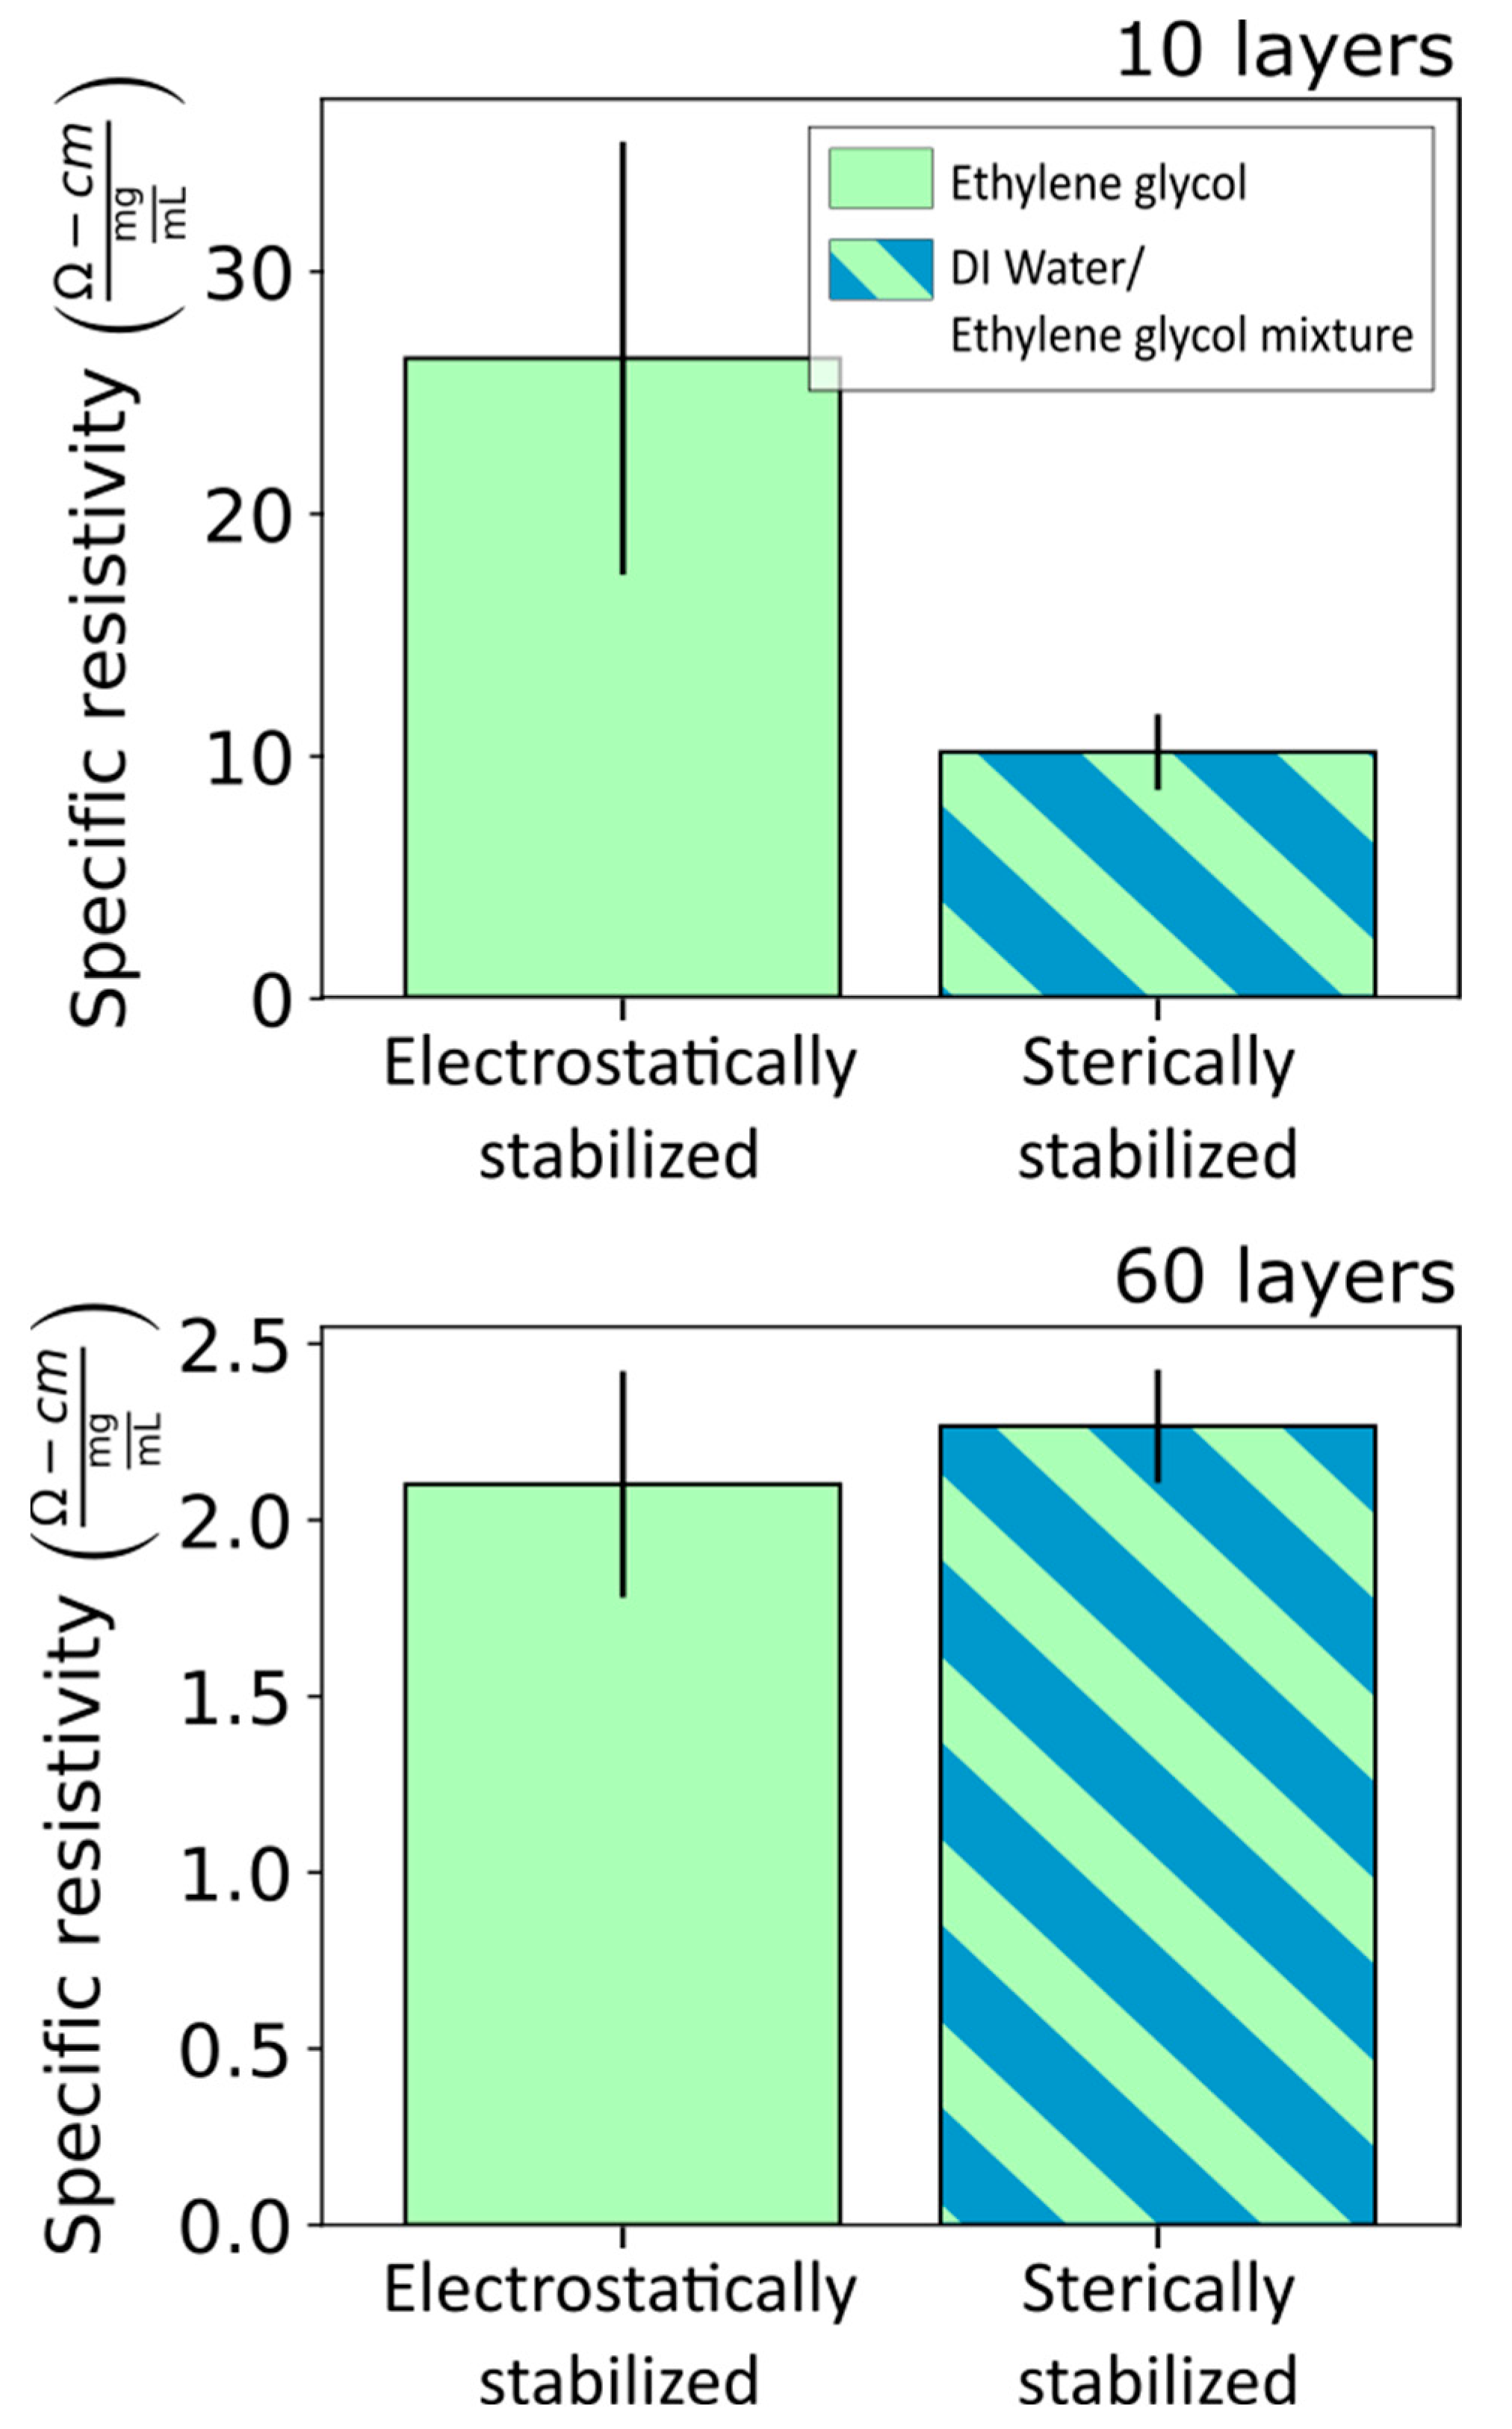
The comparison of electrical resistivity of the two inks shown in Figure 9 could be misleading because the solid loading of the inks are different (sterically stabilized = 4.83 mg/mL, electrostatically stabilized = 4.15 mg/mL). With a higher solid loading, more MGNS particles were deposited per printed layer, which would tend to reduce the electrical resistivity. To eliminate the effect of ink solid loading and the number of printed layers, we normalized the resistivity by the ink solid loading and compared the resistivity for 10 and 60 printed layers of each ink (Figure 10). Considering the data in this way reveals that, for few printed layers, the resistivity of the sterically stabilized ink is indeed less than that of the electrostatically stabilized ink. This is unexpected because for other nanoparticle-based electronic inks, residual stabilizing material electrically insulates particles from each other, restricting or even preventing electrical percolation.
One explanation for a reduced resistivity for few printed layers of the sterically stabilized ink compared to the electrostatically stabilized ink is the residual surfactant material increased the connectivity and contact area between particles (see Figure S2). The electrical contact between MGNS particles with surfactant present could operate as a pair of resistors in parallel. Compared with a dry contact between MGNS particles, the contact resistance will be reduced even if the resistivity of the surfactant is much higher than MGNS because the surfactant adds a conduction path. Although the electrical resistivity of Triton X100 has not been characterized here, there are a few reports of electrical conductivity enhancement in carbon nanotube composite materials [42] and liquid solutions [43]. An alternative explanation could be, as the deposited ink dried, water molecules that solvated the poly(oxyethylene) chains began to vaporize, causing the polymer chains to constrict and draw particles together, forming more particle-particle contacts and, thus, lowering film resistivity. Additionally, since the adsorption mechanism is primarily driven by hydrophobic interactions, residual surfactant molecules may desorb from dried particles, allowing particles to contact each other directly.
A common assumption is that an ideal ink should have a solid-loading high enough that full functionality of the deposited material is achieved with a single printing pass. However, these results demonstrate the potential utility of inks with lower solid-loadings for controlling the resistance of spatially constrained components, which is important when considering circuit layout [32].
4. Conclusions
This work assessed the applicability of a novel and environmentally-friendly carbon nanomaterial made from biochar for inkjet-printed resistors. MGNS particles were sterically stabilized with the non-ionic surfactant, Triton X100. Triton X100 adsorbed well to the surface of MGNS particles in DI water, but not in ethylene glycol, suggesting the adsorption mechanism was primarily driven by hydrophobic interactions rather than an affinity for the particle surface. Because the physical properties of water-based inks were not conducive for inkjet printing, a DI water/ethylene glycol mixture was used as the base liquid to leverage both the good surfactant adsorption behavior in water and the favorable rheological properties of ethylene glycol. The dosage required for full coverage was determined through a surface tension analysis. A geometric adsorption model revealed that adsorption occurred in more than one monolayer. The energetic potential between approaching MGNS particles stabilized with Triton X100 was modeled and compared to the energetic potential of electrostatically stabilized MGNS particles. The analysis showed the thermodynamic nature of steric stabilization improves long-term particle stability dramatically when compared with the kinetic nature of electrostatic stabilization.
Highly loaded MGNS inks were synthesized in DI water and a DI water/ethylene glycol mixture, and the latter was inkjet-printed. With few printed layers, residual steric stabilizing material reduced the resistivity of printed lines by either increasing the number and area of interparticle contacts or by drawing particles together as the deposited material dried. By varying the number of printed layers rather than component geometry, resistivities ranging over two orders of magnitude—1.09 × 10² to 7.1 Ω·cm—were demonstrated for the synthesized MGNS inks. The MGNS inks presented here show a promising new pathway toward sustainable and practical printed resistors because they do not require a post-process to achieve functionality, and the number of printed layers and the solid-loading can be varied to adjust the resistance of spatially constrained printed resistors.
Supplementary Materials
The following are available online at https://0-www-mdpi-com.brum.beds.ac.uk/article/10.3390/electronicmat2030027/s1, Figure S1: MGNS particle size distribution, Figure S2: Depiction of contact area between bare and surfactant coated MGNS particles and the resulting resistance network.
Author Contributions
Conceptualization, M.O. and S.L.; methodology, M.O.; investigation, M.O. and D.A.; resources, D.A.; writing—original draft preparation, M.O.; writing—review and editing, M.O., S.L., and M.J.W.; visualization, M.O.; supervision, S.L. and M.J.W.; funding acquisition, S.L. All authors have read and agreed to the published version of the manuscript.
Funding
This research was funded by U.S. Department of Energy/National Nuclear Security Administration, grant number Capital/DOE Alliance Center (DE-NA0003858), and The George Washington University, grant number Cross-Disciplinary Research Fund.
Institutional Review Board Statement
Not applicable.
Informed Consent Statement
Not applicable.
Data Availability Statement
The data underlying this article will be shared on reasonable request from the corresponding author.
Acknowledgments
Thanks to Chris Brantner, Yigal Lilach and Patrick Johnson for support in the GW Nanotechnology and Imaging Center.
Conflicts of Interest
The authors declare no conflict of interest. The funders had no role in the design of the study; in the collection, analyses, or interpretation of data; in the writing of the manuscript, or in the decision to publish the results.
Appendix A
Apart from the use of the non-retarded Hamaker constant, a second departure from the full model described by Equation 6 was an extrapolation of Φfp for h > 1.09 L. Values of Φfp for h > 1.09 L could not be evaluated due to the shape of the equilibrium condition for —Equation (10)—with our system parameters. The curves in Figure A1 show the shape of Equation (10) for increasing particle separation, h (light to dark blue). There were no positive roots of f(α) for h > 1.09 L.
Figure A1.
Variation of the equilibrium condition for Equation (10) for increasing particle separation, h (from light to dark blue). The darkest line represents h = 1.09 L. For h > 1.09 L there are no positive roots for f(α) and thus no solutions for the equilibrium condition.
Figure A1.
Variation of the equilibrium condition for Equation (10) for increasing particle separation, h (from light to dark blue). The darkest line represents h = 1.09 L. For h > 1.09 L there are no positive roots for f(α) and thus no solutions for the equilibrium condition.

The region of Φfp for h > 1.09 L was extrapolated and forced to zero at h ≥ 2 L using a spline interpolation with scipy.interpolate.InterpolatedUnivariateSpline of order 3 in Python. Forcing the function Φfp to zero for h ≥ 2 L was physically reasonable since there should be vanishingly low repulsion between adsorbed layers before they make contact (h < 2 L). The extrapolation of Φfp is shown in Figure A2.
Figure A2.
Extrapolation of Φfp for h ≥ 2 L. Inset shows a zoomed in vertical axis.

References
- Sairajan, K.K.; Aglietti, G.S.; Mani, K.M. A Review of Multifunctional Structure Technology for Aerospace Applications. Acta Astronaut. 2016, 120, 30–42. [Google Scholar] [CrossRef]
- Wang, X.; Liu, Z.; Zhang, T. Flexible Sensing Electronics for Wearable/Attachable Health Monitoring. Small 2017, 13, 1602790. [Google Scholar] [CrossRef]
- Liu, Y.; Pharr, M.; Salvatore, G.A. Lab-on-Skin: A Review of Flexible and Stretchable Electronics for Wearable Health Monitoring. ACS Nano 2017, 11, 9614–9635. [Google Scholar] [CrossRef]
- Luo, N.; Dai, W.; Li, C.; Zhou, Z.; Lu, L.; Poon, C.C.Y.; Chen, S.-C.; Zhang, Y.; Zhao, N. Flexible Piezoresistive Sensor Patch Enabling Ultralow Power Cuffless Blood Pressure Measurement. Adv. Funct. Mater. 2016, 26, 1178–1187. [Google Scholar] [CrossRef]
- Amjadi, M.; Kyung, K.-U.; Park, I.; Sitti, M. Stretchable, Skin-Mountable, and Wearable Strain Sensors and Their Potential Applications: A Review. Adv. Funct. Mater. 2016, 26, 1678–1698. [Google Scholar] [CrossRef]
- Khan, Y.; Garg, M.; Gui, Q.; Schadt, M.; Gaikwad, A.; Han, D.; Yamamoto, N.A.D.; Hart, P.; Welte, R.; Wilson, W.; et al. Flexible Hybrid Electronics: Direct Interfacing of Soft and Hard Electronics for Wearable Health Monitoring. Adv. Funct. Mater. 2016, 26, 8764–8775. [Google Scholar] [CrossRef]
- Santhiago, M.; Corrêa, C.C.; Bernardes, J.S.; Pereira, M.P.; Oliveira, L.J.M.; Strauss, M.; Bufon, C.C.B. Flexible and Foldable Fully-Printed Carbon Black Conductive Nanostructures on Paper for High-Performance Electronic, Electrochemical, and Wearable Devices. ACS Appl. Mater. Interfaces 2017, 9, 24365–24372. [Google Scholar] [CrossRef]
- Zhang, Y.; Anderson, N.; Bland, S.; Nutt, S.; Jursich, G.; Joshi, S. All-Printed Strain Sensors: Building Blocks of the Aircraft Structural Health Monitoring System. Sens. Actuators A Phys. 2017, 253, 165–172. [Google Scholar] [CrossRef] [Green Version]
- Hu, Y.; Rieutort-Louis, W.; Sanz-Robinson, J.; Huang, L.; Glisic, B.; Sturm, J.C.; Wagner, S.; Verma, N. Large-Scale Sensing System Combining Large-Area Electronics and CMOS ICs for Structural-Health Monitoring. IEEE J. Solid State Circuits 2014, 49, 513–523. [Google Scholar] [CrossRef]
- Brandon, E.; West, W.; Zhou, L.; Jackson, T.; Theriot, G.; Devine, R.A.B.; Binkley, D.; Verma, N.; Crawford, R. Flexible Electronics for Space Applications. MRS Proc. 2004, 814, I9.7. [Google Scholar] [CrossRef] [Green Version]
- Mattoni, B.; Pagliaro, F.; Gugliermetti, L.; Bisegna, F.; Cellucci, L. A Territorial Based Strategy for the Distribution of Sensor Networks in Smart Cities. In Proceedings of the 2015 IEEE 15th International Conference on Environment and Electrical Engineering (EEEIC), Rome, Italy, 10–13 June 2015; pp. 653–658. [Google Scholar]
- Zhan, Y.; Mei, Y.; Zheng, L. Materials Capability and Device Performance in Flexible Electronics for the Internet of Things. J. Mater. Chem. C 2014, 2, 1220–1232. [Google Scholar] [CrossRef]
- MacDonald, W.A.; Looney, M.K.; MacKerron, D.; Eveson, R.; Adam, R.; Hashimoto, K.; Rakos, K. Latest Advances in Substrates for Flexible Electronics. J. Soc. Inf. Disp. 2007, 15, 1075–1083. [Google Scholar] [CrossRef]
- Ahn, B.Y.; Duoss, E.B.; Motala, M.J.; Guo, X.; Park, S.-I.; Xiong, Y.; Yoon, J.; Nuzzo, R.G.; Rogers, J.A.; Lewis, J.A. Omnidirectional Printing of Flexible, Stretchable, and Spanning Silver Microelectrodes. Science 2009, 323, 1590. [Google Scholar] [CrossRef] [PubMed] [Green Version]
- Perelaer, J.; de Gans, B.-J.; Schubert, U.S. Ink-Jet Printing and Microwave Sintering of Conductive Silver Tracks. Adv. Mater. 2006, 18, 2101–2104. [Google Scholar] [CrossRef]
- Sivaramakrishnan, S.; Chia, P.-J.; Yeo, Y.-C.; Chua, L.-L.; Ho, P.K.-H. Controlled Insulator-to-Metal Transformation in Printable Polymer Composites with Nanometal Clusters. Nat. Mater. 2007, 6, 149–155. [Google Scholar] [CrossRef]
- Kim, H.-S.; Dhage, S.R.; Shim, D.-E.; Hahn, H.T. Intense Pulsed Light Sintering of Copper Nanoink for Printed Electronics. Appl. Phys. A 2009, 97, 791. [Google Scholar] [CrossRef] [Green Version]
- Ko, S.H.; Pan, H.; Grigoropoulos, C.P.; Luscombe, C.K.; Fréchet, J.M.J.; Poulikakos, D. Air Stable High Resolution Organic Transistors by Selective Laser Sintering of Ink-Jet Printed Metal Nanoparticles. Appl. Phys. Lett. 2007, 90, 141103. [Google Scholar] [CrossRef] [Green Version]
- Perelaer, J.; Klokkenburg, M.; Hendriks, C.E.; Schubert, U.S. Microwave Flash Sintering of Inkjet-Printed Silver Tracks on Polymer Substrates. Adv. Mater. 2009, 21, 4830–4834. [Google Scholar] [CrossRef]
- Grouchko, M.; Kamyshny, A.; Mihailescu, C.F.; Anghel, D.F.; Magdassi, S. Conductive Inks with a “Built-In” Mechanism That Enables Sintering at Room Temperature. ACS Nano 2011, 5, 3354–3359. [Google Scholar] [CrossRef]
- Magdassi, S.; Grouchko, M.; Berezin, O.; Kamyshny, A. Triggering the Sintering of Silver Nanoparticles at Room Temperature. ACS Nano 2010, 4, 1943–1948. [Google Scholar] [CrossRef] [PubMed]
- Yoon, S.-S.; Khang, D.-Y. Room-Temperature Chemical Welding and Sintering of Metallic Nanostructures by Capillary Condensation. Nano Lett. 2016, 16, 3550–3556. [Google Scholar] [CrossRef]
- Orrill, M. Ink Synthesis and Inkjet Printing of Multilayer Graphene Nanoshells. Ph.D Thesis, The George Washington University, Washington, DC, USA, 2020. [Google Scholar]
- Orrill, M.; Abele, D.; Wagner, M.; LeBlanc, S. Ink Synthesis and Inkjet Printing of Electrostatically Stabilized Multilayer Graphene Nanoshells. J. Colloid Interface Sci. 2020, 566, 454–462. [Google Scholar] [CrossRef] [PubMed]
- Herbert, R.; Kim, J.-H.; Kim, Y.S.; Lee, H.M.; Yeo, W.-H. Soft Material-Enabled, Flexible Hybrid Electronics for Medicine, Healthcare, and Human-Machine Interfaces. Materials 2018, 11, 187. [Google Scholar] [CrossRef] [PubMed] [Green Version]
- Zhang, T.; Hou, Z.; Johnson, R.W.; Castillo, L.D.; Moussessian, A.; Greenwell, R.; Blalock, B.J. Flexible Electronics: Thin Silicon Die on Flexible Substrates. IEEE Trans. Electron. Packag. Manuf. 2009, 32, 291–300. [Google Scholar] [CrossRef]
- Leber, D.E.; Meek, B.N.; Leija, S.D.; Wilson, D.G.; Chaney, R.L.; Hackler, D.R. Electromechanical Reliability Testing of Flexible Hybrid Electronics Incorporating FleX Silicon-On-Polymer Ics. In Proceedings of the 2016 IEEE Workshop on Microelectronics and Electron Devices (WMED), Boise, ID, USA, 15 April 2016; pp. 1–4. [Google Scholar]
- Kim, M.; Alrowais, H.; Pavlidis, S.; Brand, O. Size-Scalable and High-Density Liquid-Metal-Based Soft Electronic Passive Components and Circuits Using Soft Lithography. Adv. Funct. Mater. 2017, 27, 1604466. [Google Scholar] [CrossRef]
- Ostfeld, A.E.; Deckman, I.; Gaikwad, A.M.; Lochner, C.M.; Arias, A.C. Screen Printed Passive Components for Flexible Power Electronics. Sci. Rep. 2015, 5, 15959. [Google Scholar] [CrossRef]
- Chang, J.; Zhang, X.; Ge, T.; Zhou, J. Fully Printed Electronics on Flexible Substrates: High Gain Amplifiers and DAC. Org. Electron. 2014, 15, 701–710. [Google Scholar] [CrossRef] [Green Version]
- Jung, S.; Sou, A.; Gili, E.; Sirringhaus, H. Inkjet-Printed Resistors with a Wide Resistance Range for Printed Read-Only Memory Applications. Org. Electron. 2013, 14, 699–702. [Google Scholar] [CrossRef]
- Cao, M.; Jochem, K.; Hyun, W.J.; Francis, L.F.; Frisbie, C.D. Self-Aligned Inkjet Printing of Resistors and Low-Pass Resistor–Capacitor Filters on Roll-to-Roll Imprinted Plastics with Resistances Ranging from 10 to 10 6 Ω. Flex. Print. Electron. 2018, 3, 045003. [Google Scholar] [CrossRef]
- Wagner, M.; Banek, N.; Hays, K. Hollow Carbon Nanosphere Based Secondary Cell Electrodes. U.S. Patent US8262942B2, 11 September 2012. [Google Scholar]
- Matarredona, O.; Rhoads, H.; Li, Z.; Harwell, J.H.; Balzano, L.; Resasco, D.E. Dispersion of Single-Walled Carbon Nanotubes in Aqueous Solutions of the Anionic Surfactant NaDDBS. J. Phys. Chem. B 2003, 107, 13357–13367. [Google Scholar] [CrossRef]
- Russel, W.B.; Saville, D.A.; Schowalter, W.R. Electrostatic Stabilization. In Colloidal Dispersions; Cambridge Monographs on Mechanics; Cambridge University Press: Cambridge, UK, 1989; pp. 168, 310–314. [Google Scholar]
- Brandrup, J.; Immergut, E.H.; Grulke, E.A. Polymer Handbook, 4th ed.; Brandrup, J., Immergut, E.H., Grulke, E.A., Eds.; John Wiley & Sons Inc.: New York, NY, USA, 1999; ISBN 978-0-471-47936-9. [Google Scholar]
- Hough, D.B.; White, L.R. The Calculation of Hamaker Constants from Liftshitz Theory with Applications to Wetting Phenomena. Adv. Colloid Interface Sci. 1980, 14, 3–41. [Google Scholar] [CrossRef]
- Cordero, B.; Gómez, V.; Platero-Prats, A.E.; Revés, M.; Echeverría, J.; Cremades, E.; Barragán, F.; Alvarez, S. Covalent Radii Revisited. Dalton Trans. 2008, 21, 2832–2838. [Google Scholar] [CrossRef] [PubMed]
- Jang, D.; Kim, D.; Moon, J. Influence of Fluid Physical Properties on Ink-Jet Printability. Langmuir 2009, 25, 2629–2635. [Google Scholar] [CrossRef] [PubMed]
- Derby, B. Inkjet Printing of Functional and Structural Materials: Fluid Property Requirements, Feature Stability, and Resolution. Annu. Rev. Mater. Res. 2010, 40, 395–414. [Google Scholar] [CrossRef]
- Reis, N.; Derby, B. Ink Jet Deposition of Ceramic Suspensions: Modeling and Experiments of Droplet Formation. MRS Proc. 2000, 625, 117. [Google Scholar] [CrossRef]
- Xin, F.; Xu, G.Z. The Effect of Triton® X-100 on CNT/PP Composite’s Electrical Conductivity. Adv. Mater. Res. 2011, 284–286, 1836–1841. [Google Scholar] [CrossRef]
- Sidim, T. Some Physicochemical Properties Of Octylphenol Ethoxylate Nonionics (Triton X-100, Triton X-114 And Triton X-405) And The Temperature Effect On This Properties. Trak. Univ. J. Nat. Sci. 2016, 13, 101–116. [Google Scholar]
Figure 1.
(a) Transmission and (b) scanning electron microscope images of MGNS particles.

Figure 2.
Assumed adsorbed footprint of Triton X011 molecule.

Figure 3.
Diagram of an idealized MGNS particle (left) and a TEM image of an actual MGNS particle (right). Scale bar indicates 10 nm.
Figure 3.
Diagram of an idealized MGNS particle (left) and a TEM image of an actual MGNS particle (right). Scale bar indicates 10 nm.

Figure 4.
System diagram of sterically stabilized MGNS particles for interparticle energetic potential model.
Figure 4.
System diagram of sterically stabilized MGNS particles for interparticle energetic potential model.

Figure 5.
Surface tension as a function of surfactant concentration with (red points) and without (blue triangles) 0.2 mg/mL of dispersed MGNS in (a) ethylene glycol; (b) DI water; (c) a 3:1 mixture of DI water and ethylene glycol; and (d) surface tension of mixtures of DI water and ethylene glycol with and without a constant concentration of surfactant and dispersed MGNS.

Figure 6.
TEM images of individual MGNS particles (top) and larger MGNS agglomerate structures (bottom). Both scale bars indicate 50 nm.
Figure 6.
TEM images of individual MGNS particles (top) and larger MGNS agglomerate structures (bottom). Both scale bars indicate 50 nm.

Figure 7.
Interparticle potential for MGNS sterically stabilized with Triton X100 (top). From left to right, the vertical dashed lines indicate particle separations of 0 L, 1.09 L, and 2 L. The inset diagram shows approaching particles at a particle separation of 2 L. The interparticle potential for sterically stabilized MGNS is compared with the same for an electrostatically stabilized MGNS dispersion obtained from DLVO theory (bottom) [24].

Figure 8.
Droplet ejection sequence (a), printed lines in varying numbers of layers on a gloss photopaper (b), and the measured profile (c) of a highly loaded, sterically stabilized MGNS inks. The red lines of (c) indicate data that was excluded from cross-sectional area calculations. All scale bars indicate 50 µm.

Figure 9.
Resistivity of lines of highly loaded, sterically stabilized (blue) and electrostatically stabilized (red) MGNS inks printed onto a gloss photo paper substrate.
Figure 9.
Resistivity of lines of highly loaded, sterically stabilized (blue) and electrostatically stabilized (red) MGNS inks printed onto a gloss photo paper substrate.

Figure 10.
The resistivity of 10 (top) and 60 (bottom) printed layers of electrostatically and sterically stabilized MGNS inks normalized by their solid loading.
Figure 10.
The resistivity of 10 (top) and 60 (bottom) printed layers of electrostatically and sterically stabilized MGNS inks normalized by their solid loading.


Table 1.
Summary of geometric adsorption model parameters.
| Parameter | Value | Unit |
|---|---|---|
| Triton X100 parameters | ||
| lC-C | 152 | pm |
| lC-O | 142 | pm |
| lC-C Phenyl | 139 | pm |
| lC-H Phenyl | 107 | pm |
| Lftprnt | 572 | pm |
| Wftprnt | 426 | pm |
| Aftprnt | 0.24 | nm2 |
| molar density | 1.71 × 10⁻³ | mol/mL |
| MGNS particle parameters | ||
| RMGNS inner | 15 | nm |
| RMGNS outer | 25 | nm |
| MGNS surface area per particle | 1.1 × 10⁻¹⁴ | m2 |
| MGNS volume per particle | 5.1 × 10⁻²³ | m3 |
| MGNS mass per particle | 1.28 × 10⁻¹⁶ | g/particle |
| MGNS 1 BET surface area | 323 | m2/g |
| ρgraphite | 2230 | kg/m3 |
| ρwater | 997.05 | kg/m3 |
Table 2.
Summary of geometric adsorption model results.
| Result | Model | Surface Tension | Unit | Ratio |
|---|---|---|---|---|
| Optimal dosage | ||||
| DI water | 1.8 × 10⁻⁶ | 2.7 × 10⁻⁶ | mol/m2 | 1.5 |
| 5.7 × 10⁻⁷ | 8.7 × 10⁻⁷ | mol/mg | ||
| DI water/EG mixture | 1.8 × 10⁻⁶ | 2.4 × 10⁻⁶ | mol/m2 | 1.3 |
| 5.7 × 10⁻⁷ | 7.7 × 10⁻⁷ | mol/mg | ||
| Footprint for monolayer | ||||
| DI water | 0.24 | 0.16 | nm2 | 1.5 |
| DI water/EG mixture | 0.24 | 0.18 | nm2 | 1.3 |
Table 3.
Physical properties of MGNS inks stabilized with Triton X100.
| Solvent System | Solid loading (mg/mL) | Viscosity (Pa.s) | Density (kg/m3) | Surface Tension (N/m) | Z = 1/Oh |
|---|---|---|---|---|---|
| water | 5.47 | 8.53 × 10⁻⁴ | 1005 | 3.50 × 10⁻² | 32.2 |
| water/ethylene glycol | 4.83 | 1.68 × 10⁻³ | 1044 | 3.27 × 10⁻² | 16.0 |
Publisher’s Note: MDPI stays neutral with regard to jurisdictional claims in published maps and institutional affiliations. |
© 2021 by the authors. Licensee MDPI, Basel, Switzerland. This article is an open access article distributed under the terms and conditions of the Creative Commons Attribution (CC BY) license (https://creativecommons.org/licenses/by/4.0/).
Share and Cite
MDPI and ACS Style
Orrill, M.; Abele, D.; Wagner, M.J.; LeBlanc, S. Sterically Stabilized Multilayer Graphene Nanoshells for Inkjet Printed Resistors. Electron. Mater. 2021, 2, 394-412. https://0-doi-org.brum.beds.ac.uk/10.3390/electronicmat2030027
AMA Style
Orrill M, Abele D, Wagner MJ, LeBlanc S. Sterically Stabilized Multilayer Graphene Nanoshells for Inkjet Printed Resistors. Electronic Materials. 2021; 2(3):394-412. https://0-doi-org.brum.beds.ac.uk/10.3390/electronicmat2030027
Chicago/Turabian StyleOrrill, Michael, Dustin Abele, Michael J. Wagner, and Saniya LeBlanc. 2021. "Sterically Stabilized Multilayer Graphene Nanoshells for Inkjet Printed Resistors" Electronic Materials 2, no. 3: 394-412. https://0-doi-org.brum.beds.ac.uk/10.3390/electronicmat2030027