
A FactsSage Simulation Study on the Interaction of Synthetic Petcoke Slags with Alumina Crucibles


1
John and Willie Leone Family Department of Energy and Mineral Engineering and The EMS Energy Institute, The Pennsylvania State University, University Park, PA 16802, USA
2
Department of Chemical Engineering, The Pennsylvania State University, University Park, PA 16802, USA
*
Author to whom correspondence should be addressed.
Fuels 2021, 2(1), 48-70; https://0-doi-org.brum.beds.ac.uk/10.3390/fuels2010004
Submission received: 16 November 2020
/
Revised: 22 January 2021
/
Accepted: 29 January 2021
/
Published: 26 February 2021
(This article belongs to the Special Issue Feature Papers in Fuels)
Abstract
:In entrained flow gasifiers, inorganic species in solid fuels are converted to slag, which flows continuously along the gasifier’s refractory lining. Slag viscosity is critical for its continuous flow and, consequently, reliable operation of the gasifier. Viscosity of synthetic petcoke ash was measured in a high temperature viscometer (up to 1500 °C) using high alumina crucibles. Crucible material was found to dissolve in slag, causing thinning and leading to formation of holes on the walls. To explain this dissolution, thermodynamic equilibrium calculations were performed in FactSage™ (Thermfact/CRCT, Montreal, QC, Canada and GTT-Technologies, Aachen, Germany) using different synthetic petcoke ash compositions in 100% H2, 5% H2/ 95% N2, 69.5% CO/30.5% CO2, and 100% O2 atmospheres. An inverse correlation was found between crucible dissolution and alumina content in the slag. Rates of dissolution of alumina from crucible into slag varied significantly in the different atmospheres. The correlation was validated experimentally by heating six synthetic slags with varying compositions to 1500 °C in 5% H2/N2 (to simulate viscometer’s atmosphere) gas. SEM-EDS analysis of the samples confirmed that the sample with lower initial content of alumina in the slag showed higher amounts of aluminum at the slag–crucible interface. Additions of alumina in the synthetic petcoke ash (containing up to 49.74% V2O5) mitigated crucible dissolution.
1. Introduction
A major byproduct of the petroleum refining process is petroleum coke or petcoke. It is the carbon-rich residue left over after all the low and medium boiling hydrocarbon fractions have been distilled from the crude oil. Being carbon-rich, petcoke is used as a raw material in gasifiers for the generation of energy and production of chemicals for industrial use. Gasifiers are usually designed to be capable of processing multiple feedstocks. As a result, very few gasifiers operate with 100% petcoke feedstock [1]. Many of them employ various blends of fuels, as addition of a highly reactive fuel improves the chemical reactivity of petcoke [2] as it is a fuel with low reactivity.
In addition to producing fuels and chemicals for industrial use, gasifiers produce ash that melts at high temperatures and especially under reducing conditions to form slag. The slag flows down on the gasifier walls and is removed through a slag tap. The walls of a gasifier are lined with refractory materials (usually alumina or chrome-lined alumina) to help protect the surface from the corrosive slags.
Slag viscosities greatly impact the rate and ease with which they can be tapped out of the gasifier. A viscosity in the range of 5–25 Pa-s is considered ideal for the operation of slagging gasifiers [3,4]. Higher viscosities result in solidification of the slag before tapping, thus clogging the tapping valves. Higher viscosities also cause the slag to be in contact with the refractory wall for longer periods and “sticking” to it. Because it is almost always in contact with molten slag, the refractory layer’s integrity is of utmost importance in gasifier operations. Maintenance and repair of the tapping valves and refractory linings are time consuming and lead to long shutdowns and excessive operational costs.
During viscosity measurement experiments in the current study, it was found that some compositions of slag caused very high dissolution of crucible material into the slag, while others did not. The viscosity experiments were conducted in a high-temperature viscometer (see Section 3) using synthetic petcoke ash contained by high alumina crucible. It was initially assumed that the presence of significant amounts of only vanadium had a role to play in the dissolution. Bennett et al. [5] stated that vanadium in petcoke ash can severely deteriorate alumina refractories. In their study, 90% (or higher) Cr2O3 spent refractories from gasifiers were analyzed using SEM (scanning electron microscopy), EDX (energy-dispersive X-ray spectroscopy) and XRD (X-ray diffraction) to understand failure mechanisms. Thermodynamic modeling was also performed to understand refractory dissolution in slag. Thermodynamic databases for vanadium compounds were limited at the high temperatures and reducing environments of entrained flow gasifiers. So, the focus of their work did not include vanadium compounds. The authors claimed that FeO from slag reacts with Cr2O3 lining to form FeCr2O4 and with Al2O3 to form FeAl2O4. Both these reactions lead to loss of refractory material from the wall to the slag at the interface and thus are reported to be the major reasons for refractory wear. However, in the viscosity experiments, two petcoke slag samples with a similar content of vanadium (about 20% by weight) but with different silica and alumina contents showed starkly different results. One composition caused extensive dissolution of the crucible, while the other did not. This observation indicated that vanadium content of a slag may not be the only cause for refractory depletion.
Interactions between high vanadium slags and the crucible materials have rarely been studied. One of the studies similar to the slag-crucible dissolution observed in this study was conducted by Ilyushechkin et al. [6], who studied two slags with vanadium and nickel oxide contents of up to 20.7% and 2.7%, respectively. The slags were processed in four crucible materials—alumina, molybdenum, platinum, and nickel—and slags’ microstructures were studied by SEM-EDX. According to Bennett et al. [5], petcoke slag can have an average V2O5 and NiO content of 57.0 wt. % and 8.4 wt. %. They reported that both molybdenum and alumina crucibles were suitable for working with slag containing up to 5% vanadium, while only alumina crucibles were suitable for working with slag compositions containing more than 5% vanadium. Even lower concentrations of vanadium were found to dissolve crucibles into the slag. Though the problem of dissolution was observed by the authors, no quantitative method to mitigate the problem was proposed. In a study by French et al. [7], coals ash slags’ interactions with molybdenum crucibles from viscosity measurements were reported. The researchers determined that molybdenum reacts weakly with coal slags containing low iron levels (less than 10 wt. %), whereas it forms compounds in presence of higher levels of iron, while also generating particles of molybdenum within the molten slag. Vanadium and nickel are absent in coal ash slags [5].
Jonayat et al. [8] studied the interactions between Fe2O3, Cr2O3 and V2O3 by using density functional theory—oxides with similar crystal structure as Al2O3 (Corundum) under conditions similar to those found inside gasifiers and proposed a mechanism for these interactions. According to these authors, the surface of the major oxide acts as a base on which the minority oxide could be considered to be doped. The stability of such mixed oxides is determined by the surface energies of the oxides involved. Their observations suggest that surface energies in such oxide mixtures are determined by the affinity of these oxides towards oxygen. Under reducing conditions, the metal with higher tendency to reduce (lower bond energy) would segregate to the surface on the crystal, as it is more reducible.
In all the above studies, interaction of petcoke slag, containing typical high amount of vanadium and nickel, with alumina crucible/refractory were not investigated. Researchers need to determine viscosity of petcoke ash slag and alumina is a standard crucible material for high temperature slag viscosity experiments. Therefore, this study is an attempt in which vanadium and nickel amounts would be varied systematically in slag and their interactions with high alumina crucibles would be identified by performing high-temperature experiments and postmortem analysis. The systematic variation would be based on the average petcoke ash compositions reported by Bennett et al. [5].
2. Research Objective
In the presented studies about slag-crucible (or refractory), it is evident that interactions of typical petcoke ash slag with solid alumina were not investigated. Based on this, the objective of this study is selected to identify the reasons for the dissolution of refractory material—which is mostly alumina, into the liquid slag during viscosity measurement experiments, and propose mitigation measures to minimize the dissolution. To identify the reasons for alumina dissolution, ash composition will be varied systematically within the bounds of a typical petcoke ash composition. To determine the factors that played a role in this phenomenon, this study focused on the alumina content in the bulk slag as well as the crucible. Since the total alumina in the system (alumina contained in the slag and from the crucible) is constant, any additional alumina predicted/detected in the slag must be the result of crucible depletion.
3. Experimental Setup and Sample Preparation
Viscosity measurements of synthetic petcoke slags were carried out with a high-temperature viscometer (Theta Industries, New Castle, DE, USA), capable of heating to 1700 °C using Molybdenum Silicide heating elements. The equipment consisted of a furnace, an alumina protection tube and a glass enclosure for atmosphere control during the experiments, an enclosure for the protection tube, a movable measuring head, and a rheometer. Three alumina rods fixed to the top of the metal flange supported the crucible during the experiment. Another alumina rod, connected to the rotor at one end with a platinum pin and the measuring head at the other, was used for measuring the shear stress, shear rate, and viscosity. Deflection of the spring in the measuring head indicated the viscosity of the fluid being tested. The metal flange has two sets of perforations, one for letting in the gases into and out of the protection tube and another one for cooling water that prevents the outside of the furnace from overheating.
Type B thermocouples, located on the body and inside the furnace, read the furnace and the approximate sample temperatures, respectively. Figure 1 shows the schematic of the viscometer in detail.
The starting compositions of the synthetic slags were selected from the typical petcoke compositions reported by Conn et al. [9], Bryers et al. [10], Vassilev et al. [11], and summarized by Bennett et al. [5]. Table 1 lists the compositions used for this study. The oxides were varied systematically, so oxides in some of the tests do not add to 100% (see Results and Discussion).
FactSage (version 7.1), a thermodynamic equilibrium calculation software that uses Gibbs’ free energy minimization to predict the formation of compounds at equilibrium, was used for modeling the conditions and phases expected during the experiments. Initially, four slag compositions were tested under CO/CO2 (69.5/30.5), 100% H2, 100% O2 and 5% H2 (95% N2) atmospheres. The only variation in the four slag samples was that in their alumina and vanadium contents, while all other compositions were maintained in the same ratio as that in the slag sample that caused extensive dissolution of the crucible. While one composition was similar to the slag sample, the other had excess alumina in its composition. The third composition had no alumina and the fourth had no alumina as well as no vanadium in it. Equilibrium alumina content in the slag was determined for each composition and formed the basis for classification of slags as either deficit or rich in alumina, depending on whether they had lower or higher alumina content respectively than that predicted to be in the slag at equilibrium.
To experimentally confirm the findings of the simulations, the oxides in Tests 1–6 (see Table 1) were heated under an oxidizing atmosphere in a Carbolite box-type furnace at 2 °C/min to 1500 °C, held at that temperature for 1 min, and cooled at 1.5 °C/min to ensure that all the elements were in their highest oxidation states. After cooling down, the mixture of oxides was separated from the crucible material by carefully breaking the crucible to avoid inclusion of crucible into the samples. The mixture was then ground to a powder, heated to 1500 °C at 2 °C/min, held at that temperature for 6 h to simulate the time taken for recording viscosities during the viscosity measurement experiments, and allowed to cool down at 1.5 °C/min.
SEM-EDS and XRD techniques were used for characterizing the samples and determining the impact of change in alumina content on crucible dissolution. A comparison with the FactSage simulation data generated by varying the alumina content in the slag would help in theoretical understanding of the effect of slag’s composition on the phenomenon of dissolution.
4. Results and Discussion
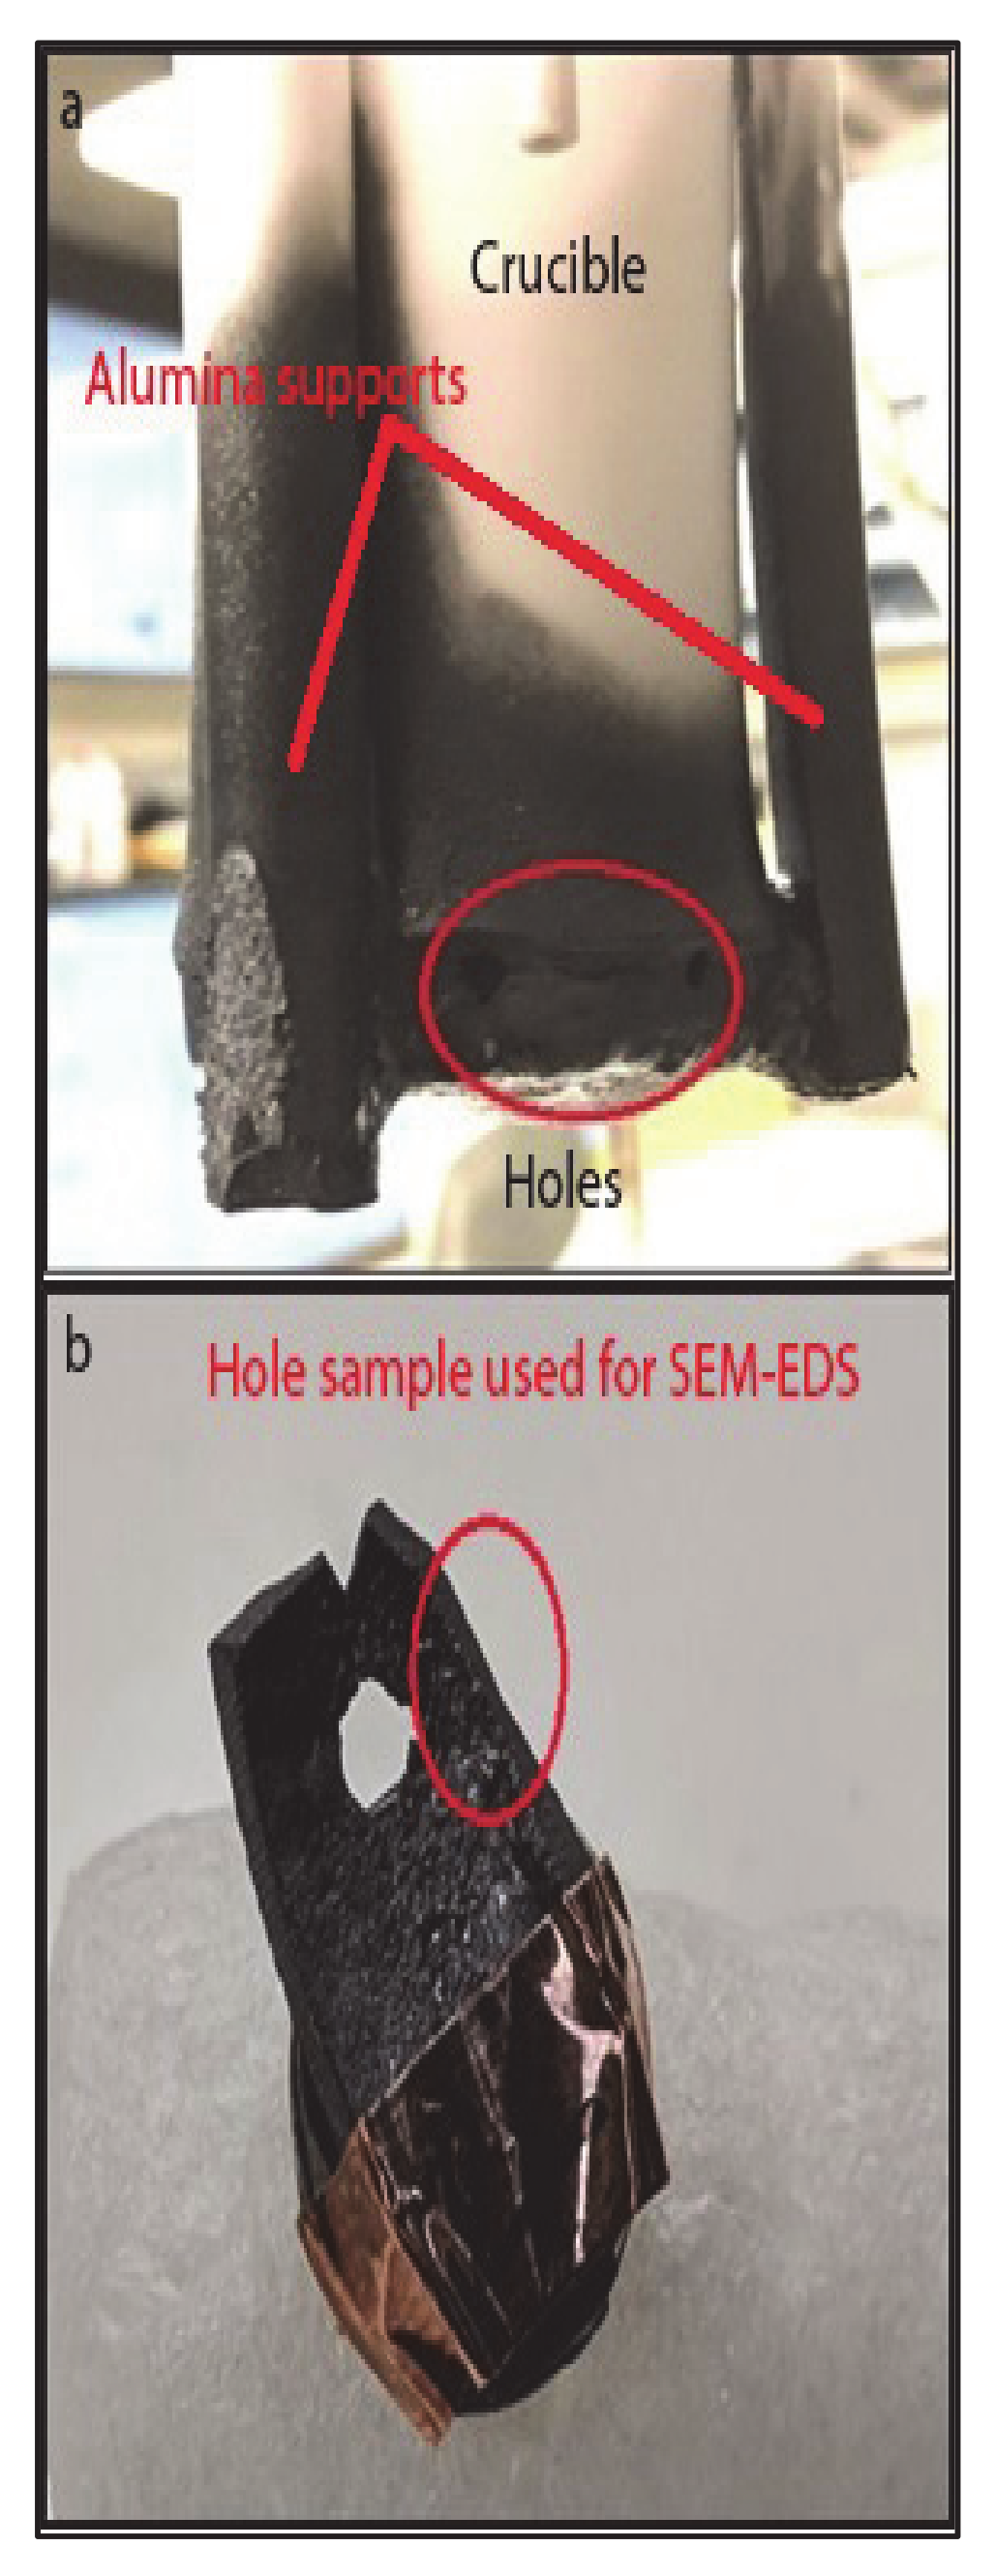
During viscosity measurement experiments with Test 1 (with 64.39% V content) and Test 4 (with 20.48% V content) samples, the crucible wall material was found to have dissolved into the slag, leaving perforations (holes) through which the slag escaped out. There was no apparent loss of wall thickness during viscosity measurement of the calibration test though its vanadium content was 20.69%, which was very close to the vanadium content in Test 4 (20.48%). This suggested that the loss of wall thickness could not be attributed to the high content of vanadium alone and was probably caused by other interactions between the slag and crucible.
Liquid slag falling out of the crucible indicated that the perforations as shown in Figure 2a,b were formed probably when the slag was fluid enough, at the lower end of the 1500–1425 °C temperature range, as viscosity measurement could not be continued below 1425 °C due to non-availability of slag inside the crucible.
Figure 2a shows photograph of the crucible after the completion of the viscosity measurement experiment (Test 1). The Figure shows circumferential warping and perforations near the bottom of the crucible. Figure 2b shows one of the perforations as well as thinning of the crucible wall.
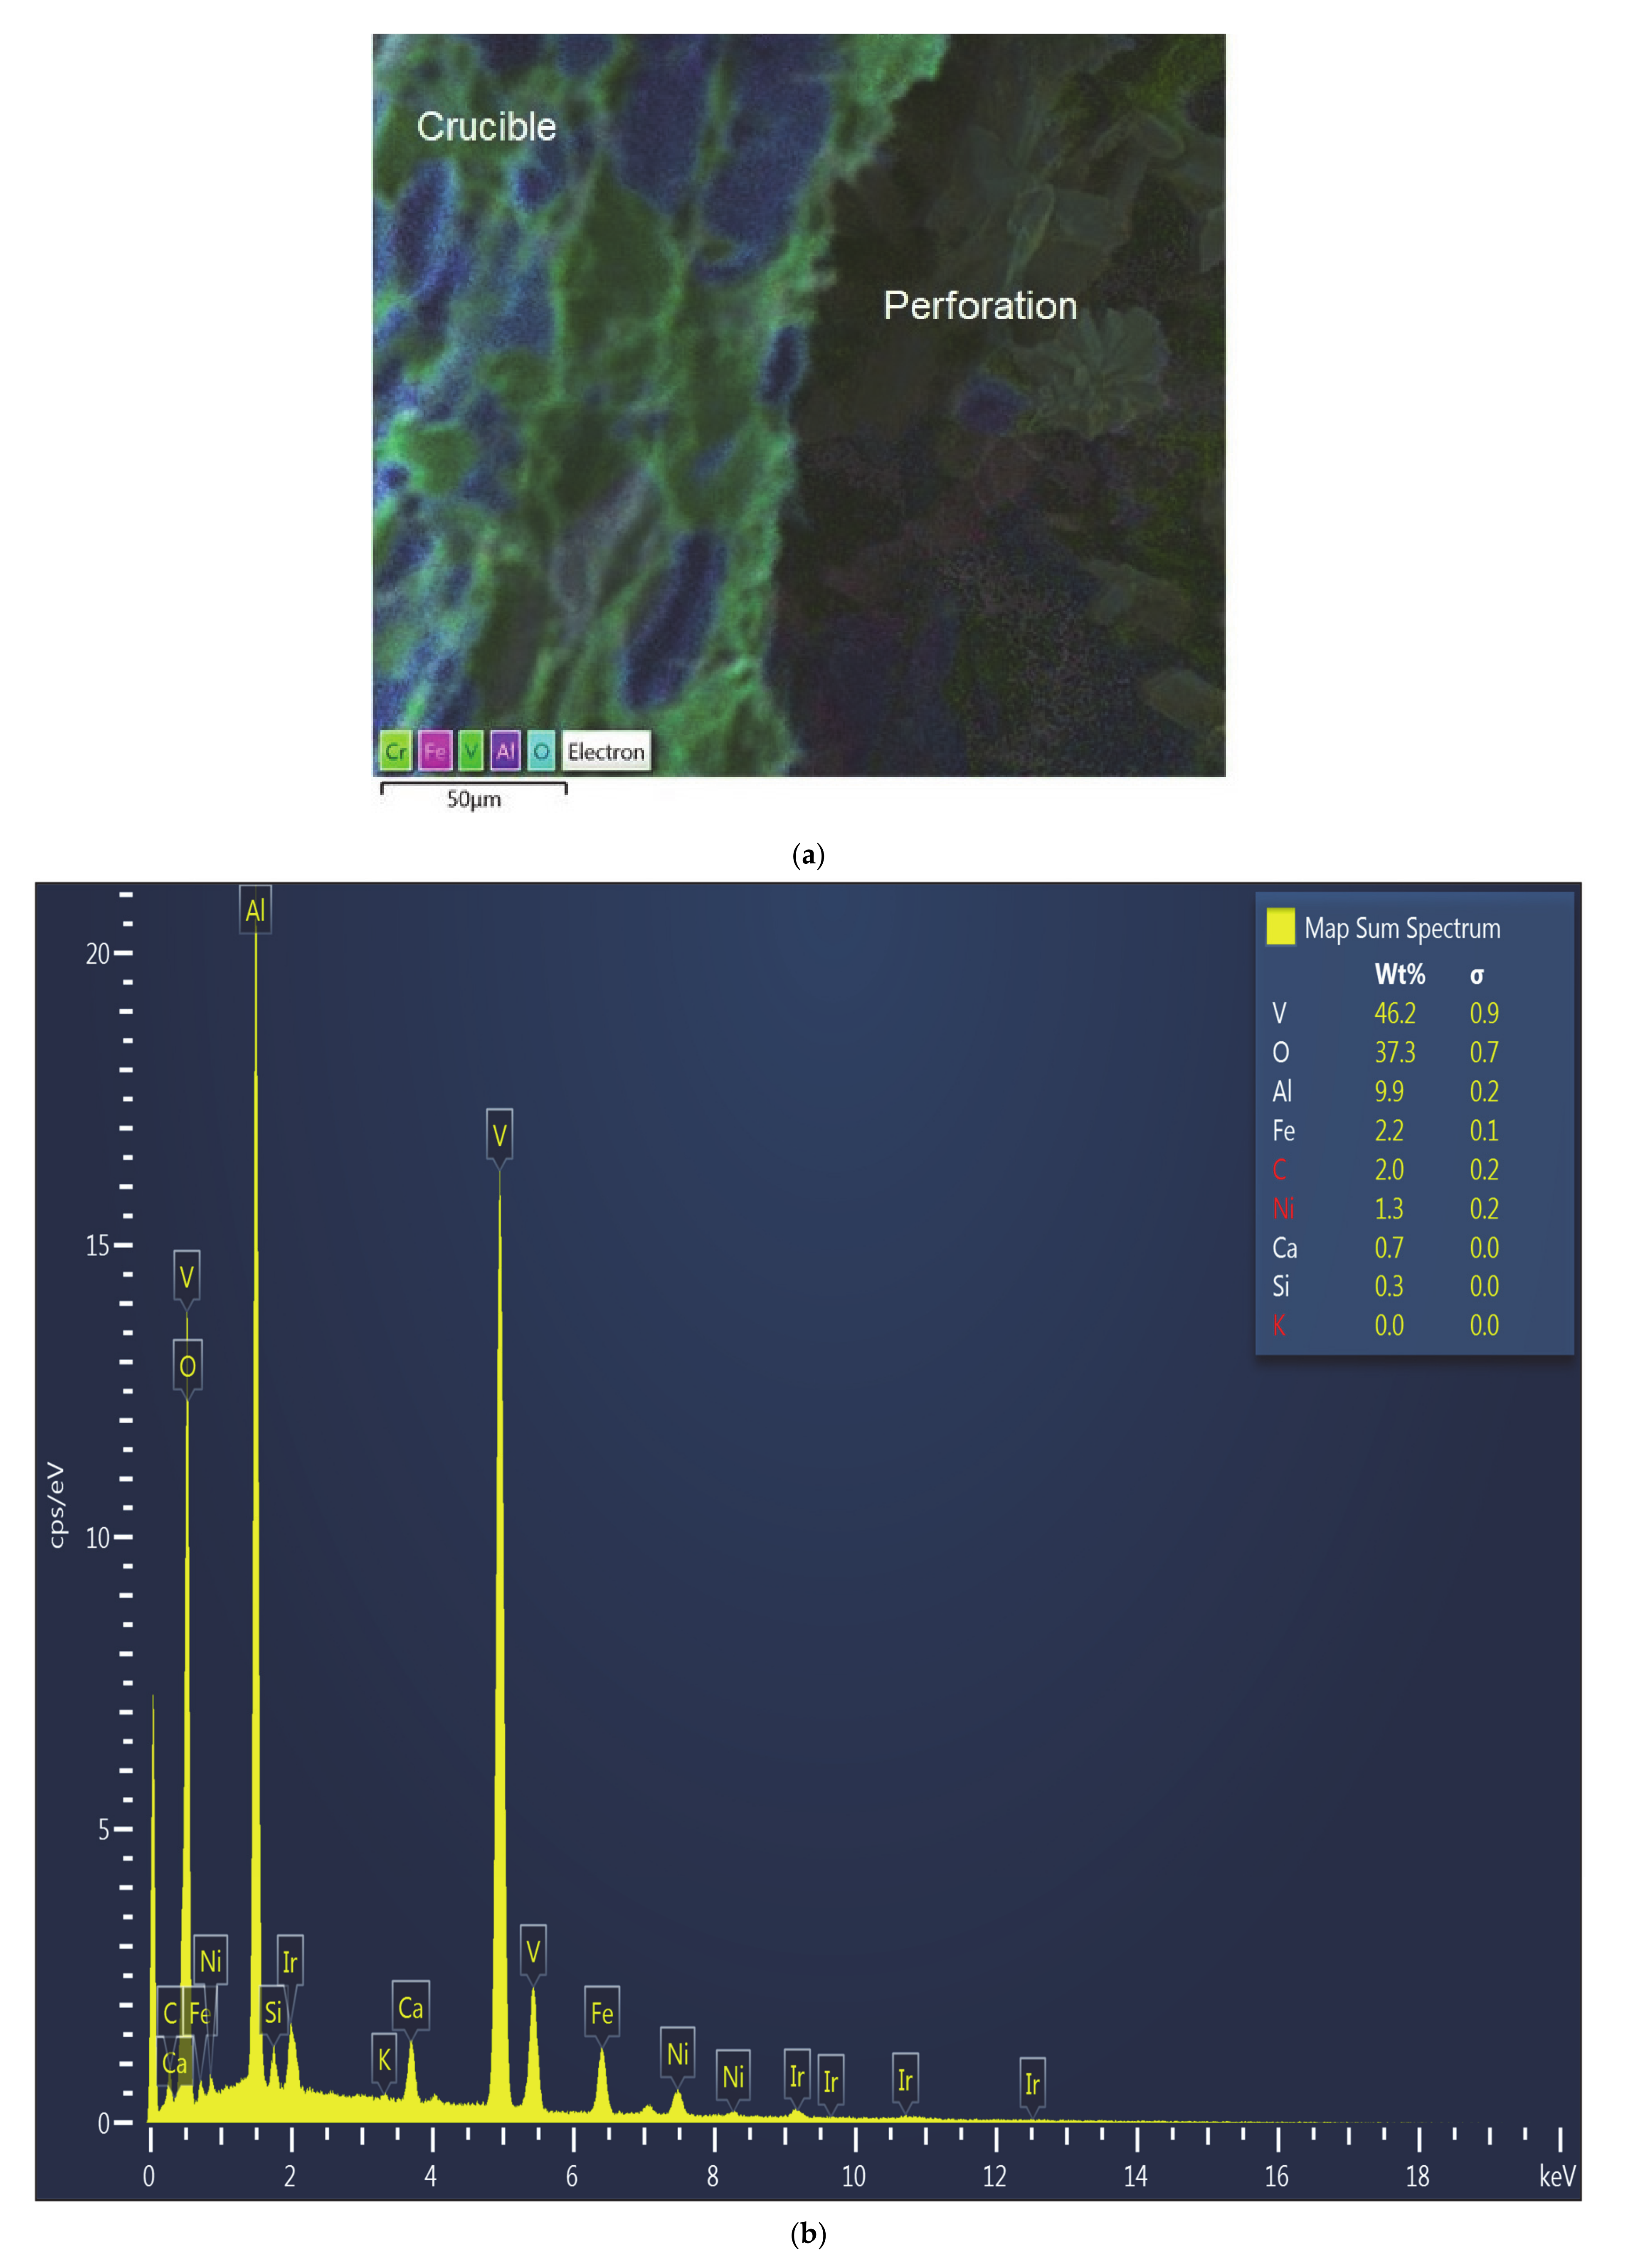
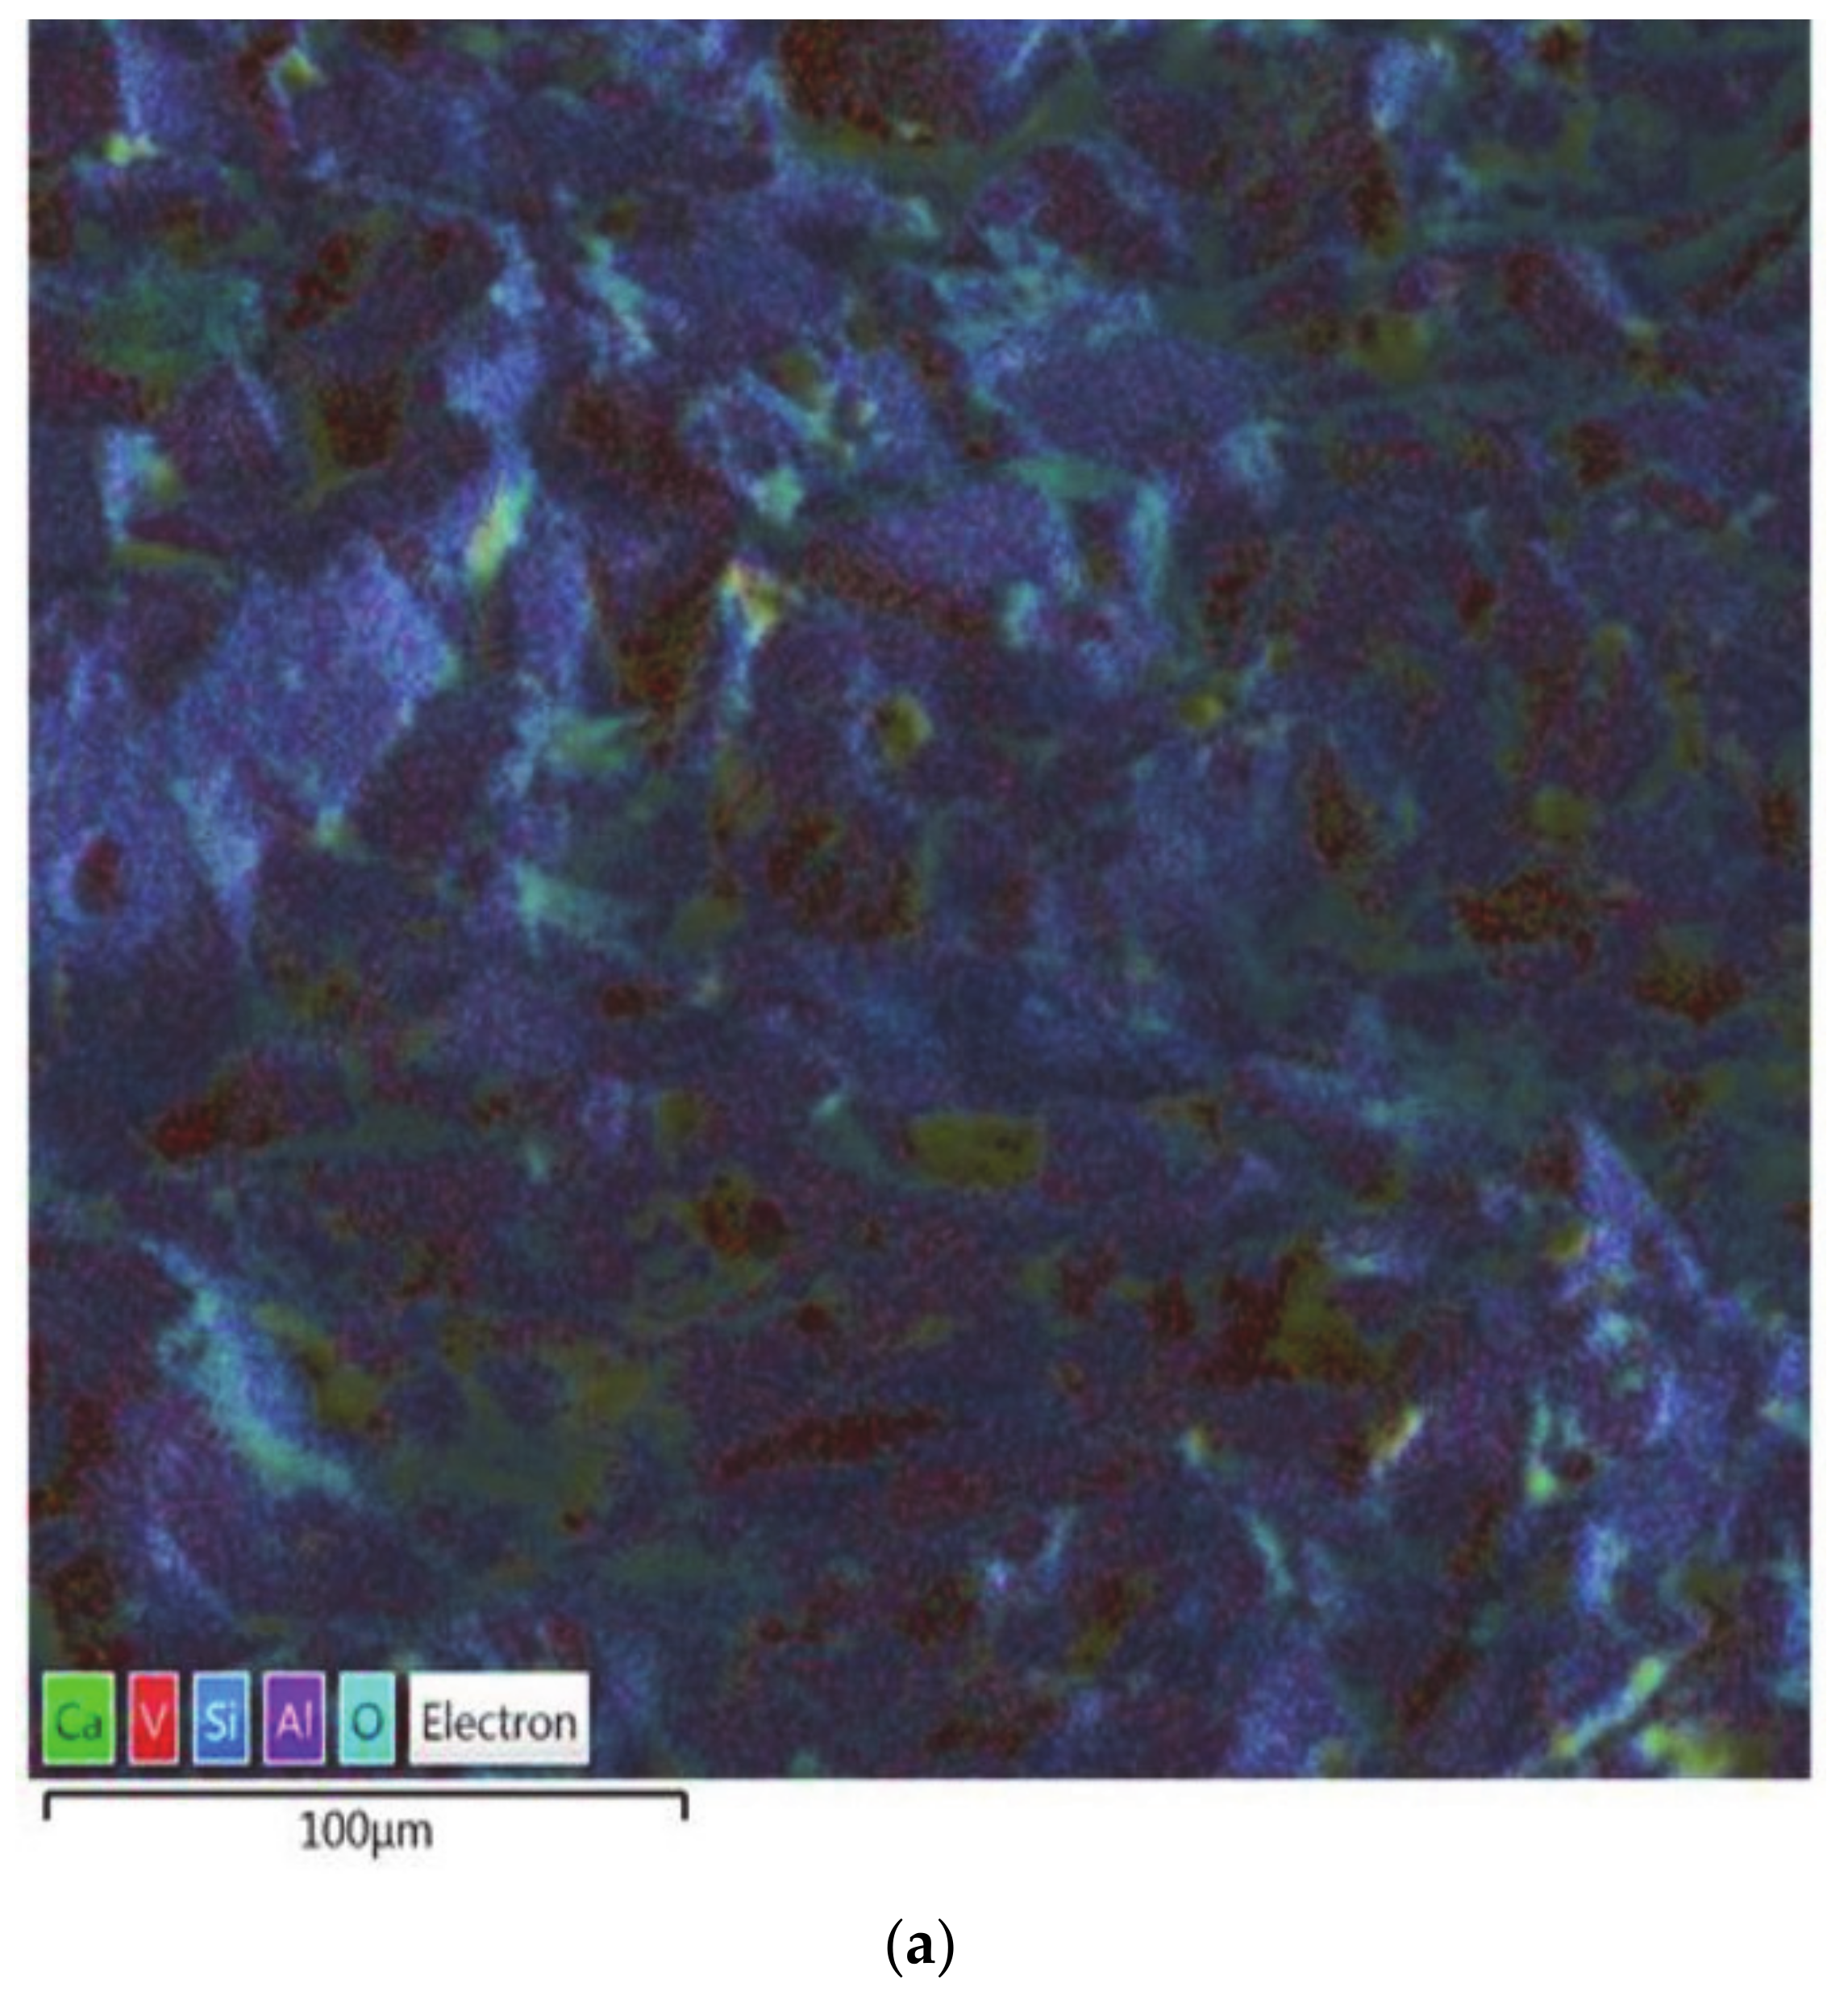
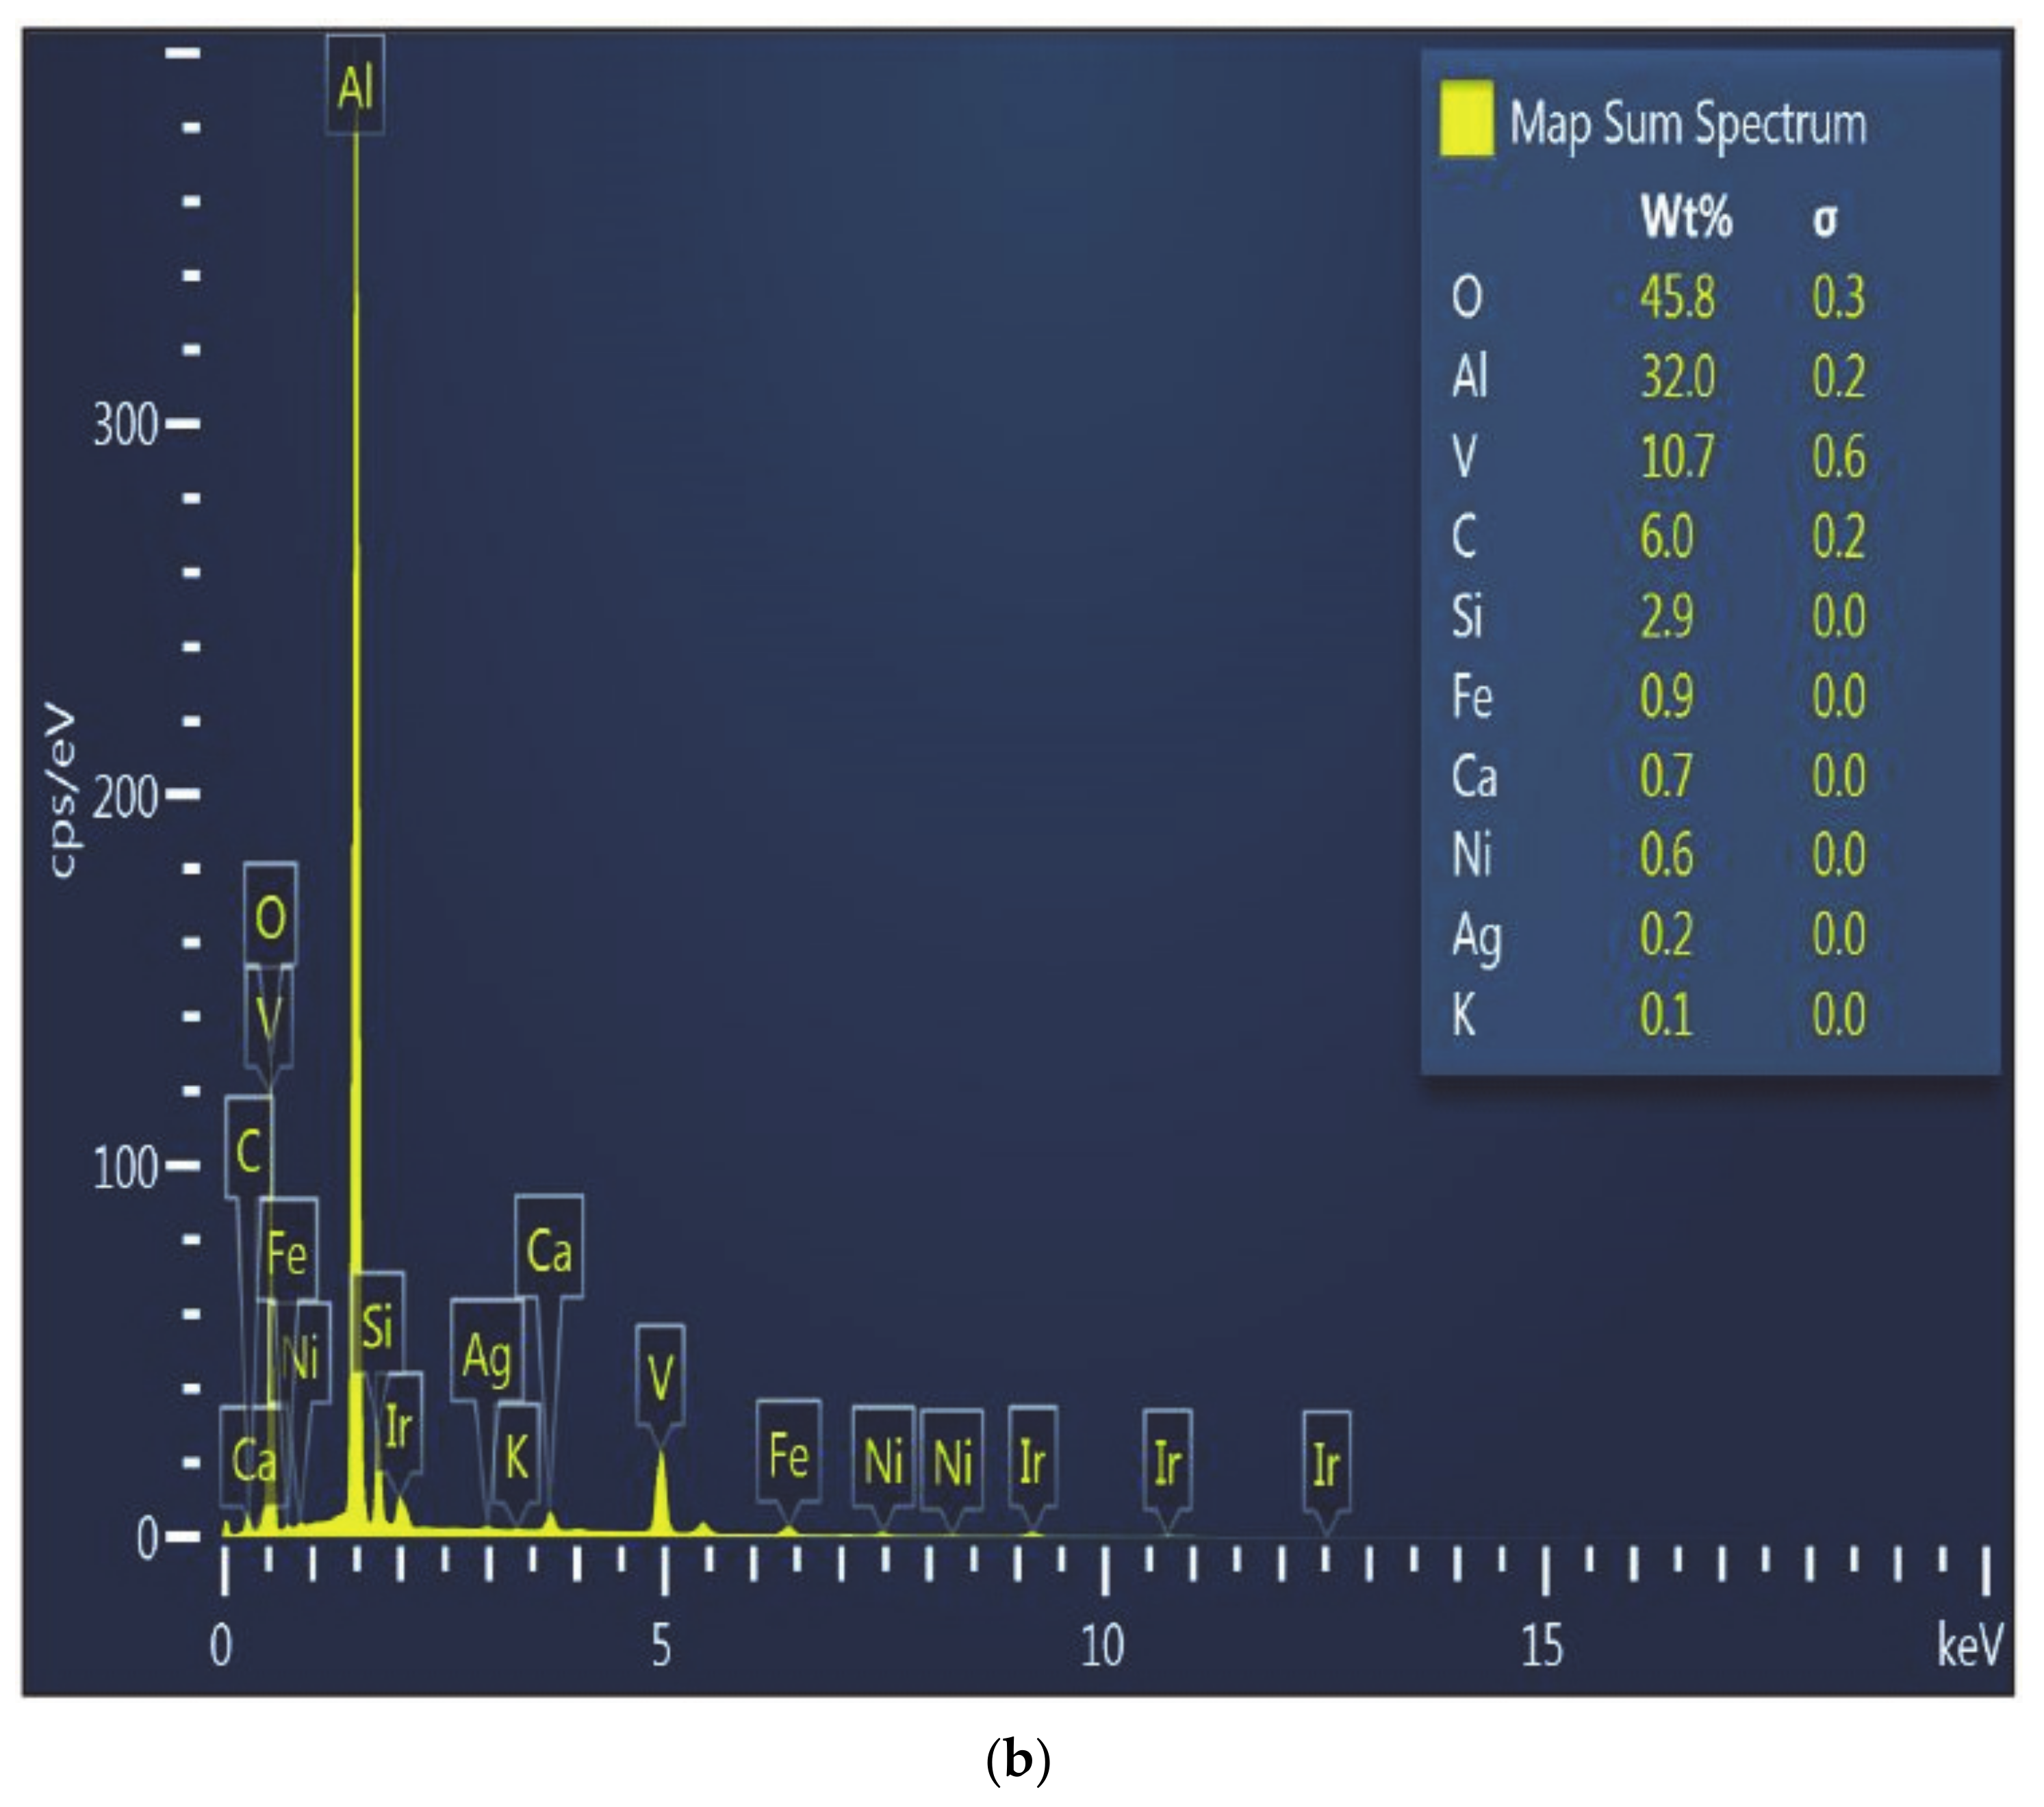
The SEM micrograph and the EDS pattern of the wall around the perforations in the crucible walls used in Test 1 (Figure 3) showed significant accumulation of vanadium (46.2%), while also showed a lower content of aluminum (9.9%), compared to 32% at the bottom of the crucible, which is affected to a lesser extent (Figure 4). The bottom of the crucible was not found to have been affected during the experiment. As expected, alumina was the major constituent in the unaffected region of the crucible. Vanadium was identified to be 10.7% by weight at this location, which is a marked difference from the site that developed the perforation (~46%). All other oxide constituents were seen in roughly the same proportions as in the starting mixture.
Figure 4 also shows the presence of silicon and iron in minute quantities. This is due to the fact that silica has a low density (2.65 g/cm3) whereas other oxides are denser (V2O3-4.87 g/cm3, NiO-6.67 g/cm3, Al2O3-3.95 g/cm3 and CaO-3.34 g/cm3). Since the holes were found at the bottom of the crucibles, it is believed that the heavier oxides escaped first, and silica was in contact with the crucible long enough to solidify at the interface before completely flowing out of the perforation (hole).
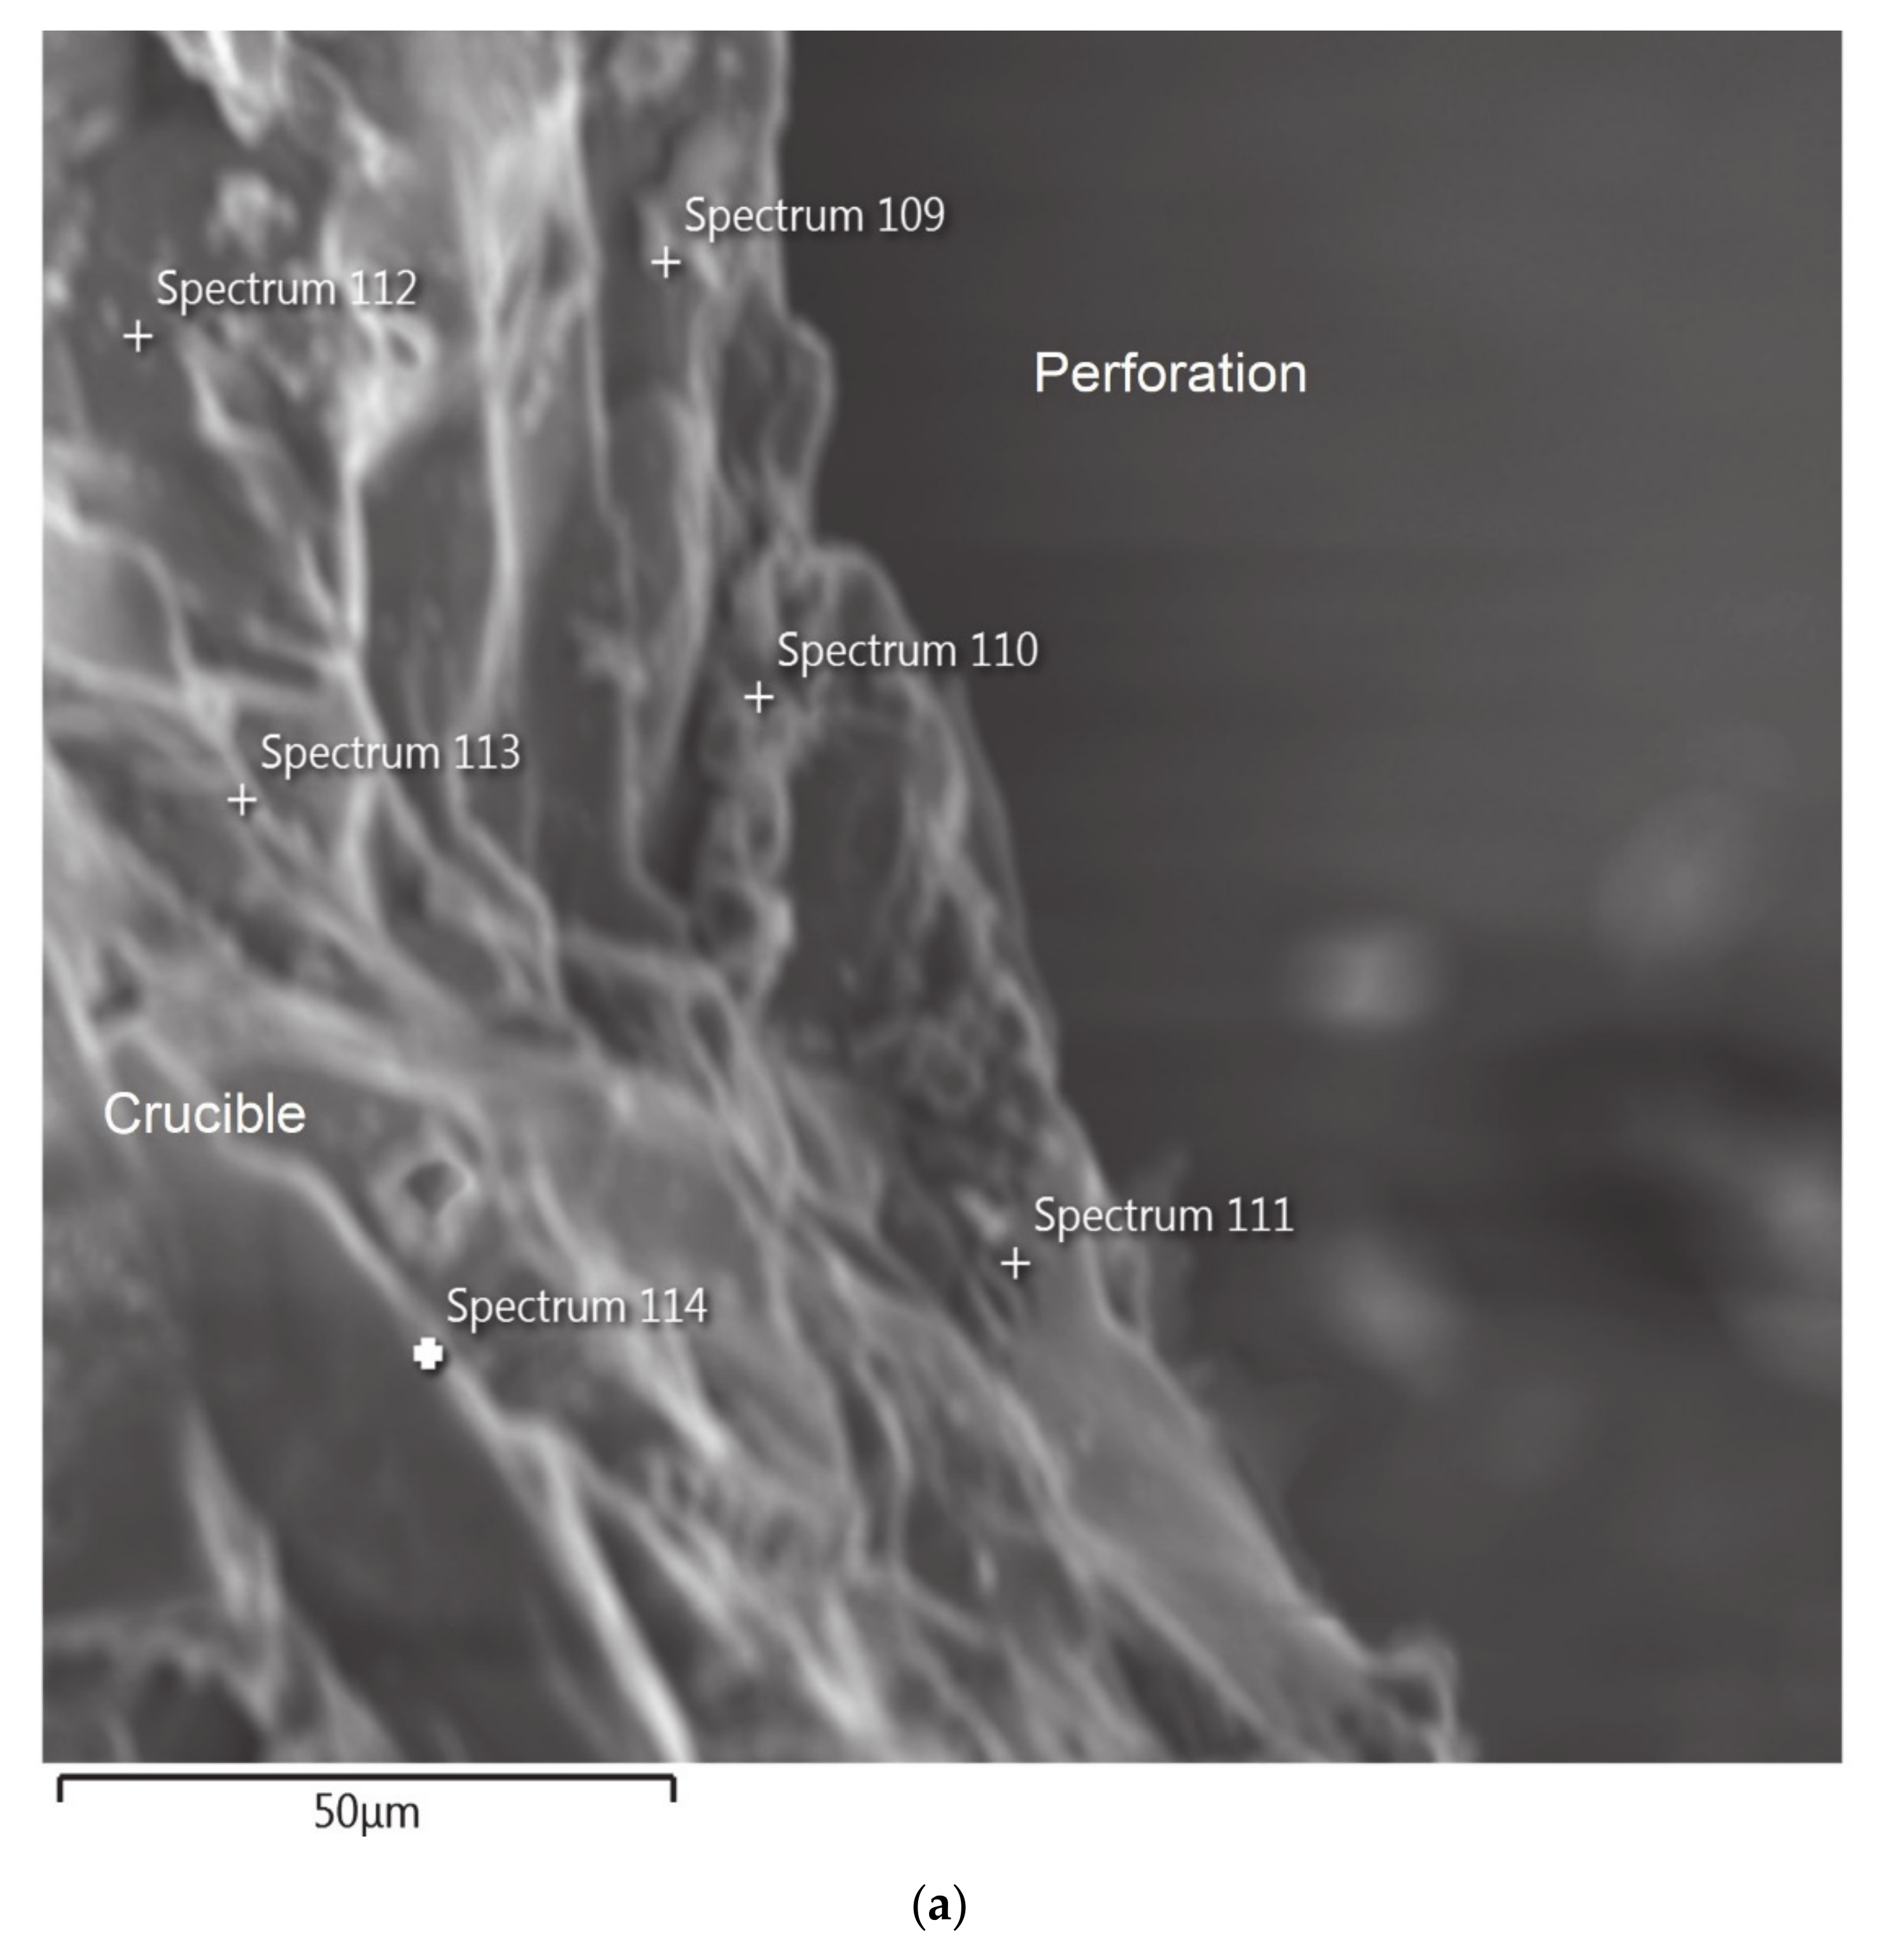
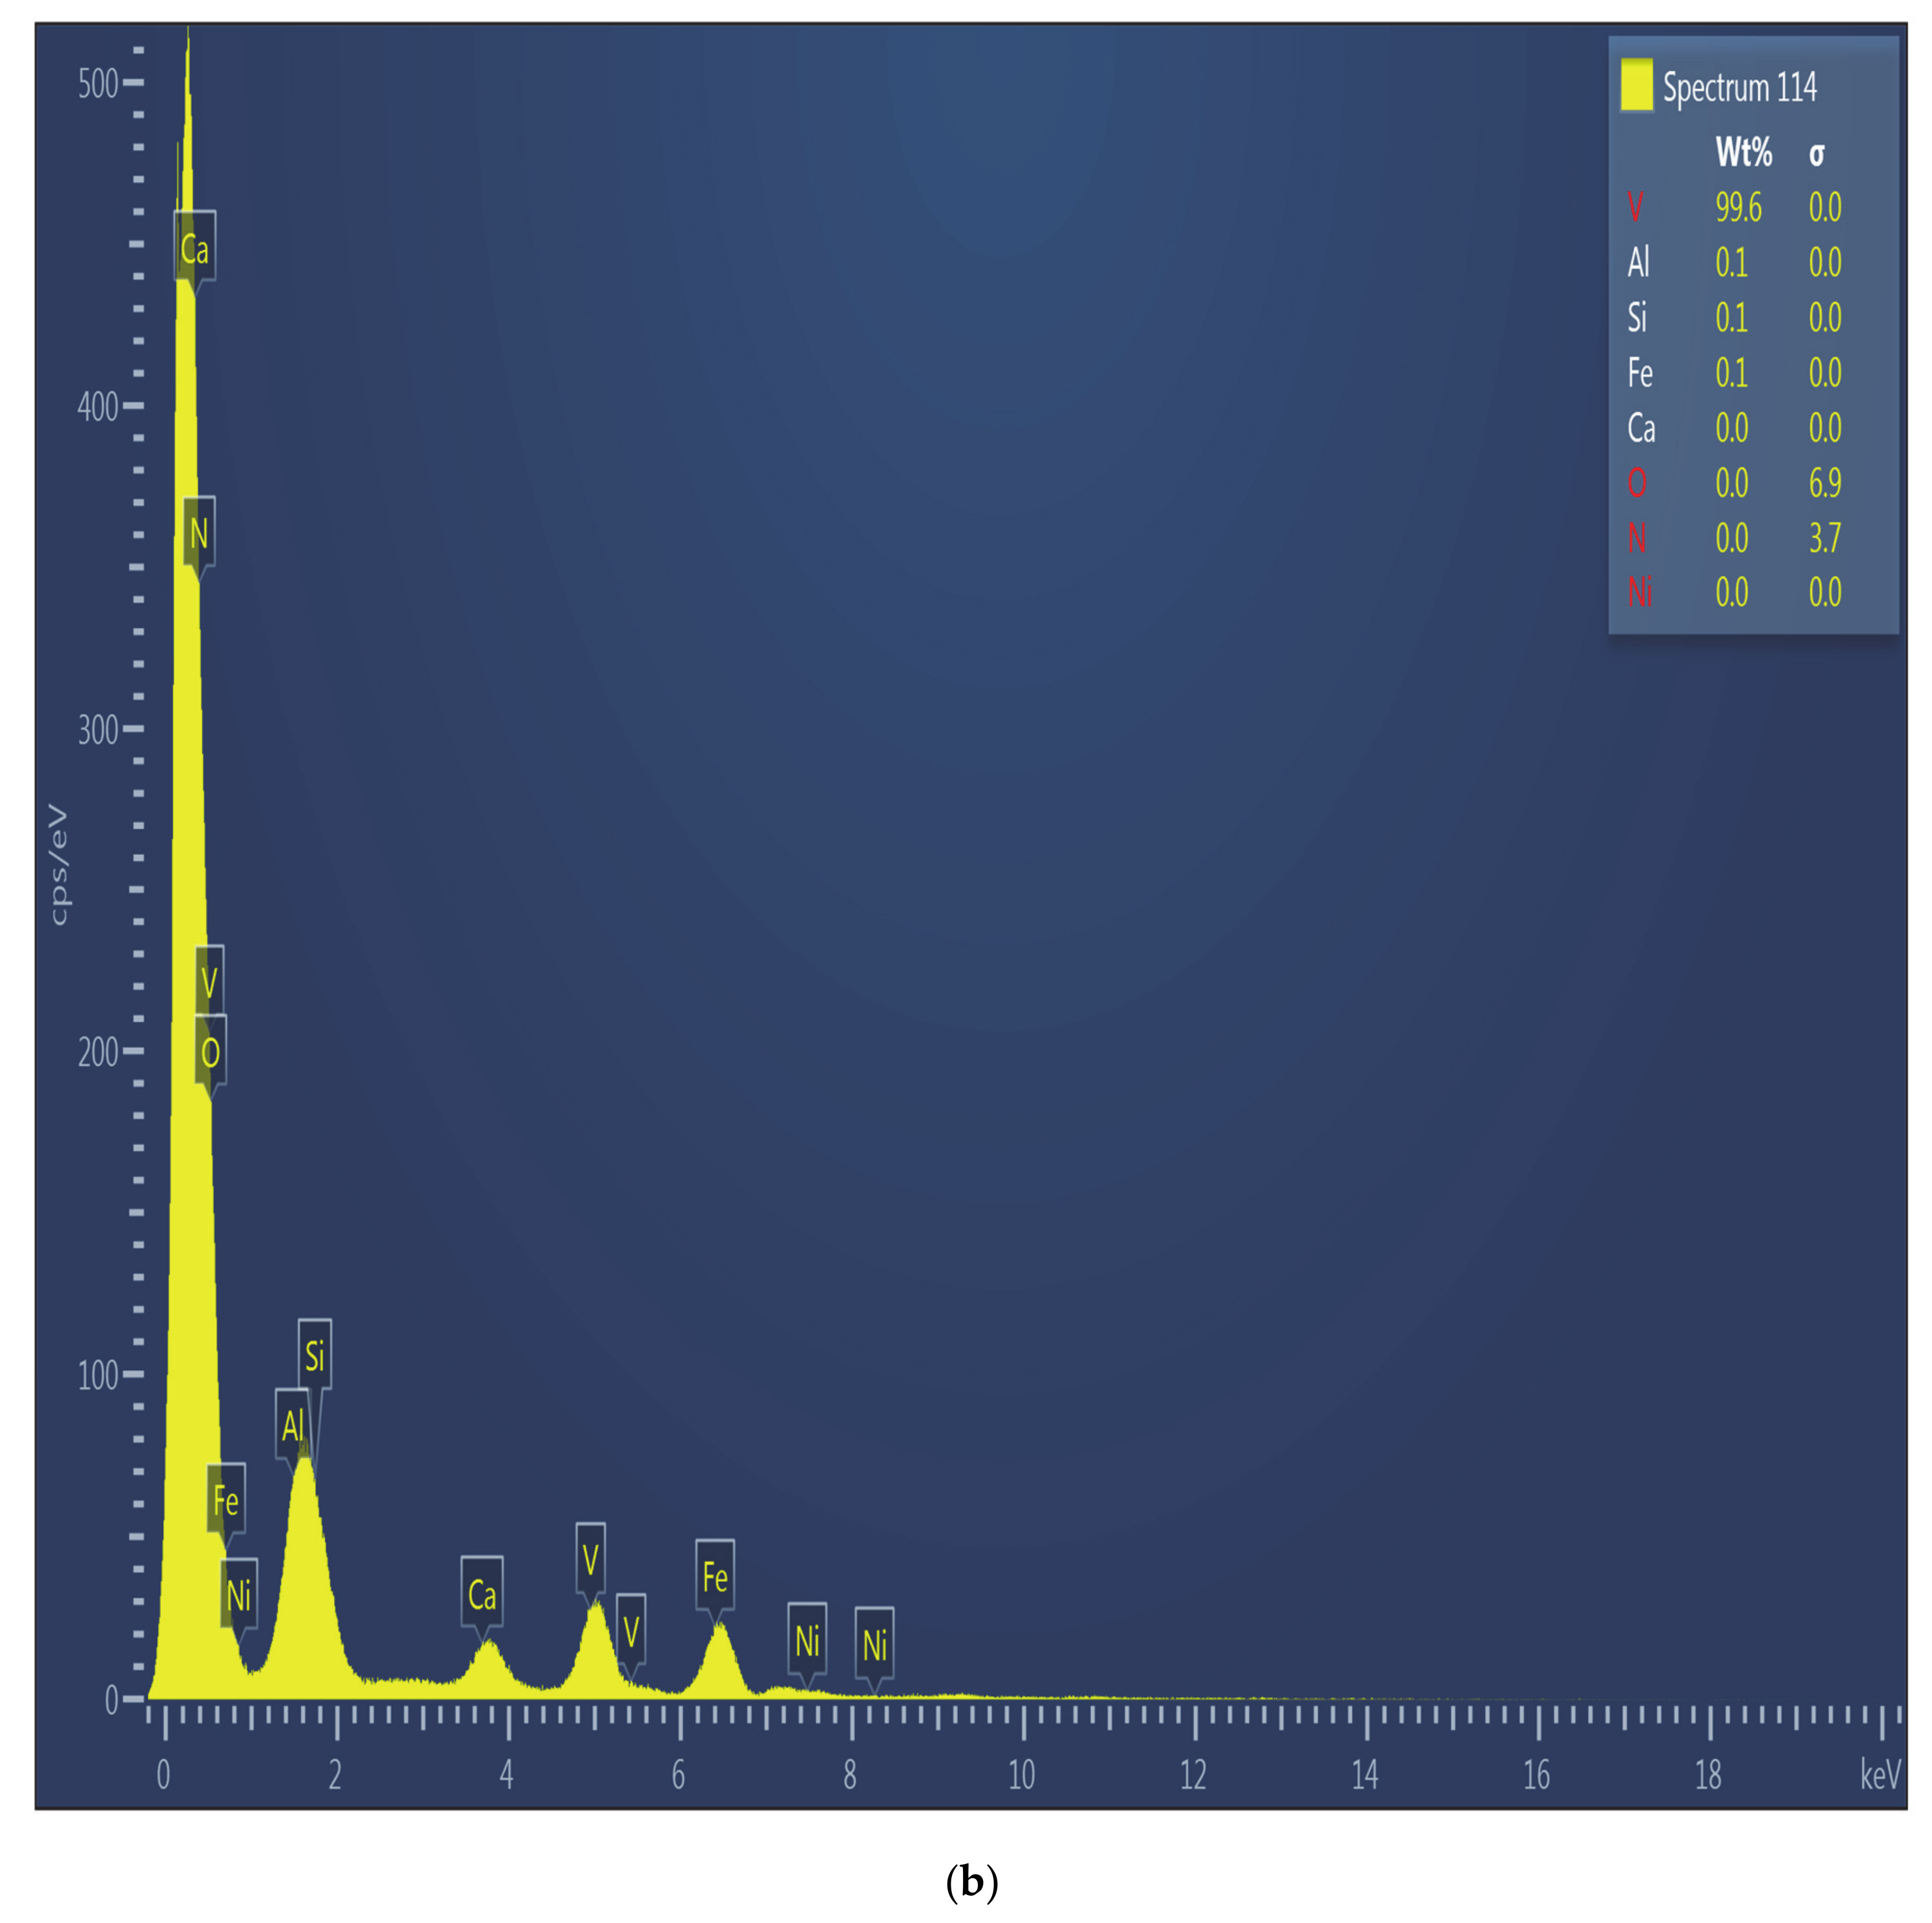
Figure 5 shows the SEM micrograph and EDS spectrum at a point close to the perforation found during Test 1. Accumulation of vanadium close to the perforation, accompanied by loss of aluminum can be clearly seen from the EDS pattern. In fact, the spectrum barely shows any other elements, apart from vanadium.
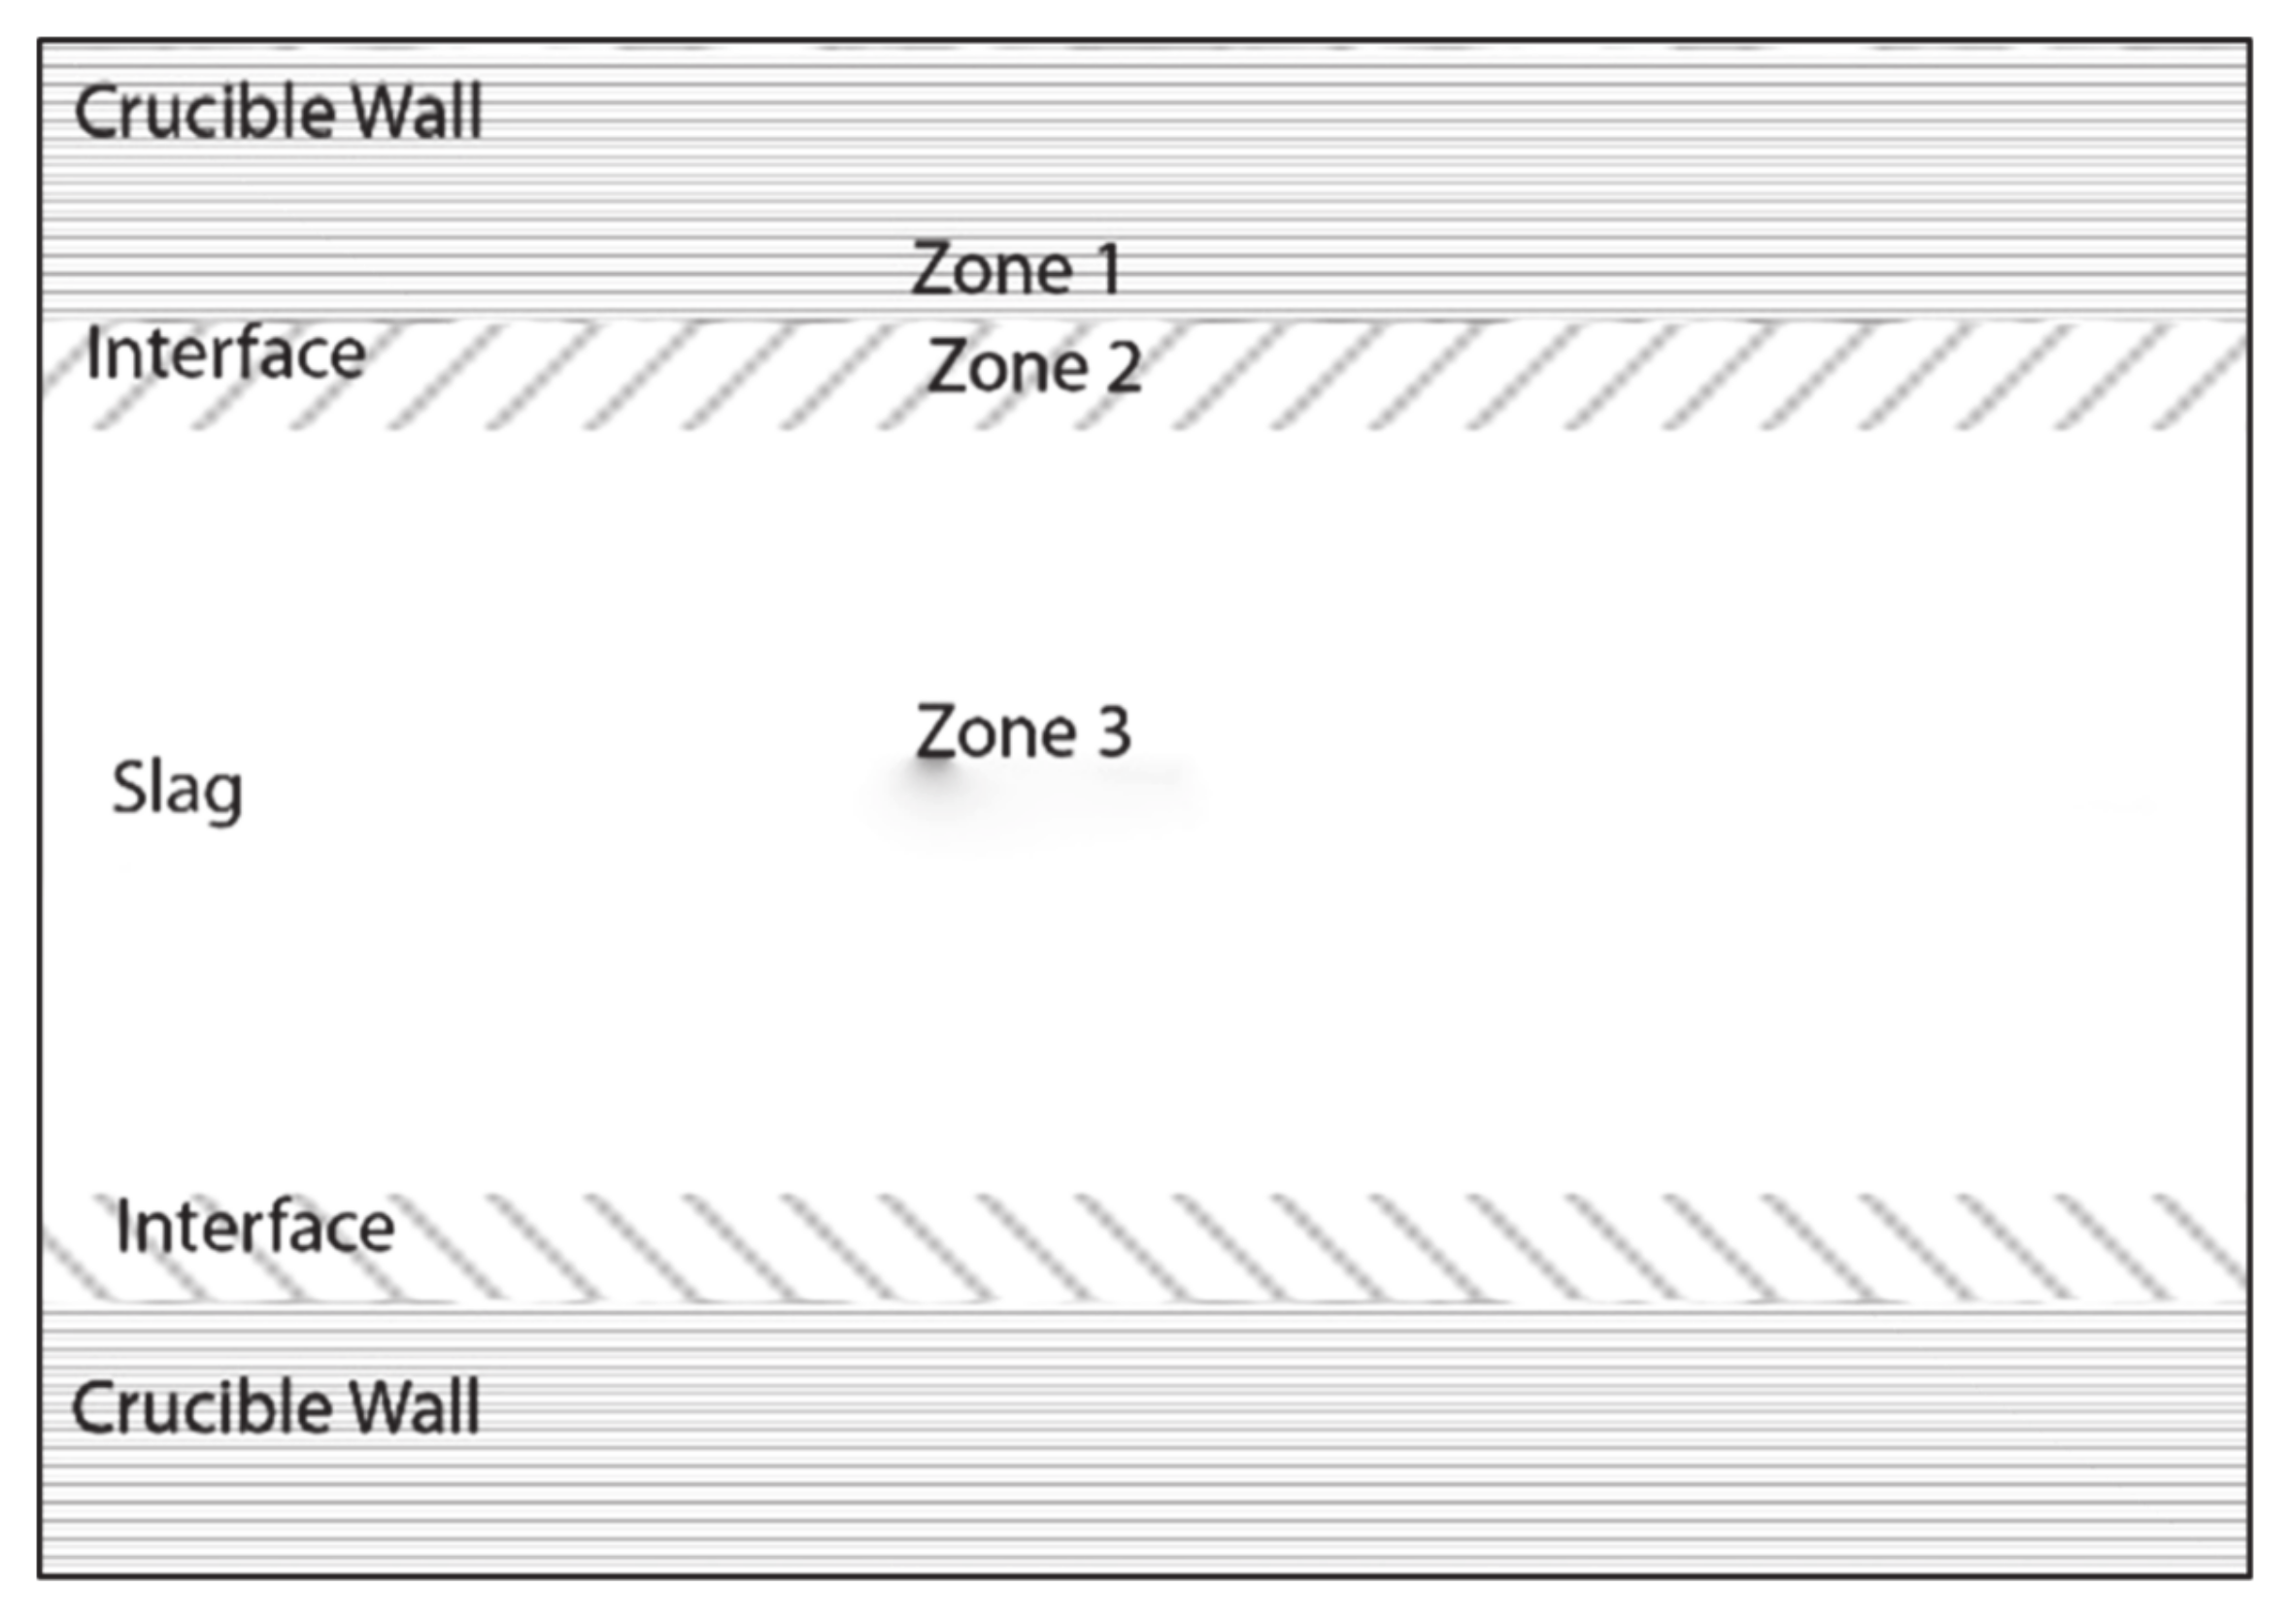
Table 2 shows the compositions obtained from the EDS spectra analysis for tests 1-6 carried out for this study. The different zones where measurements were carried out are shown graphically in Figure 6. Al concentrations in the different zones and initial slag composition are shown in Figure 7.
Zone 1 is the area close to the interface of crucible and slag, on the crucible side. Zone 2 is the area close to the interface, on the slag side of the interface, while Zone 3 is close to the center of the crucible, where the boundary interactions have almost no effect on the composition. If the crucible is affected by the slag, the aluminum composition in Zone 1 would reduce, while the content of vanadium would increase. When the crucible is not attacked by the slag, the compositions in Zone 2 and Zone 3 should be similar to the initial compositions of the respective test samples.
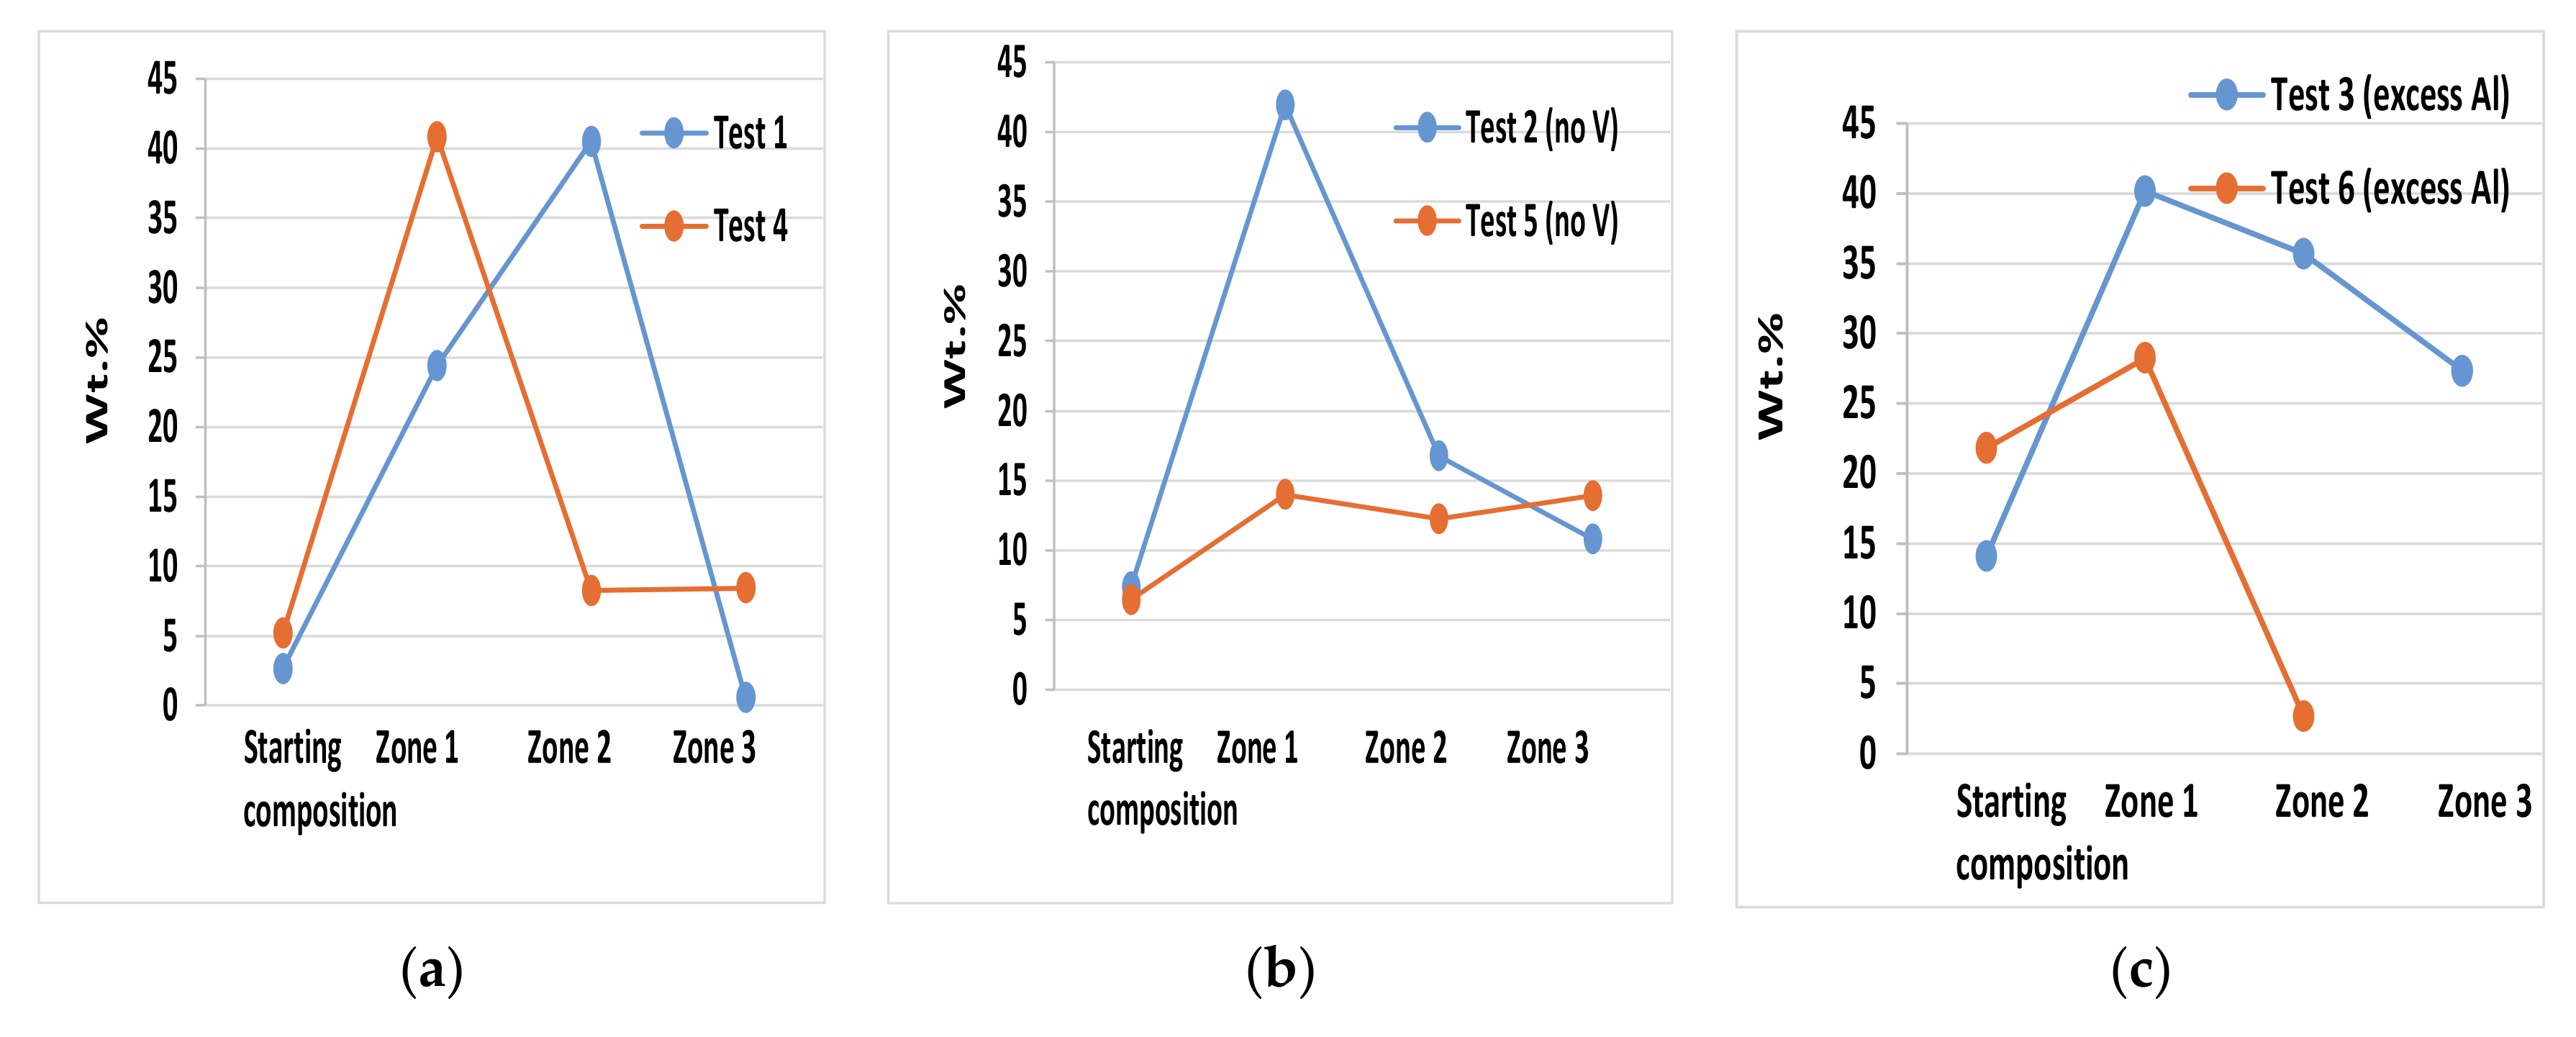
Figure 7a–c show that in tests with no vanadium in the starting samples (Test 2 and Test 5), the Al compositions in Zones 2 and 3 increased with respect to the initial slag composition. So, in absence of vanadium, dissolution of alumina into slag is observed. In Test 1, the Al concentration in Zone 3 is much less than the initial slag composition, which implies that some of the alumina could have migrated towards interface (Zone 2). However, in case of test 4, the aluminum concentration is higher in zone 3 than the initial composition. In tests 3 and 6, wt. % of vanadium in zone 1 (6.19% and 0%, respectively) are much lower than the initial slag compositions (49.74% and 7.50%, respectively). Vanadium might not have attacked the crucible wall due to the excess alumina. Measurements could not be done for Zone 3 in case of test 6. In Table 2, corresponding elemental composition of the initial synthetic mixture has been reported in the column for initial slag composition. Some of the weight percentages do not add to 100% as the SEM-EDS data had carbon and other elements that were not present in the initial slag composition and the crucible material. So, those elements were discarded in the analysis. The only change between Test 1 and Test 3 was the relative composition of alumina in the starting slag (4.96% vs. 26.61%). Similarly, the only difference between Test 4 and Test 6 was the alumina content (9.78% vs. 41.17%). Addition of alumina in both the cases led to reduction of vanadium content in zone 1.
In Table 2, tests 1 and 4 (which led to formation of holes in the crucible) show significant presence of vanadium and nickel and other elements in Zone 1 (crucible). Zone 1 should ideally have only alumina. These results also show significant amount of aluminum (greater wt. % than initial slag composition) in Zone 2. This aluminum can come from the crucible material due to elements present in the corrosive slag.
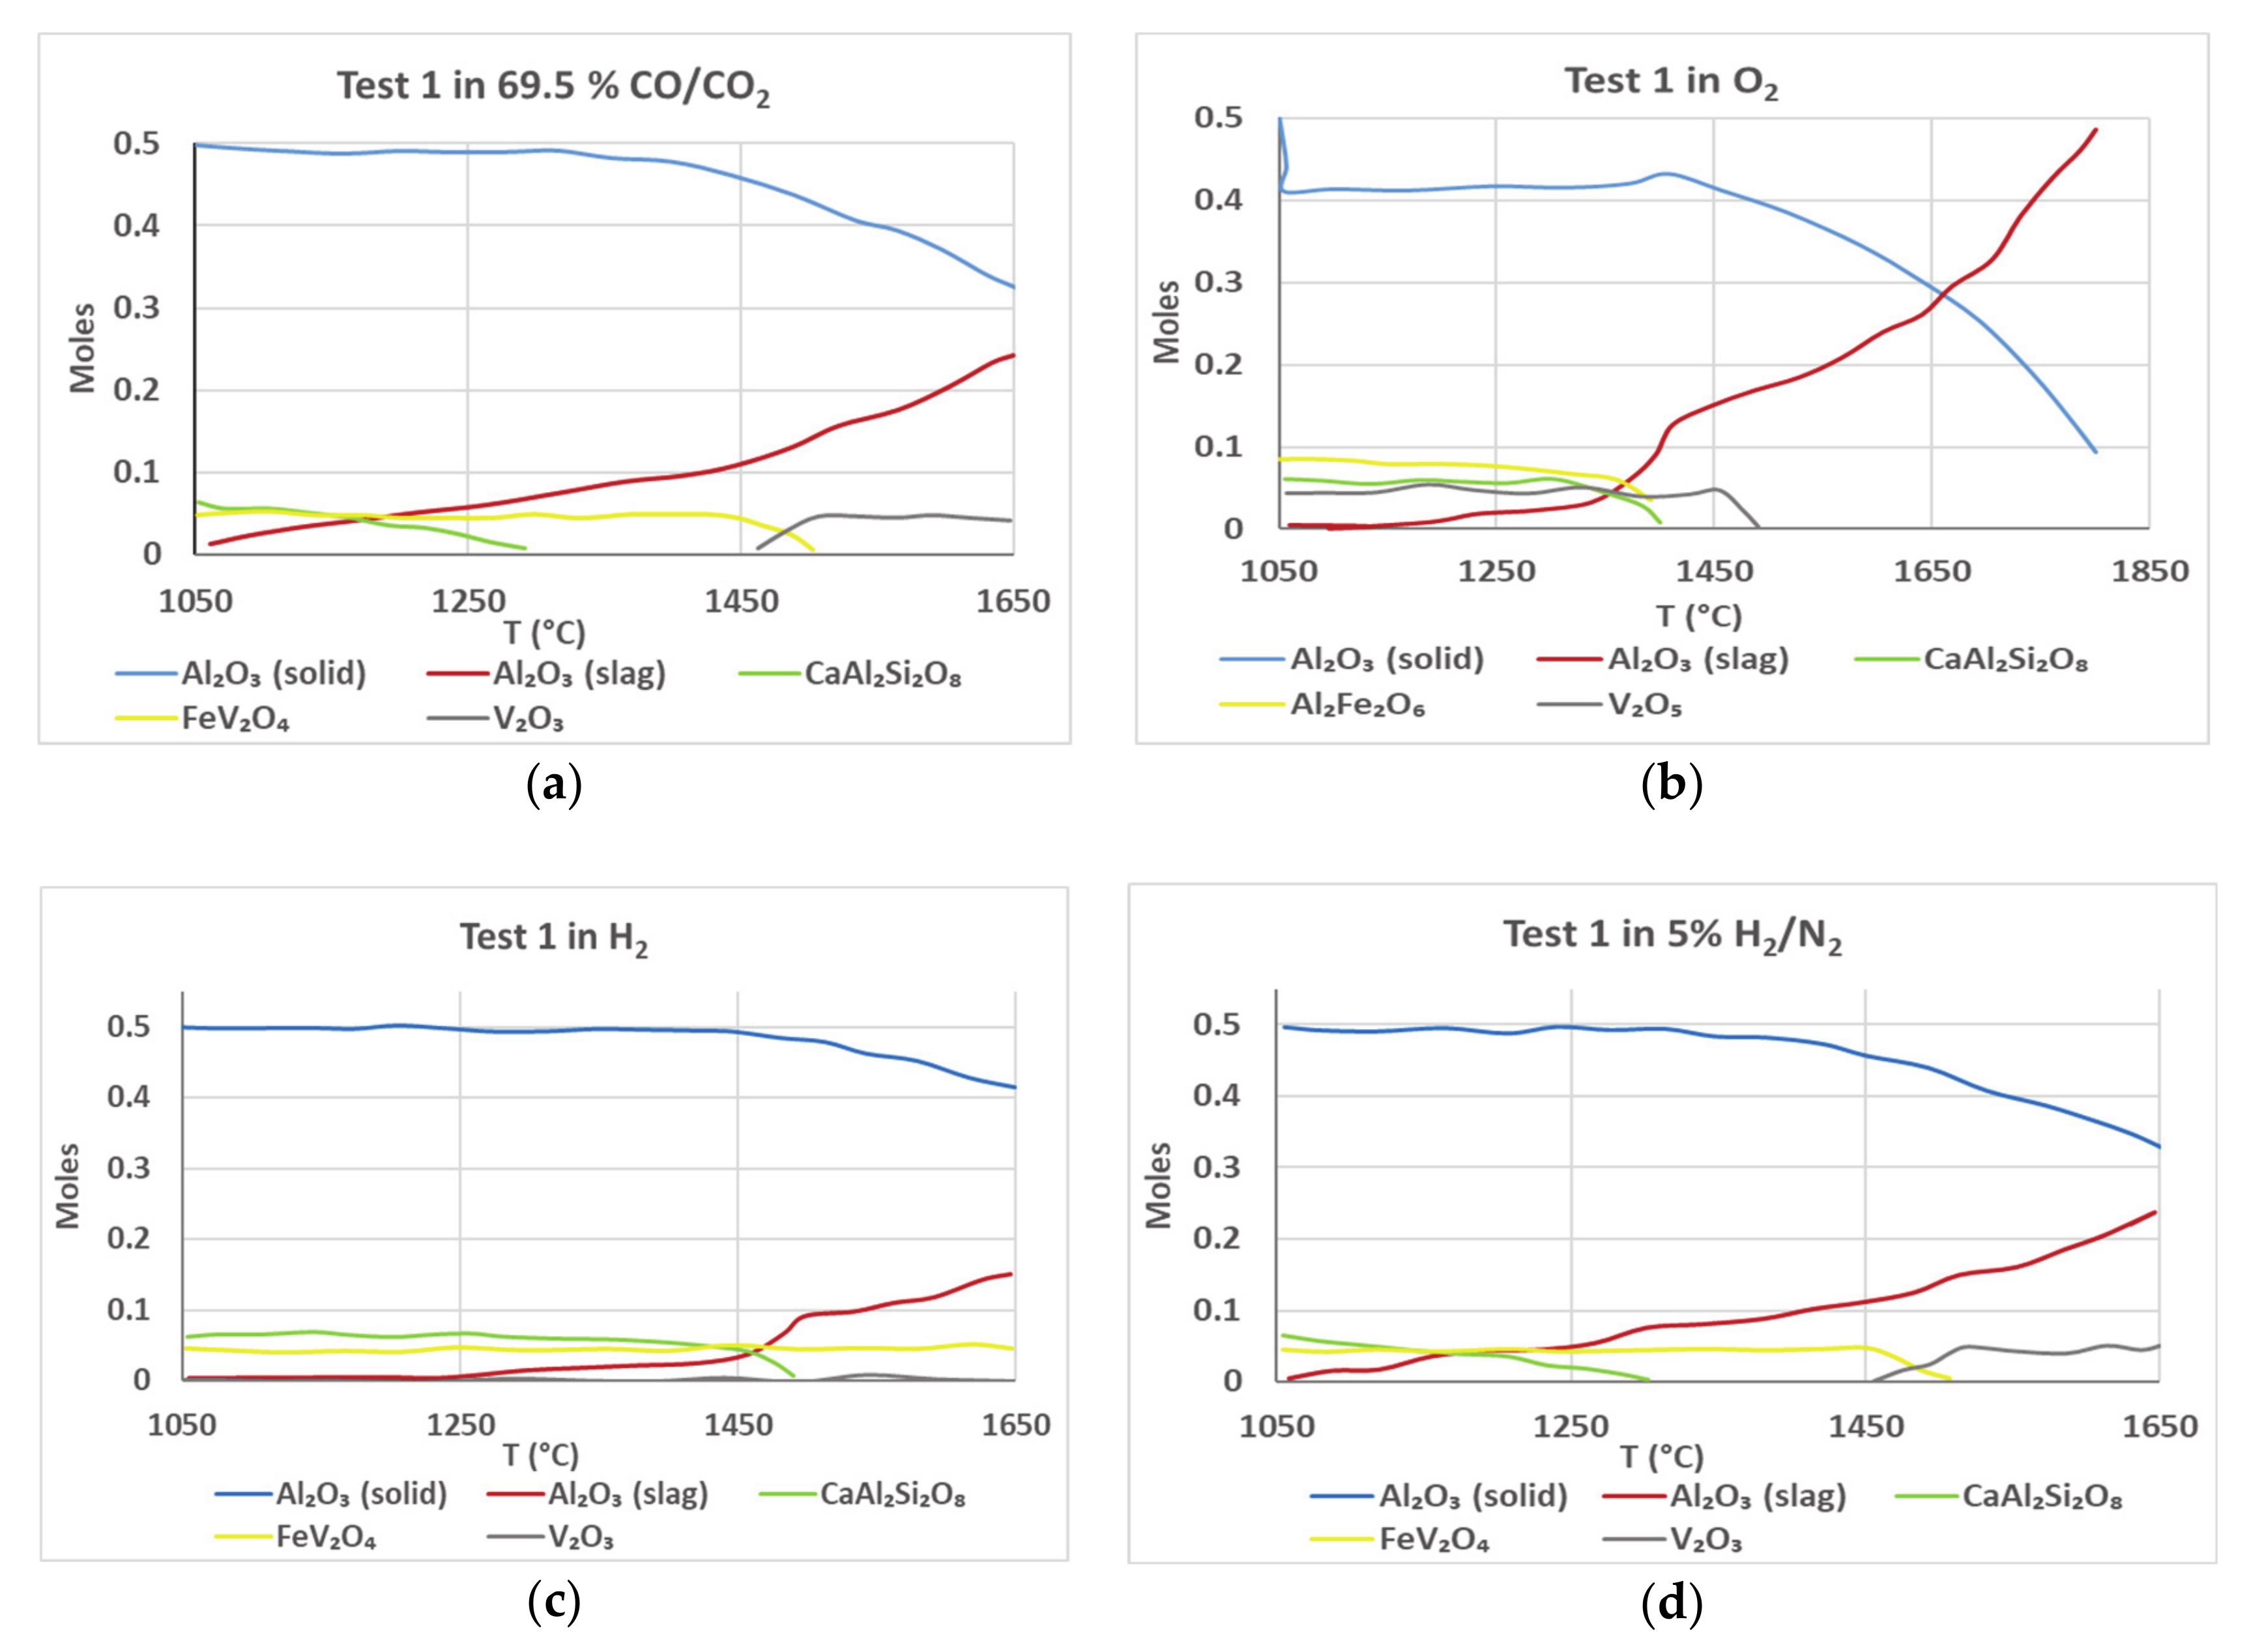
Figure 8 shows the FactSage simulation plots for Test 1 sample for various gaseous atmospheres. The plots show the composition in moles (on y-axis) as a function of temperature (x-axis). To simulate the conditions that are encountered during viscosity measurement, two different phases of alumina—gamma and corundum—were included in the input to FactSage. This was done solely based on their different melting points and stability at 1500 °C. Gamma alumina is used to represent the powdered alumina in the slag and corundum is used to represent the alumina from the crucible. Due to this setup, a comparison of the levels and rates of changes between these two components would be indicative of the dissolution of powdered alumina and the crucible into the molten slag at different temperatures. The blue plots indicate the content of alumina in the crucible/refractory as a function of temperature, while the red plots show the content of alumina predicted to be present in the slag at equilibrium. As the crucible/refractory dissolves, the equilibrium moles of alumina in the crucible wall would drop, while the number of moles of alumina in the slag rise.
The simulation shows that dissolution of crucible is the maximum under oxidizing conditions (pure O2) and minimum in a pure H2 atmosphere. At 1500 °C—the highest temperature achieved during the viscosity measurement—FactSage predicts the presence of about 0.17 moles of Al2O3 in the liquid slag (Figure 8b). However, the initial slag composition consisted of only 0.04 moles of Al2O3. Thus, there is a deficit of about 0.13 moles of Al2O3 in the liquid slag. Similarly, analysis under CO/CO2 and pure H2 atmospheres shows a deficit of 0.1 moles and 0.05 moles, respectively. This deficit could be one of the reasons for the dissolution of alumina into slag, as the system tries to reach thermodynamic equilibrium.
The plots of V2O3 and FeV2O4 concentration are symmetric, suggesting that the drop in concentration of one is directly related to the rise in the concentration of the other. Vanadium is predicted to exist as FeV2O4 at temperatures below 1450 °C in all conditions. At higher temperatures, depending on the atmosphere, it dissociates into V2O3, simultaneously causing a sharp drop in the alumina content of the crucible. This leads credence to the observation that the thermal stability of FeV2O4 is related to the stability of the alumina crucible, and that V2O3 is the component that reacts with alumina.
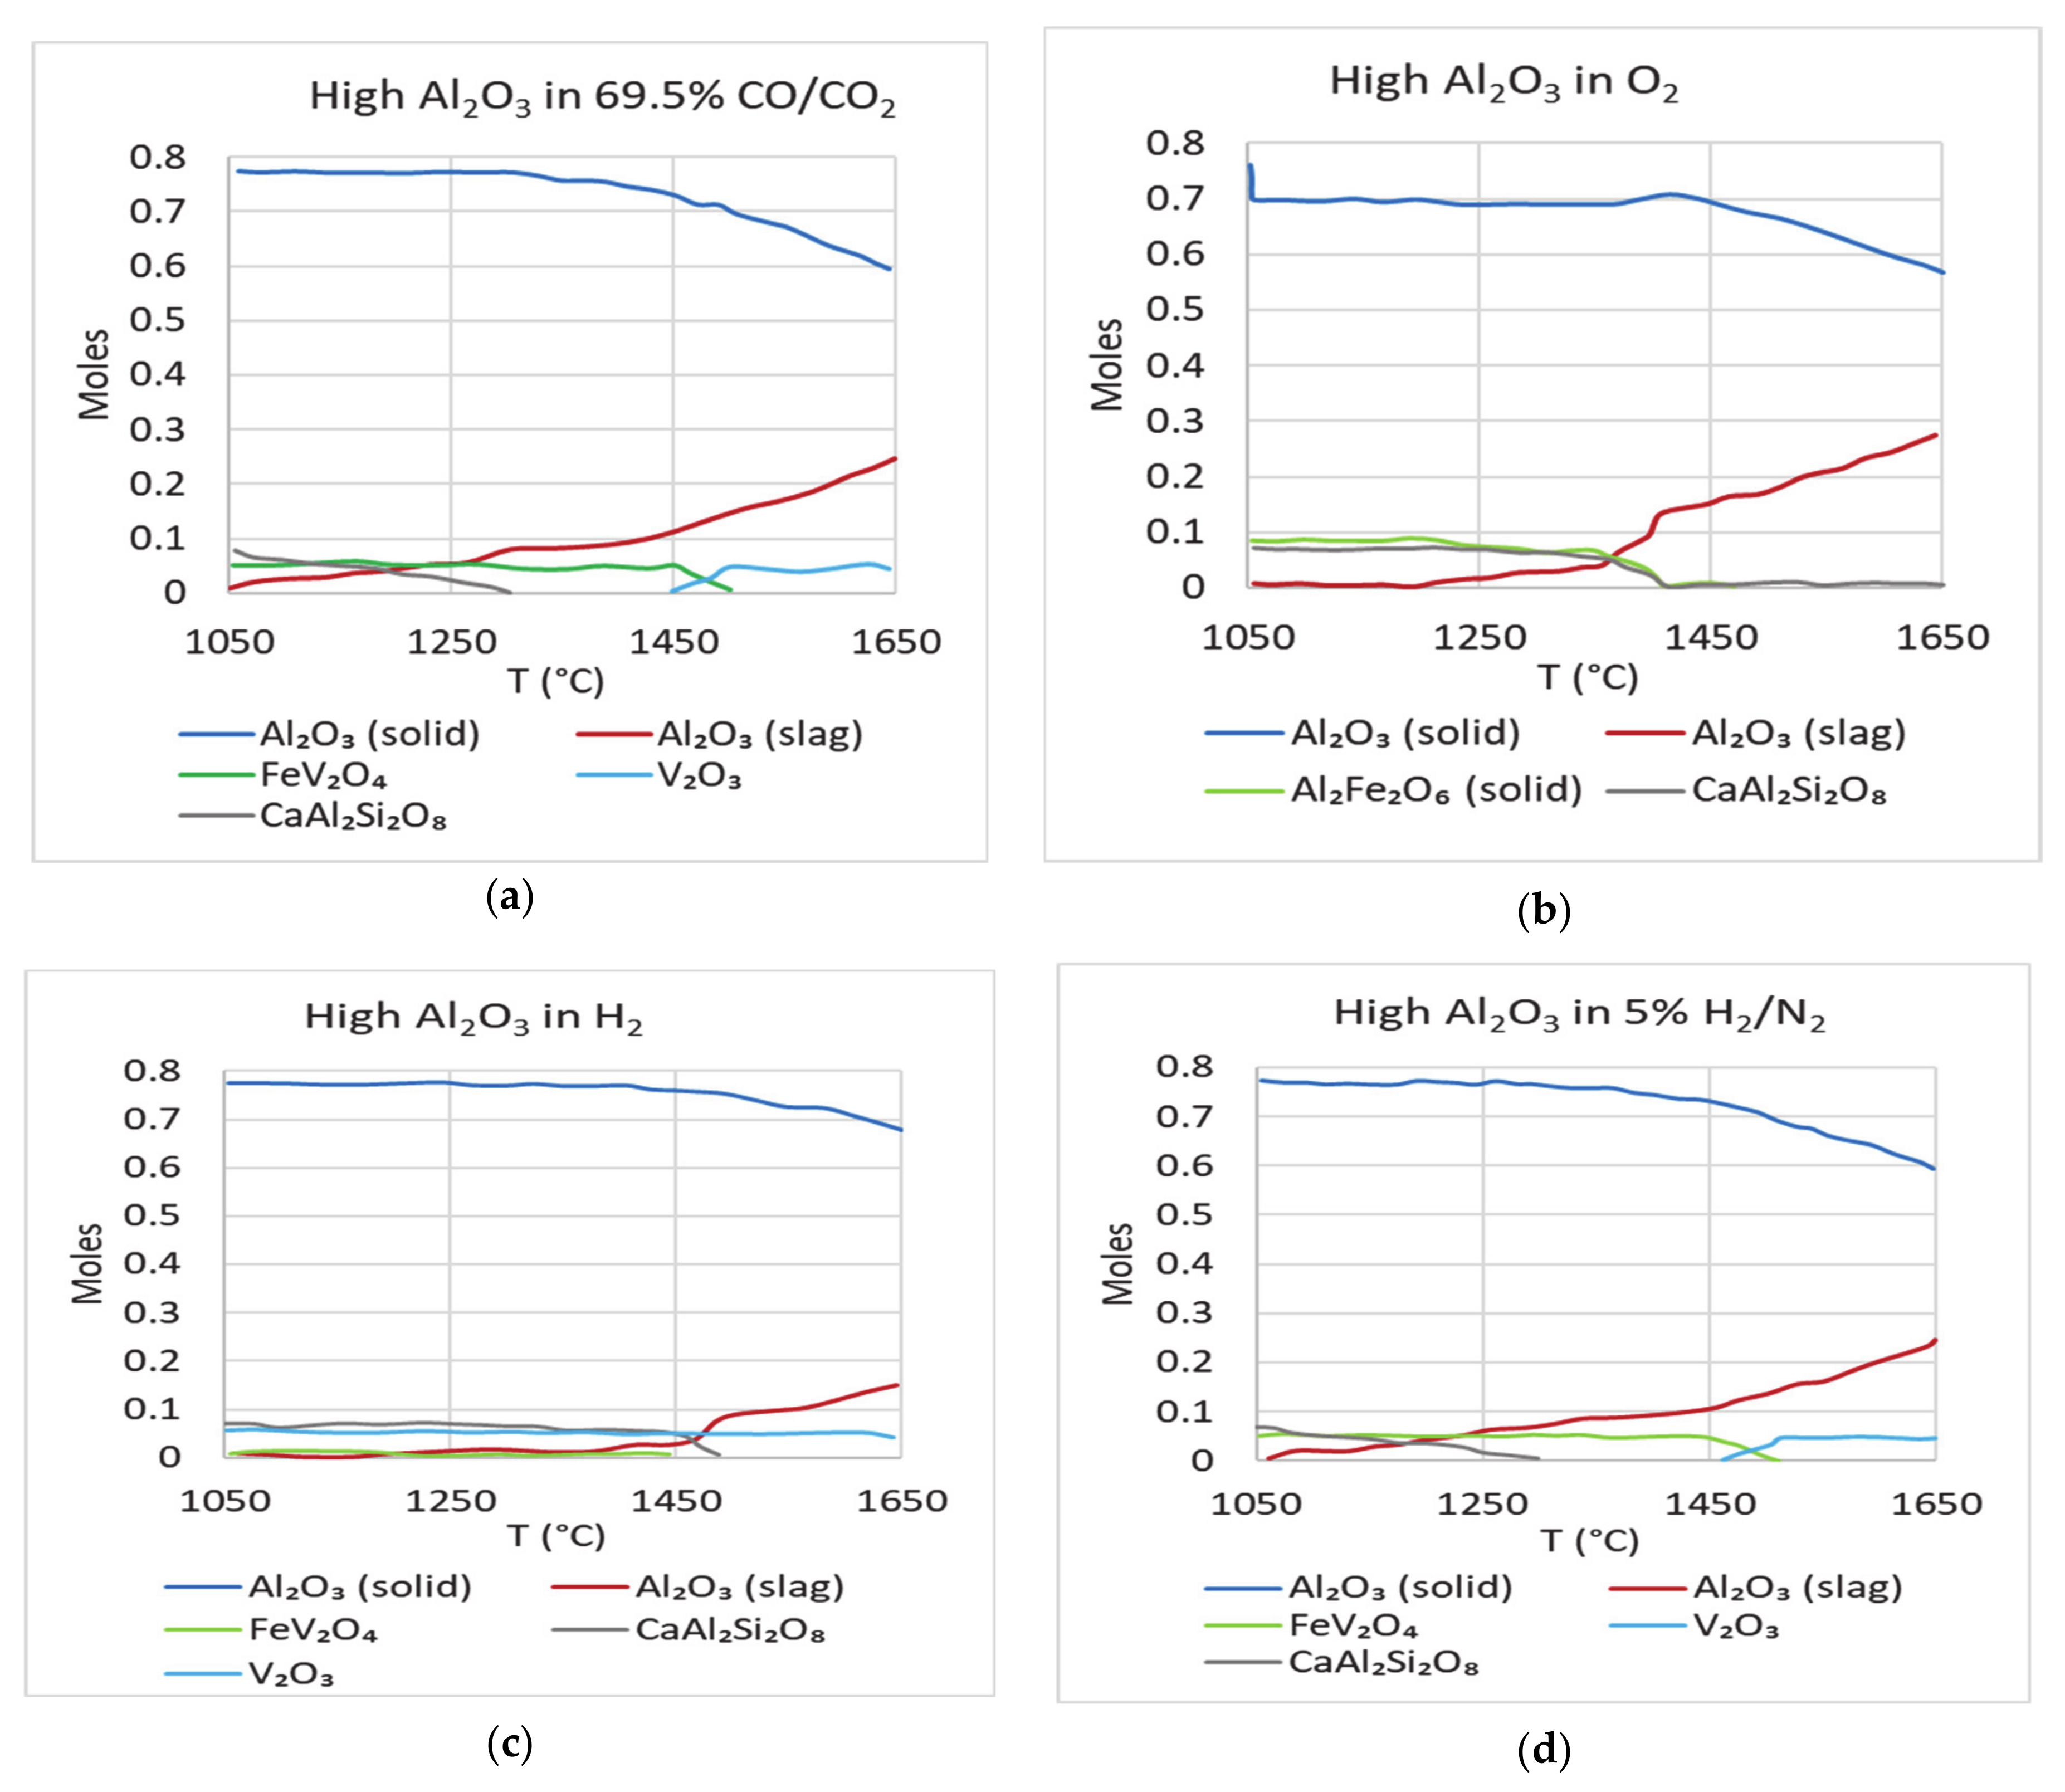
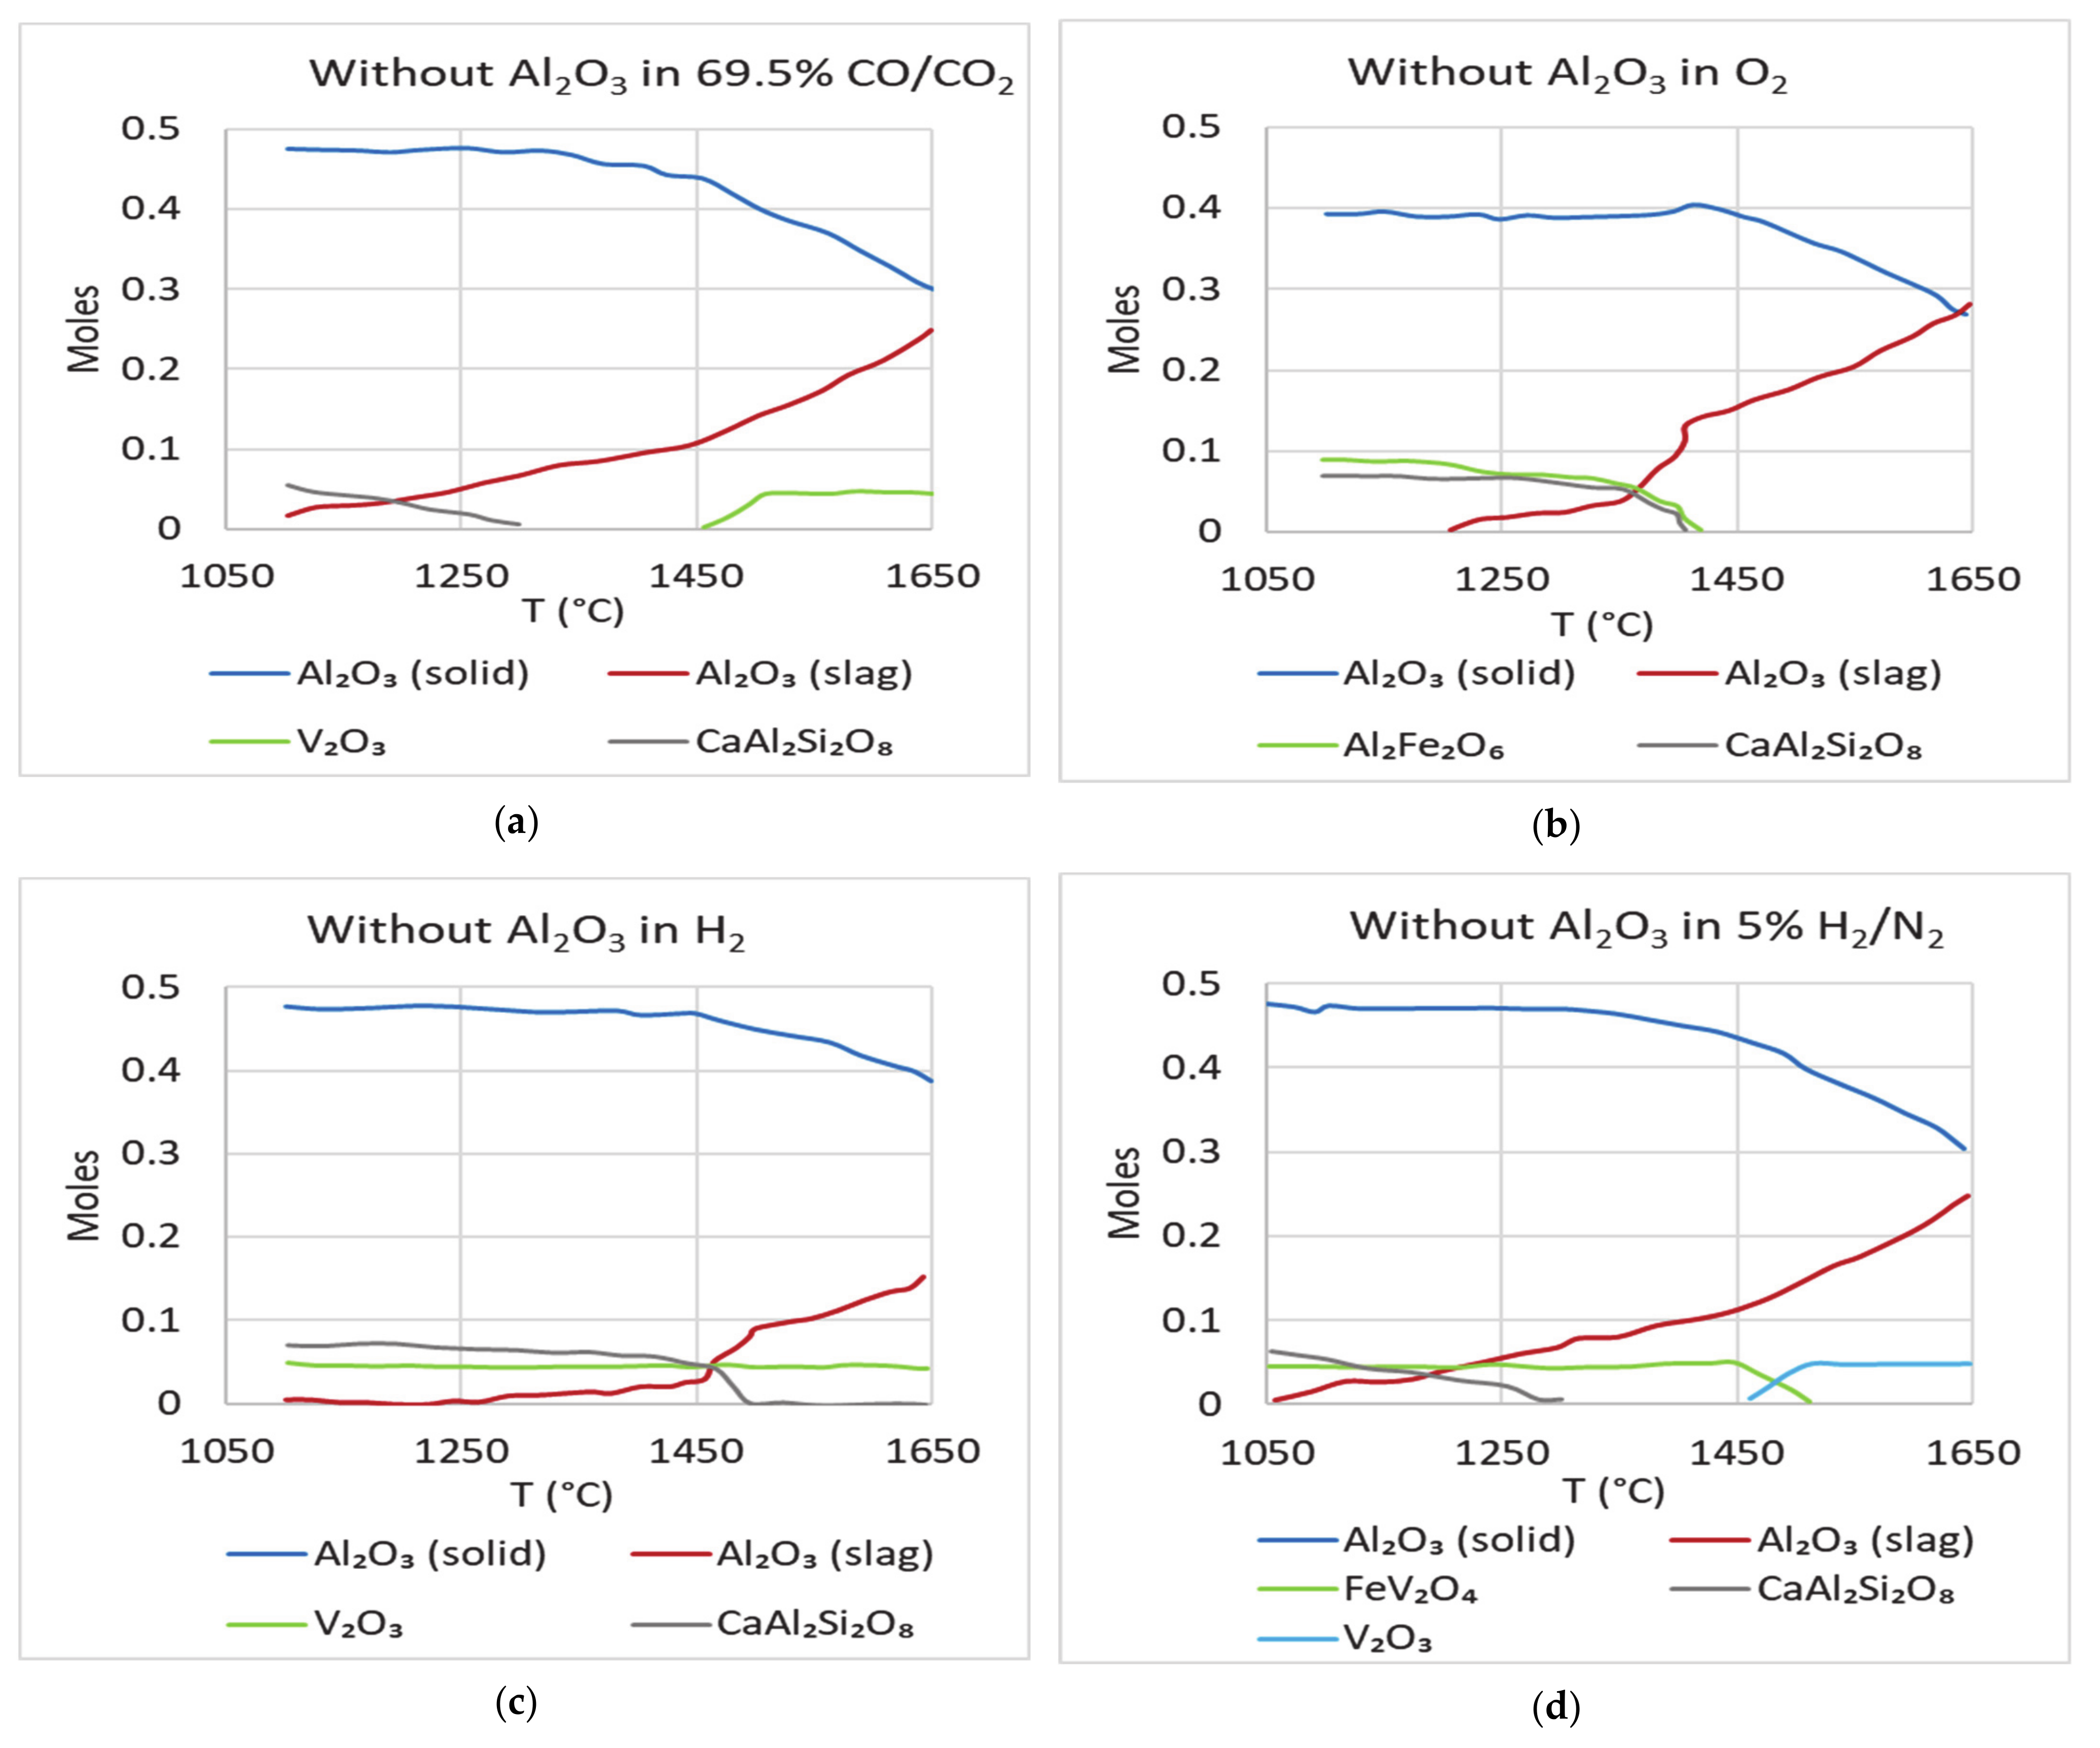
Figure 9 shows the plots obtained for Test 1 sample with additional alumina added (0.3 moles against 0.04 moles), while keeping all other components at the same levels. The amount of additional alumina was decided based on the deficit observed in the previous simulations (Figure 8). The plots show that addition of alumina did not change the equilibrium content of alumina in the slag. It did, however, lead to lesser dissolution of alumina from the crucible/refractory. The loss of alumina, which was approximately 40% earlier, dropped to about 25%. To study how the absence of alumina in the starting mixture affects the equilibrium prediction, a simulation for Test 1 mixture without alumina was carried out. The equilibrium plots (Figure 10a–d) are the same as in the previous case, indicating that alumina in this case would definitely be coming from the refractory, as the system tries to reach equilibrium. Figure 11 shows the simulations of the synthetic petcoke slag with both alumina and vanadium absent. The dissolution of alumina into the slag is predicted to be like other cases and is not affected in the absence of both these components. The dissolution of alumina from the crucible starts when the slag starts melting and continues until the system reaches equilibrium. This shows that when there is no alumina in the slag melted in alumina crucibles, it picks up alumina from the crucibles to reach thermodynamic equilibrium. The quantity of alumina picked up is dependent on the prevailing atmosphere and the slag temperature.
From the 16 simulations carried out (four compositions in four atmospheres each shown in Figure 8, Figure 9, Figure 10 and Figure 11), it is clear that FactSage predicts lower dissolution of Al2O3 into the slag when processed under 100% H2 atmosphere than when processed under an atmosphere of CO/CO2, which in turn shows less dissolution when compared to slags processed in O2 atmosphere. Though H2 provides the best atmosphere for preventing refractory dissolution, it also carries significant risk of explosion owing to the flammability of H2.
The plots also show that under a given atmosphere and at a given temperature, the quantity of Al2O3 present in slag form at equilibrium is a constant. It is also clear that the prediction of formation of various compounds does not change when the CO/CO2 atmosphere is replaced by 5% H2 atmosphere. Dissolution is found to be of the same order in both the cases. Thus, 5% H2/N2 gas mix may be used as a substitute for CO/CO2 mix for carrying out experimental validation of FactSage results.
FactSage simulations show that the dissociation of anorthite and dissolution of alumina from the crucible start simultaneously. However, most of the alumina picked up by the slag initially comes from the dissociation of anorthite. Dissolution of alumina from crucible increases after complete dissociation of anorthite. This might indicate the slag’s preference towards the different phases of alumina, especially alumina that is freely available (in powder form as part of slag). This preference strongly supports the assertion that slag starts dissolving alumina from the crucible when there is not enough of it in the initial mix.
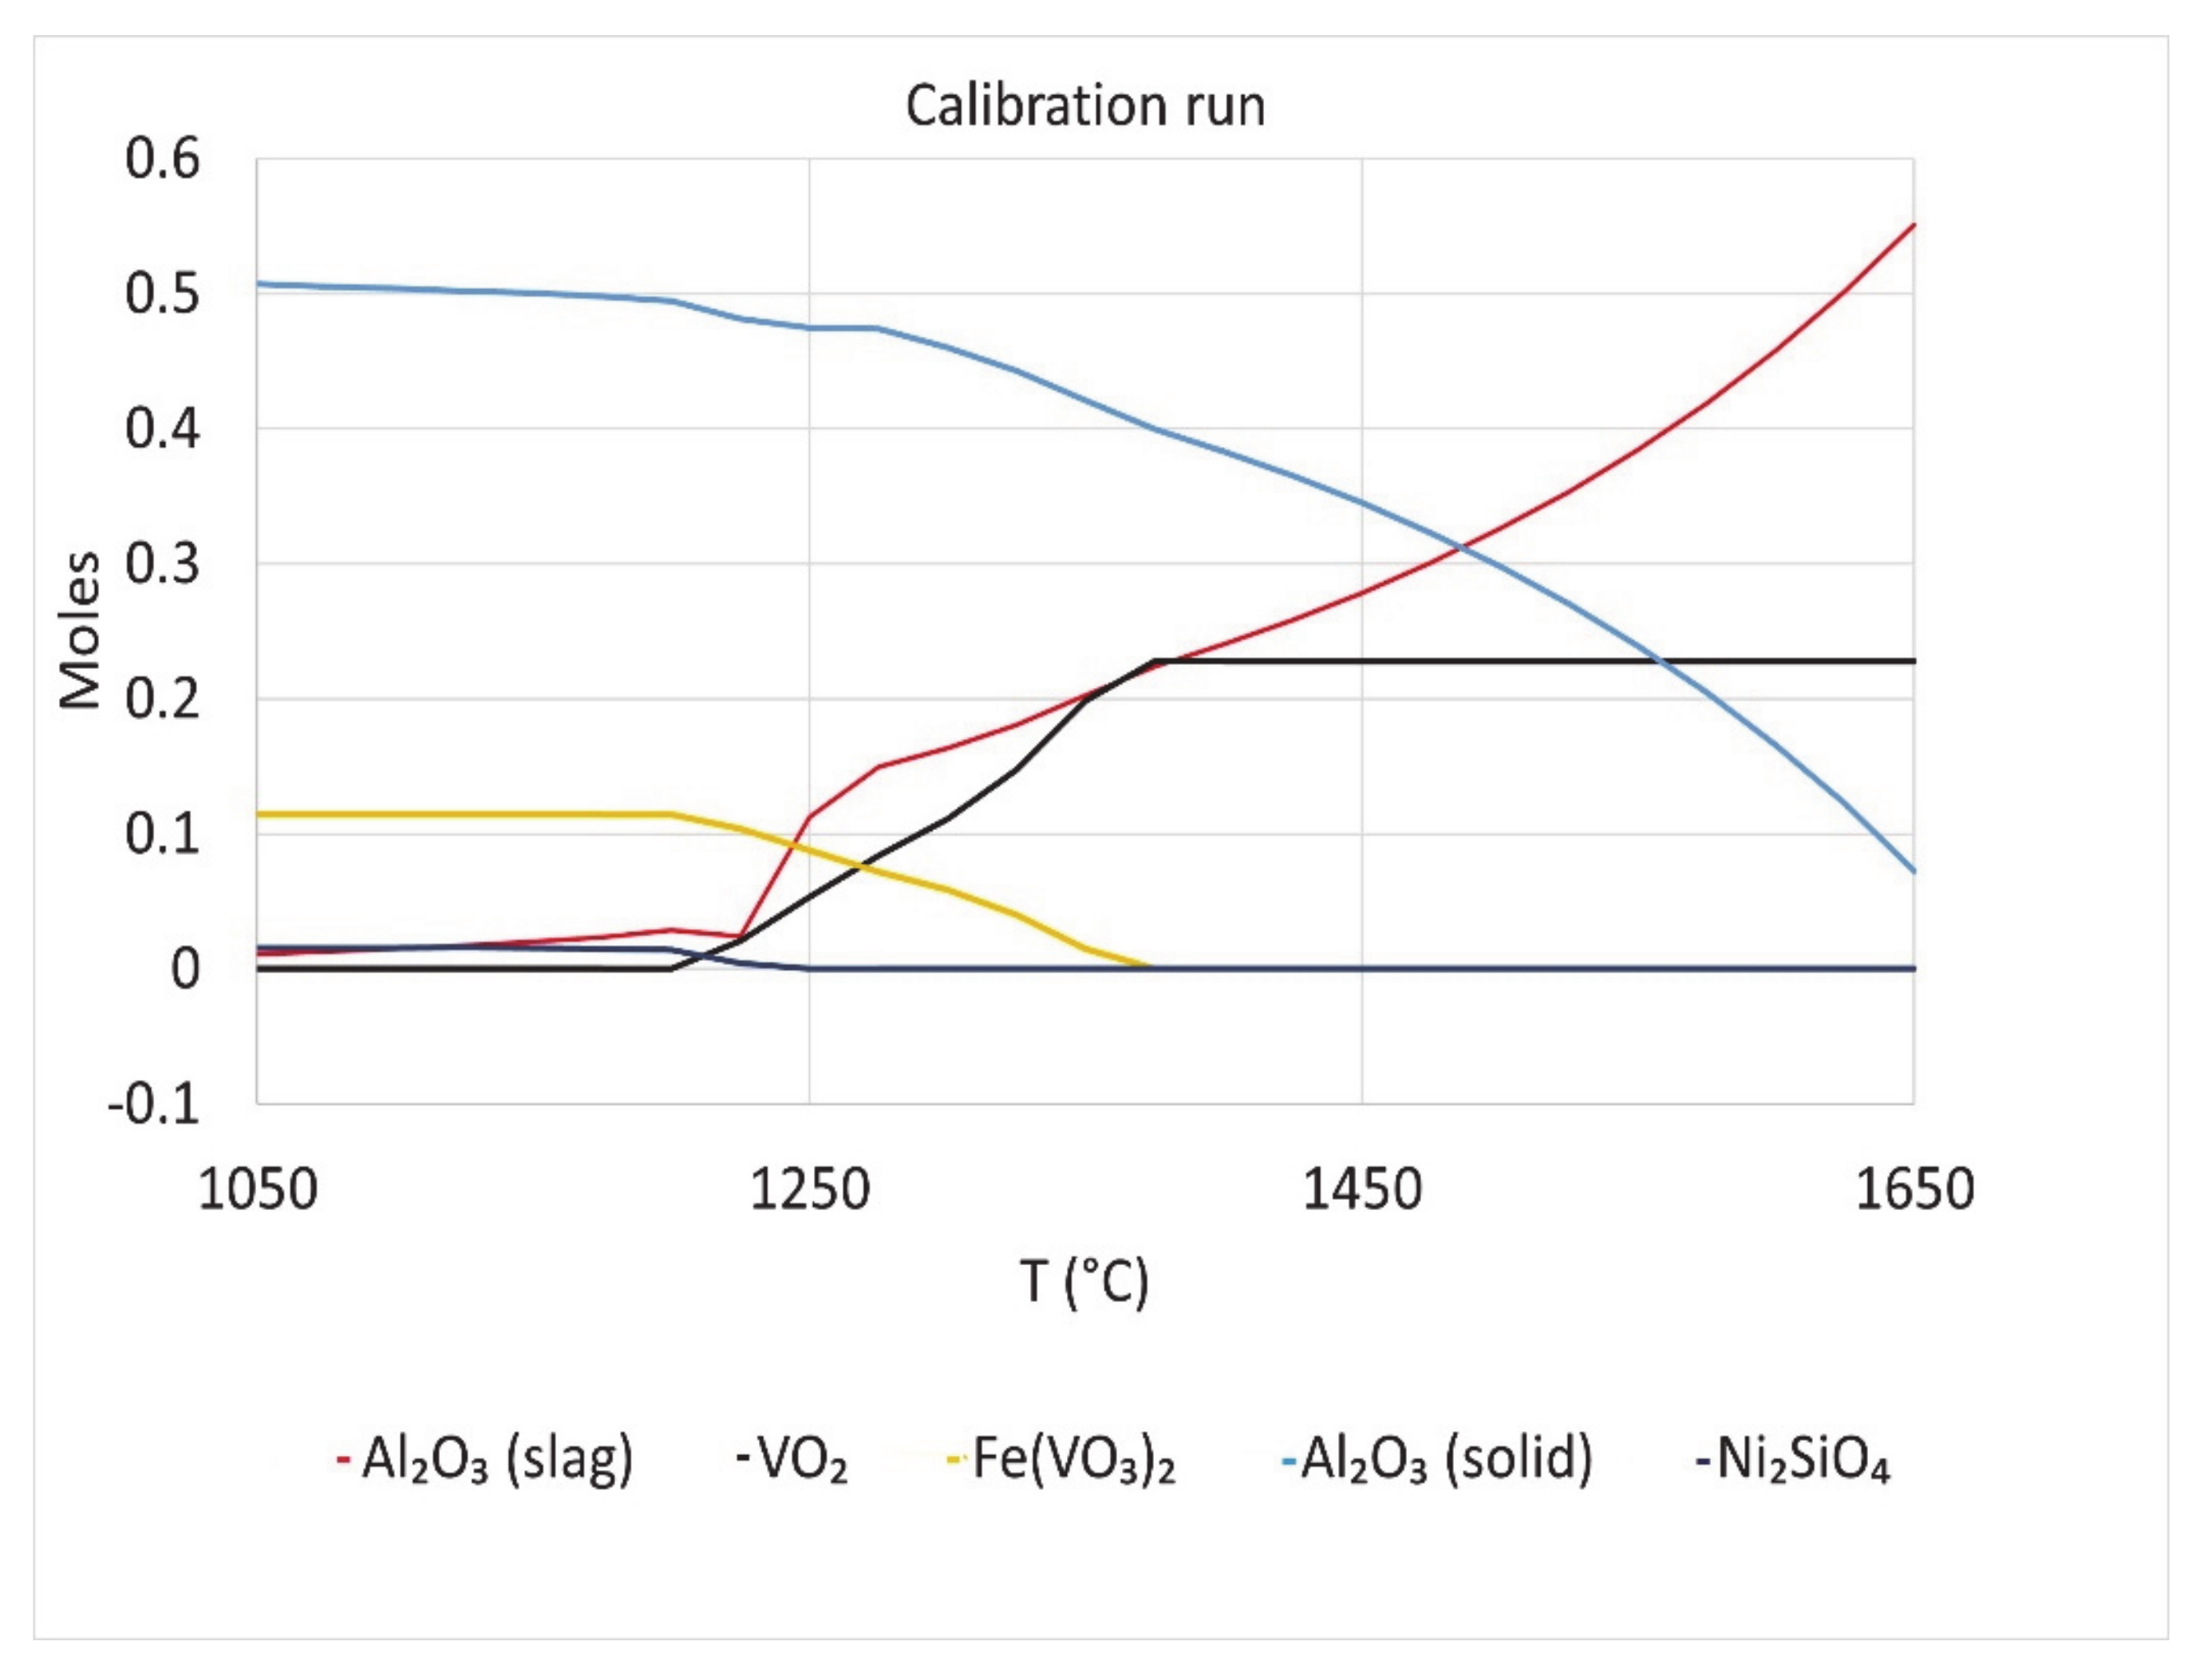
FactSage calculations were done with the composition used in the Calibration run. The results are shown in Figure 12. The additional compounds in the P2 sample of the work of Duchesne [12] were included in the simulations done in N2 atmosphere. The two curves of moles of Al2O3 indicate dissolution of Al2O3 from solid to liquid slag phase as temperature increases. This was seen in the bulk composition of P2 slag before and after viscosity test done in alumina crucible in the work of Duchesne. Al2O3 content increased by about 6% in the slag after the viscosity test [12]. Ni2SiO4 is present in the thermodynamic calculation results. Ni2SiO4 was found by Li et al. in petcoke ash slag obtained under oxidizing conditions [13,14].
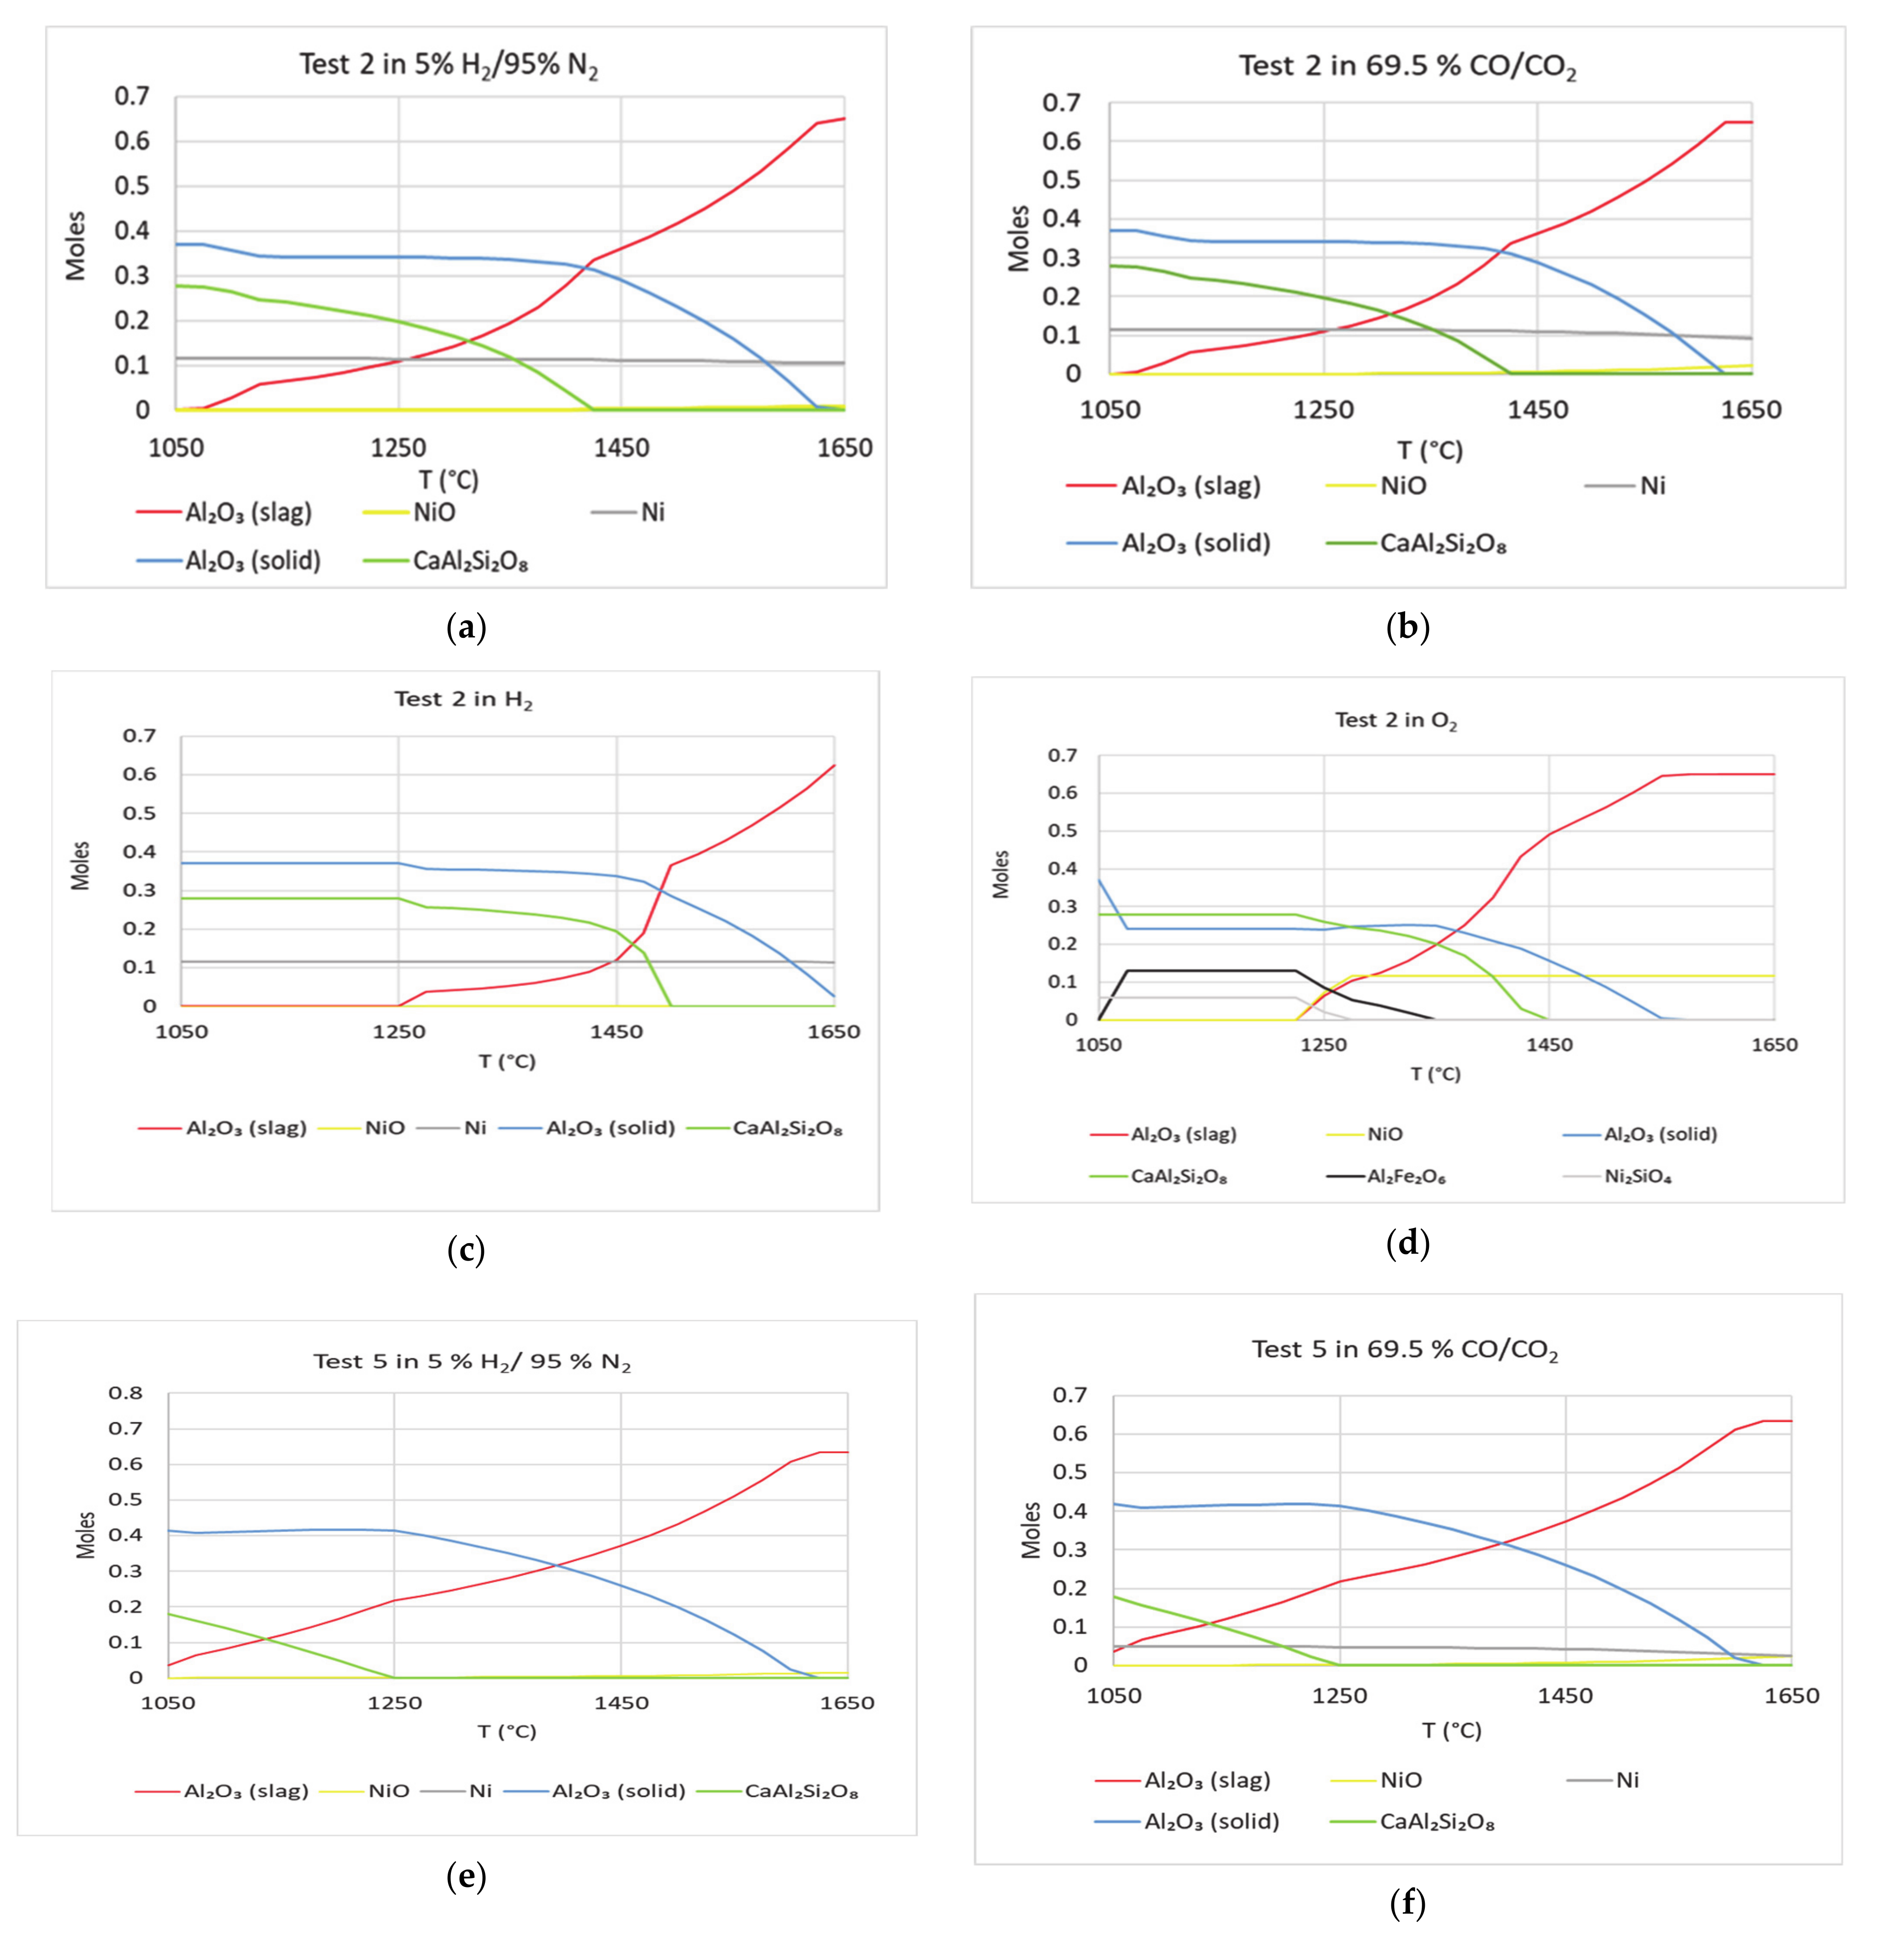
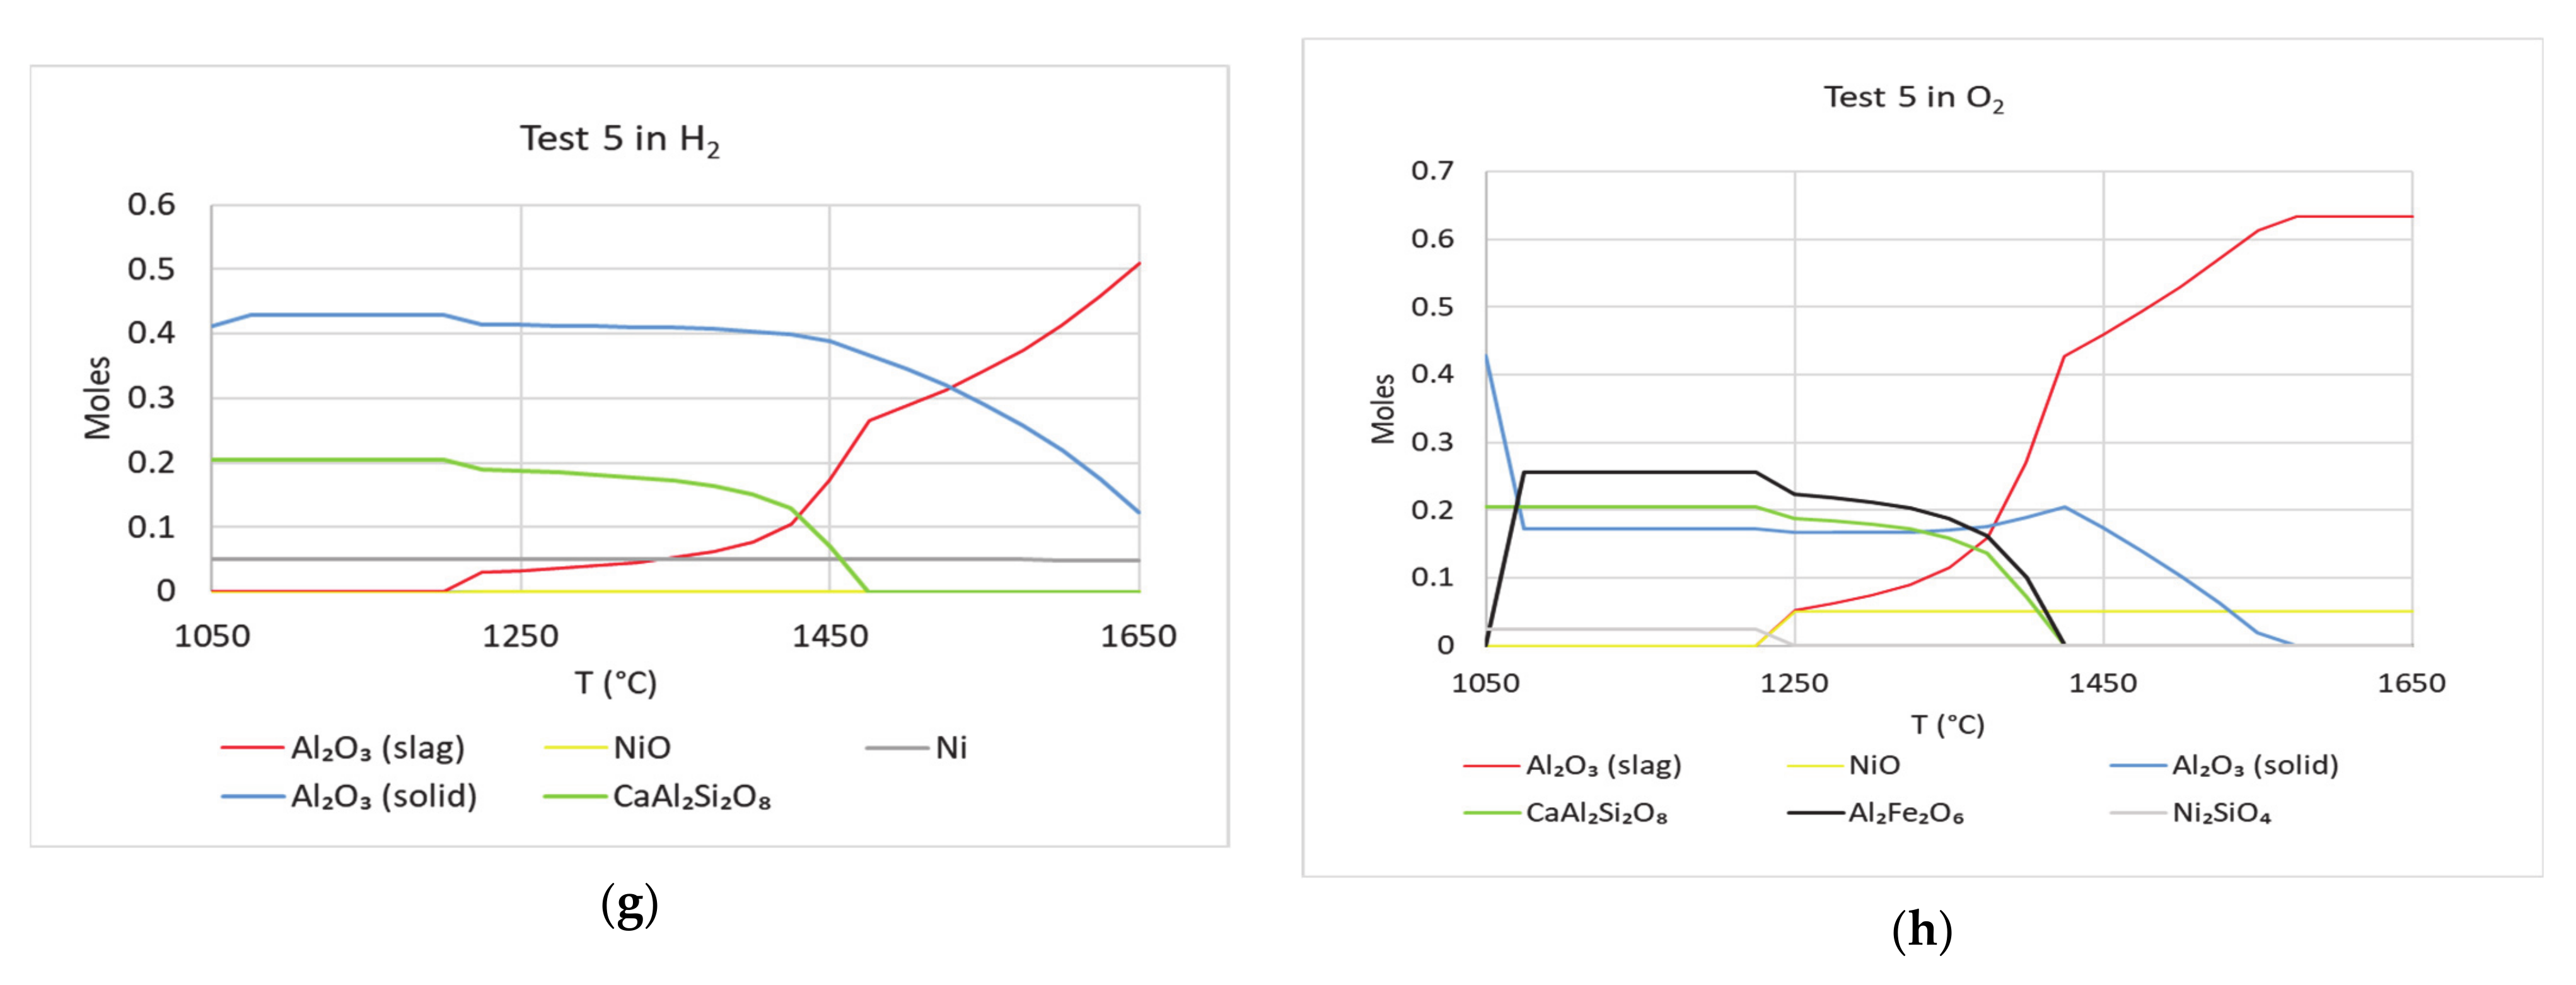
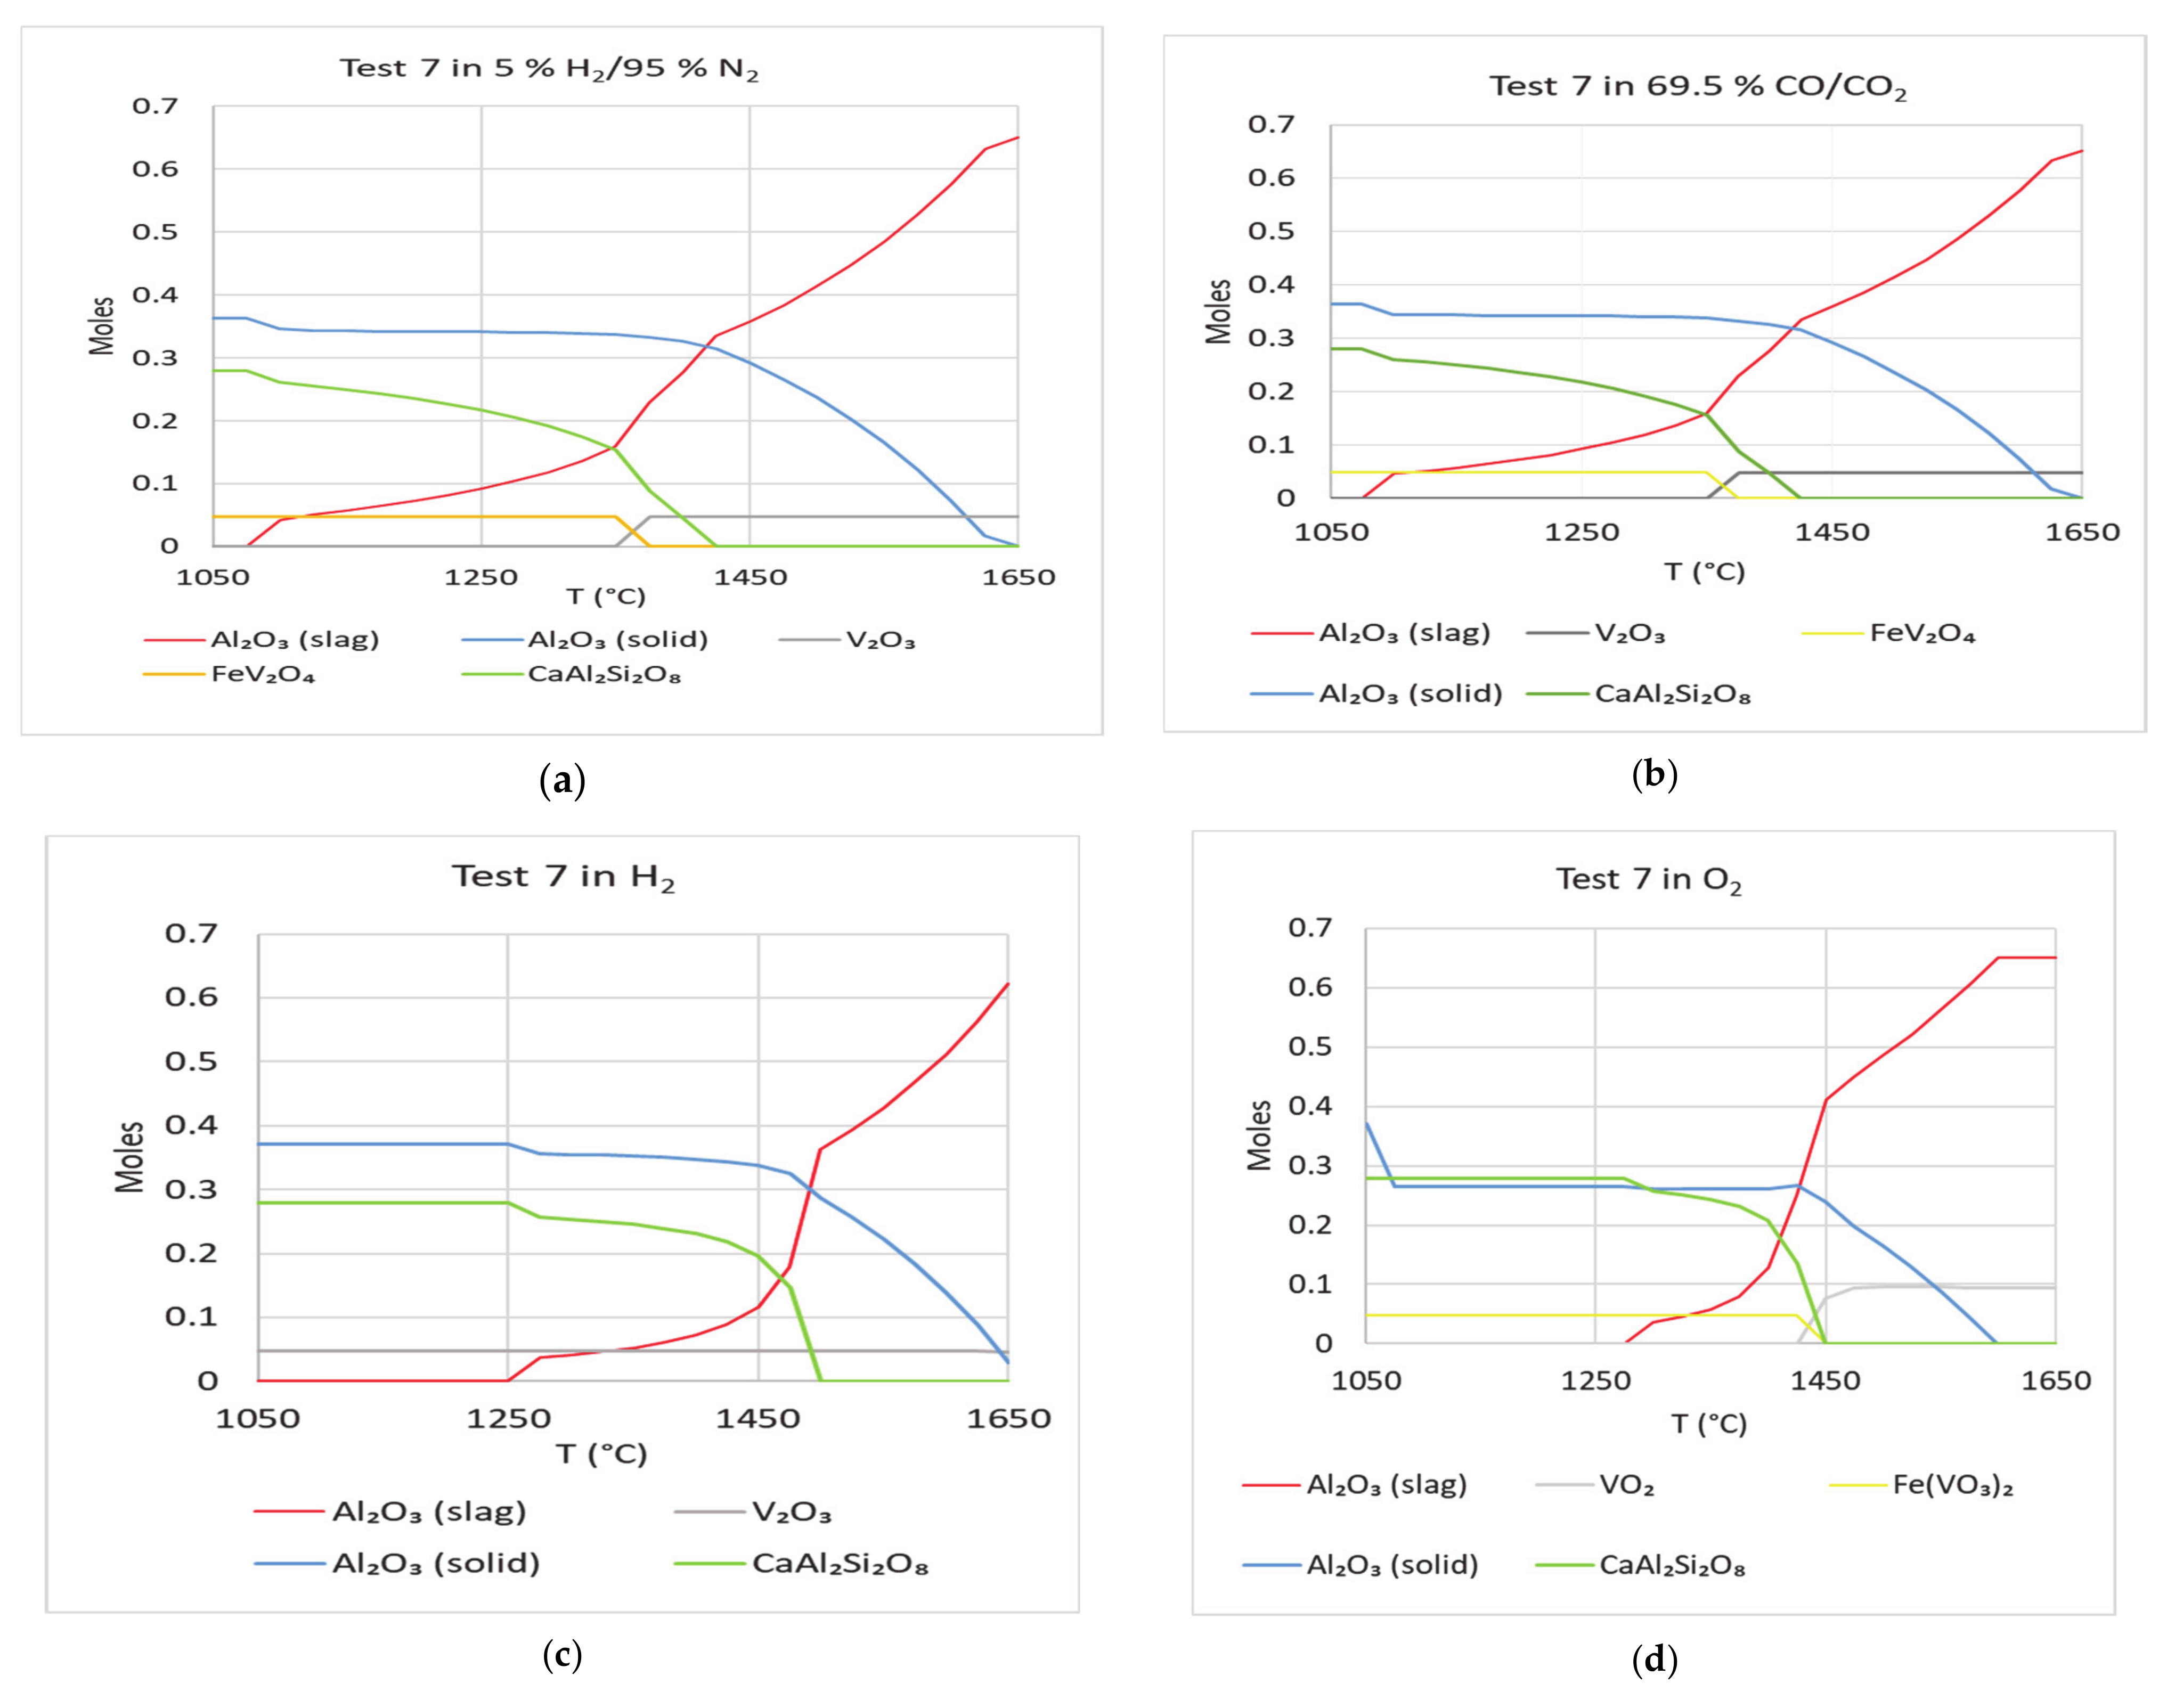
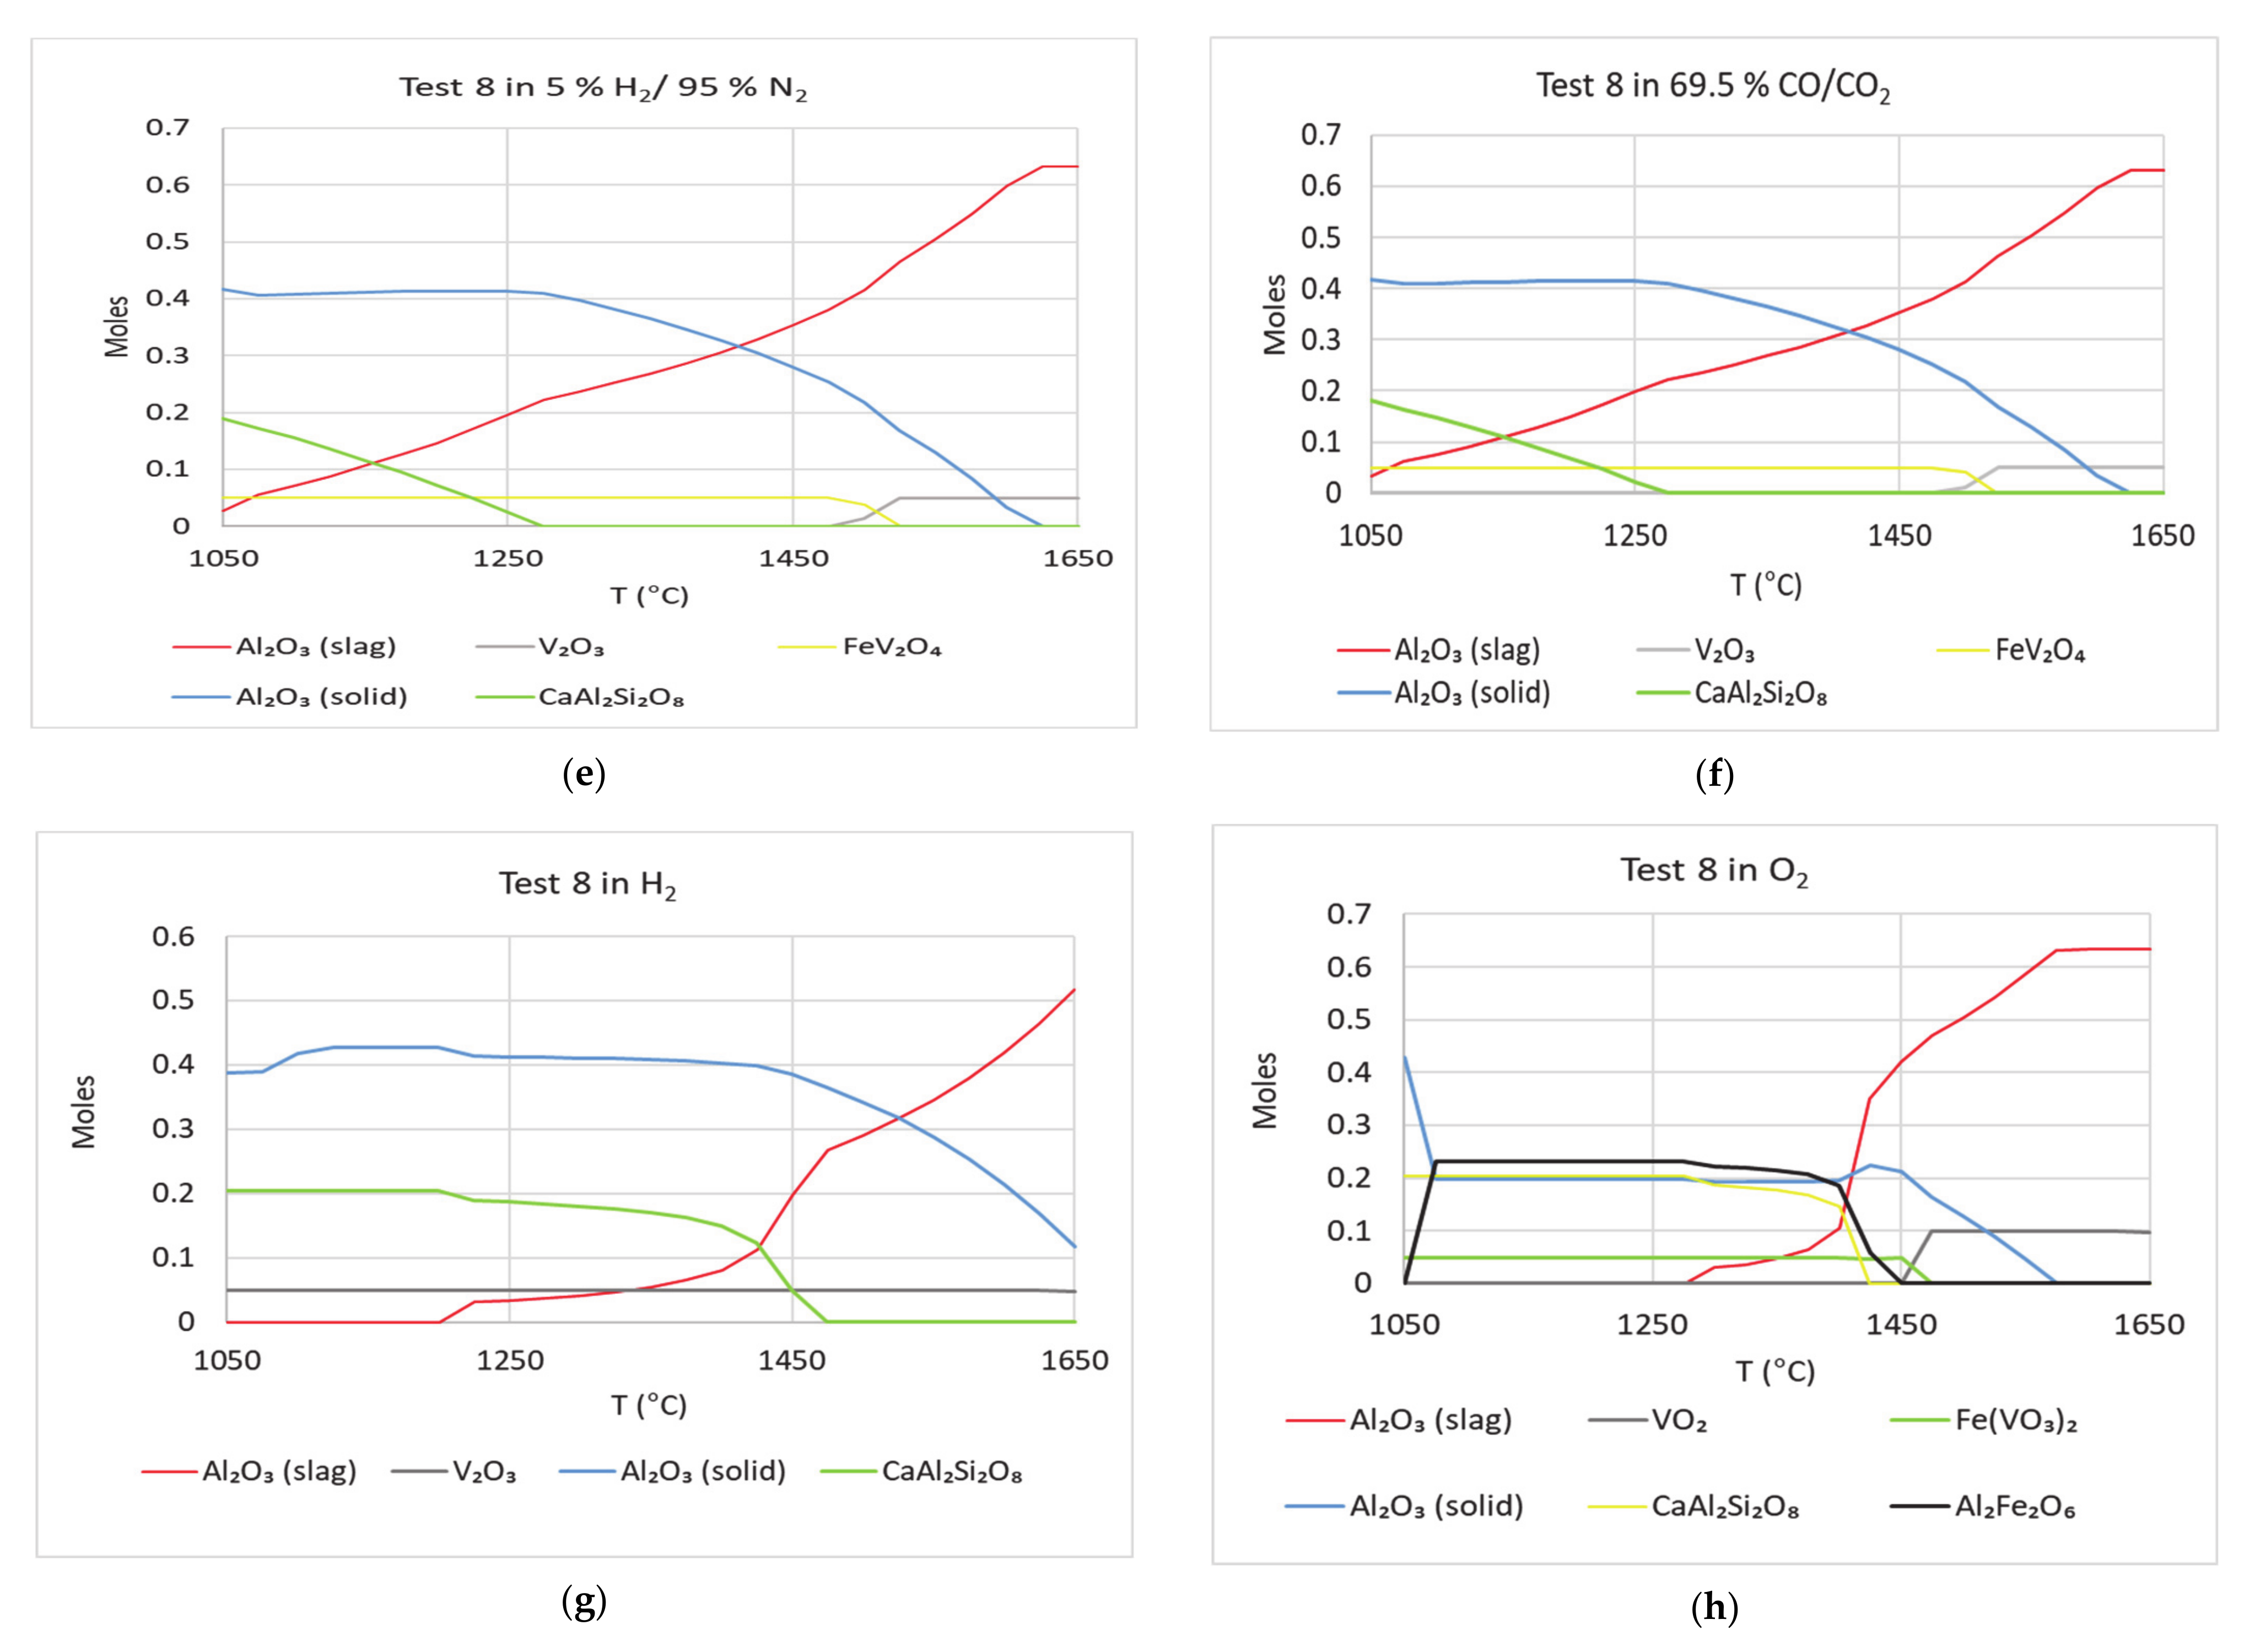
In Figure 13, FactSage calculations with compositions from test 2 and 5 are shown under four different atmospheres. These calculations were performed to study the effect of Ni in dissolving Al2O3 crucible. Under oxidizing conditions, in tests 2 and 5, Ni2SiO4 is found in the FactSage calculations. This parallels the stated findings of Li et al. [13,14]. In comparison with Figure 8, the plots in Figure 13 show that drop in Al2O3 (solid), occurs at lower temperatures. This is valid for all the cases shown in Figure 13. Thus, dissolution of Al2O3 crucible can be dependent on the presence of Ni compounds. This parallels the results of Table 2—Al concentrations in Zone 3 of tests 2 and 5 are lower than their corresponding concentrations in the initial slag compositions. In addition, Ni was found in Zones 1 and 2 in significant amounts in tests 2 and 5. Under oxidizing conditions, similar to Figure 8, rate of drop in Al2O3 (solid) is highest. Compositions in tests 7 and 8 were derived from the compositions in test 2 and 5, respectively. Except NiO, the rest of the oxides were kept the same—amounts of NiO and V2O5 were interchanged. Tests 7 and 8 were not part of the experiment test matrix. These were added to determine the effect of vanadium in alumina dissolutions from the crucible using simulations and compare with literature. FactSage simulations were run for tests 7 and 8. Results of the calculations are shown in Figure 14. The curves of Al2O3 (solid) are similar in Figure 13 and Figure 14. When NiO is replaced by V2O5, the rate of dissolution is about the same. In oxidizing atmosphere, the rate of drop in Al2O3 (solid) is highest. It is known that vanadium can corrode alumina refractories [5]. Under oxidizing conditions Fe(VO3)2 is seen in Tests 7 and 8. This phase was also found in FactSage calculations by Li et al. [14]. Other oxides used in tests 2 and 5 can be responsible for dissolving alumina from crucible. If nickel did not play any role in dissolving alumina, then the effect would have been more with the addition of vanadium. Thus, nickel can play a significant role in Al2O3 refractory degradation. The phases V2O3 and FeV2O4 appeared in simulations of tests 7 and 8. These phases have been found in petcoke ash experiments by other researchers [14,15,16,17,18].
The mechanism for vanadium-alumina interactions were discussed by Jonayat et al. [8]. Al-O bond energy is much lower than V-O bond energy. Thus, under reducing conditions, V2O3 tends to settle in the subsurface of Al2O3′s crystal. In rich slags, this Al2O3 comes from the oxide mixture, while in deficit slags, it comes from the crucible. This corroborates the observation in this study that addition of alumina to the slag reduced the dissolution of crucible alumina into the slag. Under oxidizing conditions, this phenomenon would be reversed, causing vanadium to segregate to the surface and thus increasing the chances of interaction of those surface atoms with the crucible. This mechanism also explains the higher dissolution of alumina into the slag under oxidizing conditions.
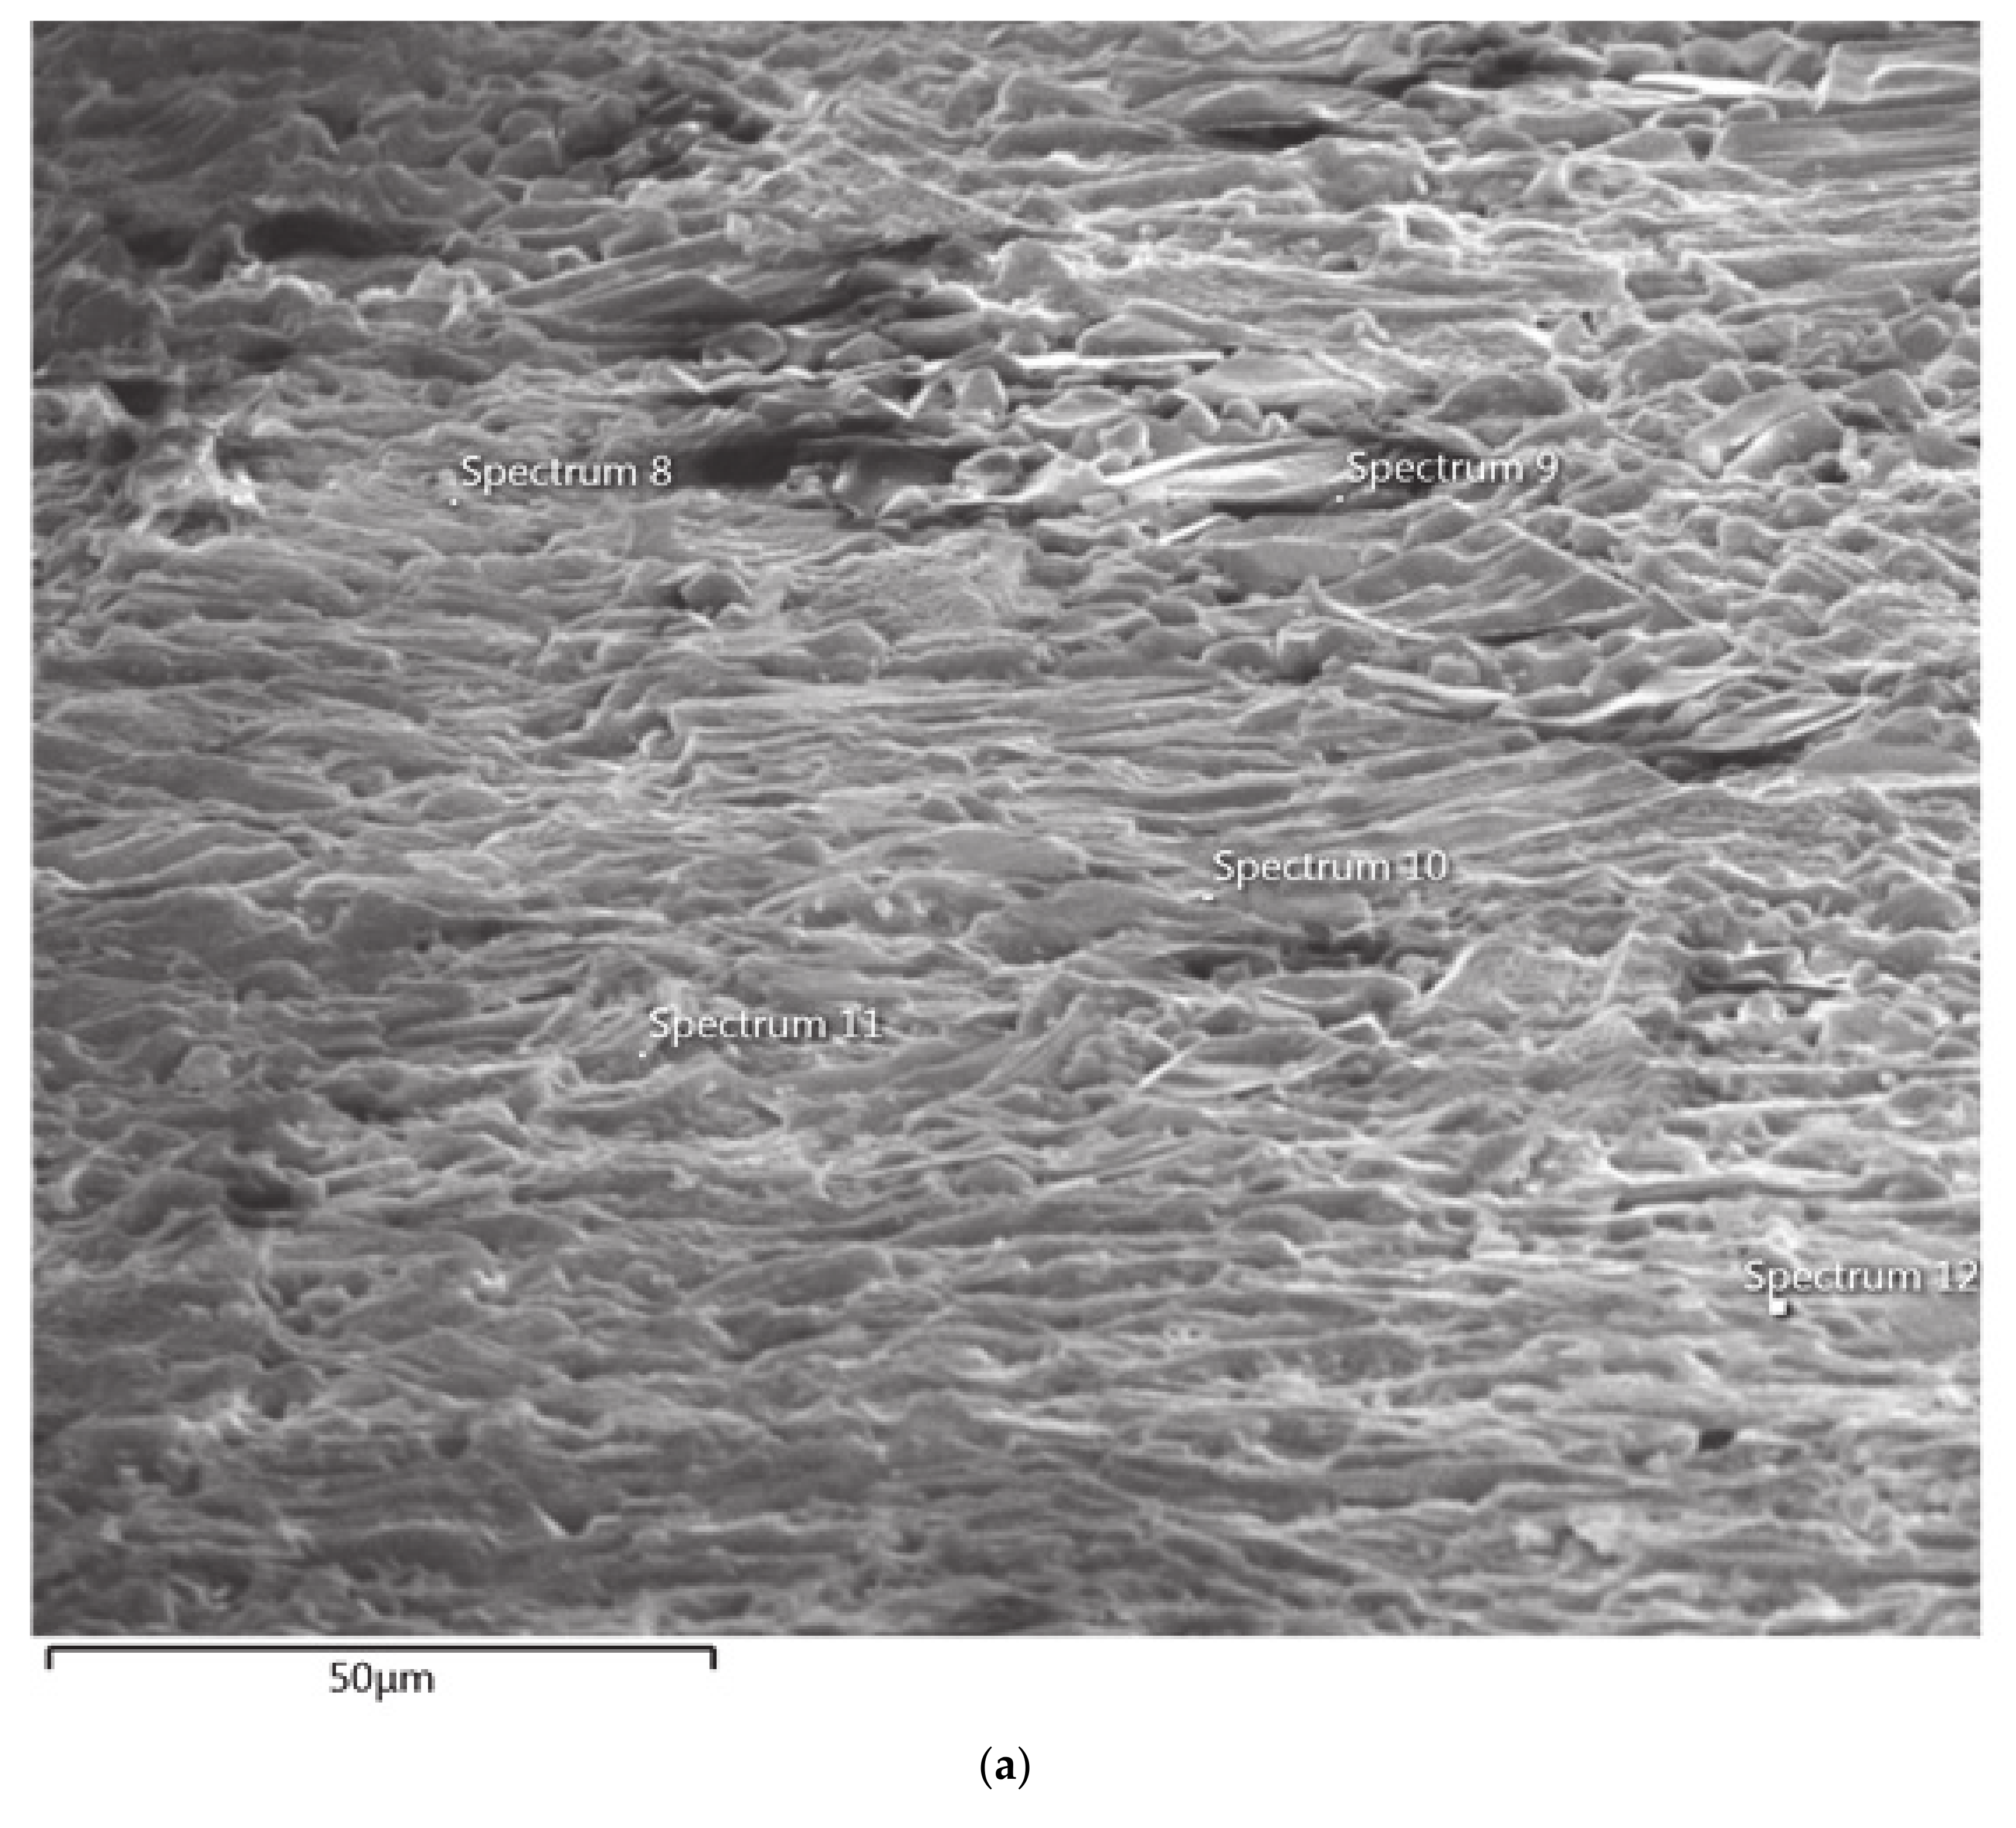
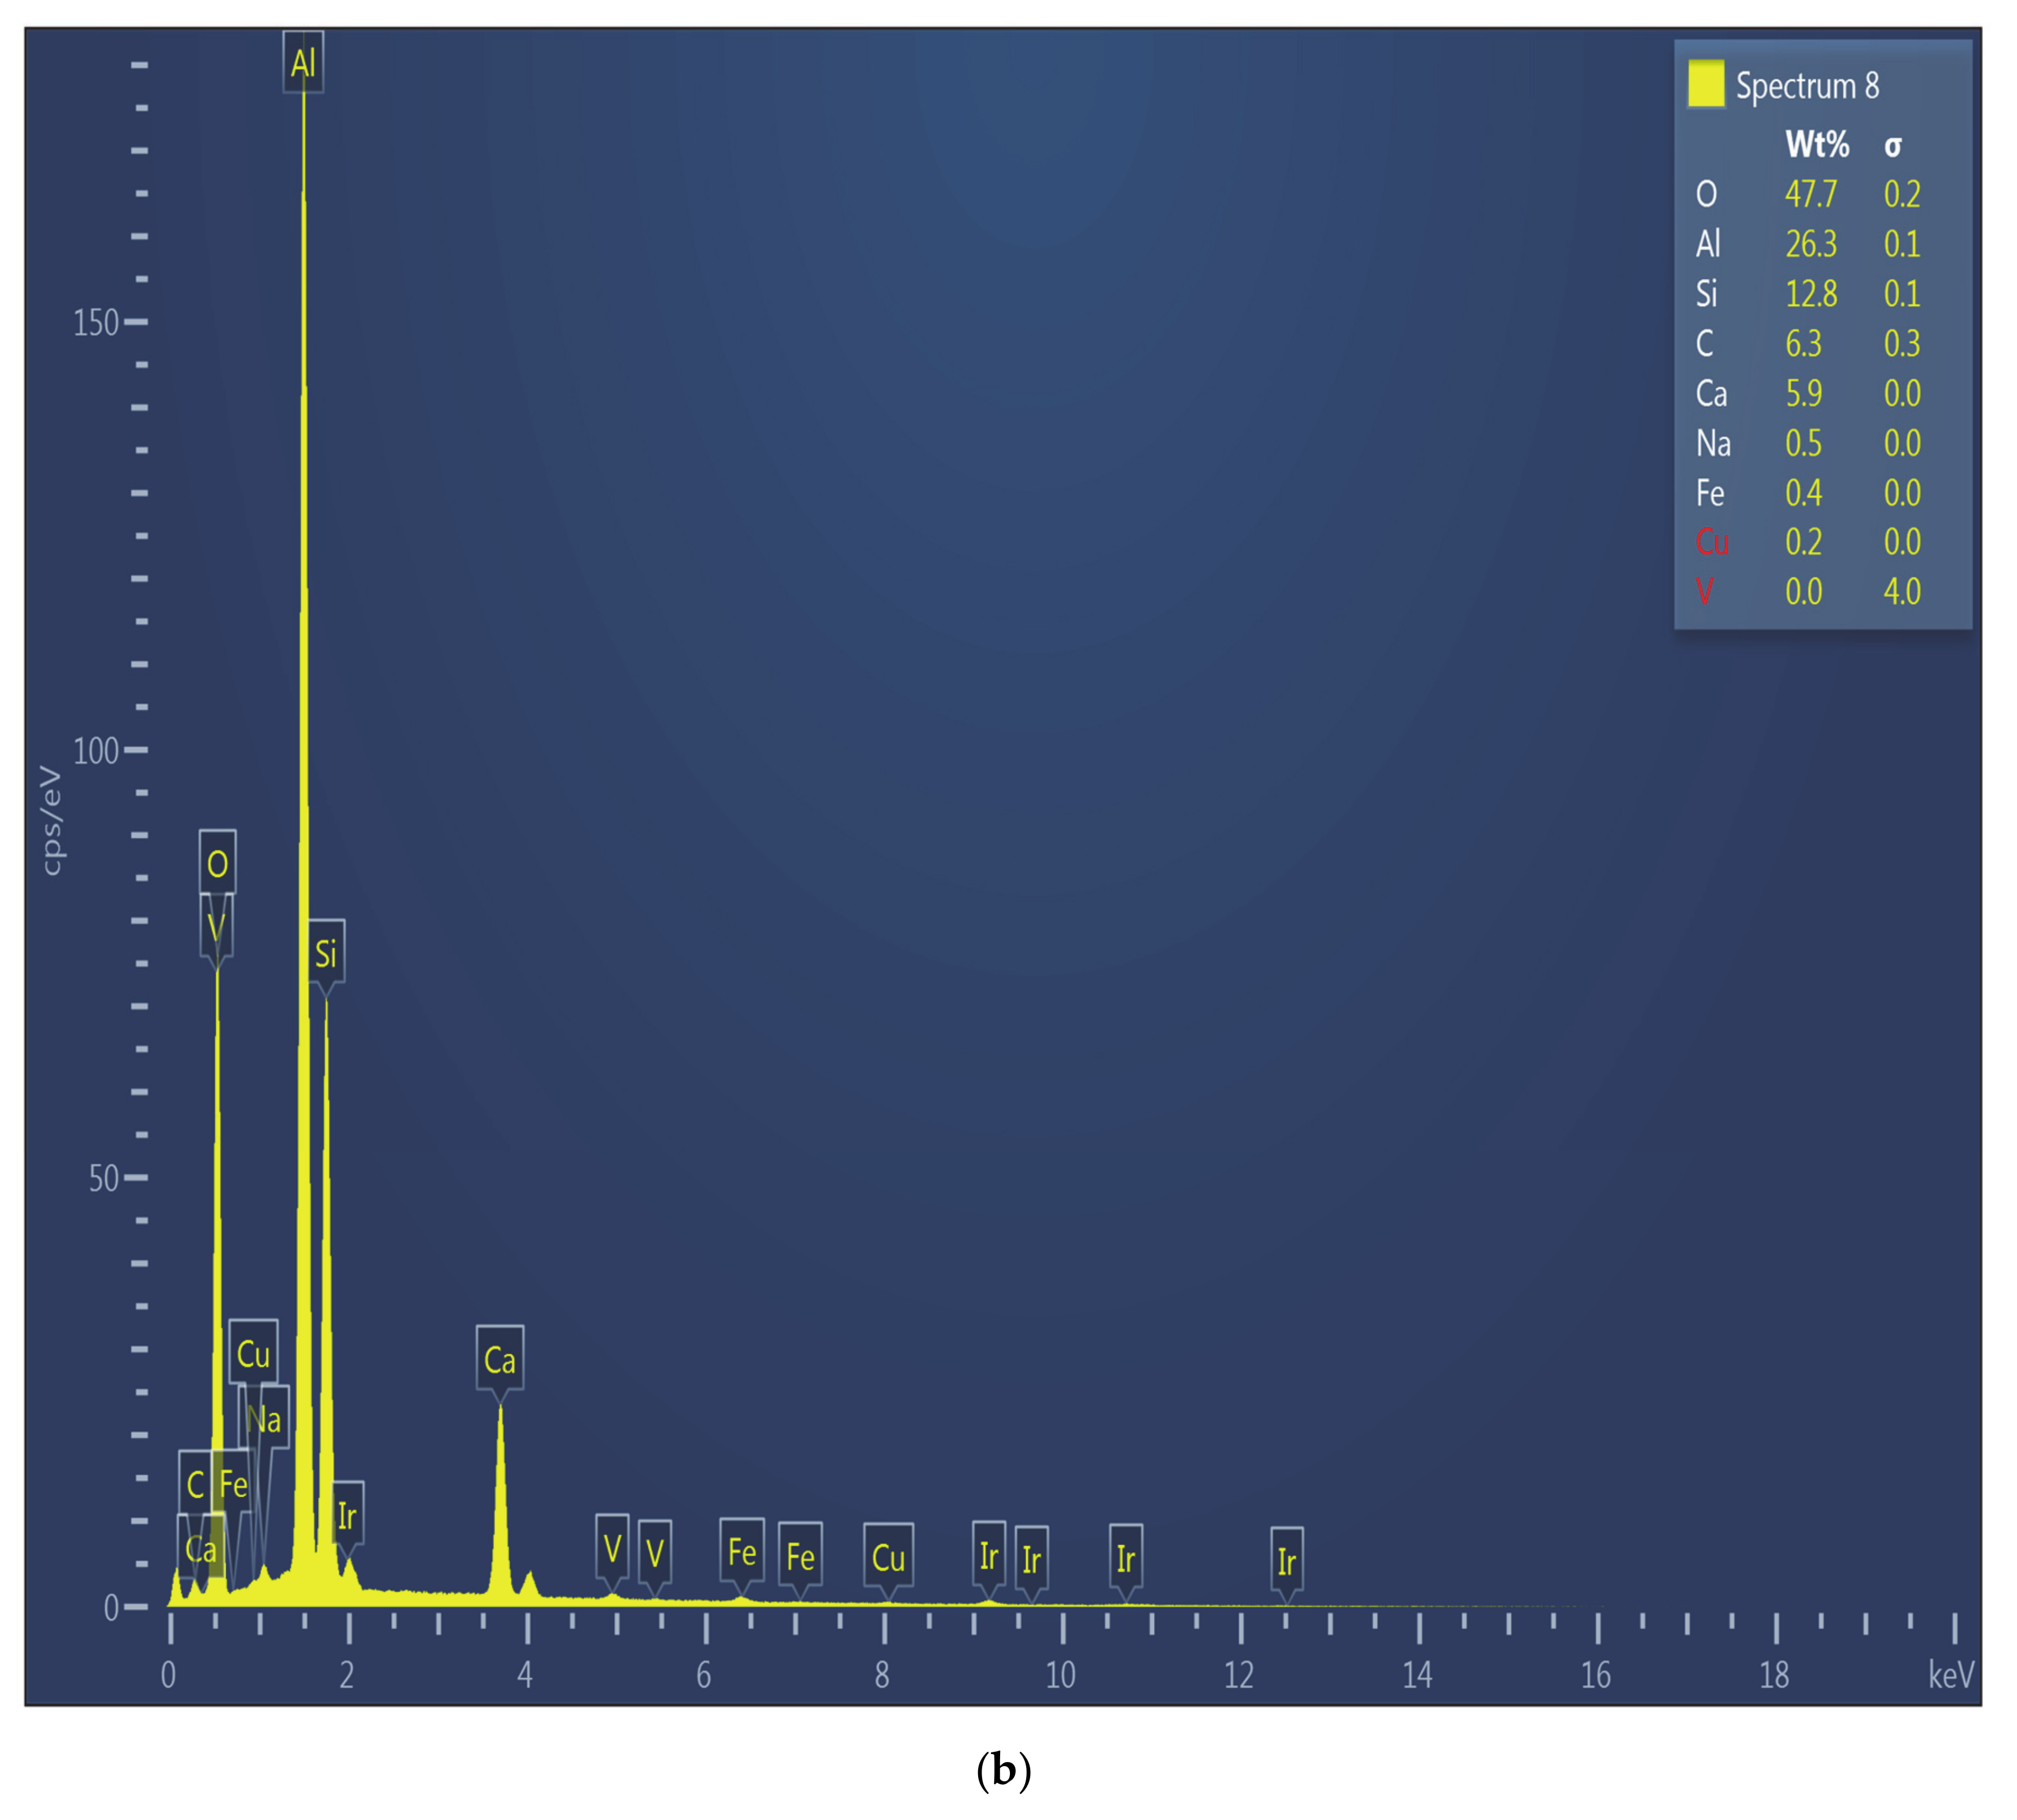
Figure 15 shows the SEM micrograph and EDS spectrum of Zone 1 in Test 6. The wall of the crucible was not involved in any significant interactions with the slag, evidenced by the absence of any interface/multi-component regions (SEM micrograph). Zone 1 composition of aluminum (EDS spectrum) by weight (26.3%) is almost the same as that of the slag composition.
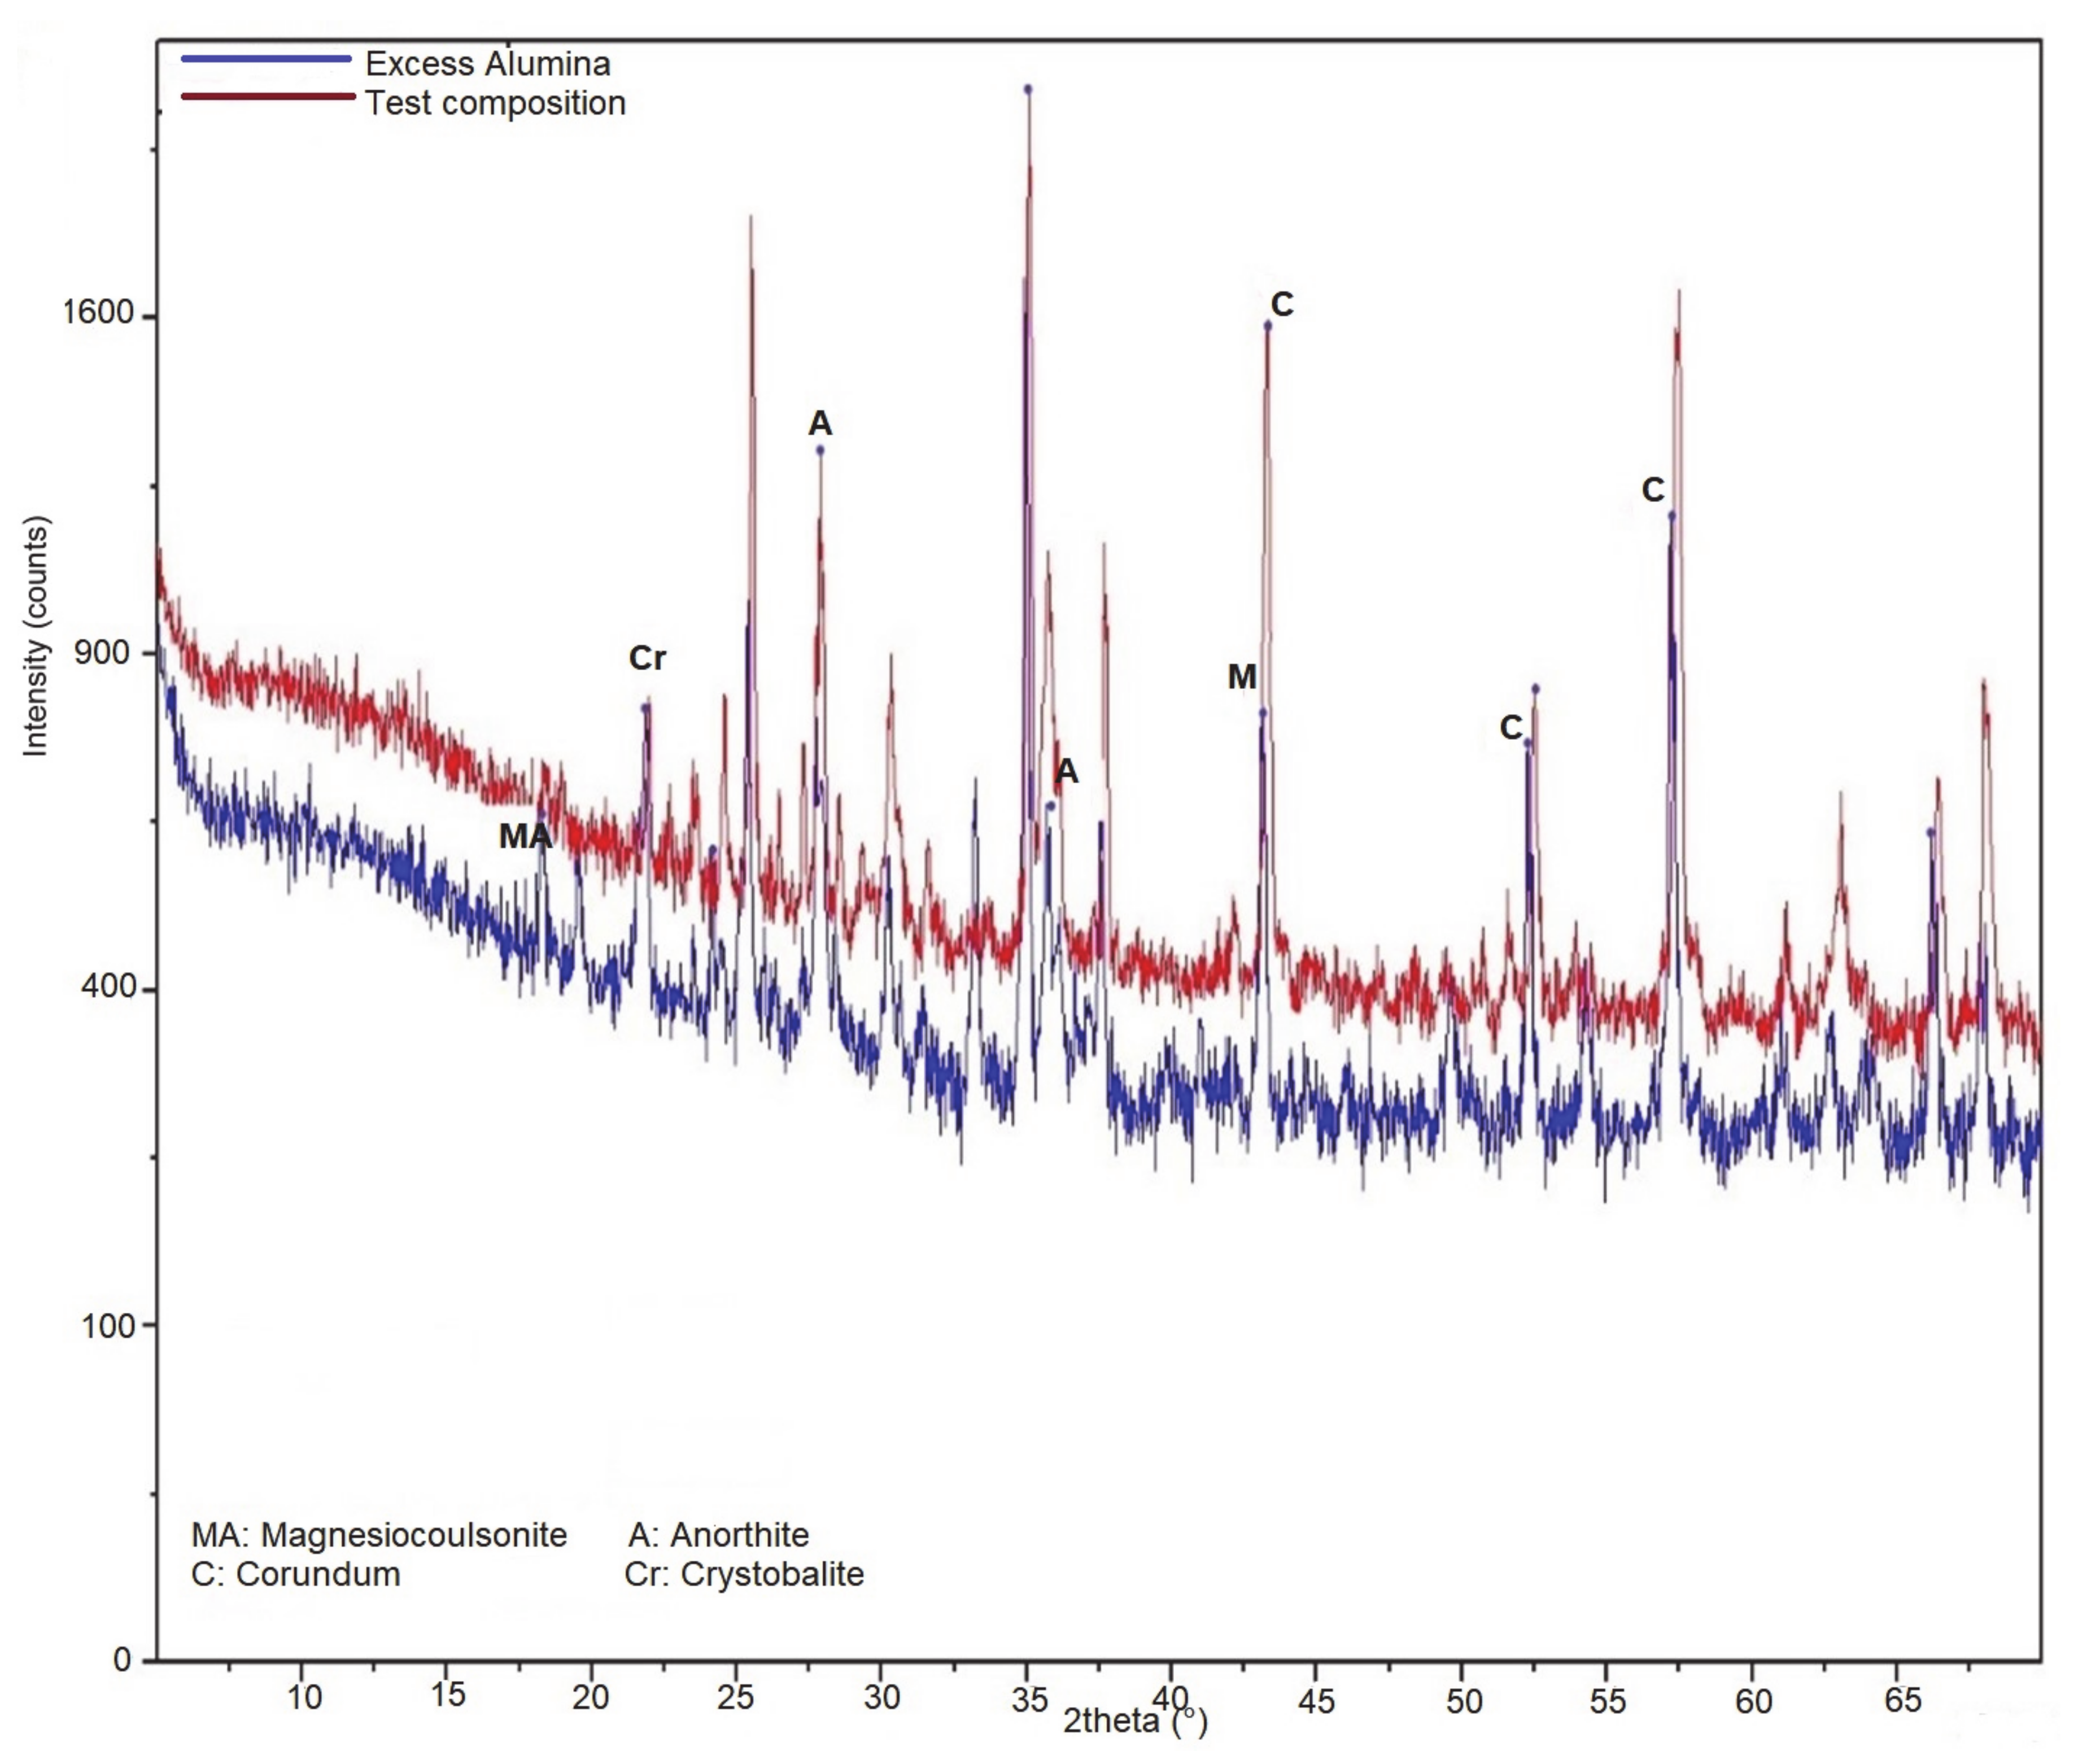
A comparison of XRD patterns of Test 4 and Test 6 (Figure 16 shows that the plots are quite similar but for the lack of a peak showing vanadium in Test 4 (red plot), while there is evidence of presence of vanadium compound in a phase similar to magnesiocoulsonite (MgV2O4) in Test 6. Since FeV2O4 and MgV2O4 crystals have similar structure and behave in similar ways under high temperatures and reducing atmosphere [19] and we had no Mg in the starting composition, it may be concluded that this product actually is FeV2O4 with Mg being replaced by Fe in the crystal structure. The lack of vanadium peaks in Test 4 could also be explained by the fact that most of the slag from Test 4 sample leaked out from the perforations in the crucible wall, thus depleting vanadium from the test sample.
From the discussion above, we can conclude that 69.5% CO/30.5% CO2 and 5% H2 atmospheres have a similar effect on the oxide mixture. No evidence of V2O3, and detection of anorthite on the XRD plot agrees with the prediction made by FactSage.
5. Conclusions
The reasons for dissolution of alumina from the crucible into the molten slags while measuring their viscosities were investigated. The slag composition was modeled using FactSage under different atmospheres and equilibrium amounts of alumina in the slag in the range 1050 °C–1650 °C. V2O5 was used in the initial synthetic ash mixture. XRD analysis of the slag sample revealed that vanadium exists as FeV2O4 and not as V2O3 at temperatures lower than 1450 °C. This conclusion was supported by the FactSage simulations. This finding also corroborates the results presented in our previous work [20]—it was shown that V2O5 in synthetic petcoke ash was reduced at pressures and CO atmospheres relevant to gasifier’s conditions. The FactSage results showed that among the four gases, dissolution of alumina from crucible into slag was highest in oxygen atmosphere.
SEM-EDS analysis of the slags showed that slags that are low in aluminum caused more dissolution of aluminum from the wall of the crucible. This was evident in the interface zone (Zone 2) elemental compositions in which aluminum in Tests 1 and 4 were about 15 and 1.6 times, respectively, their initial aluminum content in ash. Aluminum rich slags did not cause any identifiable changes in the composition. In the corresponding high alumina Tests 3 (21.65 wt. % more alumina than Test 1) and 6 (31.39 wt. % more alumina than Test 4), the aluminum content accumulation in Zone 2 was only 2.5 and 0.1 times their initial aluminum content in ash. Deficit in alumina content in the slags initially was compensated by extracting it from the wall to reach the thermodynamic equilibrium concentration of alumina in the slags.
It is thus suggested that slags with low alumina content in the ash would benefit by addition of alumina as fluxant during operation to minimize the dissolution from the crucible/reactor walls. The quantity of alumina to be added can be determined by simulation in FactSage. Excess alumina in a slag can cause an increase in its viscosity. This could lead to greater degradation of the refractory due to increased contact time with the hot slag. Thus, an optimum quantity of alumina should be added to the slag to mitigate refractory dissolution as well as minimizing the rise in viscosity.
Understanding the mechanism of refractory dissolution into slag would contribute to development of materials better suited for high-temperature applications, especially gasifier linings for improving the reliability of gasifiers which has been a challenge for this technology.
Author Contributions
K.K.—performed viscosity and other high temperature experiments, FactSage simulations, prepared samples for experiments, analyzed post-experiment samples, prepared manuscript draft; S.B.—conceived test matrix and performed a few of the initial experiments, provided viscometer training, assisted in FactSage, analyzed sample after experiments, performed FactSage calculations, edited manuscript; S.V.P.—conceived the presented idea, supervised experiments, supervised manuscript preparation. All authors have read and agreed to the published version of the manuscript.
Funding
This research received no external funding.
Institutional Review Board Statement
Not Applicable.
Informed Consent Statement
Not Applicable.
Conflicts of Interest
The authors declare no competing financial interest.
References
- Murthy, B.N.; Sawarkar, A.N.; Deshmukh, N.A.; Mathew, T.; Joshi, J.B. Petroleum coke gasification: A review. Can. J. Chem. Eng. 2014, 92, 441–468. [Google Scholar] [CrossRef]
- Ren, L.; Wei, R.; Gao, Y. Co-gasification reactivity of petcoke and coal at high temperature. Fuel 2017, 190, 245–252. [Google Scholar] [CrossRef]
- Browning, G.J.; Bryant, G.W.; Hurst, H.J.; Lucas, J.A.; Wall, T.F. An empirical method for the prediction of coal ash slag viscosity. Energy Fuels 2003, 17, 731–737. [Google Scholar] [CrossRef]
- Folkedahl, B.C.; Schobert, H.H. Effects of atmosphere on viscosity of selected bituminous and low-rank coal ash slags. Energy Fuels 2005, 19, 208–215. [Google Scholar] [CrossRef]
- Bennett, J.P.; Kwong, K.-S. Failure mechanisms in high chrome oxide gasifier refractories. Metall. Mat. Trans. A 2011, 42A, 888–904. [Google Scholar] [CrossRef] [Green Version]
- Ilyushechkin, A.Y.; Duchesne, M.A.; Hla, S.S.; Macchi, A.; Anthony, E.J. Interactions of vanadium-rich slags with crucible materials during viscosity measurements. J. Mater. Sci. 2013, 48, 1053–1066. [Google Scholar] [CrossRef]
- French, D.; Hurst, H.J.; Marvig, P. Comments on the use of molybdenum components for slag viscosity measurements. Fuel Process. Technol. 2001, 72, 215–225. [Google Scholar] [CrossRef]
- Jonayat, A.S.M.; Kramer, A.; Bignardi, L.; Lacovig, P.; Lizzit, S.; van Duin, A.C.T.; Batzill, M.; Janik, M.J. A first-principles study of stability of surface confined mixed metal oxides with corundum structure (Fe2O3, Cr2O3, V2O3). Phys. Chem. Chem. Phys. 2018, 20, 7073–7081. [Google Scholar] [CrossRef] [PubMed]
- Conn, R.E. Laboratory techniques for evaluating ash agglomeration potential in petroleum coke fired circulating fluidized bed combustors. Fuel Process. Technol. 1995, 44, 95–103. [Google Scholar] [CrossRef]
- Bryers, R.W. Utilization of petroleum coke and petroleum coke/coal blends as a means of steam raising. Fuel Process. Technol. 1995, 44, 121–141. [Google Scholar] [CrossRef]
- Vassilev, S.V.; Braekman-Danheux, C.; Moliner, R.; Suelves, I.; Lázaro, M.J.; Thiemann, T. Low cost catalytic sorbents for NOx reduction. 1. Preparation and characterization of coal char impregnated with model vanadium components and petroleum coke ash. Fuel 2002, 81, 1281–1296. [Google Scholar] [CrossRef]
- Duchesne, M.A. Slagging in Entrained Flow Gasifiers. Ph.D. Thesis, University of Ottawa, Ottawa, ON, Canada, 2012. [Google Scholar]
- Li, J.; Chen, X.; Liu, Y.; Xiong, Q.; Zhao, J.; Fang, Y. Effect of ash composition (Ca, Fe, and Ni) on petroleum coke ash fusibility. Energy Fuels 2017, 31, 6917–6927. [Google Scholar] [CrossRef]
- Li, J.; Zhao, J.; Dai, X.; Bai, J.; Fang, Y. Effect of vanadium on the petroleum coke ash fusibility. Energy Fuels 2017, 31, 2530–2537. [Google Scholar] [CrossRef]
- Li, J.; Xiong, Q.; Shan, J.; Zhao, J.; Fang, Y. Investigating a high vanadium petroleum coke ash fusibility and its modification. Fuel 2018, 211, 767–774. [Google Scholar] [CrossRef]
- Li, J.; Zhao, J.; Fang, H.; Liu, T.; Zhang, L.; Fang, Y. Transformation behavior of vanadium in petroleum coke during high temperature CO2-gasification. Fuel 2017, 194, 83–90. [Google Scholar] [CrossRef]
- Li, J.; Wang, X.; Wang, B.; Zhao, J.; Fang, Y. Investigation on the fates of vanadium and nickel during co-gasification of petroleum coke with biomass. Bioresour. Technol. 2018, 257, 47–53. [Google Scholar] [CrossRef] [PubMed]
- Xiong, Q.A.; Li, J.; Guo, S.; Li, G.; Zhao, J.; Fang, Y. Ash fusion characteristics during co-gasification of biomass and petroleum coke. Bioresour. Technol. 2018, 257, 1–6. [Google Scholar] [CrossRef] [PubMed]
- Ishii, T.; Sakai, T.; Kojitani, H.; Mori, D.; Inaguma, Y.; Matsushita, Y.; Yamaura, K.; Akaogi, M. High-pressure phase relations and crystal structures of postspinel phases in MgV2O4, FeV2O4, and MnCr2O4: Crystal chemistry of AB2O4 postspinel compounds. Inorg. Chem. 2018, 57, 6648–6657. [Google Scholar] [CrossRef] [PubMed]
- Banik, S.; Pisupati, S.V. Effects of pressure and CO concentration on vanadium, nickel and iron phase transformations for petcoke slag viscosity correlation development. Fuel 2019, 253, 238–248. [Google Scholar] [CrossRef]
Figure 1.
Schematic of the viscometer setup.

Figure 2.
Test 1 perforations on alumina crucible (a), loss of wall material (b).

Figure 3.
(a) SEM micrograph and (b) EDS pattern at a location close to the perforation (Test 1).

Figure 4.
(a) SEM micrograph and (b) EDS pattern of crucible bottom (Test 1).


Figure 5.
(a) SEM micrograph and (b) EDS pattern close to the perforation (Test 1).


Figure 6.
Crucible-slag interaction zones.

Figure 7.
Weight percentages of aluminum in the three crucible-slag interaction zones in (a) tests 1 and 4, (b) tests 2 and 5, and (c) tests 3 and 6.
Figure 7.
Weight percentages of aluminum in the three crucible-slag interaction zones in (a) tests 1 and 4, (b) tests 2 and 5, and (c) tests 3 and 6.

Figure 8.
FactSage simulation of Test 1 slag. (a) Test 1 in 69.5% CO/CO2; (b) Test 1 in O2; (c) Test 1 in H2; (d) Test 1 in 5% H2/N2.
Figure 8.
FactSage simulation of Test 1 slag. (a) Test 1 in 69.5% CO/CO2; (b) Test 1 in O2; (c) Test 1 in H2; (d) Test 1 in 5% H2/N2.

Figure 9.
FactSage simulation of high alumina slag. (a) High Al2O3 in 69.5% CO/CO2; (b) High Al2O3 in O2; (c) High Al2O3 in H2; (d) High Al2O3 in 5% H2/N2.
Figure 9.
FactSage simulation of high alumina slag. (a) High Al2O3 in 69.5% CO/CO2; (b) High Al2O3 in O2; (c) High Al2O3 in H2; (d) High Al2O3 in 5% H2/N2.

Figure 10.
FactSage simulation of slag with no alumina. (a) Without Al2O3 in 69.5% CO/CO2; (b) Without Al2O3 in O2; (c) Without Al2O3 in H2; (d) Without Al2O3 in 5% H2/N2.
Figure 10.
FactSage simulation of slag with no alumina. (a) Without Al2O3 in 69.5% CO/CO2; (b) Without Al2O3 in O2; (c) Without Al2O3 in H2; (d) Without Al2O3 in 5% H2/N2.

Figure 11.
FactSage simulation of slag with no alumina/vanadium. (a) Without Al2O3/V in 69.5% CO/CO2; (b) Without Al2O3/V in O2; (c) Without Al2O3/V in H2; (d) Without Al2O3/V in 5% H2/N2.
Figure 11.
FactSage simulation of slag with no alumina/vanadium. (a) Without Al2O3/V in 69.5% CO/CO2; (b) Without Al2O3/V in O2; (c) Without Al2O3/V in H2; (d) Without Al2O3/V in 5% H2/N2.

Figure 12.
FactSage simulation of Calibration test.

Figure 13.
FactSage simulation of test 2 and test 5 compositions. (a) Test 2 in 5% H2/95% N2; (b) Test 2 in 69.5% CO/CO2; (c) Test 2 in H2; (d) Test 2 in O2; (e) Test 5 in 5% H2/95% N2; (f) Test 5 in 69.5% CO/CO2; (g) Test 5 in H2; (h) Test 5 in O2.
Figure 13.
FactSage simulation of test 2 and test 5 compositions. (a) Test 2 in 5% H2/95% N2; (b) Test 2 in 69.5% CO/CO2; (c) Test 2 in H2; (d) Test 2 in O2; (e) Test 5 in 5% H2/95% N2; (f) Test 5 in 69.5% CO/CO2; (g) Test 5 in H2; (h) Test 5 in O2.


Figure 14.
FactSage simulation of test 7 and test 8 compositions. (a) Test 7 in 5% H2/95% N2; (b) Test 7 in 69.5% CO/CO2; (c) Test 7 in H2; (d) Test 7 in O2; (e) Test 8 in 5% H2/95% N2; (f) Test 8 in 69.5% CO/CO2; (g) Test 8 in H2; (h) Test 8 in O2.
Figure 14.
FactSage simulation of test 7 and test 8 compositions. (a) Test 7 in 5% H2/95% N2; (b) Test 7 in 69.5% CO/CO2; (c) Test 7 in H2; (d) Test 7 in O2; (e) Test 8 in 5% H2/95% N2; (f) Test 8 in 69.5% CO/CO2; (g) Test 8 in H2; (h) Test 8 in O2.


Figure 15.
(a) SEM micrograph and (b) EDS pattern of Zone 1 (Test 6).


Figure 16.
XRD plots for Test 4 and Test 6.


Table 1.
Test oxide compositions (in wt. %).
| Test No. | SiO2 | Al2O3 | Fe2O3 | CaO | NiO | V2O5 | Total |
|---|---|---|---|---|---|---|---|
| Calibration (C) | 43.41 | 14.82 | 9.41 | 4.13 | 2.68 | 20.69 | 95.14 * |
| 1 | 14.57 | 4.96 | 7.43 | 5.57 | 3.09 | 64.39 | 100.00 |
| 2 | 40.87 | 13.91 | 20.87 | 15.65 | 8.70 | 0.00 | 100.00 |
| 3 | 11.22 | 26.61 | 5.74 | 4.30 | 2.39 | 49.74 | 100.00 |
| 4 | 24.57 | 9.78 | 32.87 | 9.26 | 3.00 | 20.48 | 99.96 |
| 5 | 30.57 | 12.17 | 40.91 | 11.52 | 3.74 | 0.00 | 98.91 |
| 6 | 16.00 | 41.17 | 21.43 | 6.04 | 1.96 | 13.39 | 99.99 |
| 7 | 40.87 | 13.91 | 20.87 | 15.65 | 0.00 | 8.70 | 100.00 |
| 8 | 30.57 | 12.17 | 40.91 | 11.52 | 0.00 | 3.74 | 98.91 |
* P2 sample from Duchesne [12] has additional compounds that were added to the oxide mixture but have not been shown here.
Table 2.
SEM-EDS compositions obtained from experiments (in wt. %).
| Initial Slag Composition | Zone 1 | Zone 2 | Zone 3 | Initial Slag Composition | Zone 1 | Zone 2 | Zone 3 | ||||
|---|---|---|---|---|---|---|---|---|---|---|---|
| Test 1 | Al | 2.63 | 24.40 | 40.49 | 0.56 | Test 4 | Al | 5.18 | 40.84 | 8.24 | 8.43 |
| V | 36.06 | 15.51 | 11.61 | 56.20 | V | 11.47 | 2.49 | 10.45 | 16.95 | ||
| Fe | 5.20 | 3.19 | 0.61 | 1.23 | Fe | 23.01 | 6.44 | 22.99 | 12.95 | ||
| Si | 6.85 | 2.07 | 0.50 | 2.39 | Si | 11.55 | 2.09 | 14.61 | 11.38 | ||
| Ca | 3.95 | 1.46 | 0.93 | 9.06 | Ca | 6.57 | 0.47 | 5.75 | 7.70 | ||
| Ni | 2.41 | 1.17 | 0.28 | 0.67 | Ni | 2.34 | 0.25 | 1.48 | 1.13 | ||
| O | 42.91 | 52.21 | 45.59 | 29.90 | O | 39.84 | 47.38 | 36.43 | 41.43 | ||
| Total | 100.01 | 100.01 | 100.01 | 100.01 | Total | 99.96 | 99.96 | 99.96 | 99.96 | ||
| Test 2 (no V) | Al | 7.37 | 41.96 | 16.77 | 10.79 | Test 5 (no V) | Al | 6.45 | 13.99 | 12.25 | 13.92 |
| V | 0.00 | 0.00 | 0.00 | 0.00 | V | 0.00 | 0.00 | 0.00 | 0.00 | ||
| Fe | 14.61 | 1.94 | 12.16 | 5.30 | Fe | 28.64 | 29.16 | 16.95 | 14.41 | ||
| Si | 19.21 | 2.75 | 11.10 | 21.17 | Si | 14.37 | 7.07 | 15.49 | 13.11 | ||
| Ca | 11.11 | 1.64 | 6.81 | 10.83 | Ca | 8.18 | 2.95 | 6.69 | 6.74 | ||
| Ni | 6.79 | 0.17 | 10.72 | 1.46 | Ni | 2.92 | 5.98 | 1.09 | 2.25 | ||
| O | 40.91 | 51.53 | 42.44 | 50.44 | O | 38.36 | 39.76 | 46.45 | 48.47 | ||
| Total | 100.00 | 100.00 | 100.00 | 100.00 | Total | 98.91 | 98.91 | 98.91 | 98.91 | ||
| Test 3 (excess Al) | Al | 14.10 | 40.15 | 35.67 | 27.33 | Test 6 (excess Al) | Al | 21.82 | 28.25 | 2.66 | |
| V | 49.74 | 6.19 | 9.07 | 7.43 | V | 7.50 | 0.00 | 0.00 | |||
| Fe | 4.02 | 0.96 | 4.65 | 6.77 | Fe | 15.00 | 0.43 | 0.00 | |||
| Si | 5.27 | 0.32 | 2.72 | 3.78 | Si | 7.52 | 13.75 | 5.12 | |||
| Ca | 3.05 | 0.50 | 0.50 | 0.38 | Ca | 4.29 | 6.34 | 0.41 | |||
| Ni | 1.86 | 0.82 | 1.04 | 1.26 | Ni | 1.53 | 0.00 | 0.00 | |||
| O | 21.95 | 51.06 | 46.36 | 53.06 | O | 42.33 | 51.23 | 91.80 | |||
| Total | 100.00 | 100.00 | 100.00 | 100.00 | Total | 99.99 | 99.99 | 99.99 |
Publisher’s Note: MDPI stays neutral with regard to jurisdictional claims in published maps and institutional affiliations. |
© 2021 by the authors. Licensee MDPI, Basel, Switzerland. This article is an open access article distributed under the terms and conditions of the Creative Commons Attribution (CC BY) license (http://creativecommons.org/licenses/by/4.0/).
Share and Cite
MDPI and ACS Style
Karri, K.; Banik, S.; Pisupati, S.V. A FactsSage Simulation Study on the Interaction of Synthetic Petcoke Slags with Alumina Crucibles. Fuels 2021, 2, 48-70. https://0-doi-org.brum.beds.ac.uk/10.3390/fuels2010004
AMA Style
Karri K, Banik S, Pisupati SV. A FactsSage Simulation Study on the Interaction of Synthetic Petcoke Slags with Alumina Crucibles. Fuels. 2021; 2(1):48-70. https://0-doi-org.brum.beds.ac.uk/10.3390/fuels2010004
Chicago/Turabian StyleKarri, Kashyap, Shubhadeep Banik, and Sarma V. Pisupati. 2021. "A FactsSage Simulation Study on the Interaction of Synthetic Petcoke Slags with Alumina Crucibles" Fuels 2, no. 1: 48-70. https://0-doi-org.brum.beds.ac.uk/10.3390/fuels2010004